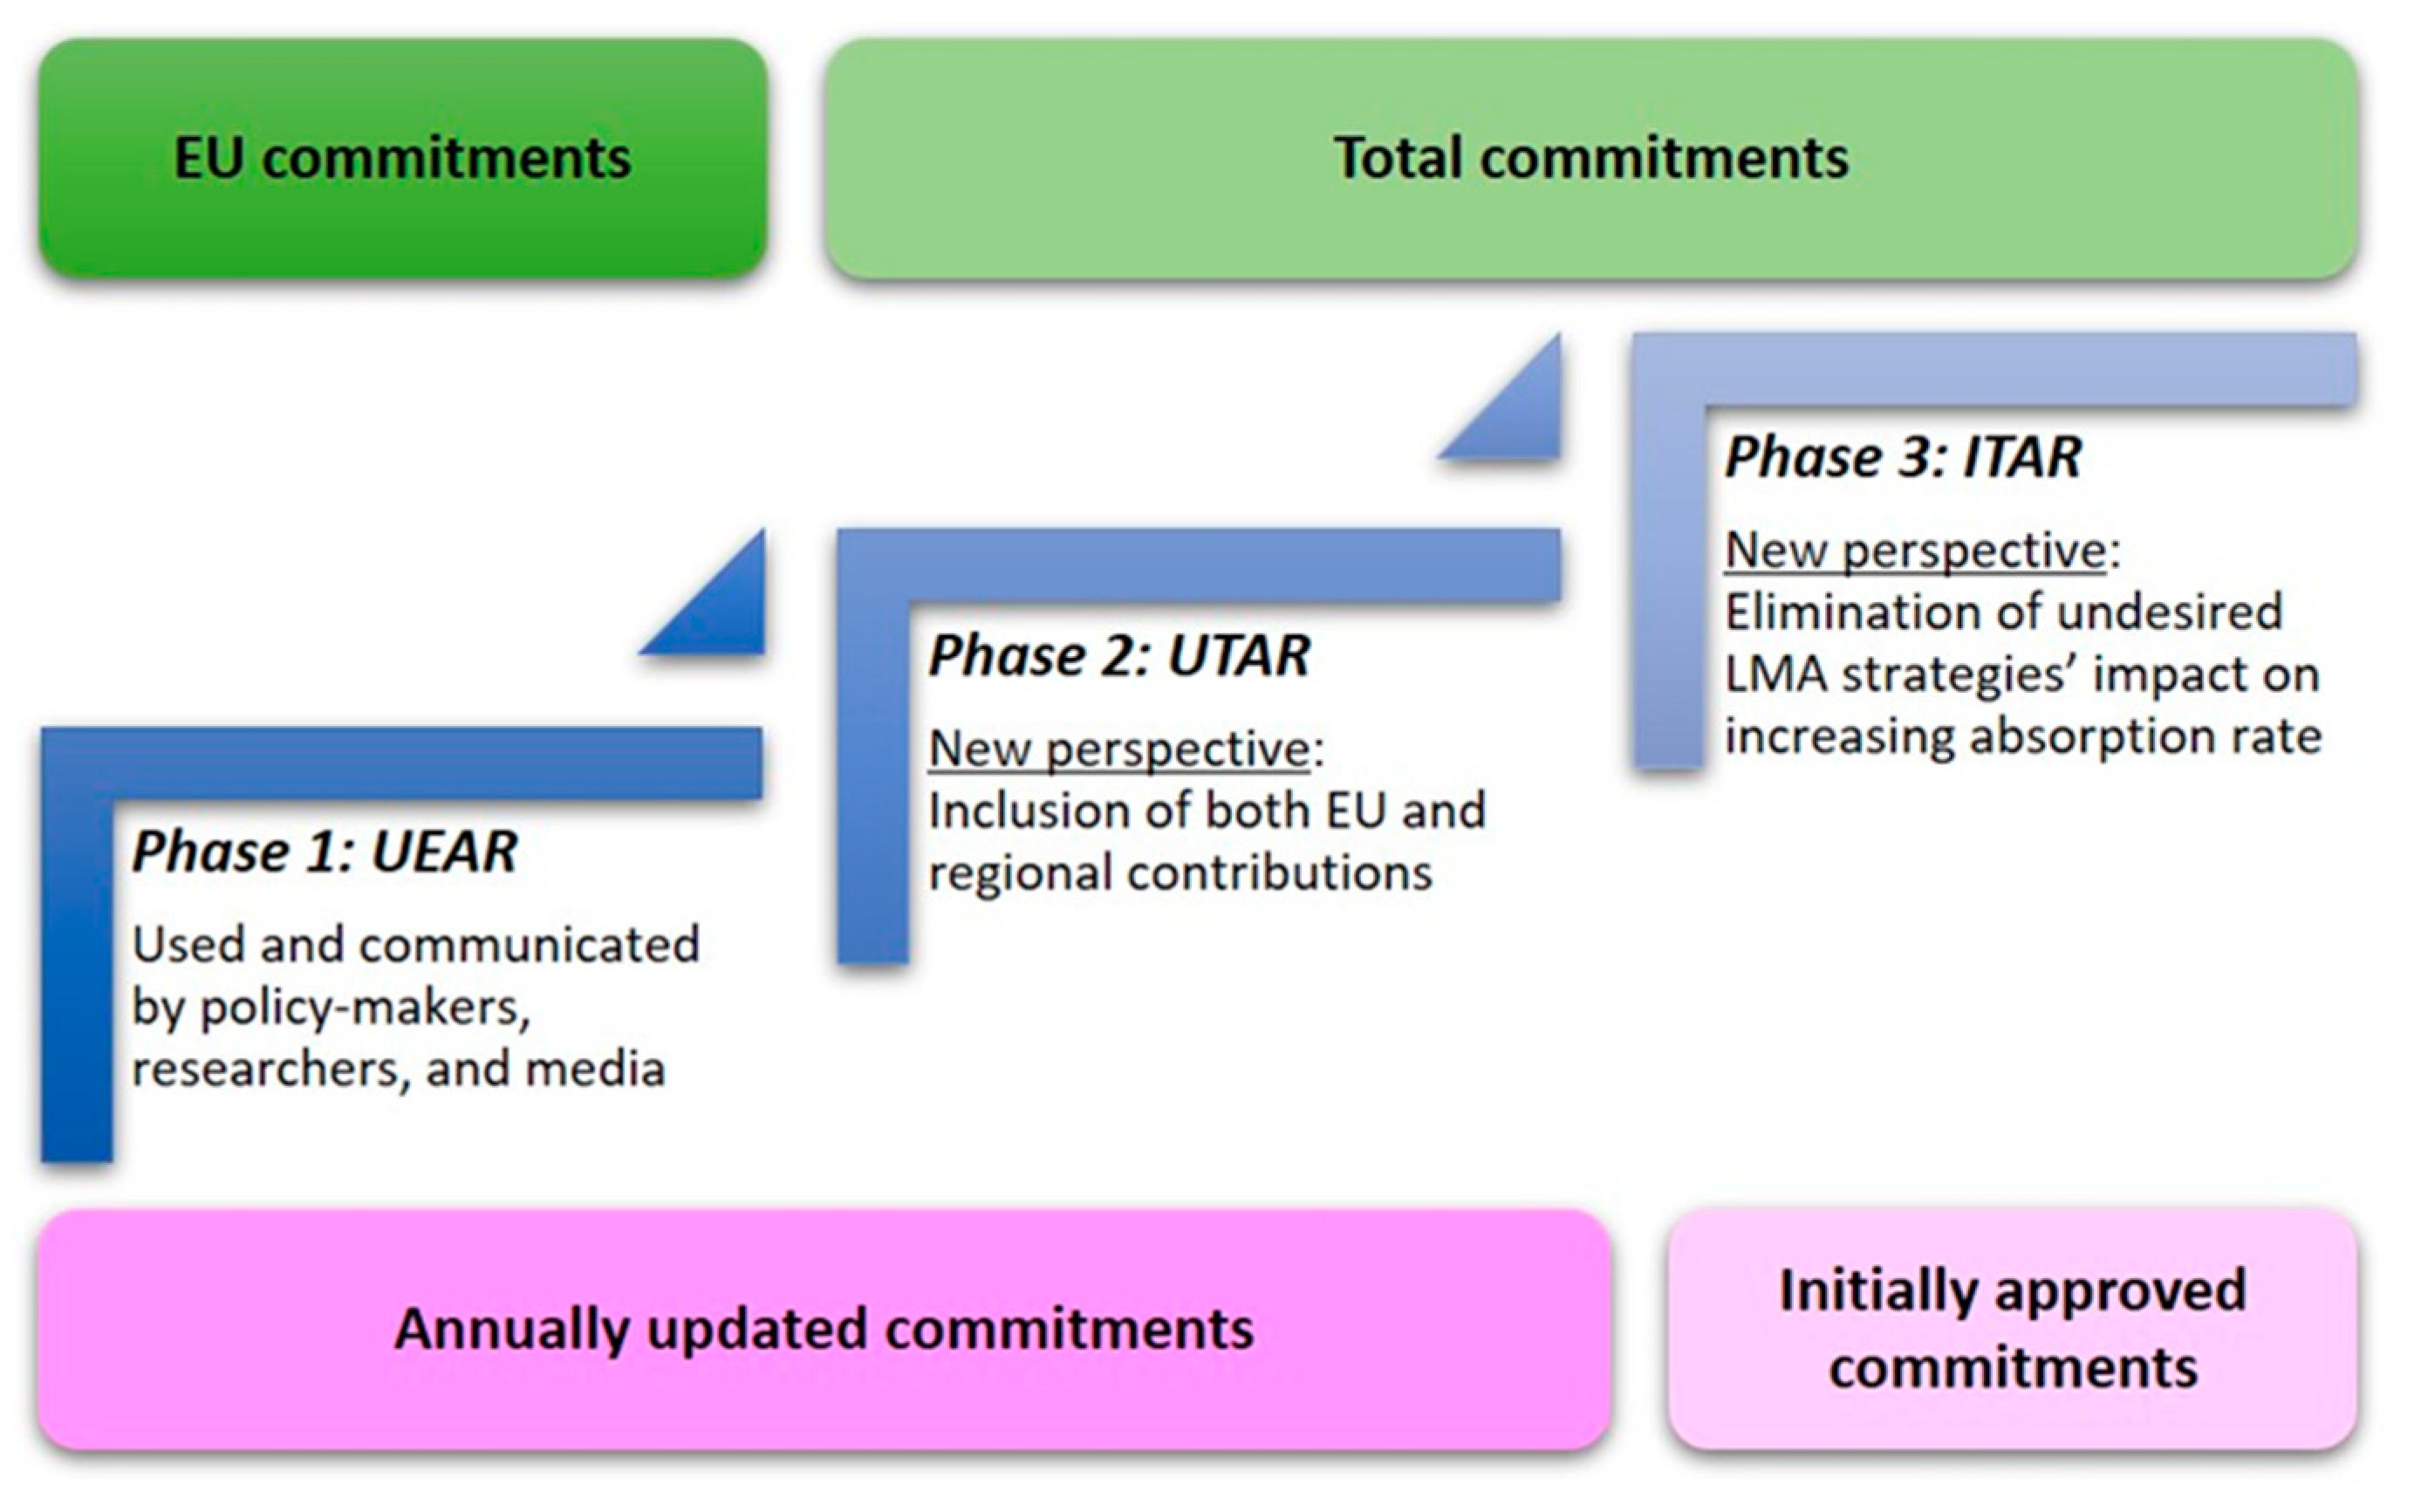
According to the expenditure analysis, the actual LMA performance exhibits complex dynamics that cannot be evaluated through a point-in-time indicator at the end of the policy cycle that reflects only the EU share of contribution. Thus, we propose a new absorption rate that allows for a longitudinal evaluation of the regional performance that could showcase possible undesired LMA strategies. We develop a step-by-step framework, including three phases:
4.2. Comparison between Updated and Initial Total Absorption Rates
According to the analysis performed, we advocate that the calculation of UTAR could offer a more comprehensive view of both EU and regional expenditure. However, this approach still impedes the understanding of the actual regional performance due to the variations in the total commitments. Consequently, we propose the development of ITAR based on the initial commitments approved at the beginning of the programming period by the EU and the LMA. This new approach allows for the elimination of the effect of the EU decommitments and/or the co-finance reduction, which entail the paradox of increasing the final absorption percentage and supposedly improving performance by subtracting allocated resources.
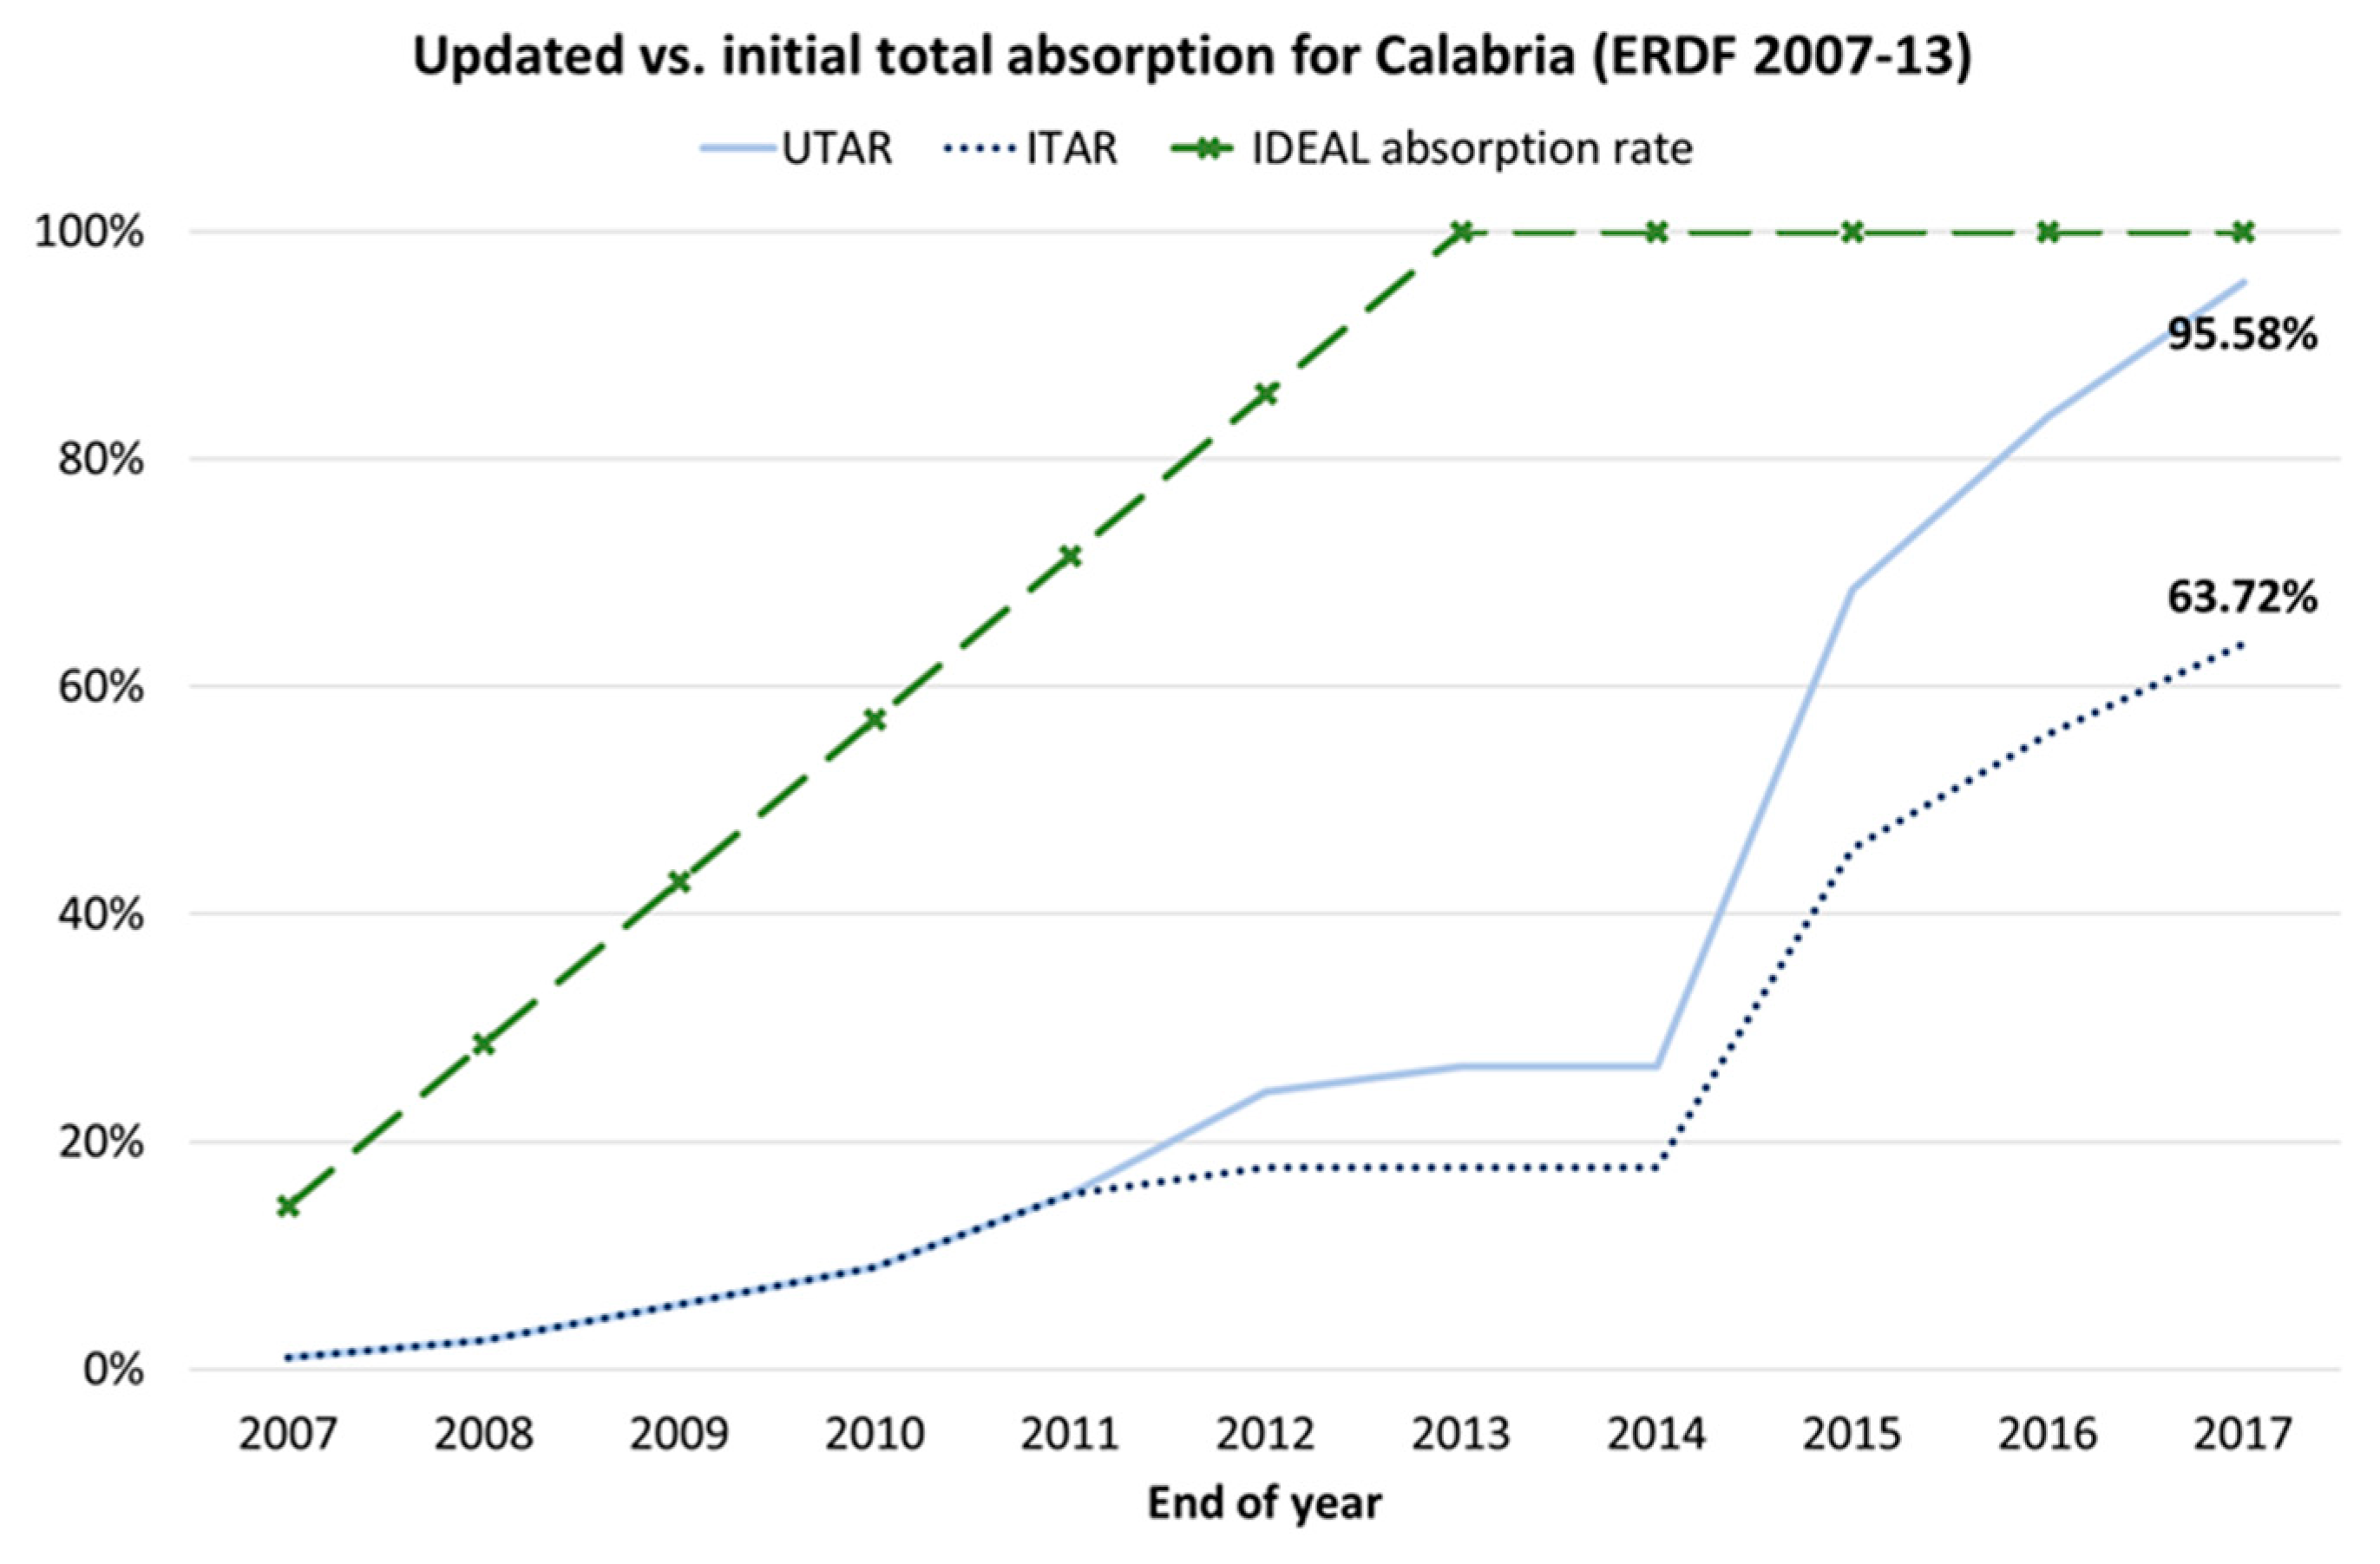
Figure 11 presents the UTAR and ITAR indicators for the ERDF funds during the policy cycle 2007–2013 in Calabria.
Figure 11,
Figure 12,
Figure 13 and
Figure 14 further illustrate the ideal proportional absorption rate that will be used in the statistical analysis in
Section 4.3. Obviously, at the beginning of the period, both rates are equal as they are calculated based on the initial commitments before the reduction of regional co-finance. At the end of the cycle, ITAR is much lower compared to UTAR, which is now calculated based on the reduced total commitments (thus reaching a sufficient 95.6%) due to the decrease in regional co-finance. In fact, the ITAR equals 63.7%, highlighting that the actual absorption of the initially approved commitments is rather low. Therefore, the lower regional performance compared to the initial expectations is evident, probably due to the LMA’s administrative and/or managerial incapacity of absorbing funds (
Milio 2007;
Zaman and Georgescu 2009;
Aiello et al. 2019). This low absorption efficiency indicates the reduced SFs’ spending, impeding actual regional growth.
Figure 12 shows the UTAR and ITAR indicators for the ESF funds during the policy cycle 2007–2013 in Calabria. At the end of the cycle, ITAR (50%) is lower compared to UTAR (75%), as in the ERDF case. In fact, although UTAR is already insufficient, the even lower ITAR sheds light on the inadequate LMA performance in terms of funds’ absorption.
Figure 13 portrays the UTAR and ITAR indicators for the ERDF funds during 2007–2013 in Emilia Romagna. In contrast to Calabria, considering the increase of the initial commitments due to the natural disaster, ITAR at the end of the cycle is higher compared to UTAR, which reaches the optimal level of 100%. Thus, the final ITAR equals 110.5%, as the initial commitments are less than the finally allocated ones.
Figure 14 depicts the UTAR and ITAR indicators for the total ESF funds during 2007–2013 in Emilia Romagna. Once again, following the increase of the initial commitments due to the earthquake, ITAR at the end of the cycle (103%) is higher than UTAR (98%). Obviously, as the final accumulated payments are greater than the initial total commitments, ITAR is more than 100%.
Notably, these indicators can be further filtered. In fact, the absorption rate considers also so-called ‘retrospective’ projects. According to the
European Court of Auditors (
2018, p. 5), “retrospective projects or operations are those which have incurred expenditure from national sources or are completed before EU co-financing has been formally applied for or awarded, i.e., they are financed retrospectively”. They are used in extreme cases by the LMAs to increase expenditure and improve absorption when deadlines become closer and funding cuts (i.e., EU decommitments) may occur. Therefore, these projects reflect the low performance of an LMA, which was unable to absorb the EU funds under the normal procedure.
EU regulations do not explicitly prohibit retrospective projects. However, “in the 2014–2020 program period, projects or operations that are physically completed or fully implemented before the beneficiary applies for funding are not eligible for EU funding” (
European Court of Auditors 2018, p. 5). The member states are not obliged to provide reports on expenditure declared retrospectively (
European Court of Auditors 2018). As a result, the EU is unaware of the volume and the financial impact of these projects; however, it highlights the risks of missing the added value of EU financial support and creating a deadweight, since these projects could have been implemented even without EU funding. Thus, the retrospective projects may limit the CP economic benefits by violating the additionality principle based on which the EU funds should not replace national or local expenditure (
Tosun 2014). Interestingly, the resources previously allocated to retrospective projects could potentially be available for financing projects under non-EU frameworks. However, there is no evidence that these ‘released’ resources are reused (
Gandolfo 2014); in case an LMA is unable to absorb the SFs without retrospective projects, it is unlikely to be capable of spending the released resources in new projects.
In this context, we could distinguish the gross (currently used) and net absorption rates, namely in the case that retrospective projects are accounted and eliminated, respectively. Although regions do not provide official information about retrospective projects, the Italian Court of Audit states that on average 44% (longitudinal data are missing) of the total expenditure of the ERDF scheme in Calabria during 2007–2013 comprised retrospective projects (
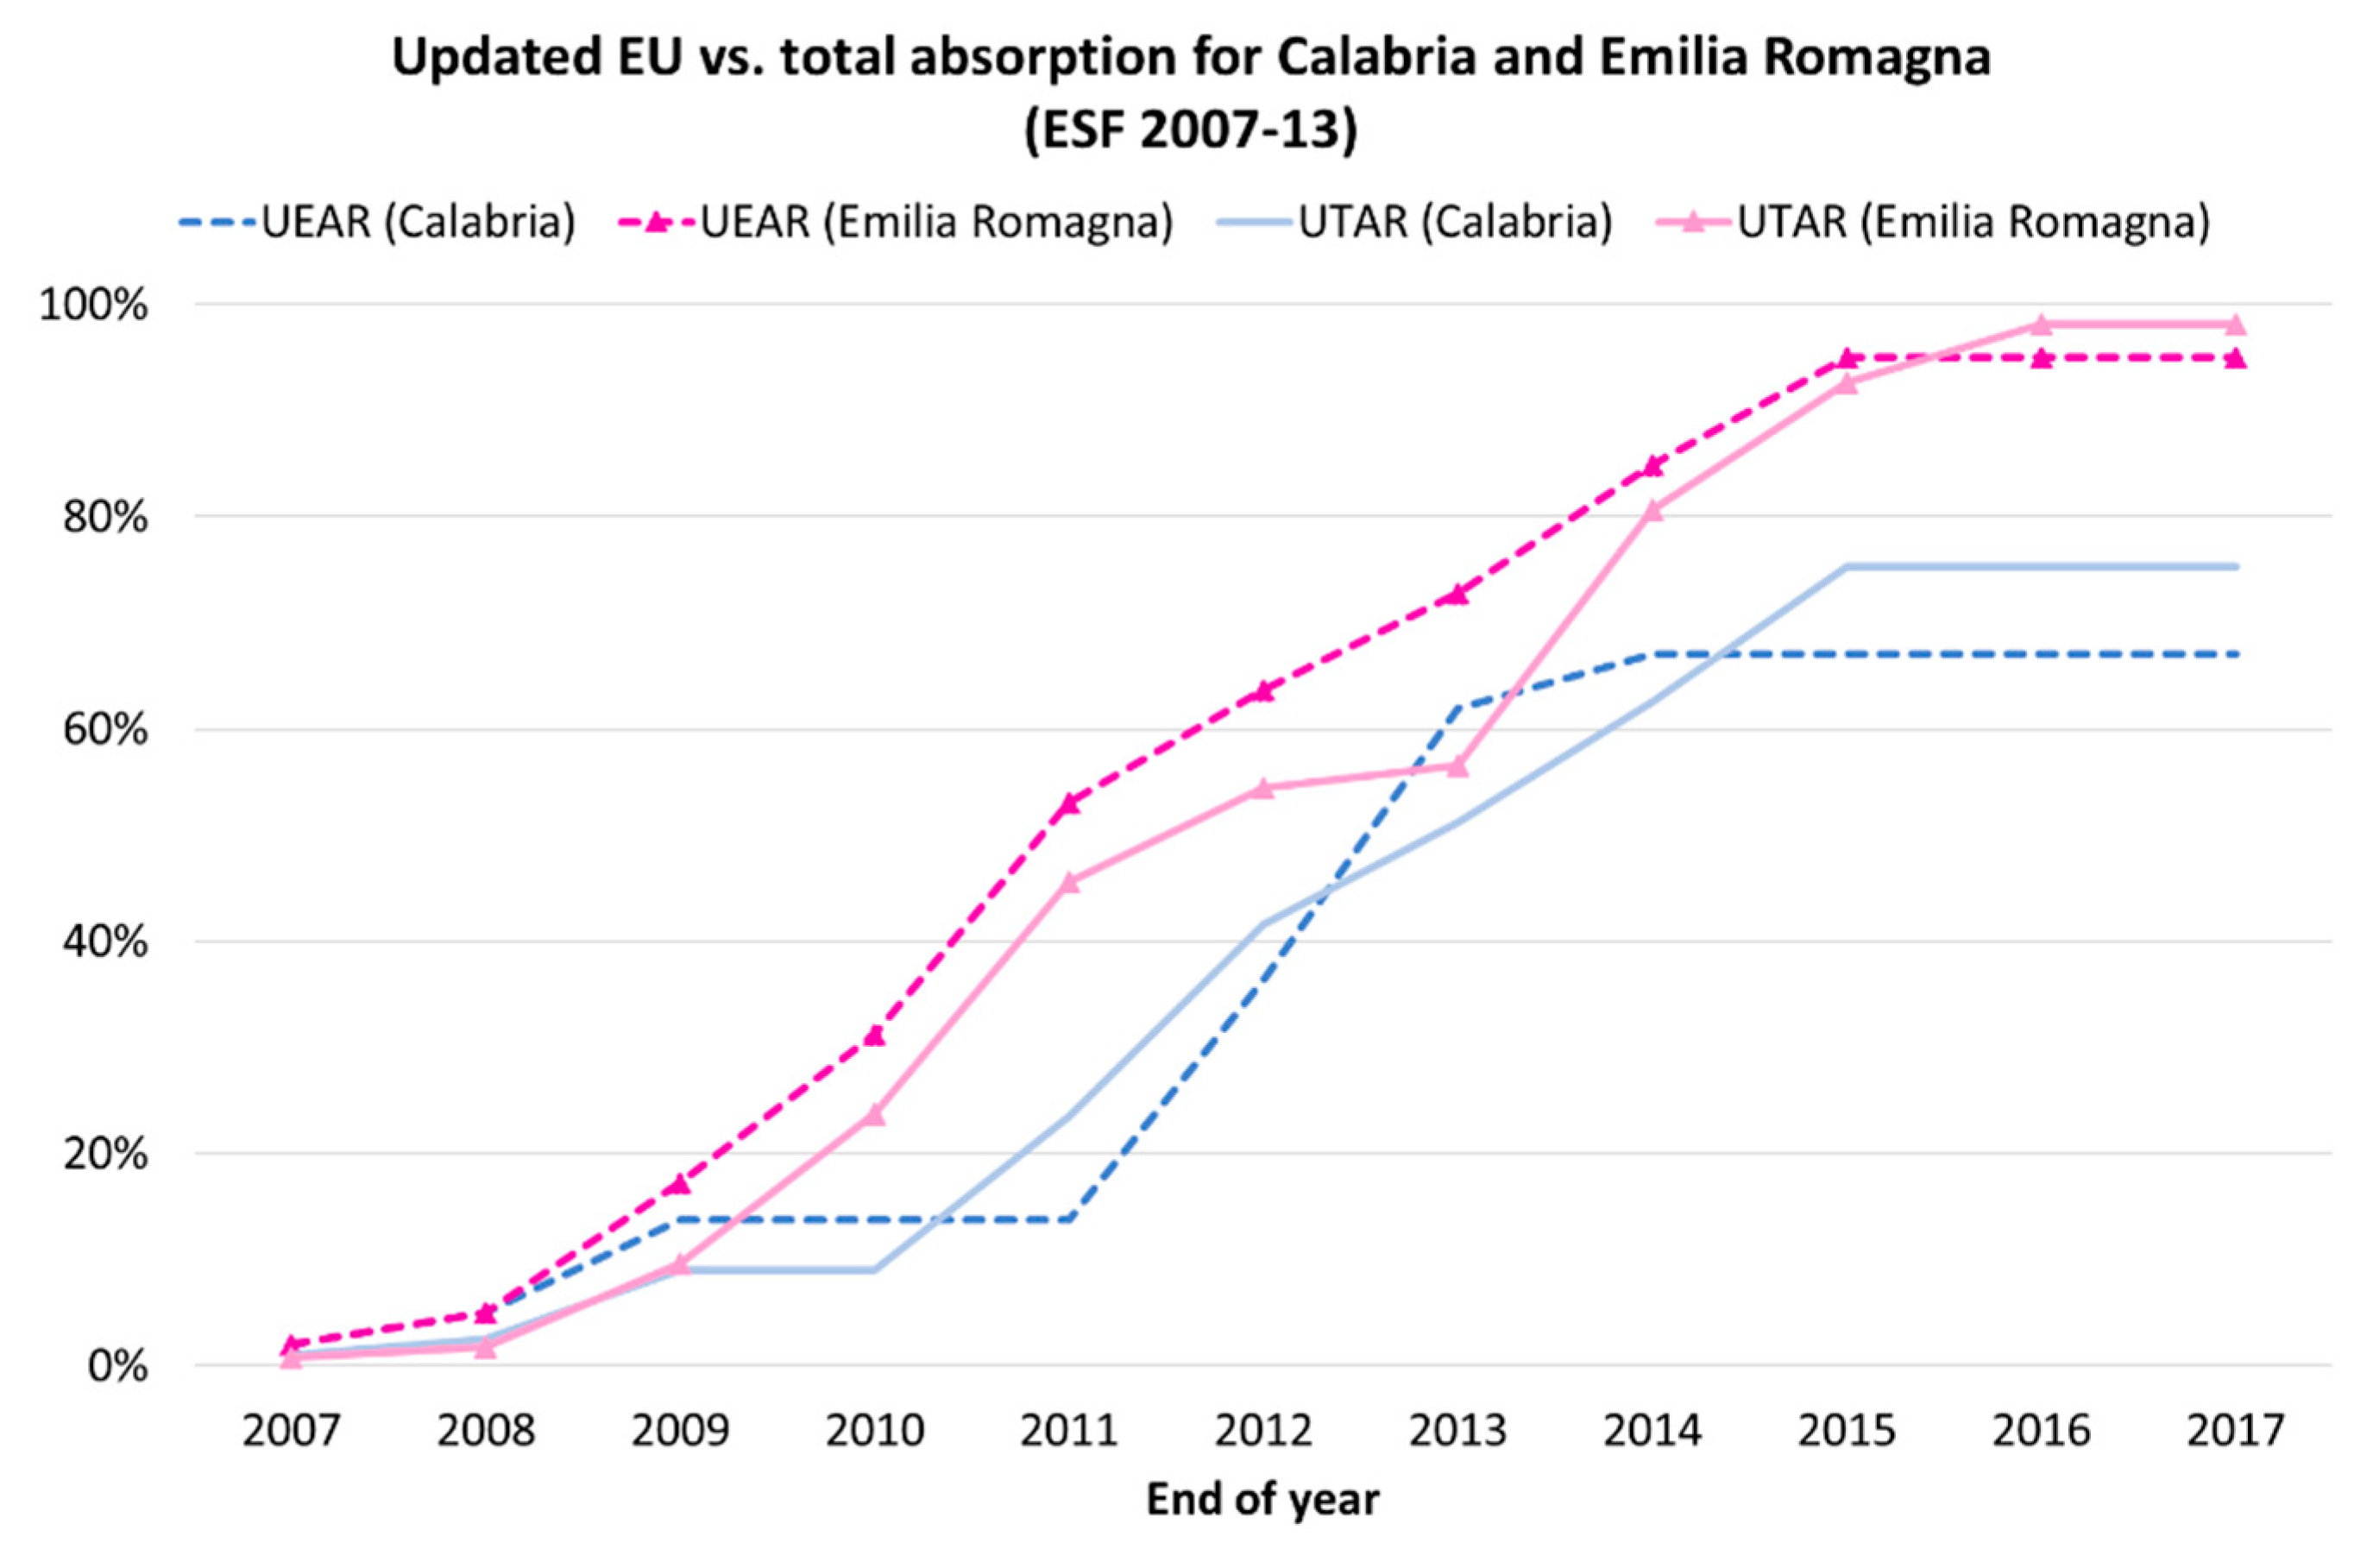
Corte dei Conti 2017). Hence, if retrospective projects’ expenditure is discounted from the gross UTAR and ITAR, the respective net rates will equal 54% and 36%. The latter value provides a new point of view on the state of LMA efficiency. In fact, although official documents mention that Calabria’s final UEAR equals 94% (indicating a considerably sufficient performance), the actual net ITAR hardly reaches 36% (due to regional co-finance reduction and retrospective projects use). The low actual absorption suggests that the region has clearly missed most of the potential resources for investments.
4.3. Formal Analysis of Regional Performance
To provide a formal method to evaluate longitudinal regional performances, we perform a statistical error analysis of the discrepancies between actual and ideal absorption rates. Ideally, the absorption of the CP funds should be uniformly distributed during each policy cycle (
Wostner 2008); the annual expenditure should be constant, generating a linear absorption function (
Figure 11,
Figure 12,
Figure 13 and
Figure 14), to guarantee a continuous inflow of resources supporting LMAs to build their strategies on time. To evaluate the fit of the actual absorption rate to the ideal one, statistical measures used for comparing real data with model (e.g., forecasting, simulation) outputs (
Makridakis and Hibon 1979;
Sterman 1984) can be adopted. The most common measure is the mean squared error (MSE), which is defined as:
where n is the number of observations and R
t and I
t are the real (or observed) and ideal (or modelled) values at time t, respectively. The different sources of error could be further explored. Theil’s inequality statistics offer a decomposition of the MSE into the following components (
Sterman 1984):
where
and
are the means of R
t and I
t,
and
are the standard deviations of R
t and I
t, while r is the correlation coefficient between real and ideal data, defined as:
The term
measures the bias (i.e., the difference in the mean), the term
measures the difference in the variances, while the term
measures the incomplete covariation (i.e., the degree to which real data changes fail to match ideal ones in a point-by-point manner). By dividing each component by the total MSE, the Theil’s indicators are derived:
The analysis of the MSE and the Theil’s indicators of the gross UTAR and ITAR in the context of ERDF scheme during 2007–2013 for both regions is provided in
Table 1. Notably, the net rates cannot be studied as longitudinal data about the retrospective projects are not available. The different types of absorption rate, along with the ideal one, are already depicted in
Figure 11 and
Figure 13 for Calabria and Emilia Romagna, respectively.
Overall, Calabria exhibits a higher MSE compared to Emilia Romagna, indicating a lower fit to the ideal absorption rate. Thus, although both regions showcase a sufficient UTAR at the period ending (95.6% and 100% for Calabria and Emilia Romagna, respectively), the difference in the volume of MSE confirms that Calabria has a considerably lower performance over time than Emilia Romagna, whose longitudinal performance is evidently more efficient and closer to the ideal one. In addition, the higher deviation between UTAR and ITAR in Calabria, compared to the lower one in Emilia Romagna, leads to a higher range in the volume of the respective errors. Indicatively, MSE ranges between 0.2138 (UTAR) and 0.2917 (ITAR) in Calabria, while the same indicator in Emilia Romagna has a range of 0.0797 (ITAR) and 0.0854 (UTAR). UTAR has a better fit to the ideal compared to ITAR in Calabria. A contradicting situation is evident in Emilia Romagna where the best fit to the ideal absorption rate is attributed to ITAR, followed by UTAR.
With respect to the Theil’s indicators, in the case of UTAR, both regions exhibit errors with a rather similar proportion among the MSE components. More specifically, UM has a range between 0.71 (Emilia Romagna) and 0.75 (Calabria), while UC ranges between 0.22 and 0.25, respectively. The rather high UM highlights that there is a significant difference between the means of UTAR and the ideal absorption, indicating a rather systematic deviation between the related values. A structural element that produces the deviation captured by UM lays in the fact that the ideal absorption assumes the completion of the absorption at the end of the seven-years period, whereas the actual payments usually extend beyond this deadline. In addition, other factors may negatively affect UTAR (e.g., reduction of regional co-finance and/or use of retrospective projects), shifting it away from the ideal. The moderate UC highlights that there is a difference in the covariance, meaning that the point-by-point values of the ideal and the actual time series do not perfectly match. This fact may imply that there are certain factors (e.g., low LMA performance) that may cause a delay between ideal absorption and UTAR. Finally, the values of US are rather low (in Calabria US is almost negligible due to higher UM and UC), indicating a small difference in the variation between the two data series.
On the contrary, in the case of ITAR, the proportion among the components of the MSE errors is rather dissimilar between the two regions. More specifically, UM dominates the MSE (0.85) in Calabria, indicating a considerably high and systematic difference between the ideal absorption and ITAR, while US and UC are rather low. However, in Emilia Romagna, there is a more proportional distribution of the components of the MSE error; UM covers half of the error (0.53), followed by a moderate UC (0.30) that captures the divergence between the linear shape of the ideal benchmark and the logistic curve of the actual absorption rate, and a rather low remaining US. In fact, the low LMA performance in Calabria, which also forces the reduction of regional co-finance, leads to a considerably low ITAR rate that is away from the ideal one (higher UM). In contrast, the high LMA performance in Emilia Romagna, together with the increase of the total funding due to the natural disaster, lead to a higher ITAR that is closer to the ideal one (more even distribution of error’s sources).
Table 2 presents the analysis of the MSE and the Theil’s indicators of the gross UTAR and ITAR in the context of the ESF scheme during 2007–2013 for both regions. The two types of absorption rate, as well as the ideal one, are already illustrated in
Figure 12 and
Figure 14 for Calabria and Emilia Romagna, respectively.
As in the ERDF case, Calabria exhibits higher errors compared to Emilia Romagna, indicating a lower fit to the ideal absorption rate. The detailed analysis of the MSE follows a similar logic with the analysis of the ERDF absorption errors. In addition, ESF errors are lower than the ERDF errors for both regions and absorption types, highlighting a better LMA performance in absorbing ESF funds.
Focusing on the Theil’s indicators, in the case of UTAR, Calabria demonstrates a considerably high UM component and rather low US and UC ones, while Emilia Romagna exhibits a high UM component, a moderate US one and a low UC one. In the case of ITAR, both regions show a rather high UM component, a lower UC, and an almost negligible US. In general, the prevalent UM indicator in all cases indicates that there is a systematic deviation between the ideal and the actual absorption rates, highlighting that the extension of the payments beyond the seven-year programming period and the changes in the total commitments can shift absorption away from the ideal one. The moderate UC indicator in most of the cases reveals that the point-by-point values of the ideal and the actual time series do not match, indicating that the low LMA performance may delay the actual absorption to some extent.


