1. Introduction
Sustainable investment, ethical investment, or socially responsible investment is when investors incorporate environmental, social, and governance (ESG) aspects into investment decisions. Therefore, the objective of this type of investment is not only to obtain returns but also to improve the social and environmental conditions (or frequently mentioned as the sustainable and responsible investment (SRI)). Moreover, sustainable investment can also be based on religious values (
Robiyanto 2018a).
In Asia, sustainable investment has obtained wide popularity (
Klobukowska 2017). The aim of the investment is quite related to corporate social responsibility (CSR) when firms are also concerned about sustainability, which is also focused on the environmental issues and social impacts, instead of accounting numbers. In other words, it is the corporate action or investment products that have a good social and environmental impacts. Additionally, the sustainable investment could obtain wider financial access, increasing company image positively, gaining more loyal customers and sales improvement. Sustainable investment could also support the Sustainable Development Goals (SDGs). In Indonesia, companies considered as sustainable and responsible investments (SRIs) usually become the SKI’s constituents (
Kurniatama et al. 2021).
The availability of gold is very important for sustainable or ethical investment. The futures and derivatives market is not in line with the aim of sustainable investment since it is very volatile (
Wibowo 2017). Furthermore, derivative instruments have a highly speculative movement that contradicts to the main aim of protecting the sustainable investment, which is minimizing risk since hedging can be implemented in sustainable investment such as Islamic-based portfolios, as long as it is not speculative (
Agha et al. 2015;
Ghazali et al. 2015). Islamic-based portfolios also consider a tight selection regarding the instruments included, which usually also consider the nature of SRI. So, it is very important to include gold in SRI portfolios, especially in sharia portfolios (
Ghazali et al. 2015), such as JII for the Indonesian market, because gold is often viewed as a sharia instrument, and gold can enhance the portfolio performance (
Chua et al. 1990;
Hillier et al. 2006;
Hoang et al. 2015). Numerous studies that study the ability of gold as a hedge have been conducted on many markets in the world, spanning from developed to emerging capital markets.
However, to the best of the authors’ knowledge, no study has tested the ability of gold as a hedging instrument on the ESG stocks and formulated the portfolio from those instruments. This research hopefully could fill the gap in the related current literature in some ways. First, many studies that study the potential role of gold as the instrument of hedge use general characteristics in the capital markets. In other words, the studies have not been empirically conducted on certain stocks (such as SRI stocks). Therefore, this research conducted a study on sustainable investment in Indonesia, which is especially reflected by the SKI. Additionally, this study hopefully could prove that the inclusion of gold in sustainable/ethical stocks portfolios could produce better performance.
Second, this study used gold as a tool for risk minimization. This is important because gold is also the instrument that is frequently connected with ethical investment (
Hussin et al. 2013). Moreover, it is following Islamic values (
Agha et al. 2015). Third, this paper also investigates the role of gold for individual stocks that are consistently included in the SKI from 2013–2019.
2. Literature Review
This research used the SKI Index in Indonesia as a proxy of sustainable or ethical investment. Generally, there is a selection of companies that are involved in sectors that are considered ethical by investors. Additionally, the selection can be made based on religion. For instance, ethical firms are the ones that follow Islamic values. Generally, there are two types of selection process in sustainable investment in Indonesia: qualitative and quantitative selection (
Astuty 2015;
Kurniatama et al. 2021;
Robiyanto et al. 2020b).
The qualitative screening is to measure companies’ primary activities. In this screening, the firms must not be involved in any activities related to prohibited activities such as selling and producing illegal products and services or gambling (
Robiyanto et al. 2019a;
Wan Ismail et al. 2015). The quantitative screening related to especially financial ratio screening. Specifically for sharia principles, in financial screening, the debts must not exceed thirty-three percent; interest income, which is considered as
riba, must be less than five percent (
Wan Ismail et al. 2015). Another example is that firms are strongly banned from being involved in pork-based trading and selling or serving alcohol-based liquor/drinks in restaurants.
The SRI Index in Indonesia was created by the Kehati Foundation, which is a nonprofit organization that is involved in fostering environmental conservation and biodiversity preservation in Indonesia. This index (base 100) was created on 30 December 2006, and the official name is SKI.
Hedging is an activity conducted by investors to reduce risk.
Ahmad and Halin (
2014);
Ming et al. (
2020) even stated that “hedging is an attempt to ensure that potential risks and losses are significantly reduced when investors enter the equity market”. The concept of hedging is to counter the loss of the original asset position using the gain obtained from one or many hedging instruments. In other words, investors hold a position in some assets that consist of hedging instruments and other assets that are intended to be protected. A portfolio that consists of several asset classes and hedging instruments is often called as a hedged portfolio. A hedged portfolio is usually less risky than a portfolio without a hedging instrument.
Besides the fact that gold is essential in Islamic investment due to its non-speculative nature, there are some other reasons why gold can be used as a risk minimizer. First, gold can be utilized to protect investors against inflation.
Singh and Joshi (
2019) stated that “gold was an effective asset to hedge investment against inflation in India”. Second, the possession of gold is closely related to culture. For example,
Singh and Joshi (
2019) indicated that gold has been used as a sign of social status improvement, marriage proposals, and even as gifts. Third, across the world, some central banks have stored gold as reserves in order to stabilizing macroeconomics (
Agha et al. 2015). Fourth, gold demand has been increasing.
Artigas et al. (
2010) stated that there was a 5.2 percent addition of gold demand when the inflation rate was two percent. Fifth, gold has an excellent ability to preserve its value. Sixth, the introduction of paper-based gold investments such as exchange-traded funds (ETFs) have been gaining popularity.
The main purpose of this research is to create a portfolio that consists of sustainable and responsible investment stocks and gold. The result is important, especially for the individual investor. Additionally, the investigation of using gold paired with ethical stock in the portfolio is scarce in the literature. Therefore, the ultimate purpose of this study is to test the gold’s role as a risk minimizer for sustainable investment in Indonesia. Based on the explanation, the hypothesis of this study is:
Hypothesis 1 (H1). Gold can be utilized as a risk minimizer for sustainable investment in Indonesia.
3. Method
Data employed in this study is secondary data. Moreover, this research employs monthly data from 2013 to 2019. The sustainable investment is represented by SKI obtained from Bloomberg. The risk-free rate was obtained from Bank Indonesia (the Indonesia Central Bank)’s website while the selected stock prices data were obtained from Bloomberg. The gold data were also obtained from Bloomberg.
To construct a portfolio, this research used the DCC model. In portfolio management, the correlation across financial assets is very important.
Engle (
2002) suggested a dynamic conditional correlation (DCC) estimator that offers flexibility. The model is generally computed in two step: using GARCH univariate and correlation estimation. This method creates a model with a good estimation of various correlation cycles with time alternative (
Arouri et al. 2015;
Robiyanto et al. 2017,
2020b). The DCC model refers to the multivariate framework, while GARCH suits for univariate. Hence, the method can be implemented to create portfolio diversification and provide hedging effectiveness (
Amendola and Candila 2017;
Amendola et al. 2020;
Caldeira et al. 2017;
Robiyanto 2018b;
Robiyanto et al. 2020a).
Kroner and Sultan (
1993) introducing the following formula in order to measure the hedge ratio. The hedge ratio is used to measure the amount whereby a buy (long) position of equity should be accompanied by a sell (short) or buy (long) position of
in stock or gold or other investment instruments:
Additionally, according to
Kroner and Ng (
1998), the conditional volatilities could be used to compute the portfolio weights from equities and commodities (in this study, they are gold and stock) with the following formula:
where
is the proportion of asset
x at time
t. The weight of asset
y is calculated as 1 −
. Hedging effectiveness (HE) was measured by:
where
. is the portfolio variance of gold (or other investment instruments) and equity and
is the portfolio variance of equity.
There are two types of robustness checks for this paper. Firstly, the authors use another proxy for sustainable or ethical investment in Indonesia, which is the Jakarta Islamic Index. Secondly, motivated by
Baur and Lucey (
2010), with some modifications, this paper applies OLS regression with specific percentiles as a sensitivity analysis. In this studies, OLS regression represents the relationship between SKI return and specific percentiles (or “quantiles”) of gold return, most often the median. The following formula is the regression:
where RetSKI
(Quantile 0.5, 0.2, 0.1) is the return SKI for percentile of 0.5, 0.2 and 0.1. Meanwhile, gold is the gold return. Additionally, this research follows
Baur and Lucey’s (
2010) definition of diversifier, hedging, or safe haven. A diversifier is when an asset is positively related to another portfolio on normal market conditions. An asset is used as a hedging factor when the asset has a negative relationship with another portfolio on a normal market situation. Moreover, a safe haven is when an asset has a negative relationship with another asset in a severely volatile market.
4. Results
This study used monthly data of stock indices, gold prices from 2013 to the end of 2019 with 83 observations.
Table 1 shows that SKI provides higher average monthly returns than gold, whereas gold exhibits the highest maximum monthly returns. Moreover, SKI and gold have better returns than the risk-free rate in Indonesia. Furthermore, gold is marginally riskier than SKI. It is also interesting to notice that gold skews positively while the other markets do not.
The correlogram q-stat with 36 lags or
Q(36) does not exhibit the evidence of serial correlation. Additionally, all returns are normally distributed based on Jarque–Bera at 5 percent significance. Moreover, the risk-free rate and SKI have left-skewed distribution since the mean value is lower than the median value. Conversely, gold has a right-skewed distribution since the mean value is higher than the median value. Gold also has positive skewness, whereas the Indonesian risk-free rate and SKI have negative skewness. In other words, gold is leptokurtic, whereas SKI is platykurtic. Moreover,
Table 2 exhibits the result of the unit root test.
The results show that t-statistics are significant even at a one percent level, which show no unit root occurs. Additionally,
Table 3 shows the unconditional correlation of monthly returns, which show that there is potential risk reduction by creating a portfolio of gold and equity since the return and risk correlation state low correlation. This implies that the benefits of diversification could be realized at certain times.
The lower correlation between gold and equities could produce potential hedging capability. However, the unconditional or static correlation could not be efficiently implemented if dynamic volatilities and covariances of the returns exist; in reality, this will be frequently met. Therefore, the DCC-GARCH method is suitable for this research. In
Table 4, we can see the volatilities and ARCH/GARCH effect, shown on the variance equation.
Robiyanto et al. (
2020a) stated if the volatility persistence (λ) is close to one, it will lead to an unpredictable long pattern in the future. Consistent with some previous studies (i.e.,
Maghyereh et al. (
2017);
Zhao et al. (
2018), this research tries to employ DCC-GARCH (1,1). The value of α is to measure the sensitivity of the market to new information. Meanwhile, the value of
b is to measure the conditional variance. In the table, the λ value is closer to 1 (0.79), showing that the volatility pattern between gold and SKI will persist in the future. In
Table 4, the
b value is very low (0.07), indicating that the degree of decline on the gold market is lower than SKI equity. Additionally, based on the autocorrelation and heteroscedasticity test, the DCC-GARCH model in this research is fit.
5. Discussion
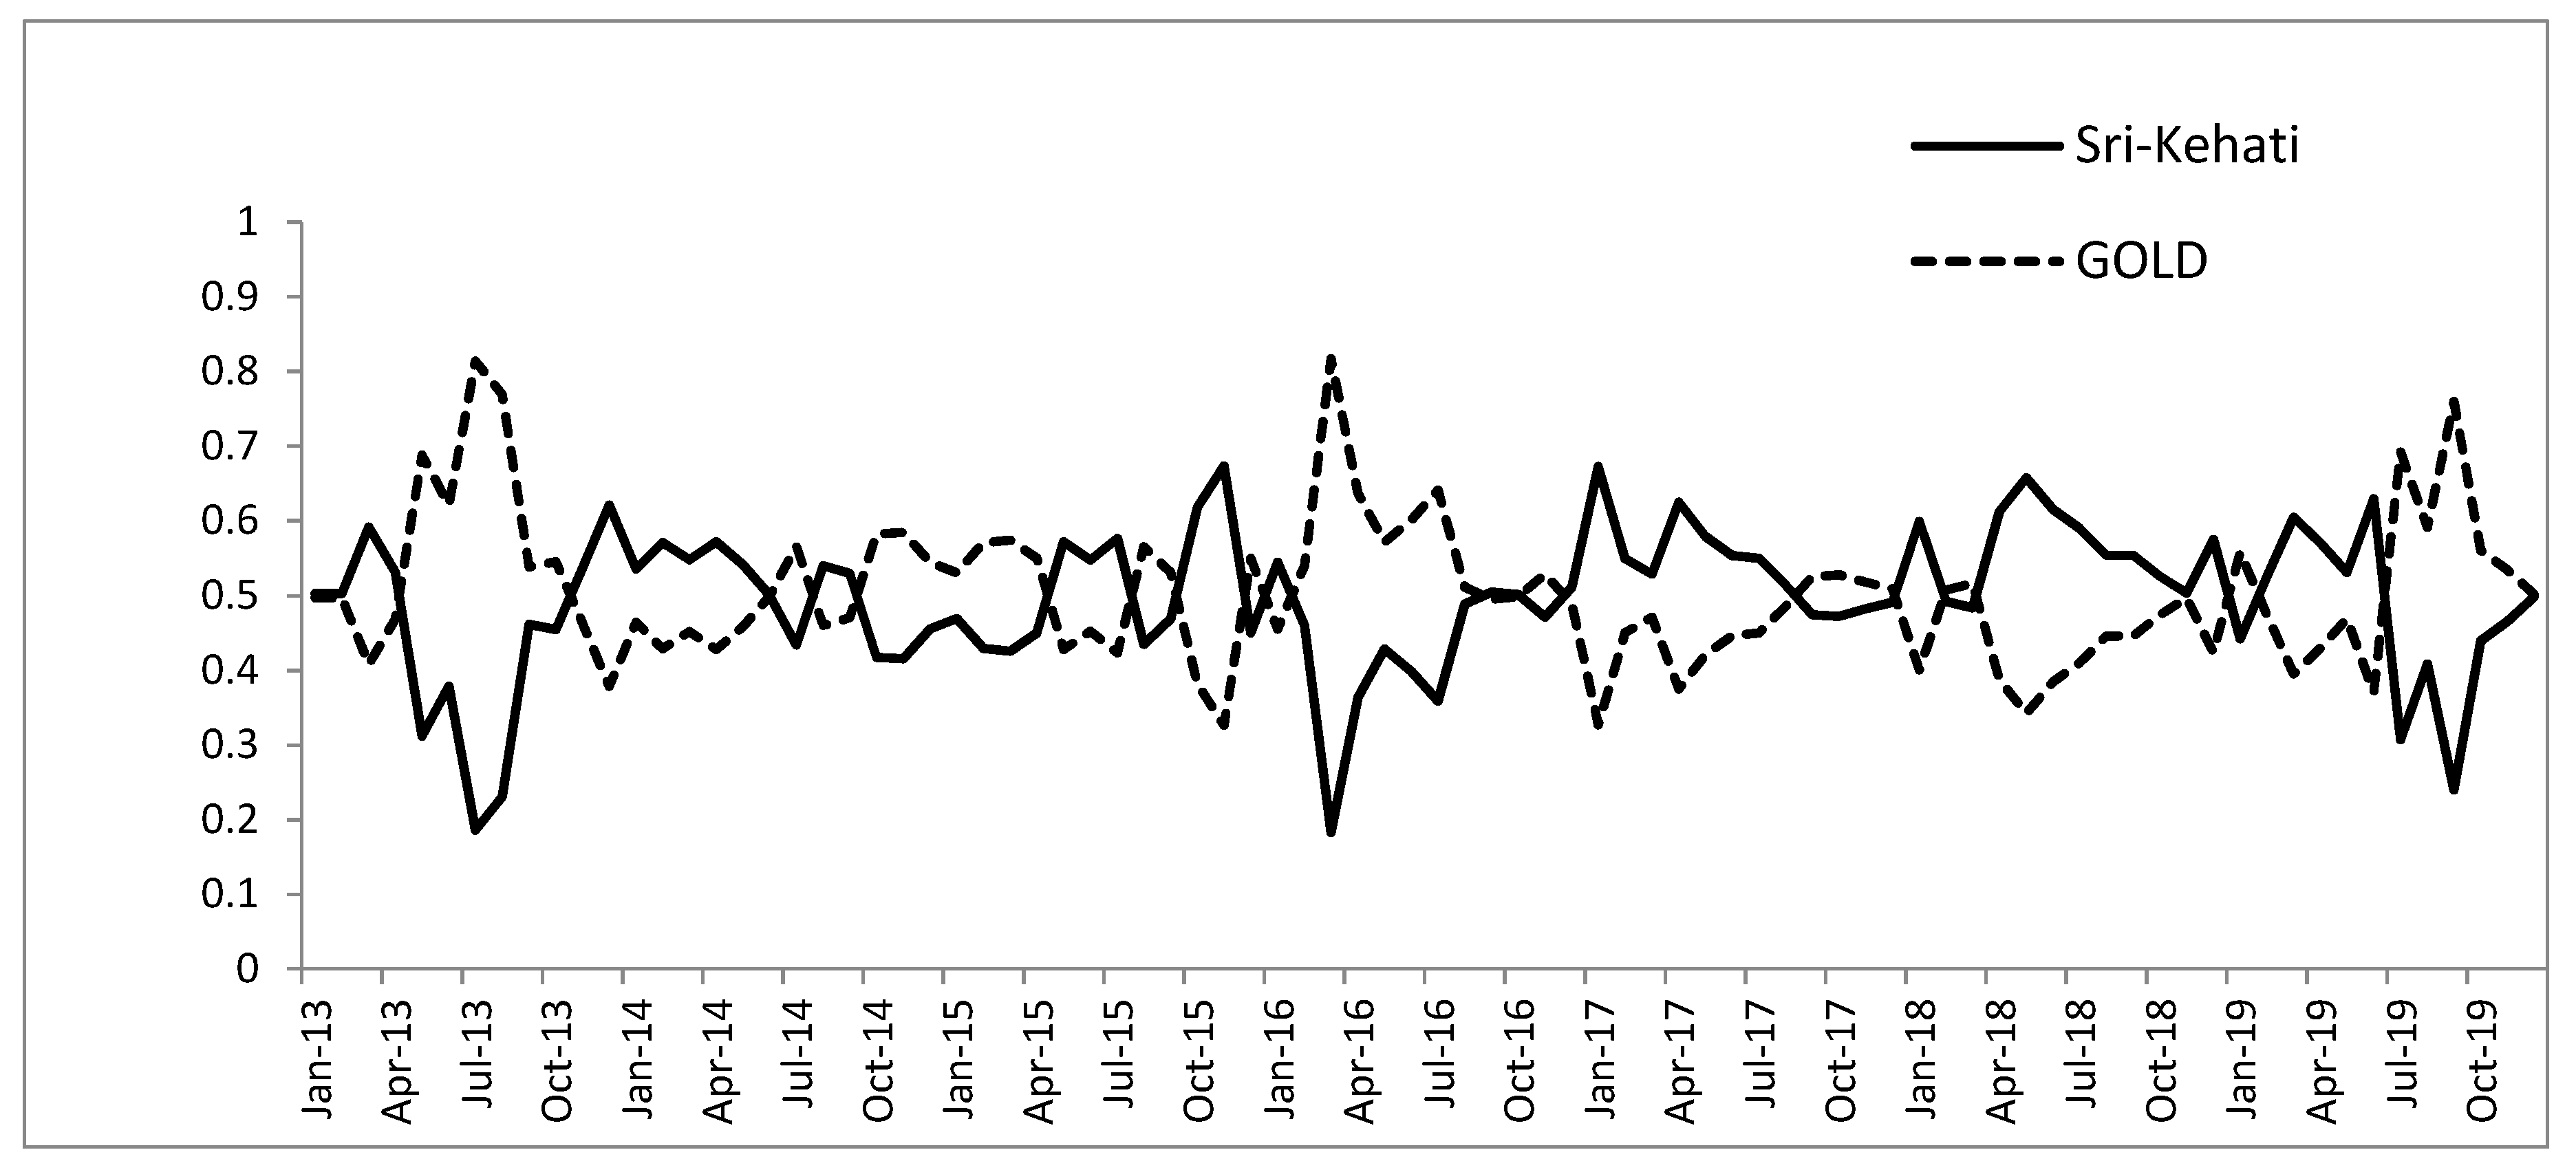
Based on the analysis which employs a dynamic portfolio formulation method, the result of time varying weight between the SKI and gold can be seen in
Figure 1. Based on this figure, it can be seen that the largest weight of gold in the portfolio was 81 percent, which occurred in March 2016, while the average gold weight in the portfolio during the research period was 51 percent. Moreover, the largest weight for SKI in the portfolio was 67 percent, which occurred in November 2015; the average weight of SKI during the research period was 49 percent.
As seen in
Table 5, the portfolio formulation of the SKI with gold can reduce the risk because it produced 0.9258 as the hedging effectiveness value. The portfolio created using the SKI with gold can produce an average monthly portfolio return of 0.0030, while producing a standard deviation around 0.0328. Even though the average return of the portfolio is lower than the SKI’s average return, which is 0.069, the portfolio return is larger than the average return of gold, which is −0.0003. Meanwhile, based on the standard deviation, which indicates risk, the risk of the formulated portfolio is 0.00328, which is lower than the risks contained in the stocks and gold alone. Hence, the inclusion of gold in the portfolio can reduce equity risk. Based on this result, H1 is accepted.
The Sharpe ratio produced is −0.0649, which shows that the gold and stock portfolio could perform better than gold alone, which produces the Sharpe ratio around −0.1321. Unfortunately, it is lower than the SKI alone, which could produce a better Sharpe ratio around 0.0435. Consistent to the several previous findings, gold can be considered a safe haven, and also as a hedge in the Indonesian capital market. Hence, it is reasonable to assume that the insertion of gold in the portfolio could lower the portfolio risk. This finding supports the findings by
Batten et al. (
2010);
Baur and Lucey (
2010); and
Ciner et al. (
2013).
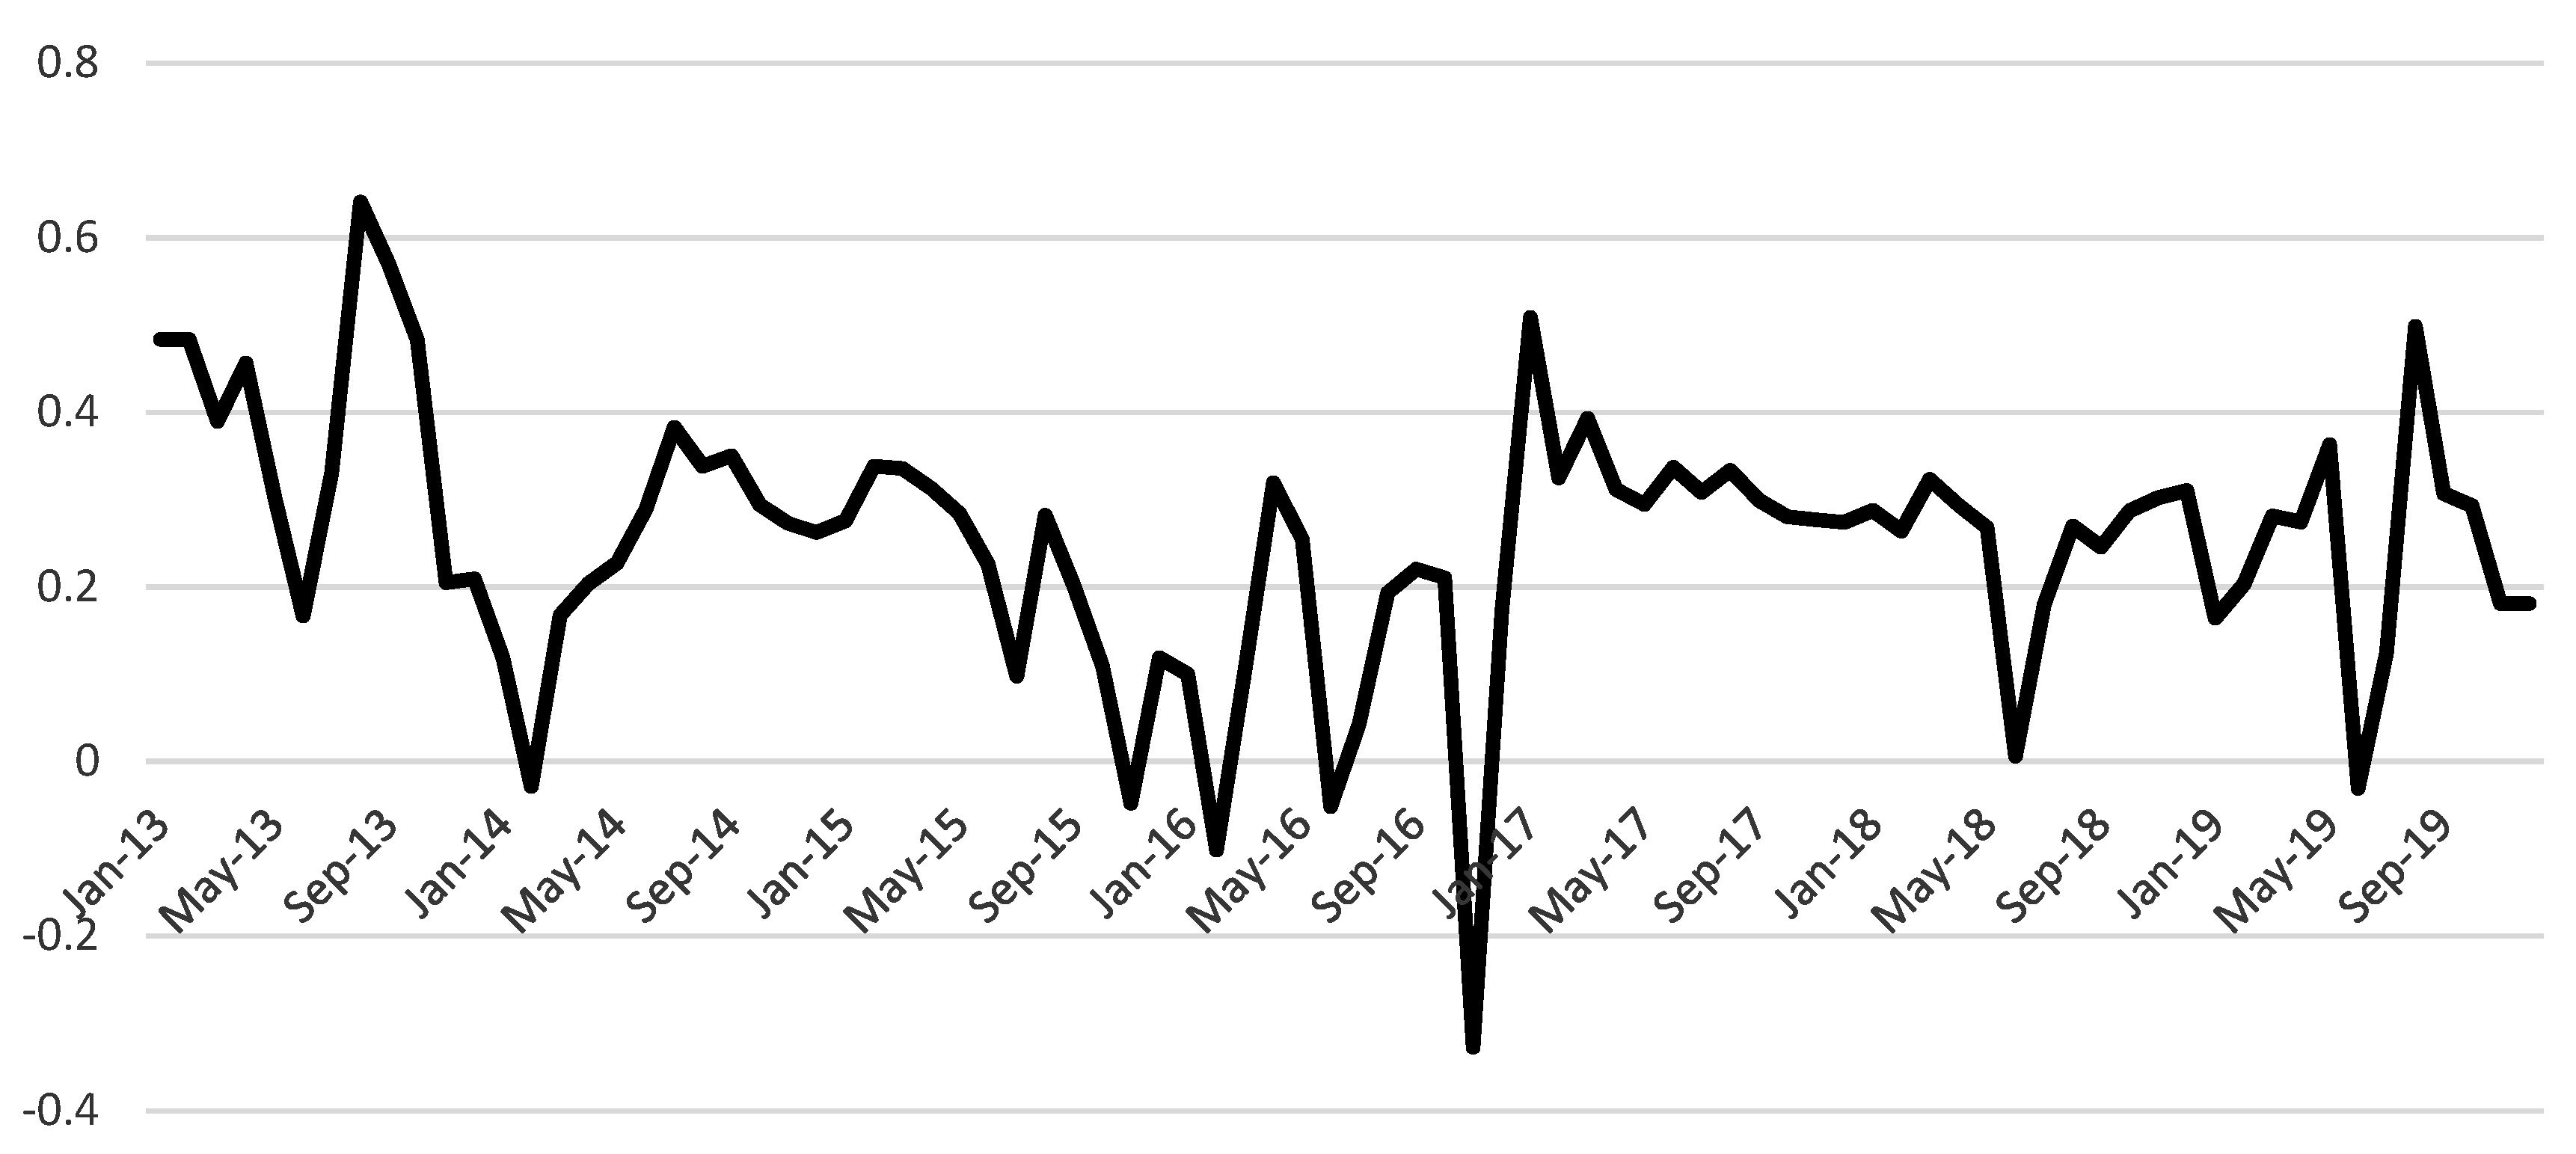
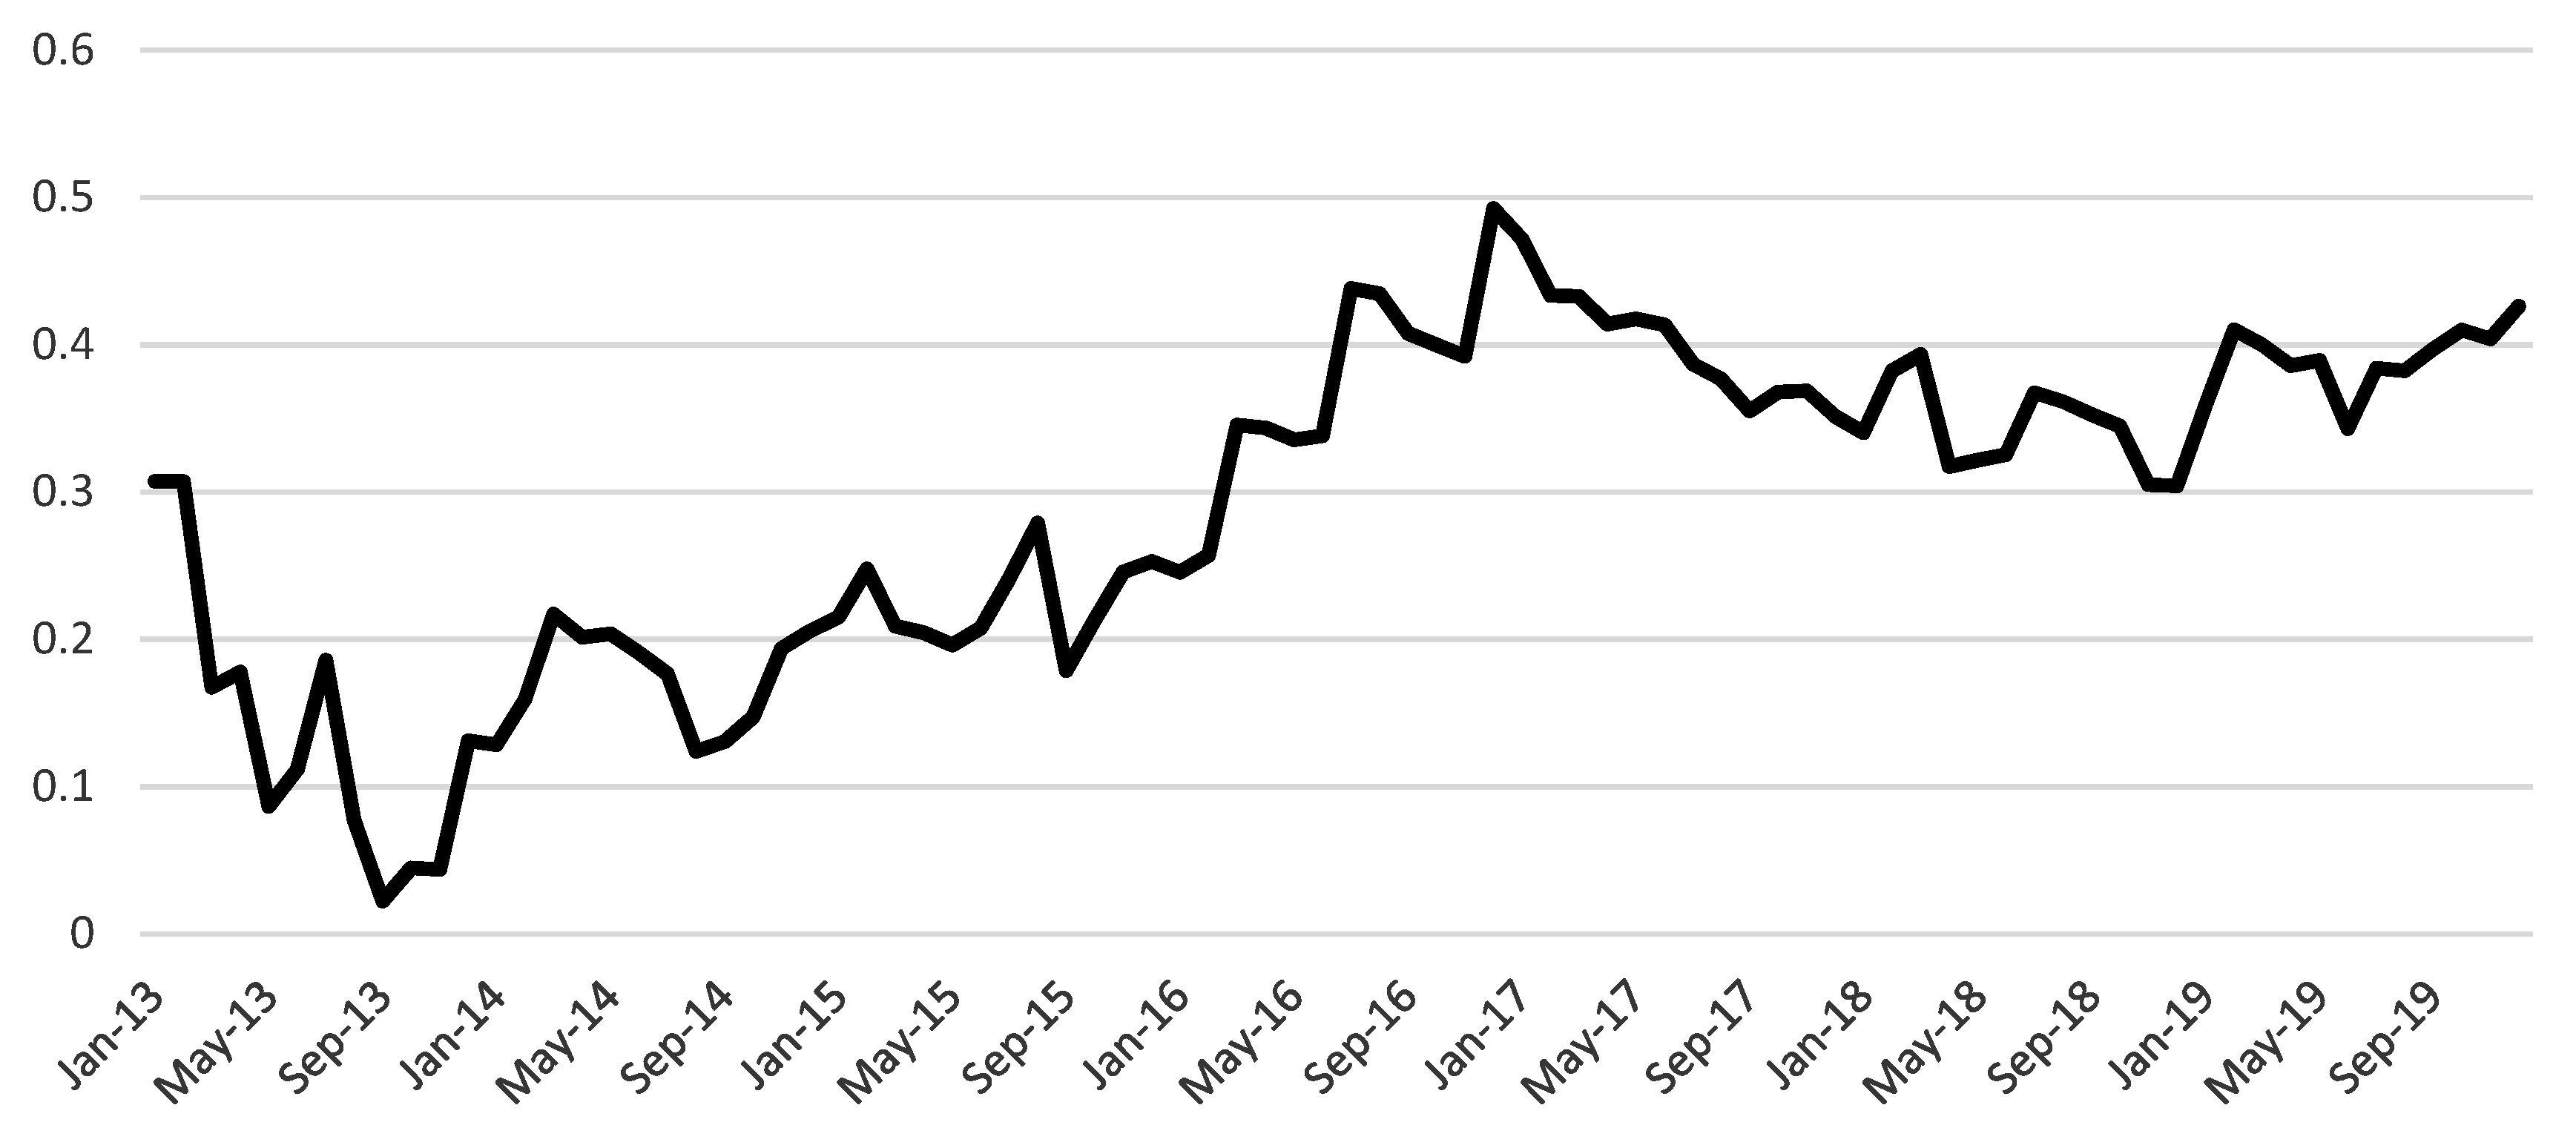
Figure 2 and
Figure 3 is the result of a time-varying correlation.
Figure 2 shows that the DCC between SKI return and gold return during the studied period is around −0.32 to 0.64. While,
Figure 3 shows that the DCC between JII return and gold return during the studied period is around 0.01 to 0.50. These shows that the dynamic correlation between the SRI Index and gold during the studied period varied over time, the same also applies for the JII and gold. Therefore, the method used in this research, DCC-GARCH, was relaxing the core assumptions in the modern portfolio theory such as normal distribution of stock return and the constant correlation among securities. In other words, in the real world, the correlation among securities is always changing at all times. The average time-varying correlation during the research period was 0.25, which is quite low. The result also implies that gold can be used to minimize risk. Hence, based on this result, H1 is accepted.
Table 6 shows the hedge ratio, hedge effectiveness, and Sharpe ratio calculation. The results indicate that the average dynamic hedge ratio is not always positive. For example, the average time-varying hedge ratio for WIKA is −0.293, suggesting that investors should take a long position (buy) in the gold market. In other words, every purchase of WIKA stock should be accompanied by buying 0.293 of gold. The negative hedge ratio is also found on AALI, SMGR, TLKM, and UNTR. Moreover, 16 SKI stocks have a positive hedge ratio. For instance, every purchase of 1 INDF stock should be accompanied by the short position (sell) 0.26 of gold. Since the highest value of the hedge ratio is 0.280 for the short position (sell) and 0.293 for a long position (buy), it is indicated that gold is relatively cheap for hedging sustainable stocks in Indonesia.
Moreover, consistent with
Table 5,
Table 6 shows the positive value of the hedging effectiveness of gold on SKI stocks. It indicates that gold can be used to reduce risk on SKI stocks, not only the SKI index. The highest value of hedge effectiveness is 0.610, implying that gold has the greatest impact of risk reduction on SMGR stock (cement industry). Moreover, gold can be used to reduce risk at the expense of performance. In general, the hedged Sharpe ratio is lower than the unhedged Sharpe ratio, except for AALI stock.
Based on this result, H1 is accepted. Moreover,
Table 7 shows that the difference of unhedged and hedged Sharpe ratio is statistically significant at one percent significance. In other words, the inclusion of gold in the portfolio has a tremendous impact on portfolio performance.
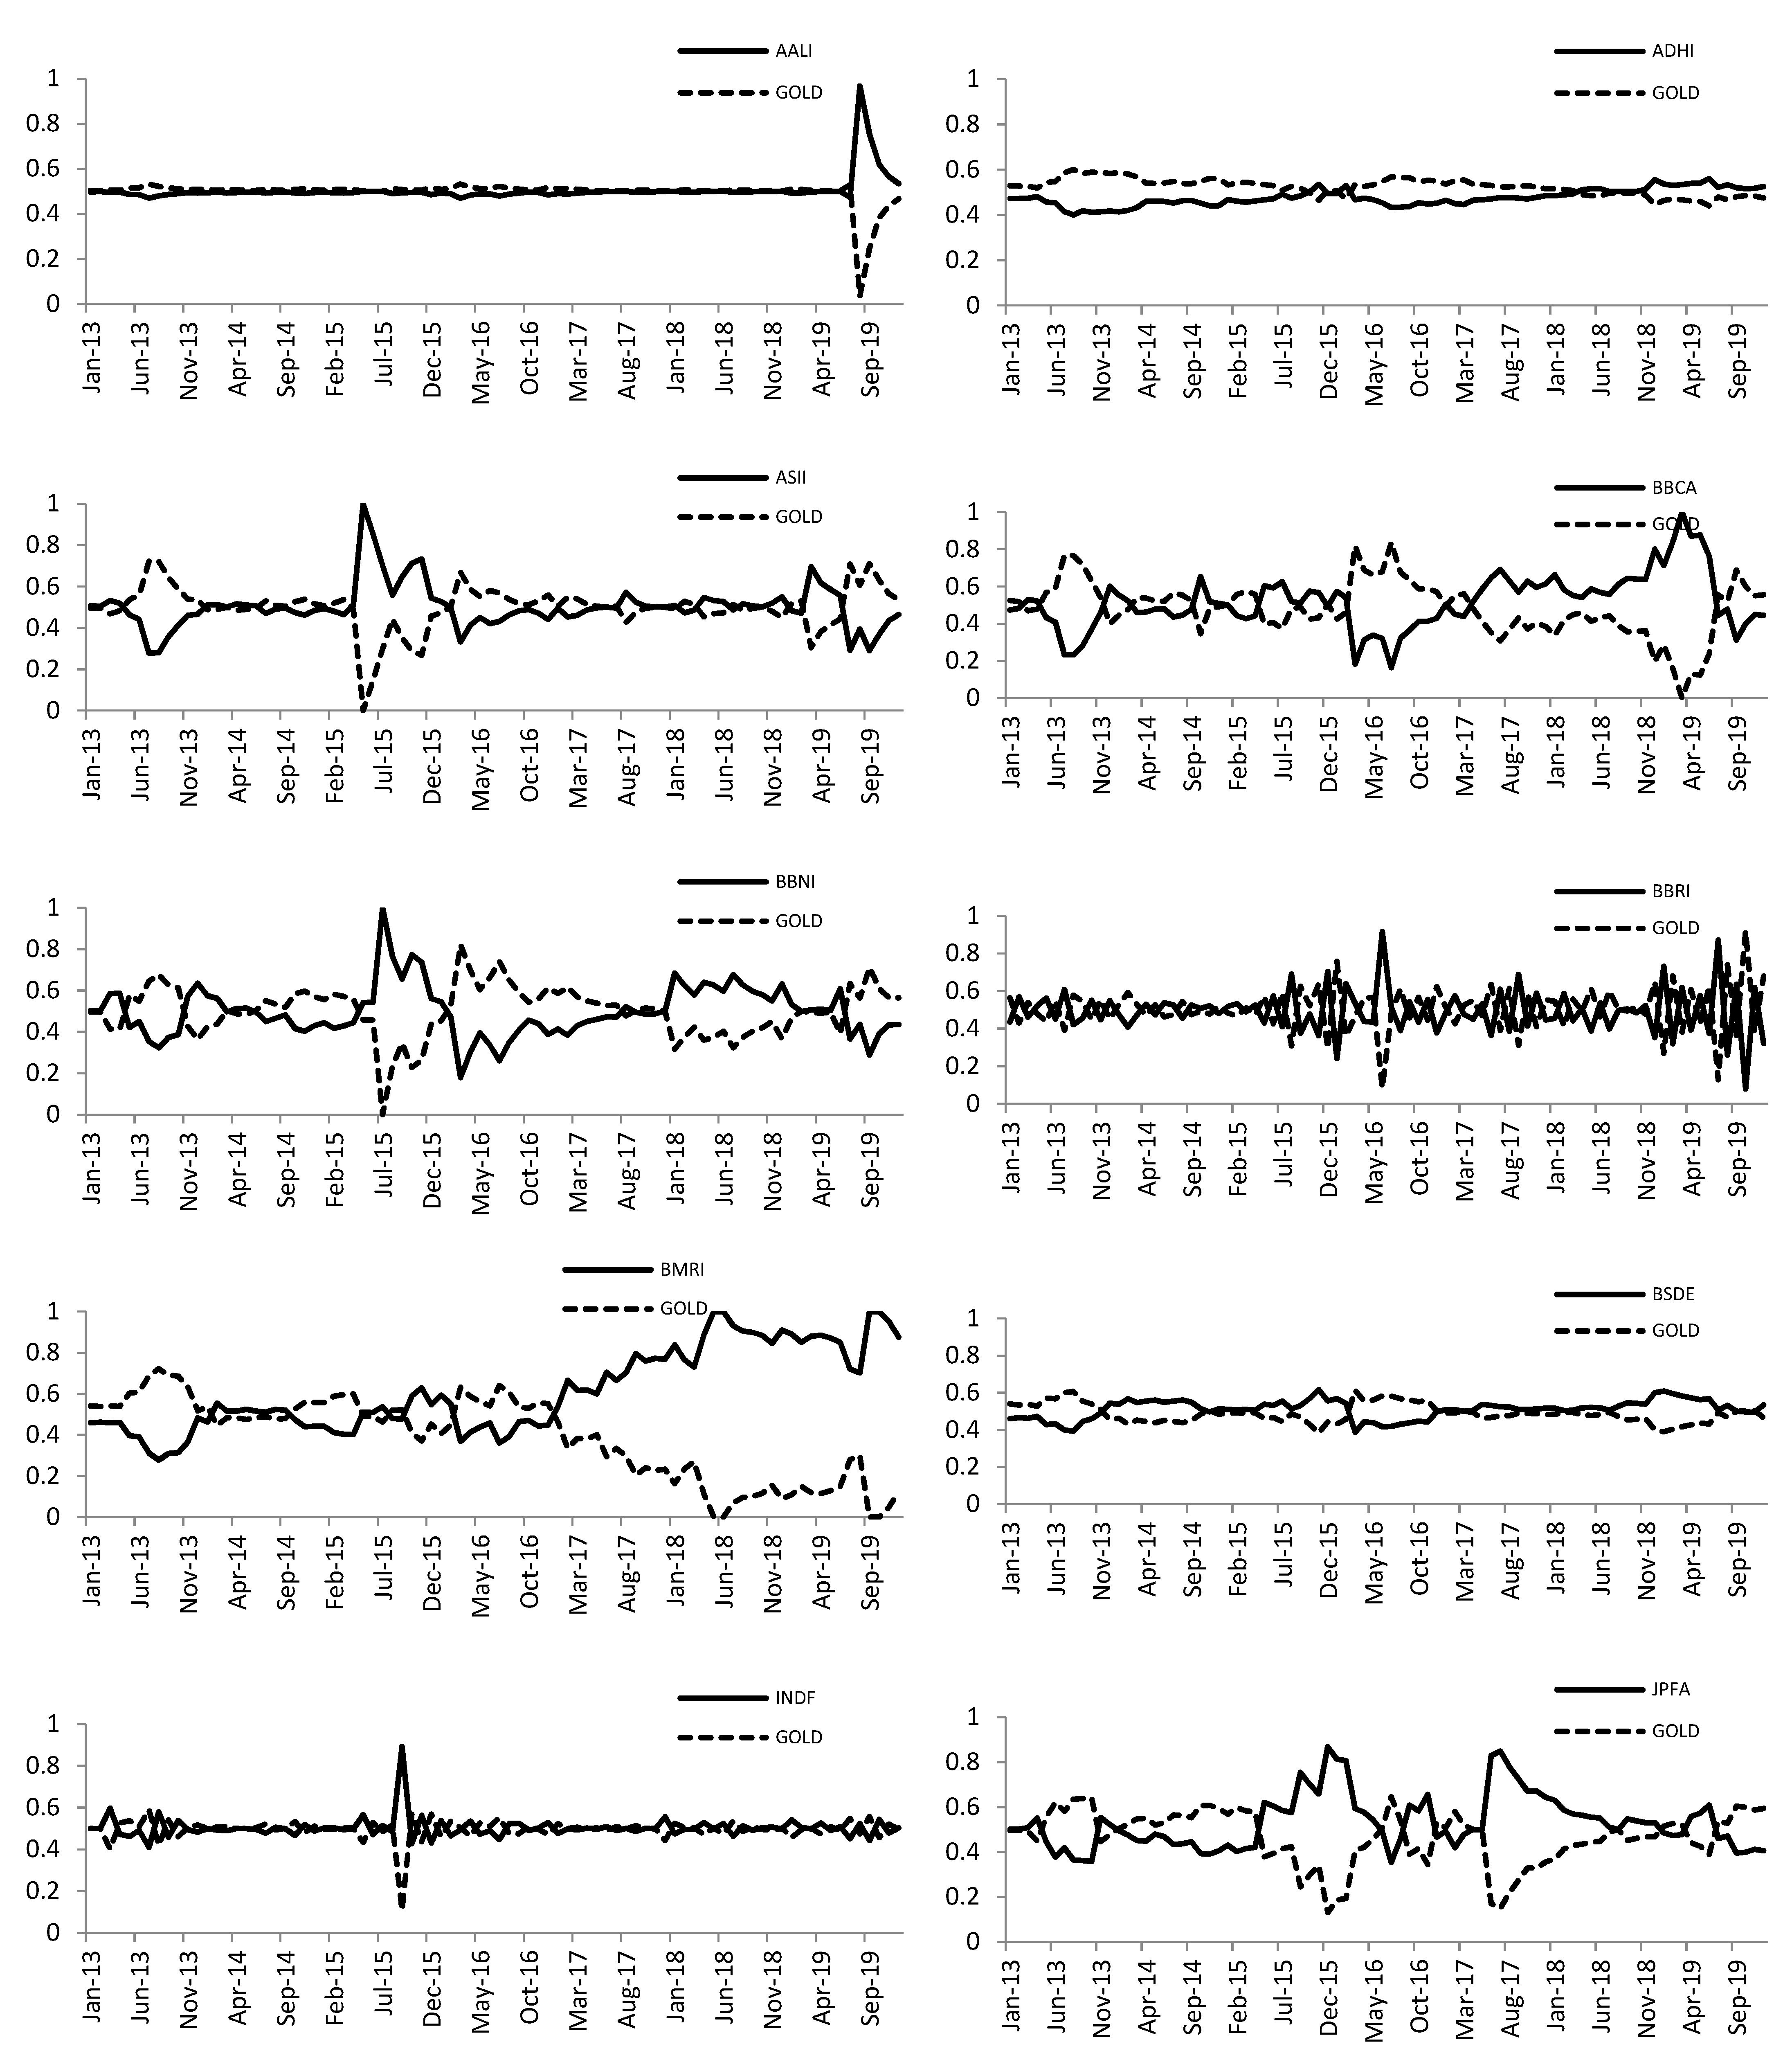
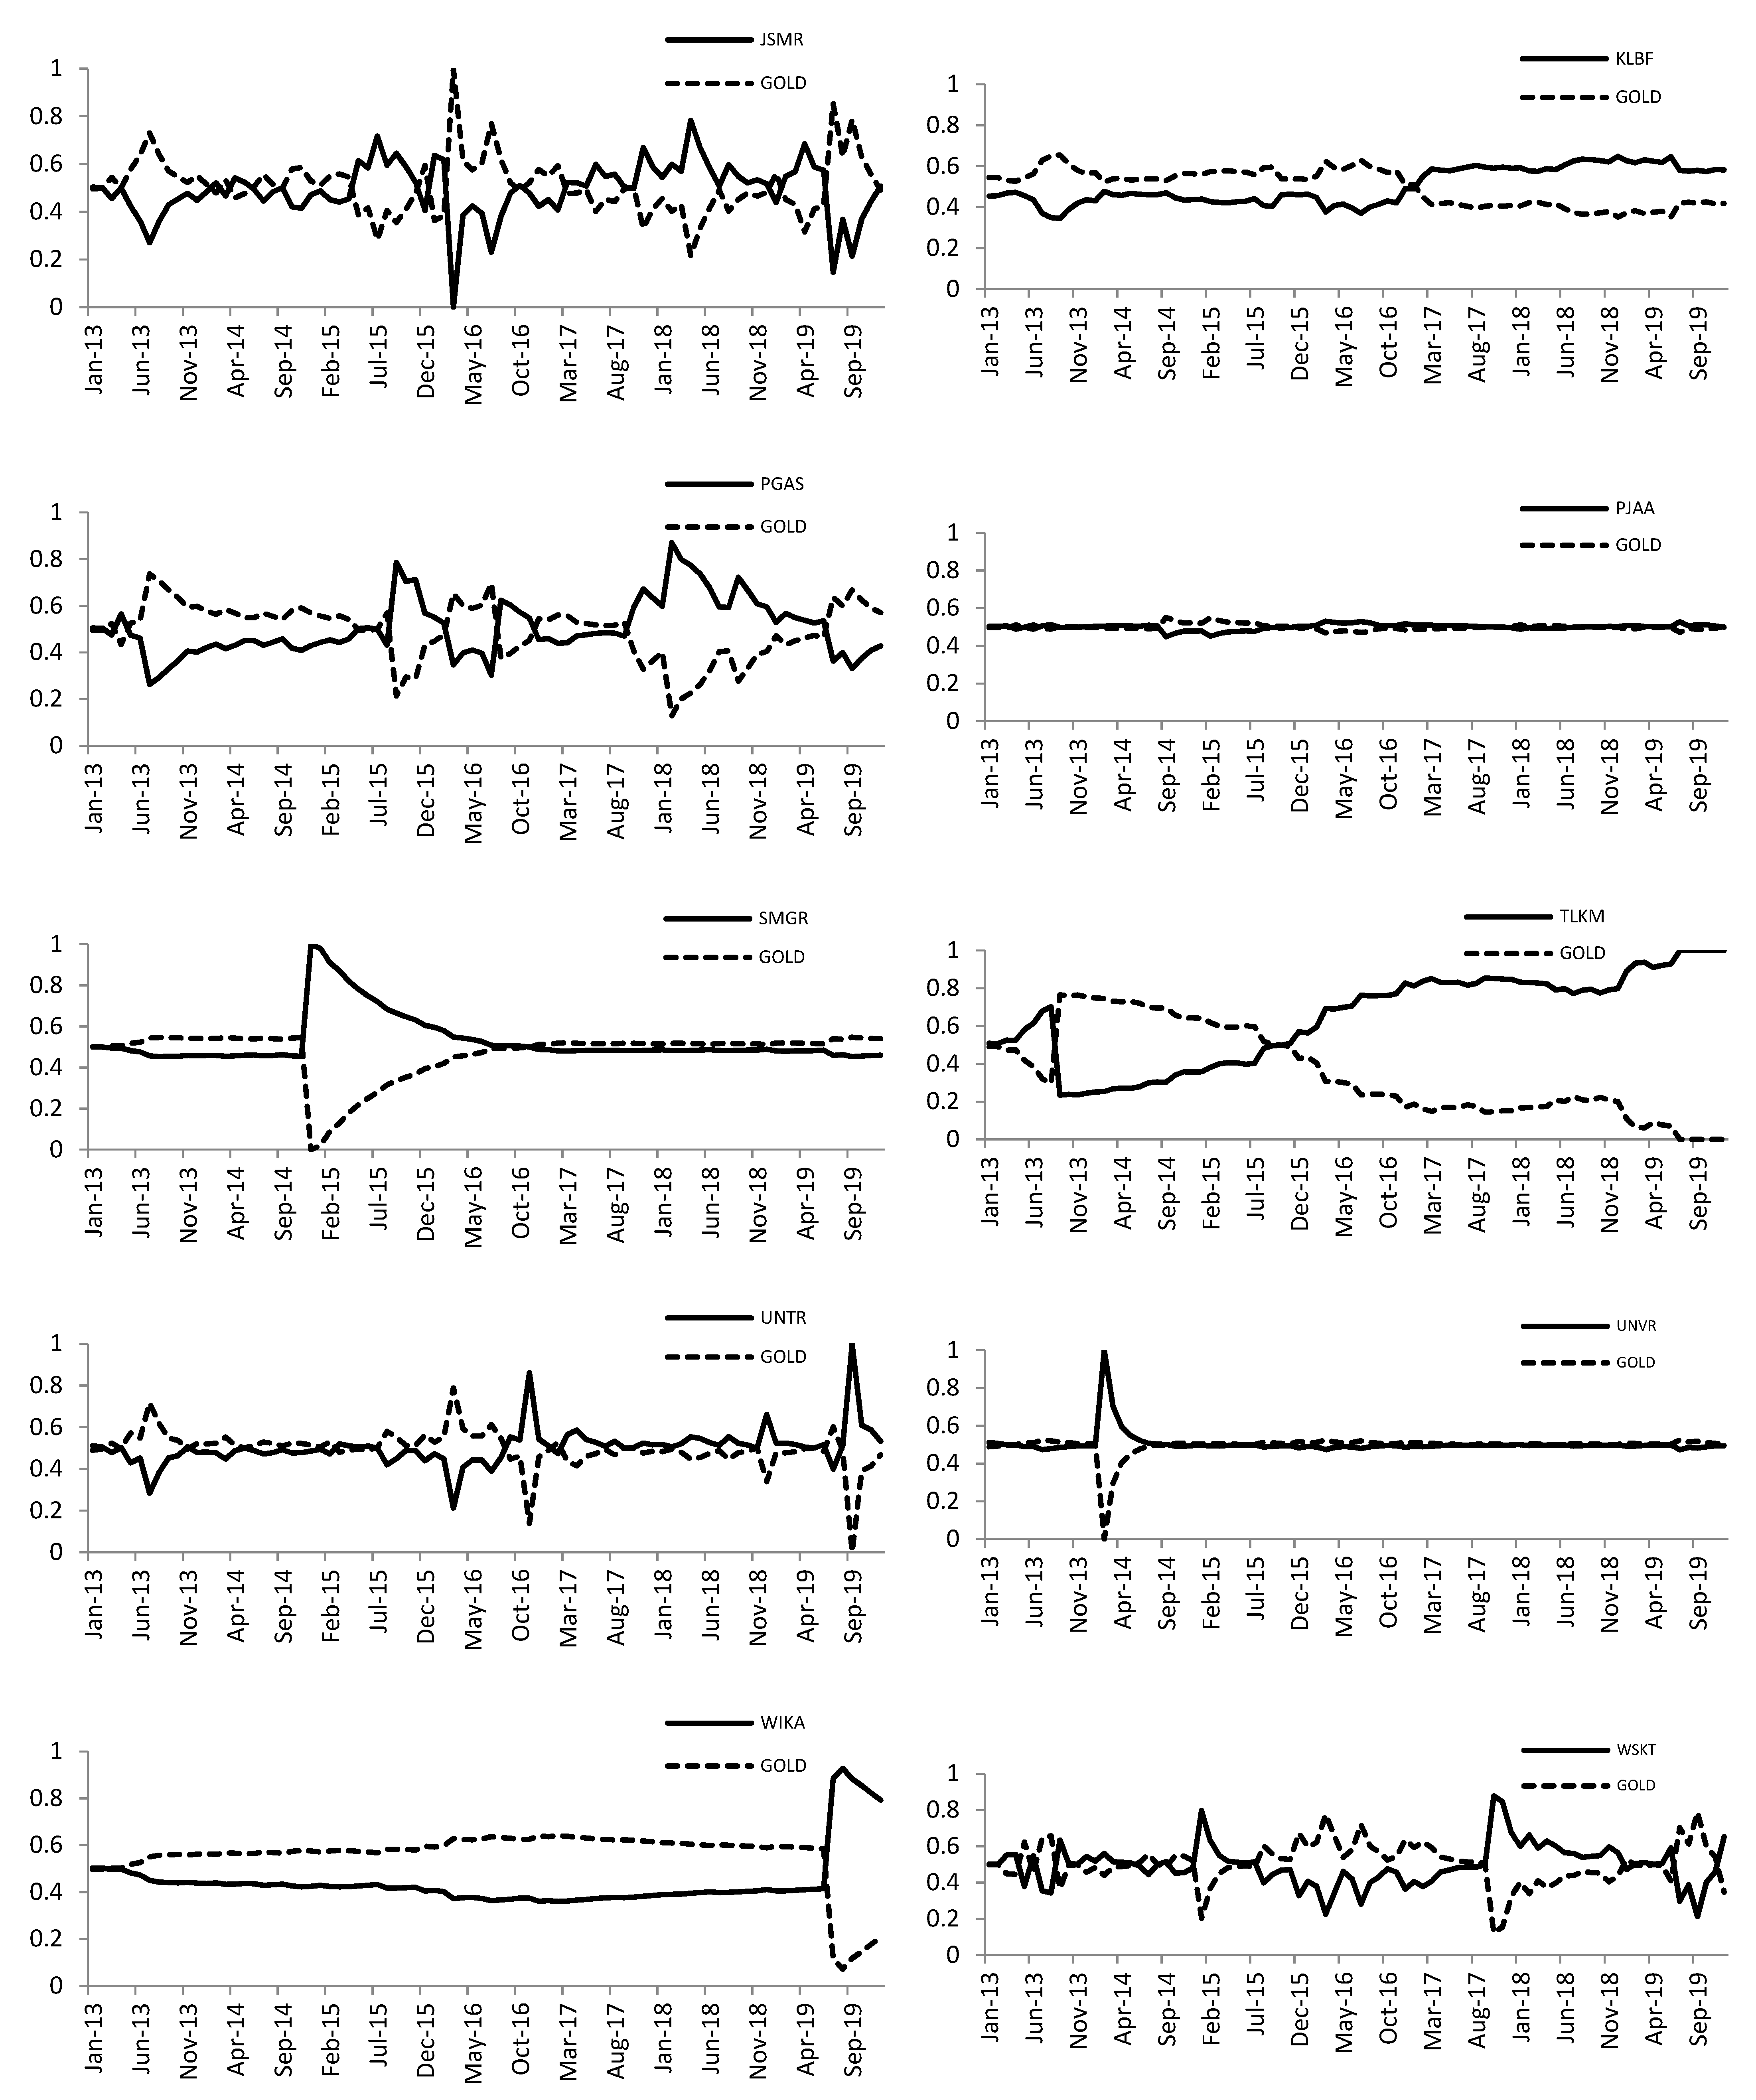
Based on the dynamic portfolio carried out between the SKI stocks and gold (
Figure 4), it can be inferred that the largest weight of portfolio for gold was 100 percent (JSMR stock); the largest weight of portfolio for SRI stocks was 100 percent, which occurred on AALI, ASII, BBCA, BBNI, BMRI, SMGR, UNTR, and UNVR. Additionally, the highest volatility of the dynamic weight is in the banking sector, such as BBRI. Meanwhile, the tourism, restaurant, and hotel sector (PJAA) has the lowest volatility of time-varying weight between gold and the stock.
Following
Baur and Lucey (
2010), this paper identifies the role of gold as a diversifier, hedge, or safe haven. A diversifier is when an asset is positively related to another portfolio on normal market conditions. An asset is used as a hedging factor when the asset has a negative relationship with another portfolio on a normal market situation. Moreover, a safe haven is when an asset has a negative relationship with another asset in a severely volatile market.
Table 8 shows the result of OLS regression. The OLS result indicates the normal market condition. The sum of the coefficients (c and RetSKI) in OLS is positive, implying that gold is a diversifier for SKI under normal conditions. Meanwhile, the sums of the coefficients (c and RetSKI) in the lower percentile (extreme turmoil market) are negative, indicating that gold is a safe-haven investment for SKI. However, since the coefficients of RetSKI are not significant on percentile 0.2 and 0.1, the safe-haven property of gold is weak for SKI. Based on this result, H1 is accepted. Furthermore, this result is consistent with
Robiyanto (
2018a), who used the JII as a proxy of another ethical investment. Additionally, the negative relationship between gold and SKI stocks in Indonesia is in line with
Al-Ameer et al. (
2018).
Another sensitivity analysis is that the authors use the JII as another proxy of sustainable investment. The main difference between SKI and JII is that JII does not allow conventional banking to be included in the index.
As seen in
Table 9, the portfolio, which consist of the JII with gold, can reduce the risk by around 12.27% based on its value of hedging effectiveness, which is 0.1227. The portfolio created using the JII with gold can produce an average monthly portfolio return of around 0.0008, with a standard deviation around 0.0312. Even though the average portfolio returns tend to be lower than the JII average return (0.0023), the portfolio return is larger than the gold’s average return, which is −0.0003.
The standard deviation of the portfolio is around 0.0312, which is lower than the JII stocks and gold alone, respectively. In other words, the inclusion of gold in the portfolio can reduce equity risk. The Sharpe ratio of the portfolio is −0.1387. It shows that the portfolio could produce better performance than gold alone, which produces a Sharpe ratio of around −0.1321. Unfortunately, it was lower than the JII performance with a Sharpe ratio of around −0.0782. This result is similar to the result in
Table 5. Hence, this research has shown robust evidence that gold can reduce risk when included in the sustainable/ethical stocks portfolio in Indonesia.
6. Conclusions
The purpose of this research is to formulate a portfolio from sustainable investment and gold. This research could fill some gaps in several previous findings in some ways as the investigation of using gold paired with ethical stock in the portfolio is scarce in the literature. This study has found robust evidence that a dynamic portfolio consists of sustainable or ethical investment and gold can produce lower risk compared to sustainable investments or gold only. This proves that the insertion of gold into the ethical stocks portfolio could lower the total risk. However, in this study, the result shows that the risk is not accompanied by better portfolio performance in terms of the Sharpe ratio. Moreover, the dynamic portfolio can produce better performance than investment in gold only during the research period. This result also implies that gold can be regarded as an instrument that could reduce investment risk if involved in a portfolio formed from ethical or sustainable investments.
Moreover, the OLS regression result shows that, under normal market conditions, gold can be used as a diversifier for sustainable investment in Indonesia. Additionally, gold can be regarded as a weak safe haven under extreme market turmoil. Furthermore, the hedge ratios of SKI stocks indicate that gold is a relatively cheap hedge. The practical implication of this study is that the formulation of a dynamic portfolio can significantly reduce risk at the expense of returns. This implies that both institutional and individual investors that prefer ethical and sustainable investments can use the dynamic approach to produce portfolios combining stocks and gold. Overall, this study supports some previous studies, such as
Chua et al. (
1990);
Hillier et al. (
2006);
Hoang et al. (
2015); and
Robiyanto et al. (
2019b).
The limitations of this study lie in the limited sample size and short time-frame; therefore, future studies are recommended to use a larger sample or time frame. Additionally, since DCC-GARCH and linear quantile regression are not able to capture the fat tail distribution, non-linear regression is recommended to be utilized. It is highly recommended that further research could exploit the possibility of using the combination approach proposed by
Amendola et al. (
2020) to evaluate the benefits coming from portfolios of stocks and gold.


 ,
, 


