Article

Motivation and Sense of Belonging in the Large Enrollment Introductory General and Organic Chemistry Remote Courses

Department of Chemistry, Duke University, Box 90346, 124 Science Drive, Durham, NC 27708-0346, USA
*
Author to whom correspondence should be addressed.
Educ. Sci. 2021, 11(9), 549; https://doi.org/10.3390/educsci11090549
Submission received: 13 August 2021 / Revised: 5 September 2021 / Accepted: 12 September 2021 / Published: 16 September 2021

Abstract

:
The rapid shift from face-to-face to remote instruction in 2020 has resulted in recalibration of lecture and laboratory pedagogy. This research analyzed the impact of remote learning on student motivation and sense of belonging in large enrollment chemistry courses. Student responses were parsed according to specific demographics including gender, academic standing, first-generation status, and ethnicity. Research objectives included the analysis of how remote learning impacted specific demographics to develop guidelines for best practices moving forward for hybrid or online courses. Our findings show that second year students (sophomores) were the most impacted of the academic standing cohorts. Sophomores reported a statistically greater change in motivation after the start of the semester and statistically lower satisfaction with their performance on assignments. Females reported statistically lower motivation and a statistically lower sense of belonging in the course and science, technology, engineering, and mathematics (STEM) fields. Black/African students reported a statistically lower motivation for remote learning than Asian/Pacific Islander and White/Caucasian students. Finally, both White/Caucasian and Black/African students reported a statistically lower sense of belonging in the course and in STEM fields than Asian/Pacific islander students. Finally, statistical differences were not observed based upon first-generation status. The research indicates that students were differentially impacted by the shift to remote learning. From these findings, a stronger understanding of how specific demographics are differentially impacted by remote learning in STEM courses is provided, granting greater insight into best practices moving forward.

1. Introduction

The COVID-19 global pandemic demanded significant recalibration of pedagogy for online instruction. The far-reaching effects of COVID-19 on science and chemistry pedagogy can be seen in the growing body of literature addressing efforts to adapt and recalibrate instructional norms. Remote instruction required developing new paradigms for teaching laboratory [1,2,3,4,5], promoting student engagement on zoom [6,7,8,9], assessing student performance [10], and sustaining community in synchronous and asynchronous classrooms. The laboratory development focused upon developing kits to do hands-on experiments at home [1], demonstrating experiments using videos coupled with zoom discussions [2], implementing software designed to illustrate laboratory techniques [3], converting laboratory projects to online experiences [4], and developing virtual reality experiments to mimic actual laboratory activities [5]. Research [9] assessed the impact of remote learning on student engagement in the classroom which, as expected, revealed traditional lectures were less engaging on zoom. Strategies for incorporating active learning [6,8] remotely via zoom and other platforms were identified while methods for boosting engagement in an asynchronous environment were explored in other articles [7]. The pedagogy research provided insights into best practices in lecture and laboratory. Given the impacts on both modes of science learning, there was a demand to recalibrate assessment strategies [10] given that traditional exams were no longer feasible.
Prior to 2020, best practices for hybrid and online learning for science education had already developed substantial scholarly conversation. Wladis et al. [11] reported two studies with notable findings prior to COVID-19 and the complete transition to online learning. Before the pandemic, students in these studies opted to do online learning. Wladis et al. [11] analyzed demographics associated with students who prefer online learning in lieu of traditional lectures and reported that female science, technology, engineering, and mathematics (STEM) majors had a statistically greater preference for online learning than males. However, Black/African and Hispanic/Latinx students were statistically less likely to enroll in online courses.
Deci and Ryan [12,13,14] outlined the Self Determination Theory, which centers upon human motivation, development, and wellness. These theories have been analyzed in several contexts, and the theories have evolved. A 2009 paper by Niemiec and Ryan [15] identified three factors, competence, autonomy, and relatedness, that impact students’ classroom motivation. Competence is linked to the perceived quality of work, autonomy is linked to the feeling of having control of learning and the environment, and relatedness is linked to the social aspects such as interactions with others. This research will expand upon Deci and Ryan’s findings by analyzing motivation in more online learning environments. In remote classrooms, students may have less opportunity to engage in discussions, ask questions, and work with peers. This research will analyze perceived motivation as a result of the shift in the classroom environment and potential limitations in autonomy and relatedness.
Yu [16] analyzed the relationship between academic standing and performance during the pandemic. The research reported that student performance and experience improved with advances in academic standing, that is, graduate students performed better in an online environment than undergraduate students. Artino et al. [17] and Bradley et al. [18] also confirmed that self-regulated skills increased with academic standing [17] and that such skills are essential in a remote classroom [18]. This research builds upon Yu’s findings by expanding the scope to include statistical comparisons with academic standing and motivation and sense of belonging metrics.
Motivational changes and feelings of isolation (or not belonging) are directly correlated with mental health problems [19]. Since COVID-19, research in remote learning has expanded to recalibrate existing findings to consider the effect of mandatory remote learning on students. Specific factors analyzed include the effect of online learning on mental health [20,21,22,23]. Wang [20] and Huckins [23] reported significant increases in moderate to severe levels of depression in undergraduate students. In Wang’s study [20], 48% of 2031 participants reported signs of moderate to severe depression. In Huckins’ study [23], behavior was assessed; students were more anxious, more sedentary, and spent more time on social media. Al-Tammemi [21] analyzed the psychological impacts of COVID-19 on university students using the Kessler Psychological Distress Scale (K10). Of the 381 students included in the survey, 209 reported having no motivation for distance learning, 265 reported having severe psychological distress with females reporting a statistically greater psychological distress than males, and 209 reported that their online studies were their most serious concern. Son [22] reported 82% of students expressed significant concern and anxiety regarding their academic performance. The relationship between mental health and motivation can be used to explain some correlations observed with a decrease in motivation; however, it is an oversimplification to say that all changes in motivation are completely correlated with mental health issues.
Aucejo et al. [24] analyzed the impacts on remote students based upon socioeconomic factors. Out of the 1500 students surveyed, lower income students reported having less time to spend studying for classes and were 55% more likely to have a delayed graduation. Additionally, health related issues from COVID-19 were reported in a higher frequency with lower income students. Youmans [25] outlined strategies for addressing stress, motivation, and mental health in a general chemistry course at a small private university and argued that instructors should provide flexibility with regard to attendance in lecture and deadlines for homework assignments. However, the article included no demographics and did not assess measurements of motivation and belonging.
This manuscript expands upon the research noted above by focusing on general and organic chemistry. Chemistry is often regarded as a “weed-out” or barrier course by most students [26]. Given this existing perception, research is needed to identify what barriers were presented in remote learning and what factors we must consider moving forward. The research findings focus on the impact of the learning environment and the associated impact on motivation and sense of belonging, rather than performance. Based upon prior research briefly outlined above and prior research in traditional classroom environments, academic standing [16], first-generation status [24], ethnicity [27], and gender [11,28] are identified as key demographics to analyze in the study. Two studies noted below motivated the incorporation of ethnicity and gender. Historically, African American students have consistently reported lower motivation and sense of belonging in STEM courses at predominantly white institutions across the United States [27]. According to Dasgupta et al. [28], females’ lower self-confidence, lack of motivation, and lower sense of belonging in STEM is influenced by the learning environment and stereotypes characterizing STEM disciplines as better suited for male students. Given that learning environment was specifically mentioned and the unique transition posed by online learning, gender was included as a key demographic that needs exploration. The goal of the study is to enhance the body of literature regarding how online learning has impacted students in the chemistry classroom. This is particularly important given that many institutions are still using either fully remote or hybrid classroom environments. The research findings will provide insight into strategies and best practices for moving forward with classes—particularly with the increased interest in potentially reforming undergraduate education to include more hybrid classes [29,30].
Five research questions (RQ) were probed in this study:
  • Research Question 1: To what extent are statistical differences observed with academic standing and motivation or sense of belonging?
  • Research Question 2: To what extent are statistical differences observed with first-generation status and motivation or sense of belonging?
  • Research Question 3: To what extent are statistical differences observed with gender and motivation or sense of belonging?
  • Research Question 4: To what extent statistical differences observed with race/ethnicity and motivation or sense of belonging?
  • Research Question 5: What are the advantages and disadvantages of remote learning?

2. Materials and Methods

a.
Participants
The research study was reviewed and exempted by the institutional review board (protocol number 2021-0181). Students in one of the four large enrollment chemistry courses were invited to participate in the study. Students received details of the goals and objectives of the research study and were asked to opt in or out of having their responses included in the data analysis. Because of restrictions in collecting data, only data for students residing in the United States at the time of the survey were included in the data analysis. Only data from students who were 18 years or older at the time of the survey were included in the analysis.
b.
Survey Design
A Qualtrics survey was developed to collect student responses. The demographic information collected in the study included: gender, race, national or international status, intended major, socioeconomic status, and academic standing. The demographic information was first collected in the survey and a sequence of items with Likert ratings (on a scale of 1–3, 1–4, or 1–5) were used to gauge motivation, perceptions of the workload, satisfaction with their performance, and sense of belonging. The verbal range of items for the Likert scale was developed first as a group and from these discussions, the items were converted to three-, four-, or five-point Likert ratings. The survey concluded with three open-ended items that allowed students to reflect upon the advantages and disadvantages of online learning and provide comments regarding facts or issues they wished their professor knew. The full 49-item survey is provided as a supplemental file.
c.
Data Collection
The research study was administered in weeks 10 to 13 of the semester. A total of 283 responses were included in the analyses. The large enrollment chemistry courses were targeted for analysis to collect a large pool of aggregate data to provide insight into student experiences in the service curriculum. The demographic composition of the participants is summarized in Table 1 below:
d.
Data Analysis
A control question was added to the survey that instructed students to mark box B. The control question was added to ensure students were reading the survey questions and not randomly clicking items. Data was discarded from participants who failed to answer the control item successfully.
Statistical comparisons between Likert Ratings and demographic metrics were determined using an independent t-test. Tests for normality were proven using Q-Q plots [31] and by analyzing the distribution of data points. Using the Central Limit Theorem (CLT) to gauge statistical power, only groups with 30 or more data points were included in the analysis [32]. The statistical analyses were completed using StatsPlus. More specific details were collected for students who reported more than one race but a group of 30 participants was not identified, and was therefore not considered for the analysis following guidance from CLT. From the Q-Q plots and restrictions, the parametric t-test was implemented.
Analysis of Variance (ANOVA) was used to compare students’ change in motivation and satisfaction with their work and for comparing hours spent on coursework by demographic. The open-ended responses were coded by identifying key words or phrases in the statements. The associated bar charts with the coded responses were created using Tableau.
e.
Reliability Coefficients
Alpha and omega total reliability coefficients were computed to be 0.75 and 0.81, respectively, using the R statistical package. Both alpha and omega were calculated based upon existing research that indicates specific limitations in the reliability of alpha coefficients [33,34]. The computed coefficients were deemed acceptable.

3. Results

The results are organized based on responses to student motivation, sense of belonging, and the open-ended survey items. These items represent the three areas probed by the survey. Section 3.1 outlines correlations with questions related to motivation, Section 3.2 outlines correlations with sense of belonging, and Section 3.3 outlines students’ open-ended responses regarding their experiences with online learning.

3.1. Correlations with Student Motivation

Student motivation was assessed using four survey items as outlined in Table 2 below. The questions probed motivation directly and assessed how motivation has changed during the semester. Questions regarding satisfaction with assignments and perceived workload were also included. Specifically, a question addressing work satisfaction and change in the level of motivation was included because motivation may be directly impacted by the perceived benefit (or satisfaction with the work submitted). A statistical difference was observed (F = 16.7, p = 0.000) when comparing work satisfaction with the four categories for change in motivation (Greatly Decreased, Somewhat Decreased, Neither Decreased nor Increased, and Somewhat Increased). None of the participants reported that their motivation greatly increased compared to the beginning of the semester. Students who reported that their motivation has greatly decreased since the start of the semester also reported a statistically lower satisfaction with the quality of their work.
The data in Table 2 supports the idea that students had average motivation at the time of the survey, but the majority reported a decline in motivation since the start of the semester. An average score was reported for the satisfaction with work completed. Finally, the majority of participants felt their motivation level would have been higher in a face-to-face setting.

3.1.1. Academic Standing and Motivation

To gauge student responses based on their prior college experience, academic standing was correlated with the survey items related to motivation. Participants with a junior (third-year) academic standing were not included in the statistical analyses because there were fewer than 30 responses. Figure 1 summarizes the average responses for each motivation item by academic standing. Table 3 outlines the statistical comparison of the motivation items with academic standing. No statistical difference was observed between the levels of motivation at the time of the survey, but statistically significant differences were observed between sophomores and other academic standings with respect to change in motivation, satisfaction with work, and motivation in online vs. in-person courses. Sophomores reported a lower satisfaction with work, a greater decline in motivation, and perceived they would have greater motivation with in-person classes.

3.1.2. First-Generation Status, Gender, and Motivation

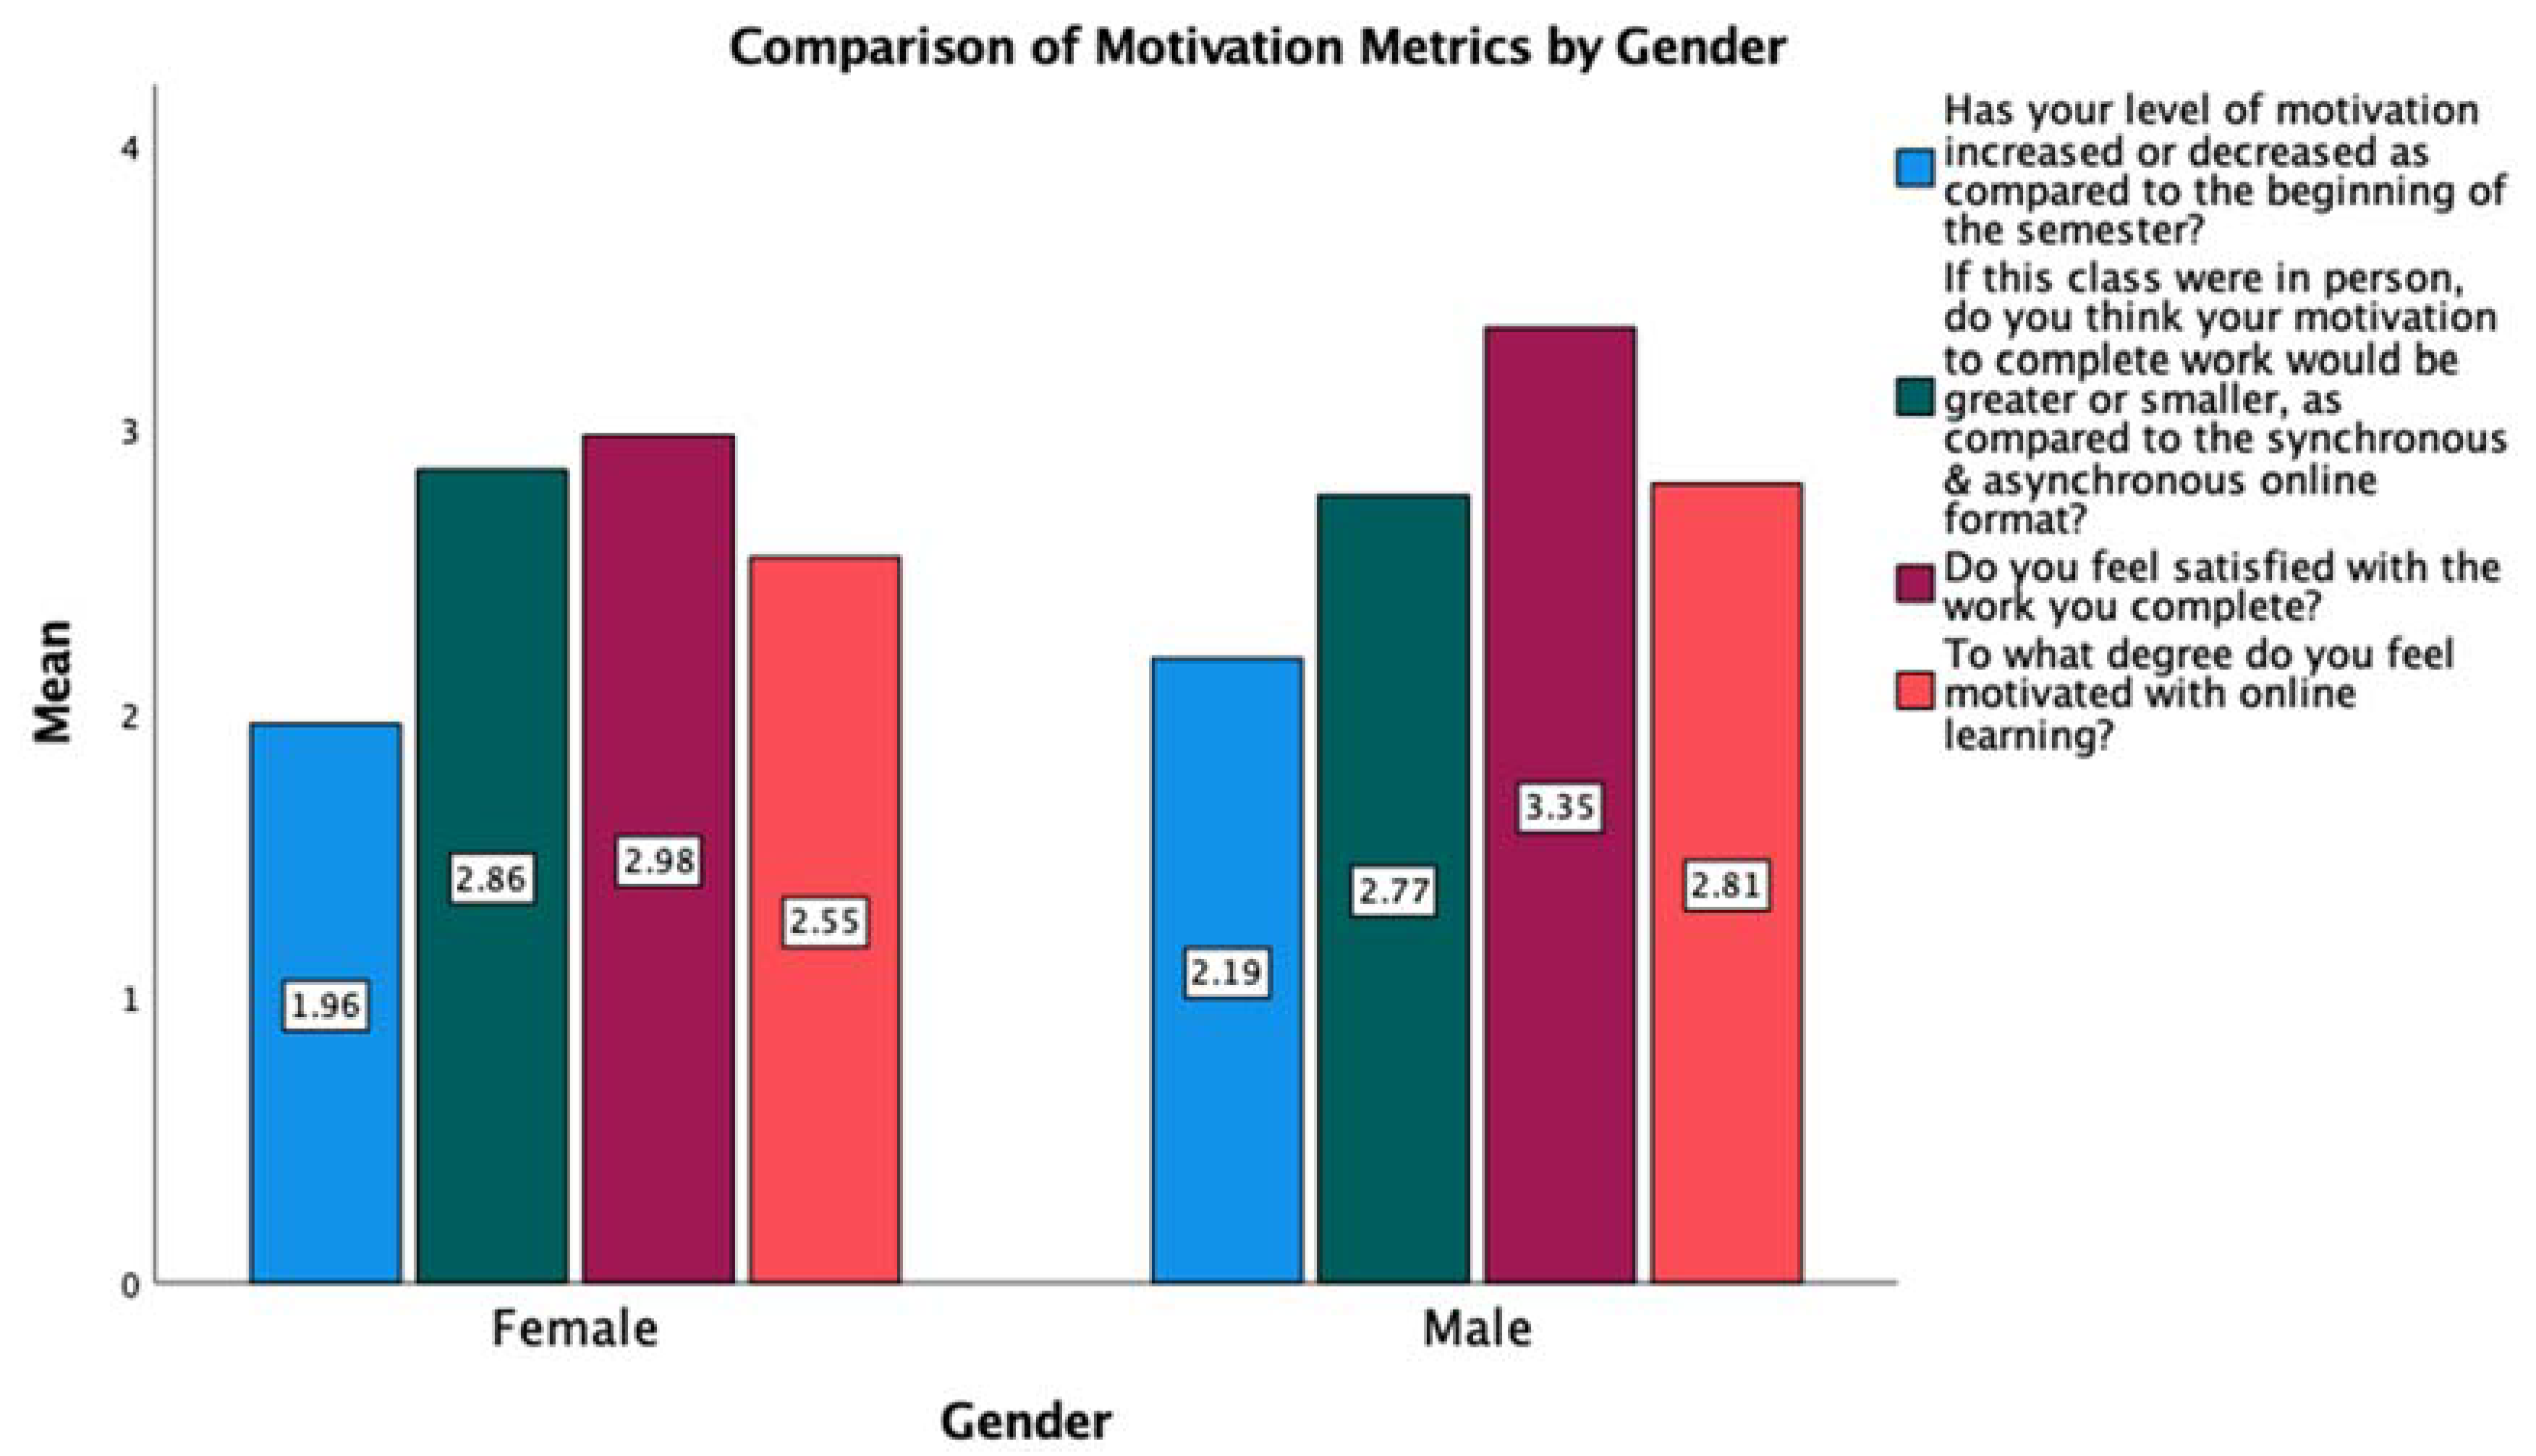
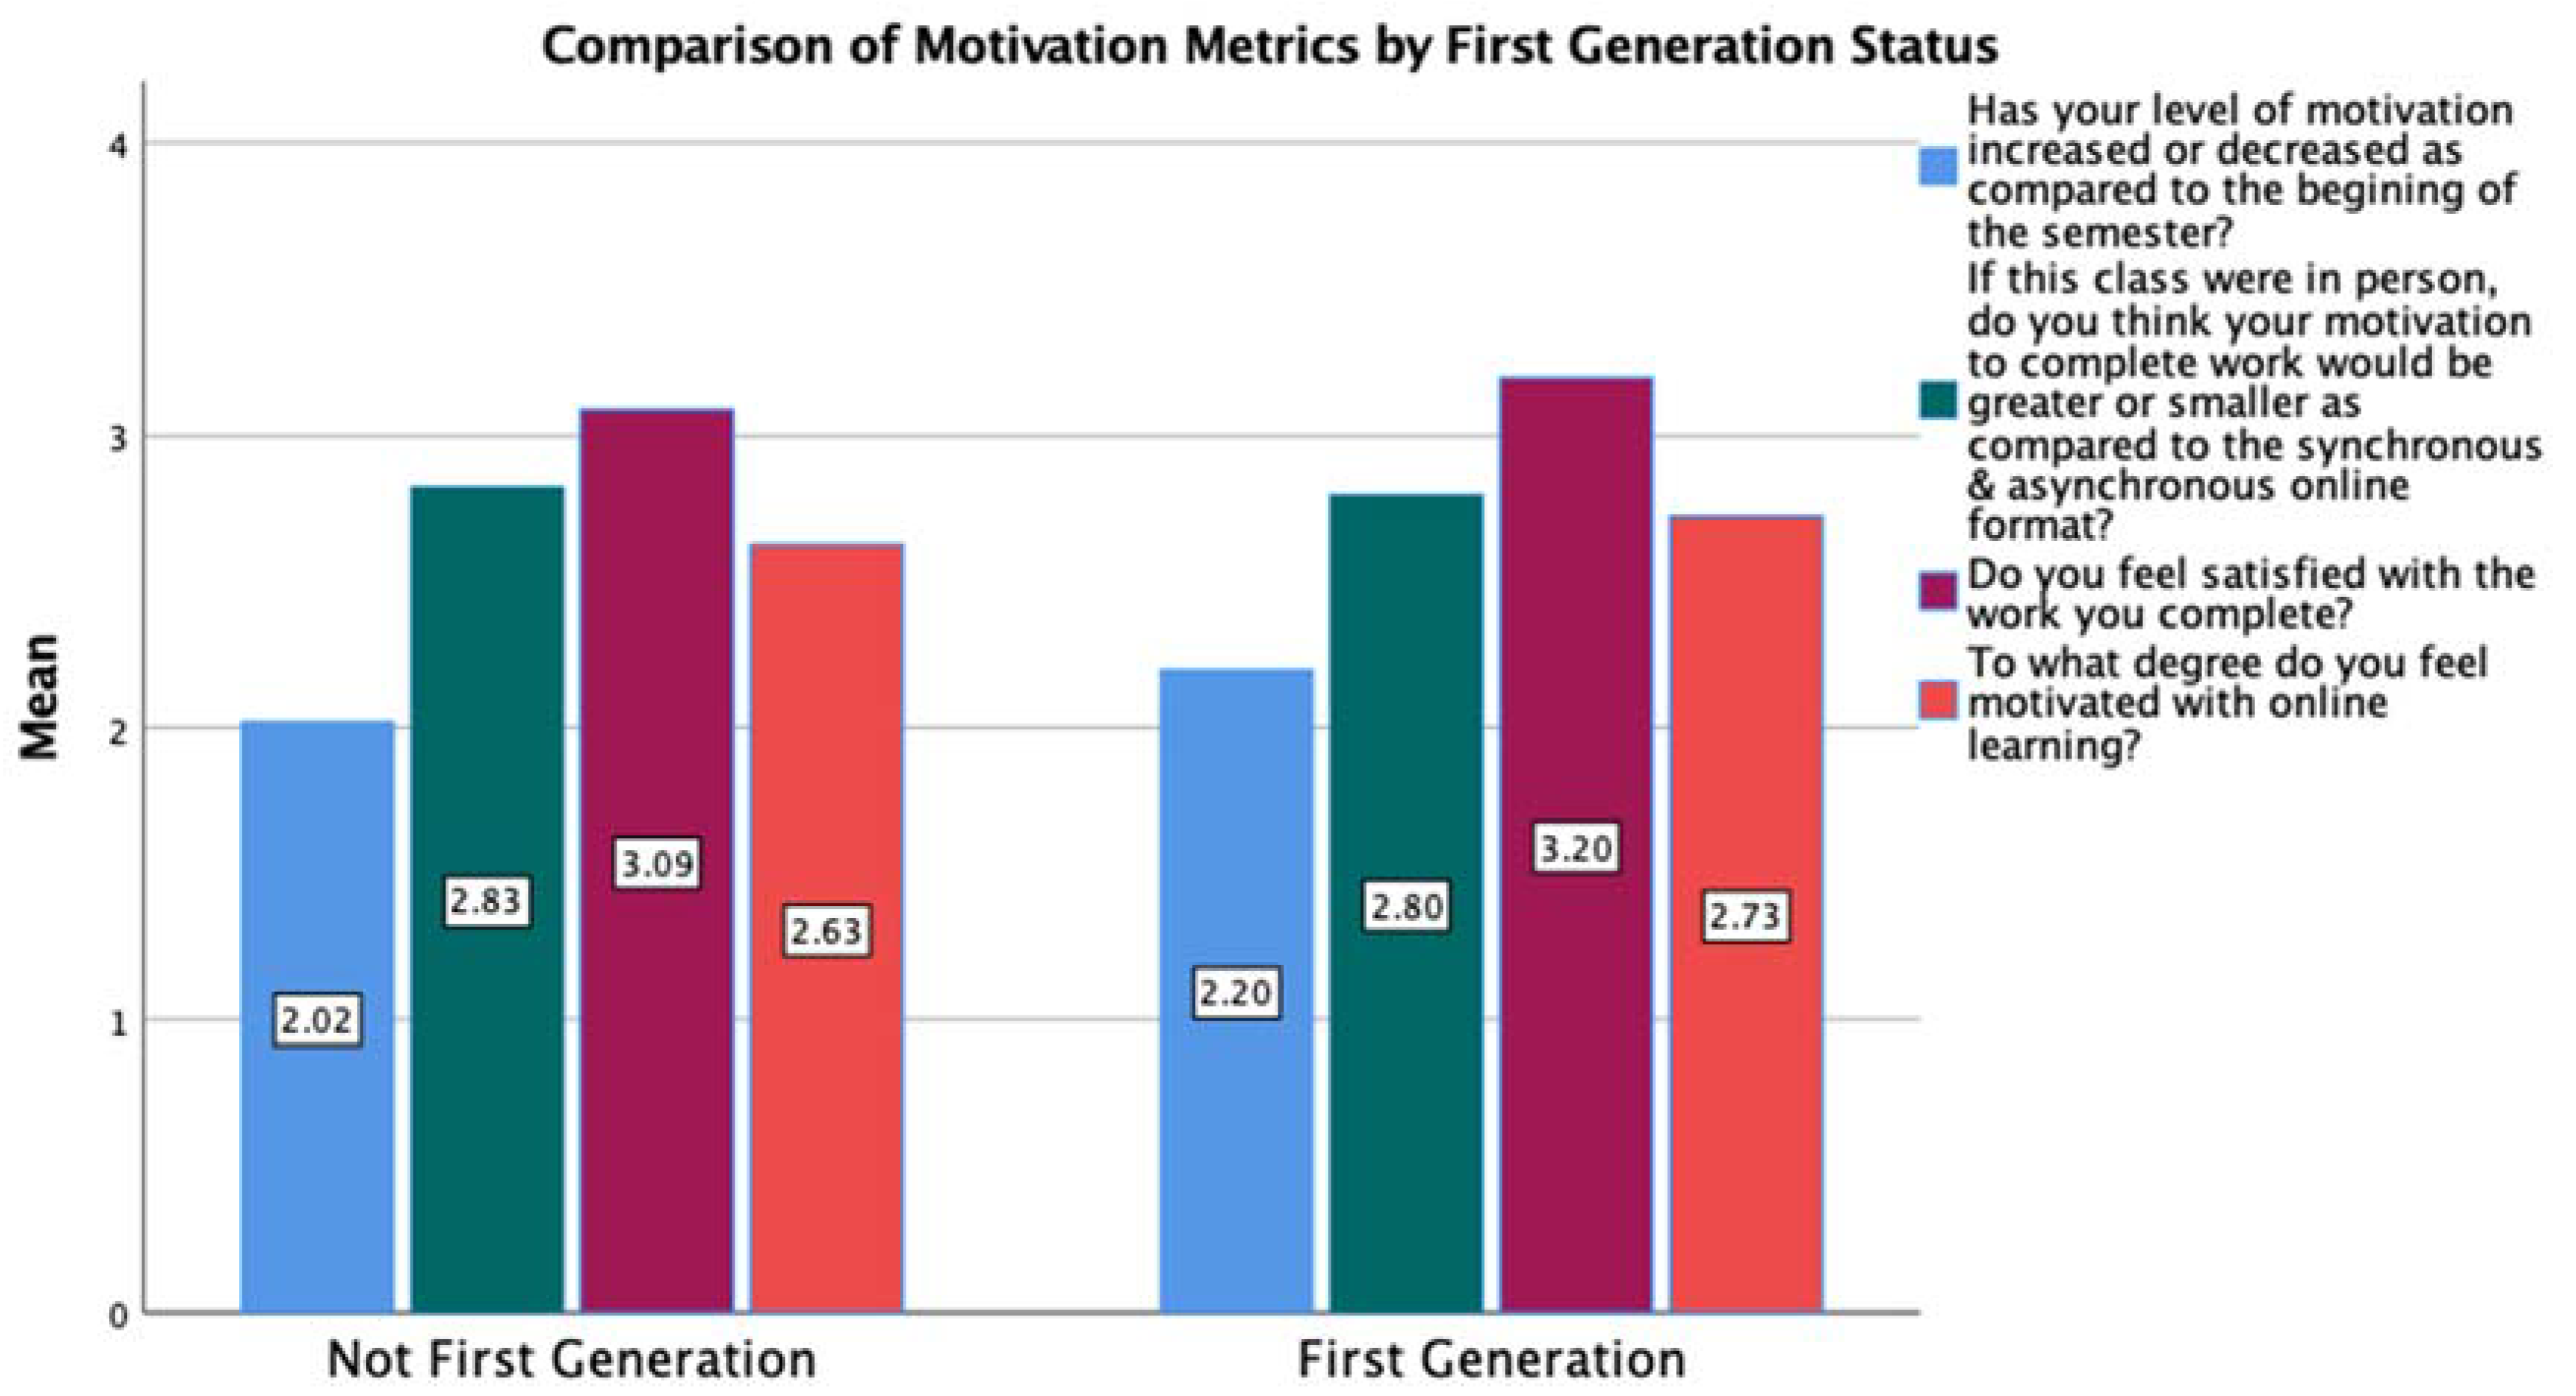
Figure 2 and Figure 3 summarize the average responses for each motivation item by gender and first-generation status. Table 4 outlines the statistical comparisons of first-generation status and gender with the motivation survey items. There were no statistical differences, using a 95% level of confidence, observed with any of the motivation items based upon first-generation status. In comparing gender, females reported statistically lower levels of motivation, statistically greater decreases in motivation since the start of the semester, and statistically lower satisfaction with their work. There was no difference observed between perceived level of motivation based upon whether the course had been taught in an online versus in-person format.

3.1.3. Ethnicity and Motivation

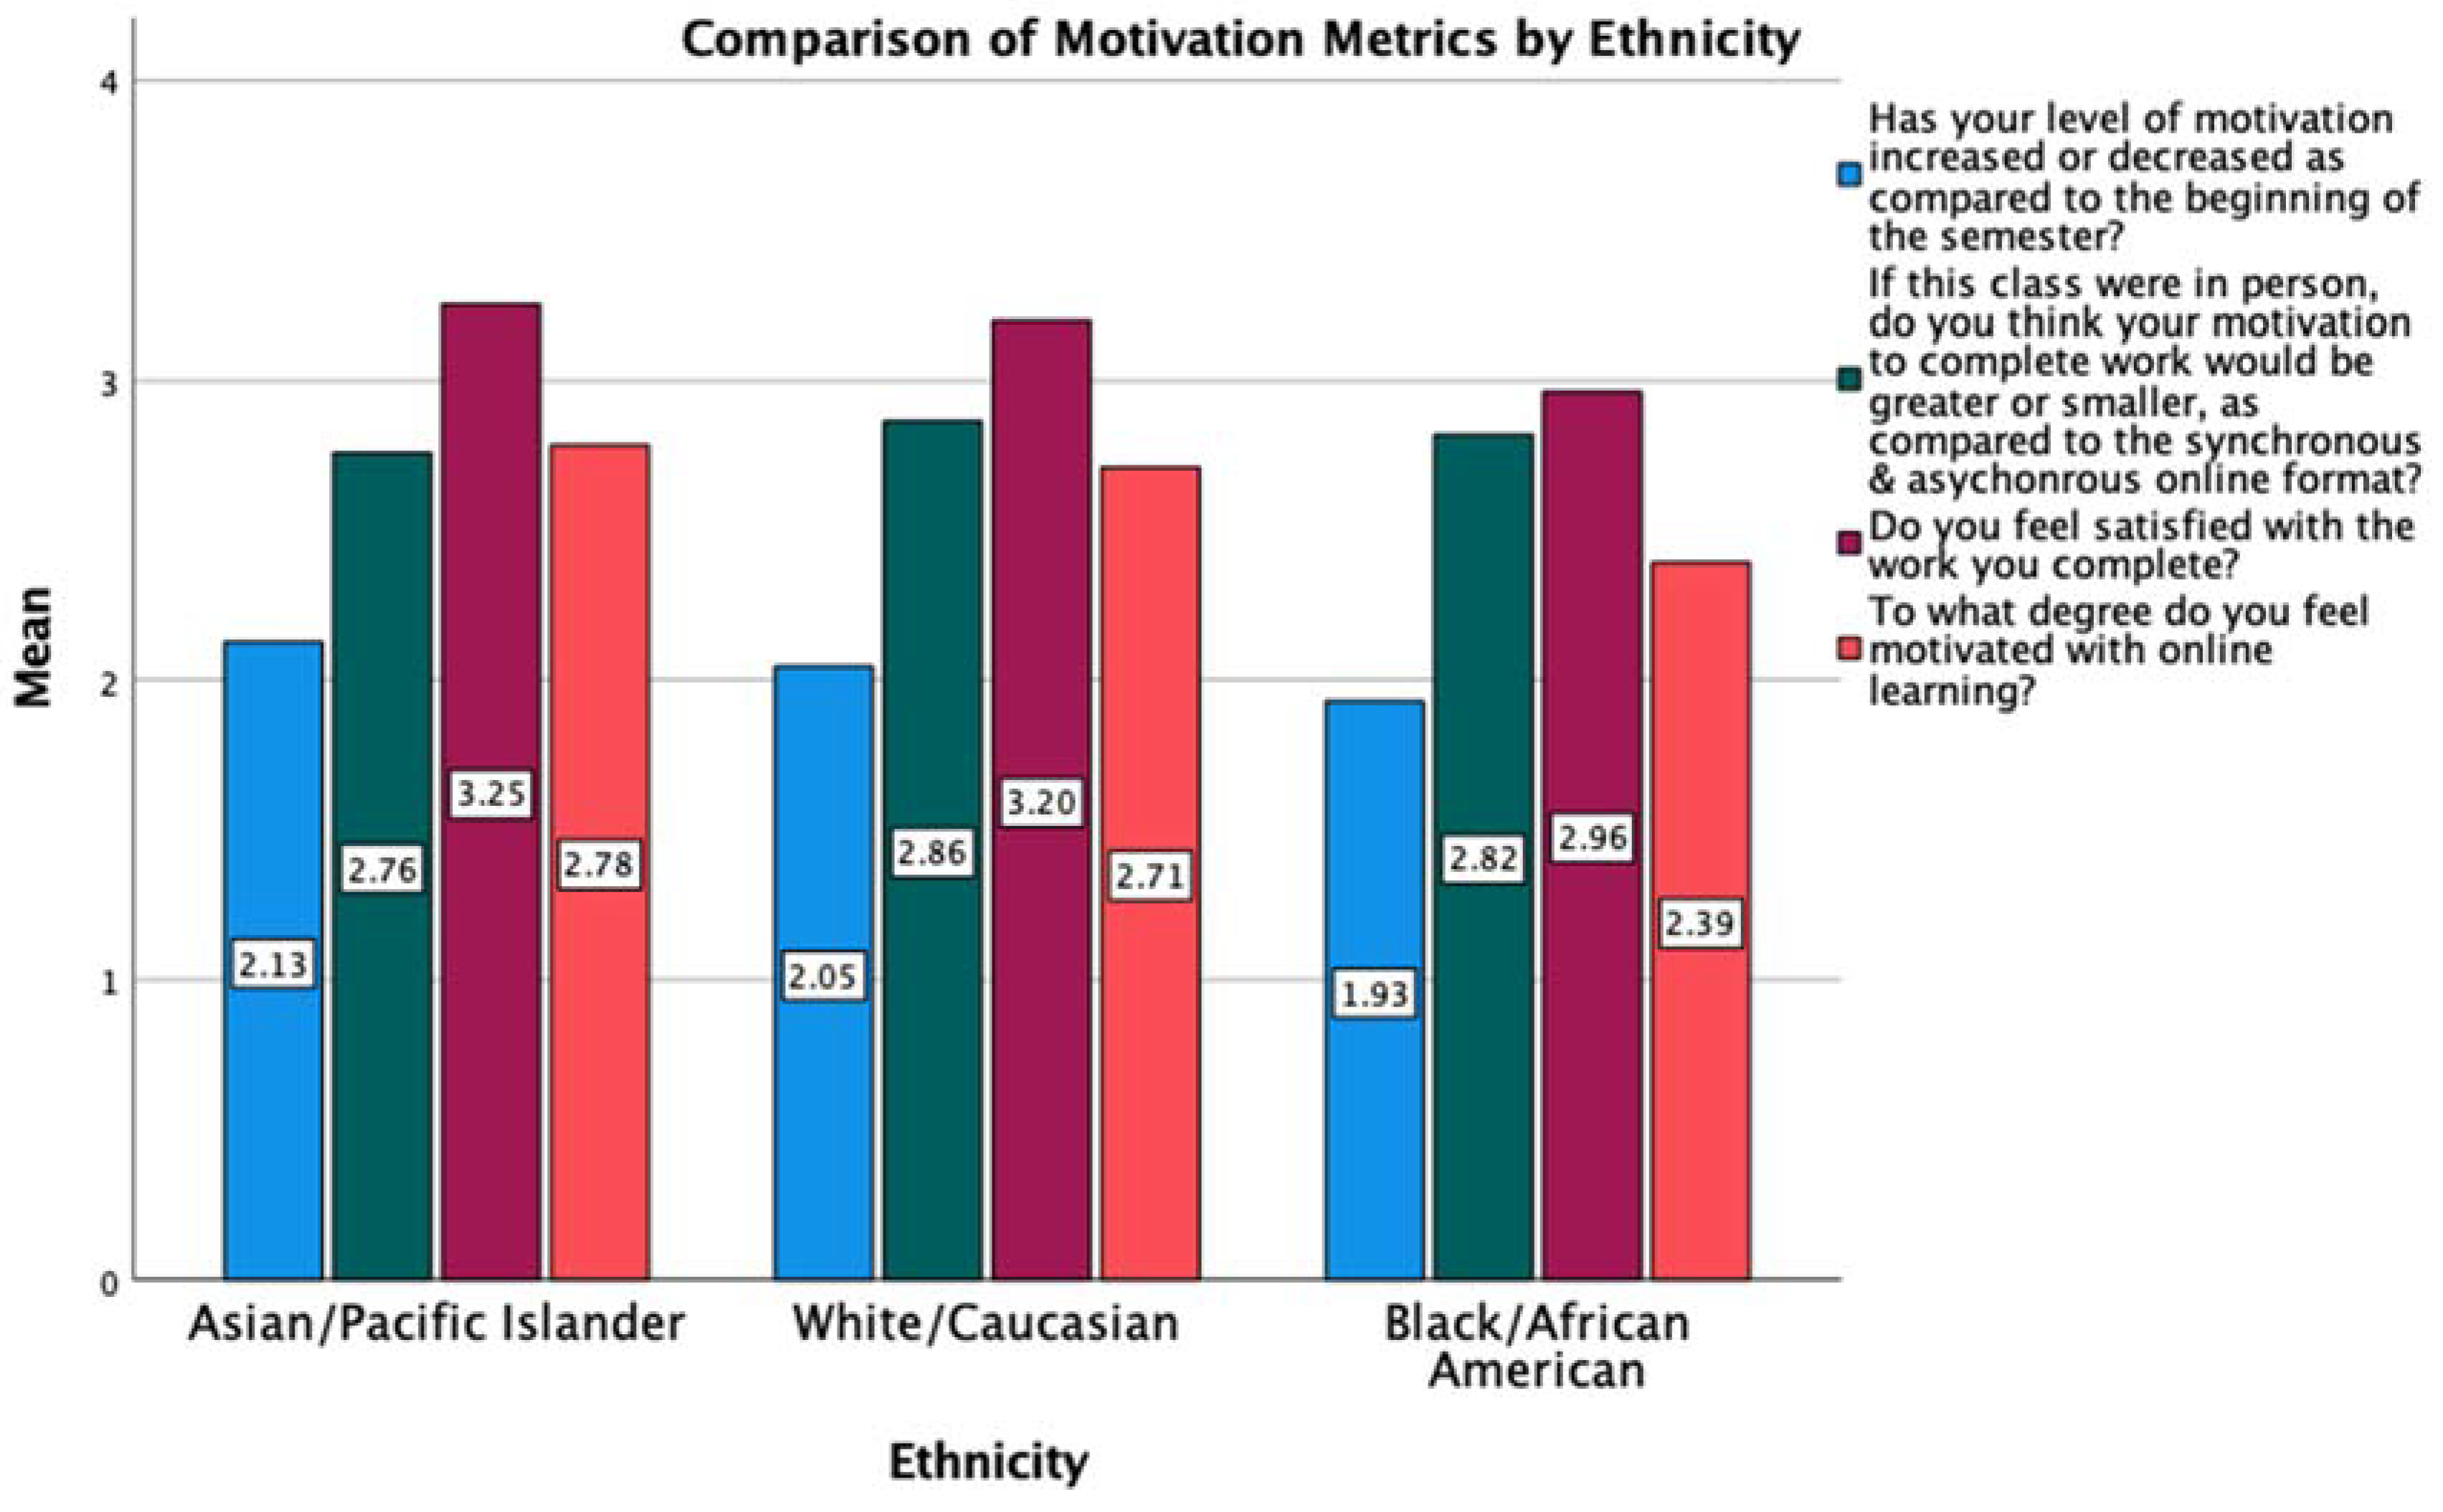
In comparing ethnicity and the motivation survey items, Asian/Pacific Islander, Black/African, and White/Caucasian were included in the analyses. There were fewer than 30 data points for participants reporting other ethnicities. Only one statistical difference was observed in the analyses. Black/African students reported having a statistically lower motivation than Asian/Pacific Islander students when the survey was administered. Figure 4 provides a graphical comparison of the motivation items with ethnicity. Table 5 outlines the statistical comparisons of ethnicity with the motivation survey items.

3.2. Correlations and Sense of Belonging

Four survey questions were designed to probe students’ sense of belonging in the course and STEM as well as their interactions with the professors and classmates. Table 6 summarizes these findings. Sense of belonging in STEM received the highest marks and both interactions with the professor and interactions with classmates received less than average ratings.

3.2.1. Academic Standing and Sense of Belonging

The transition from in-person to remote learning impacted all students, from first-year college students to senior undergraduates. Figure 5 summarizes the mean values for the belonging survey items by academic standing. Statistical comparisons between academic standing and each of the sense of belonging survey items are provided in Table 7 below. Sophomores reported a lower sense of bonding with classmates but the difference was not statistically significant using a 95% level of confidence.

3.2.2. First-Generation Status and Sense of Belonging

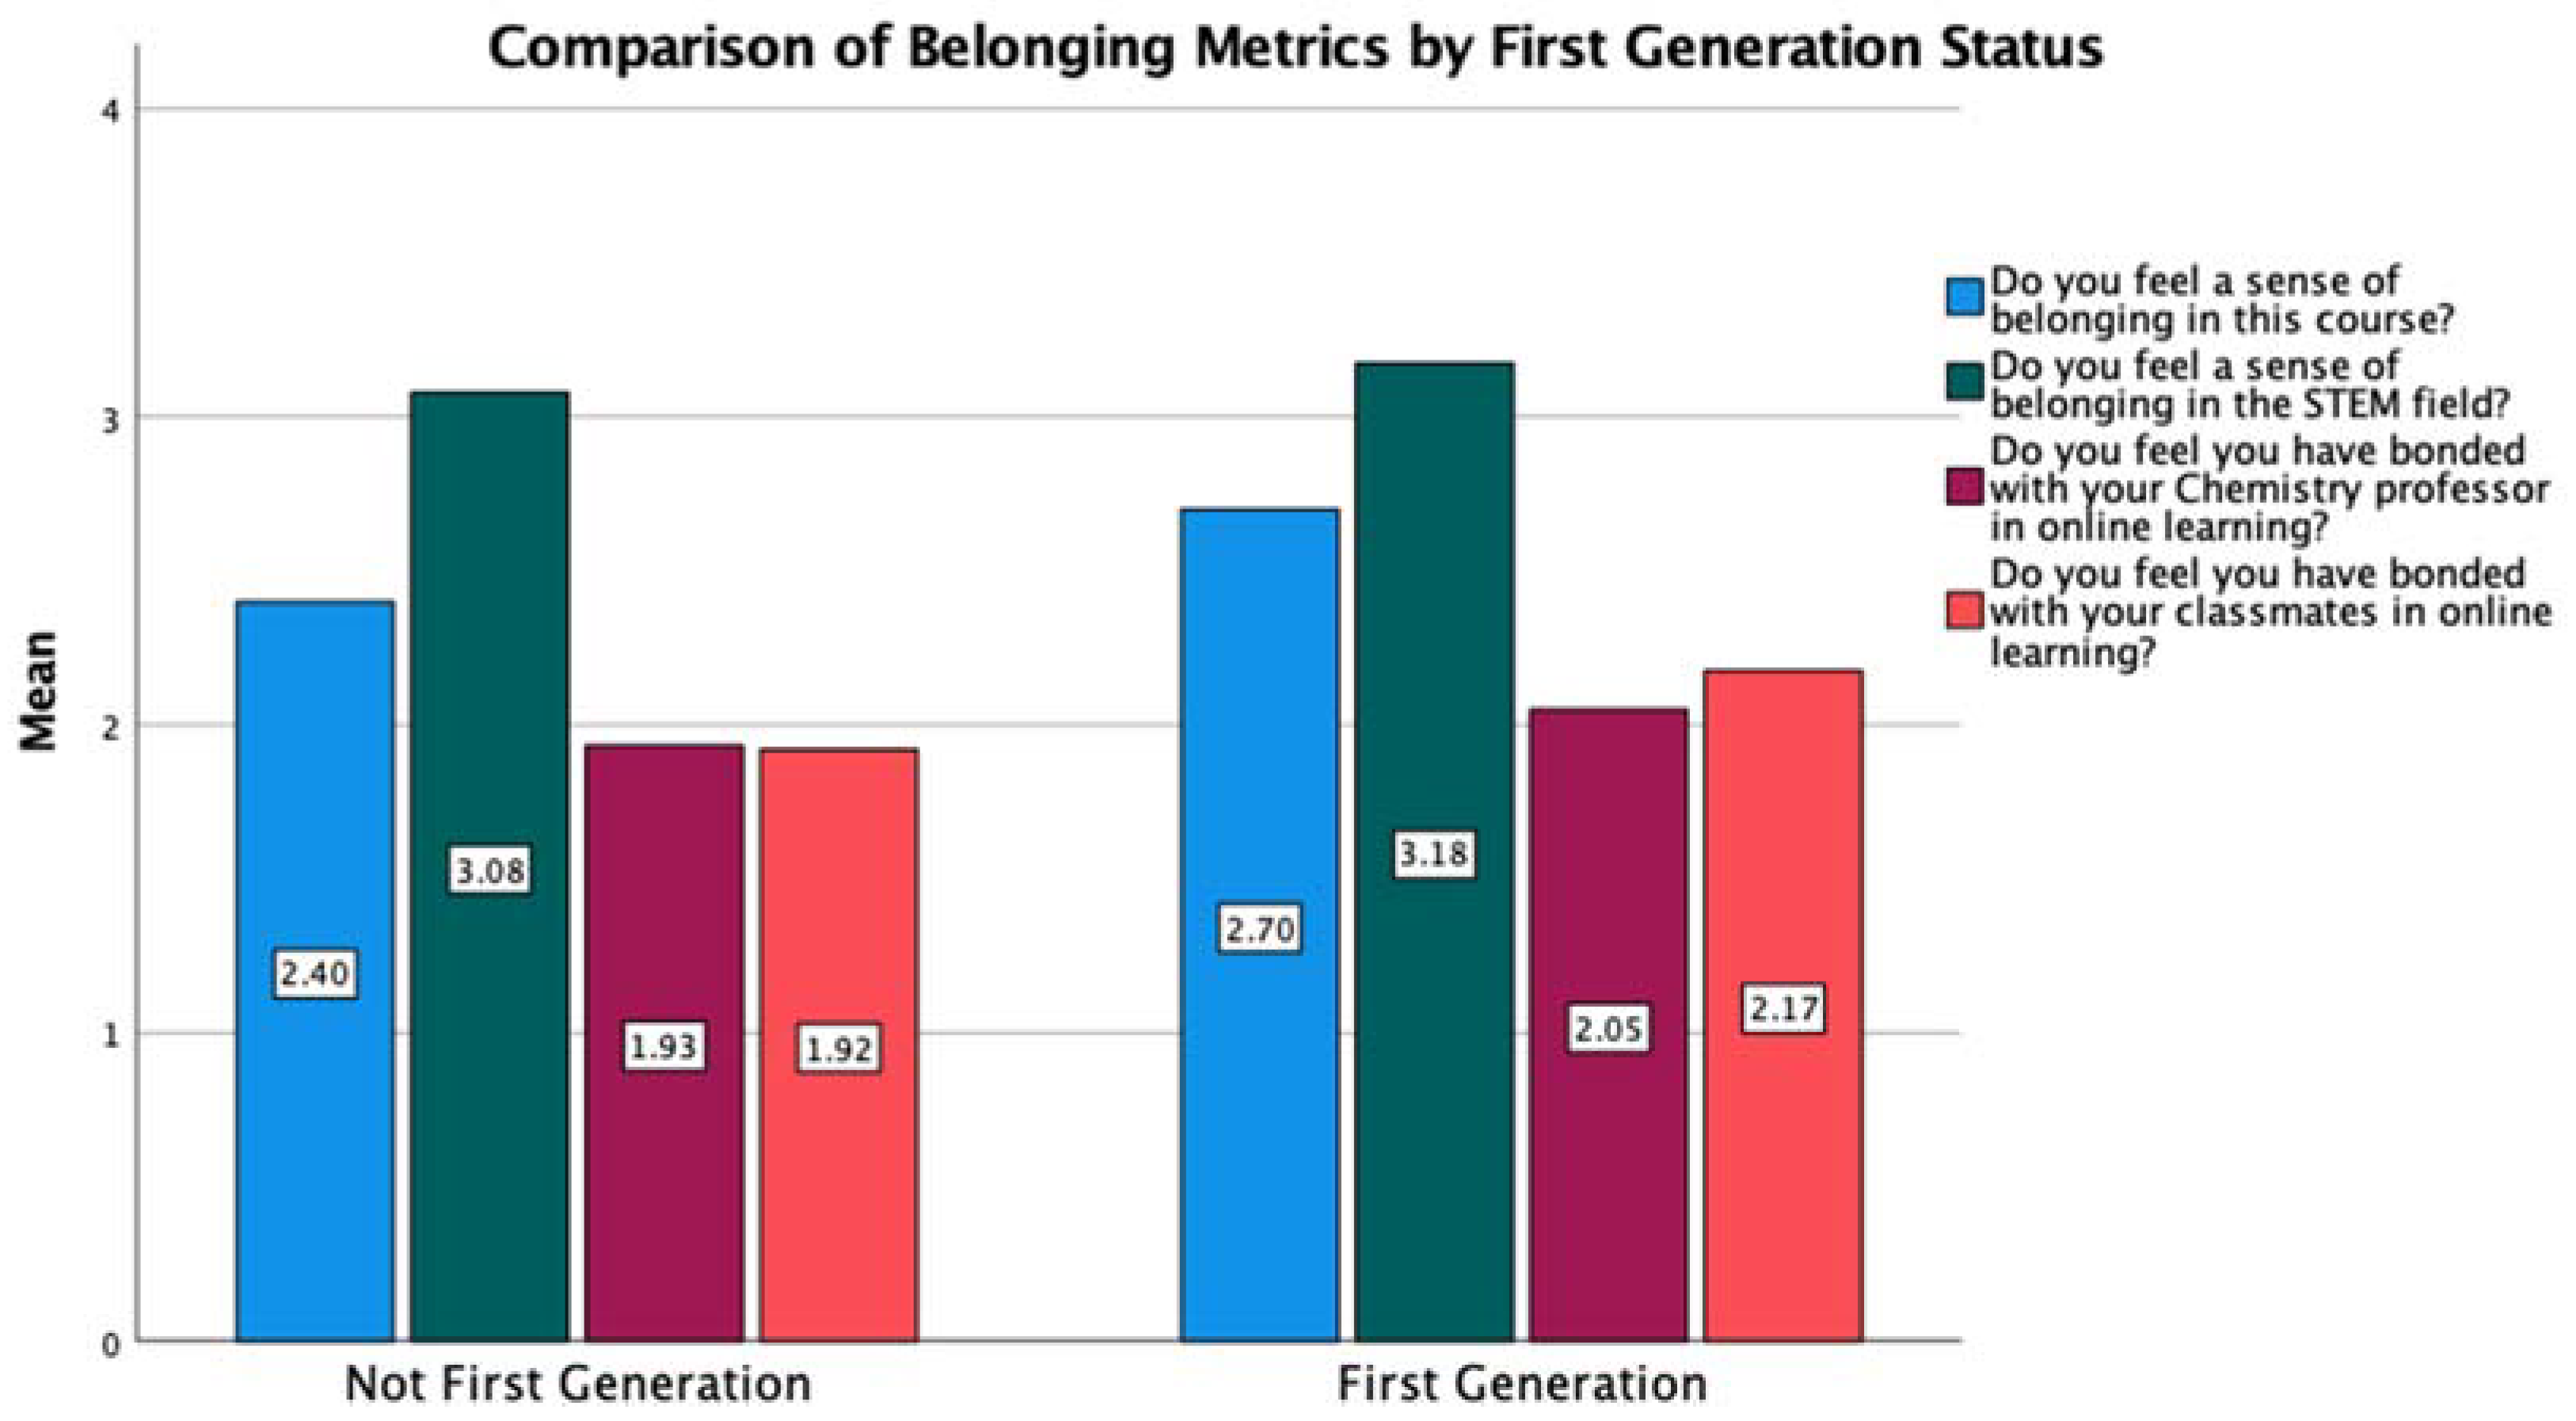
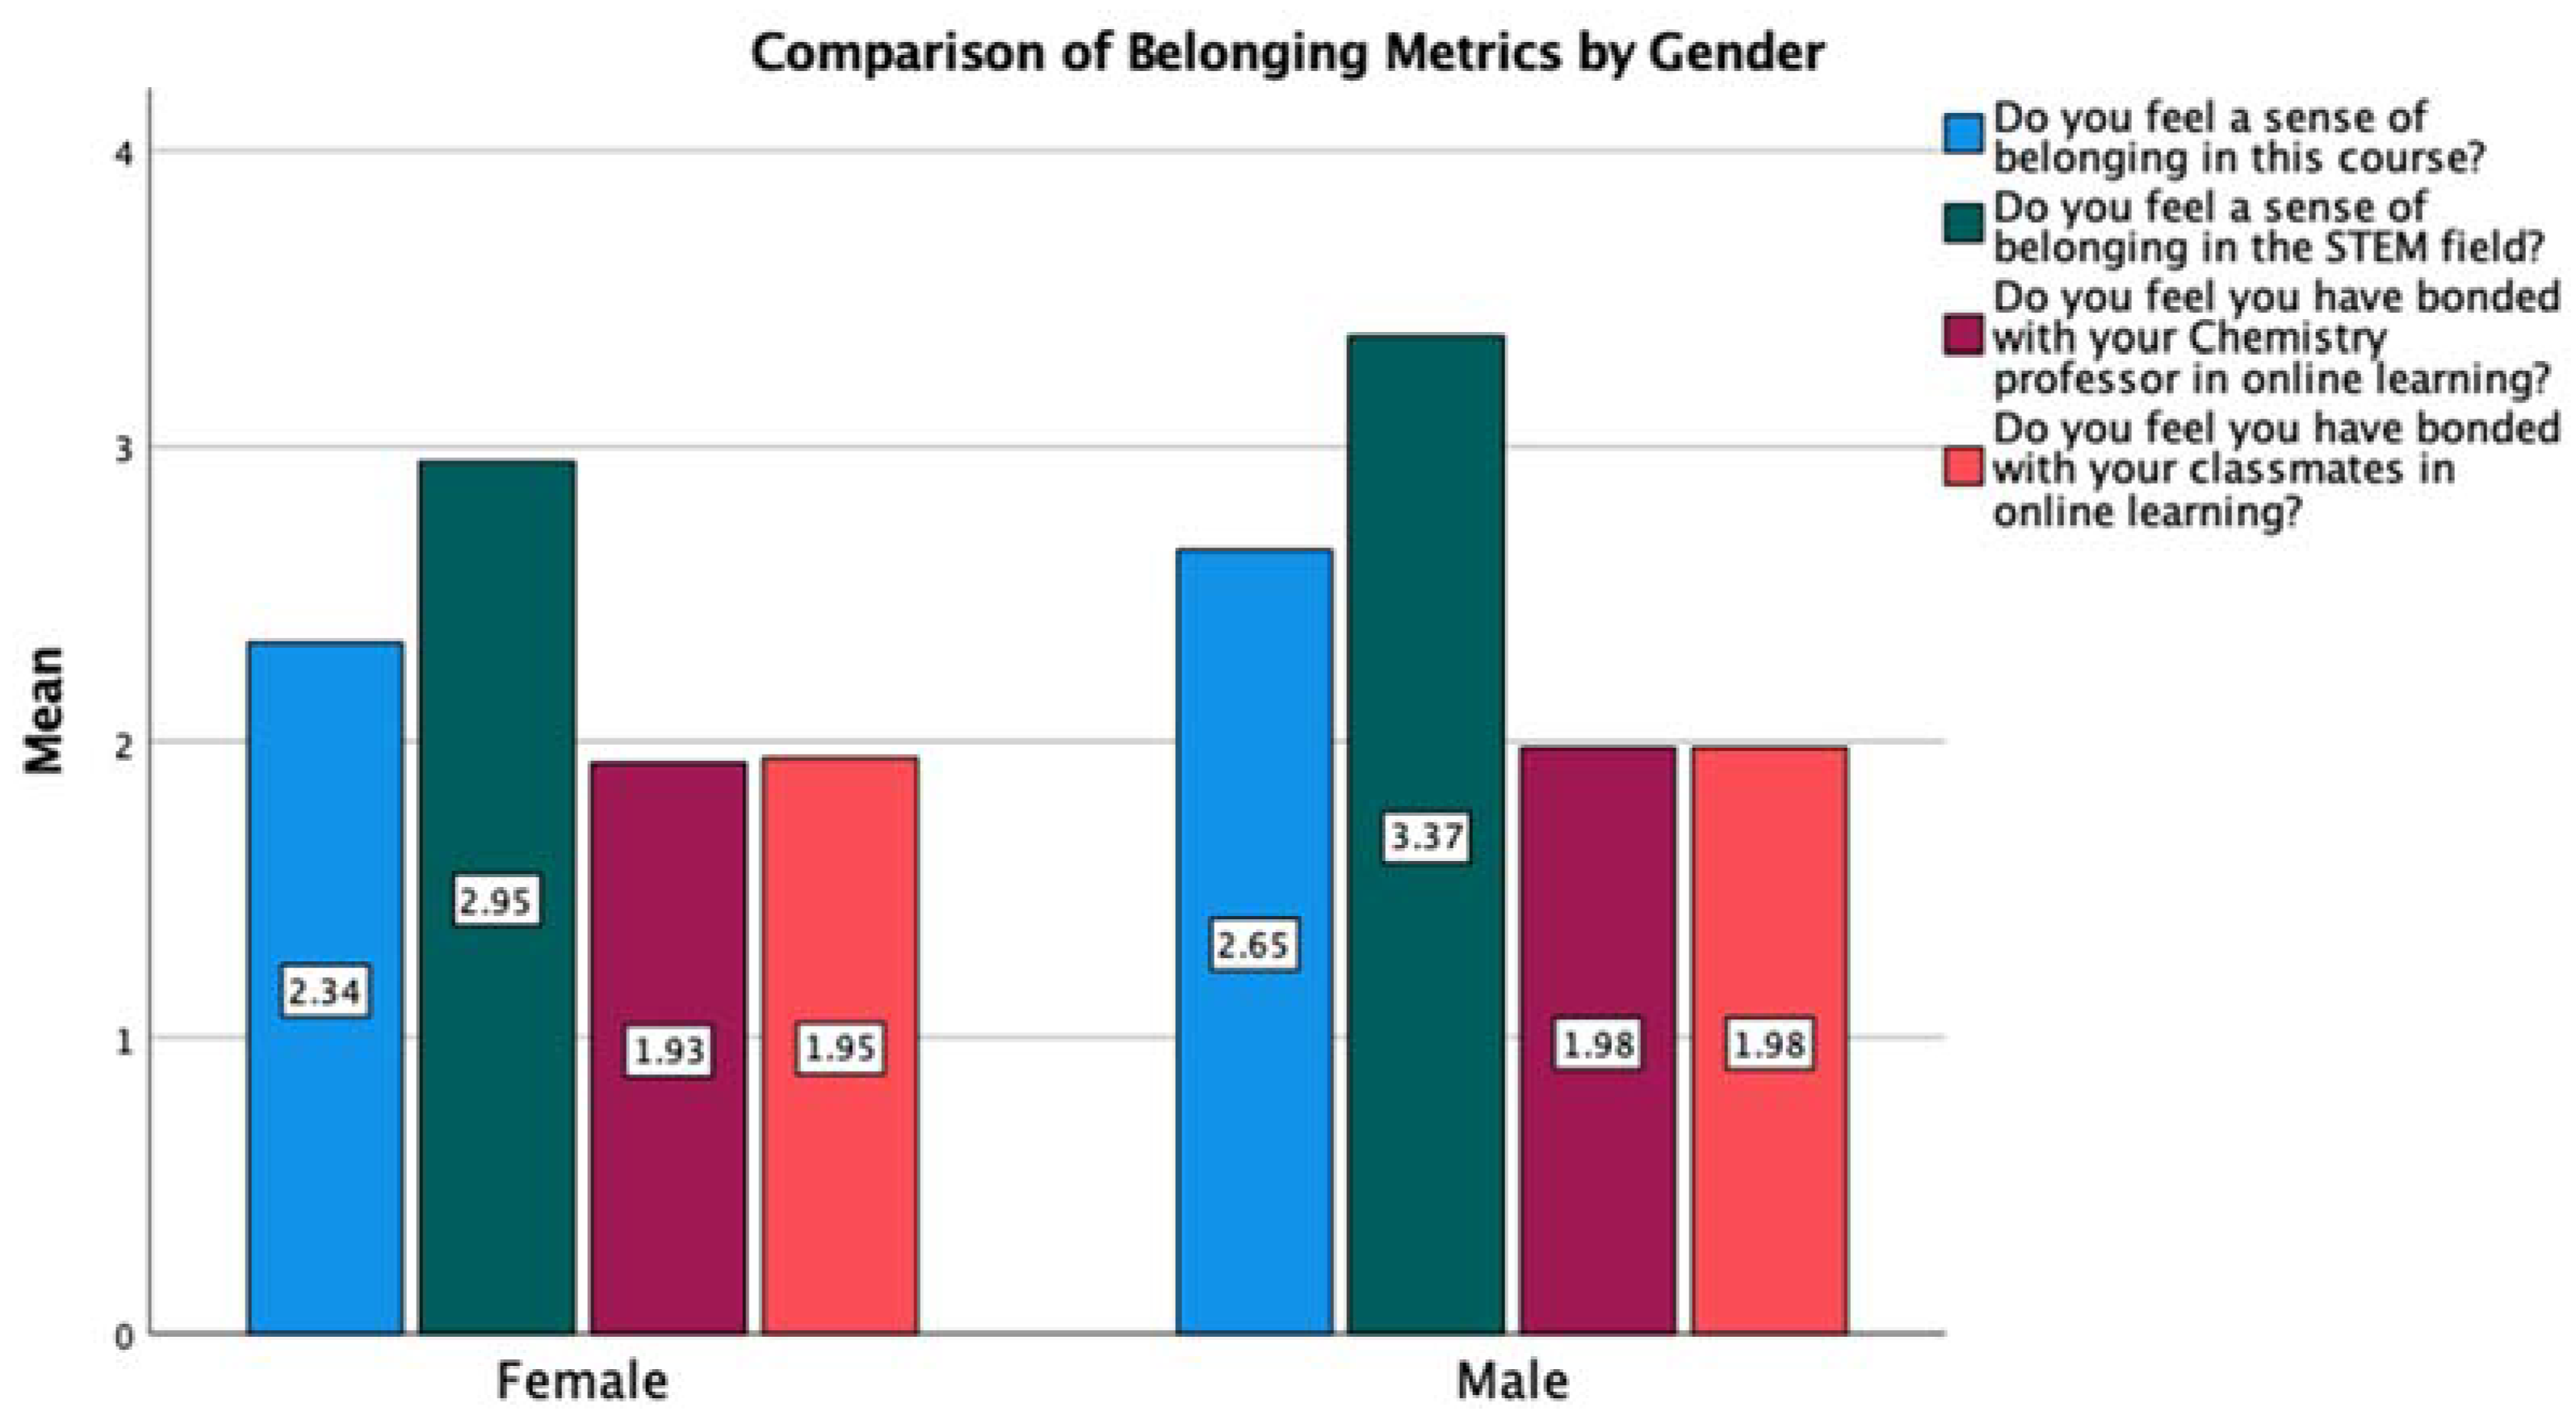
Figure 6 and Figure 7 summarize the mean values for the belonging survey items by gender and first-generation status. Table 8 summarizes the statistical comparisons of sense of belonging with gender and first-generation status. No statistical differences were observed with any of the survey items and first-generation status. Females reported a statistically lower sense of belonging in the course and a lower sense of belonging in STEM.

3.2.3. Ethnicity and Sense of Belonging

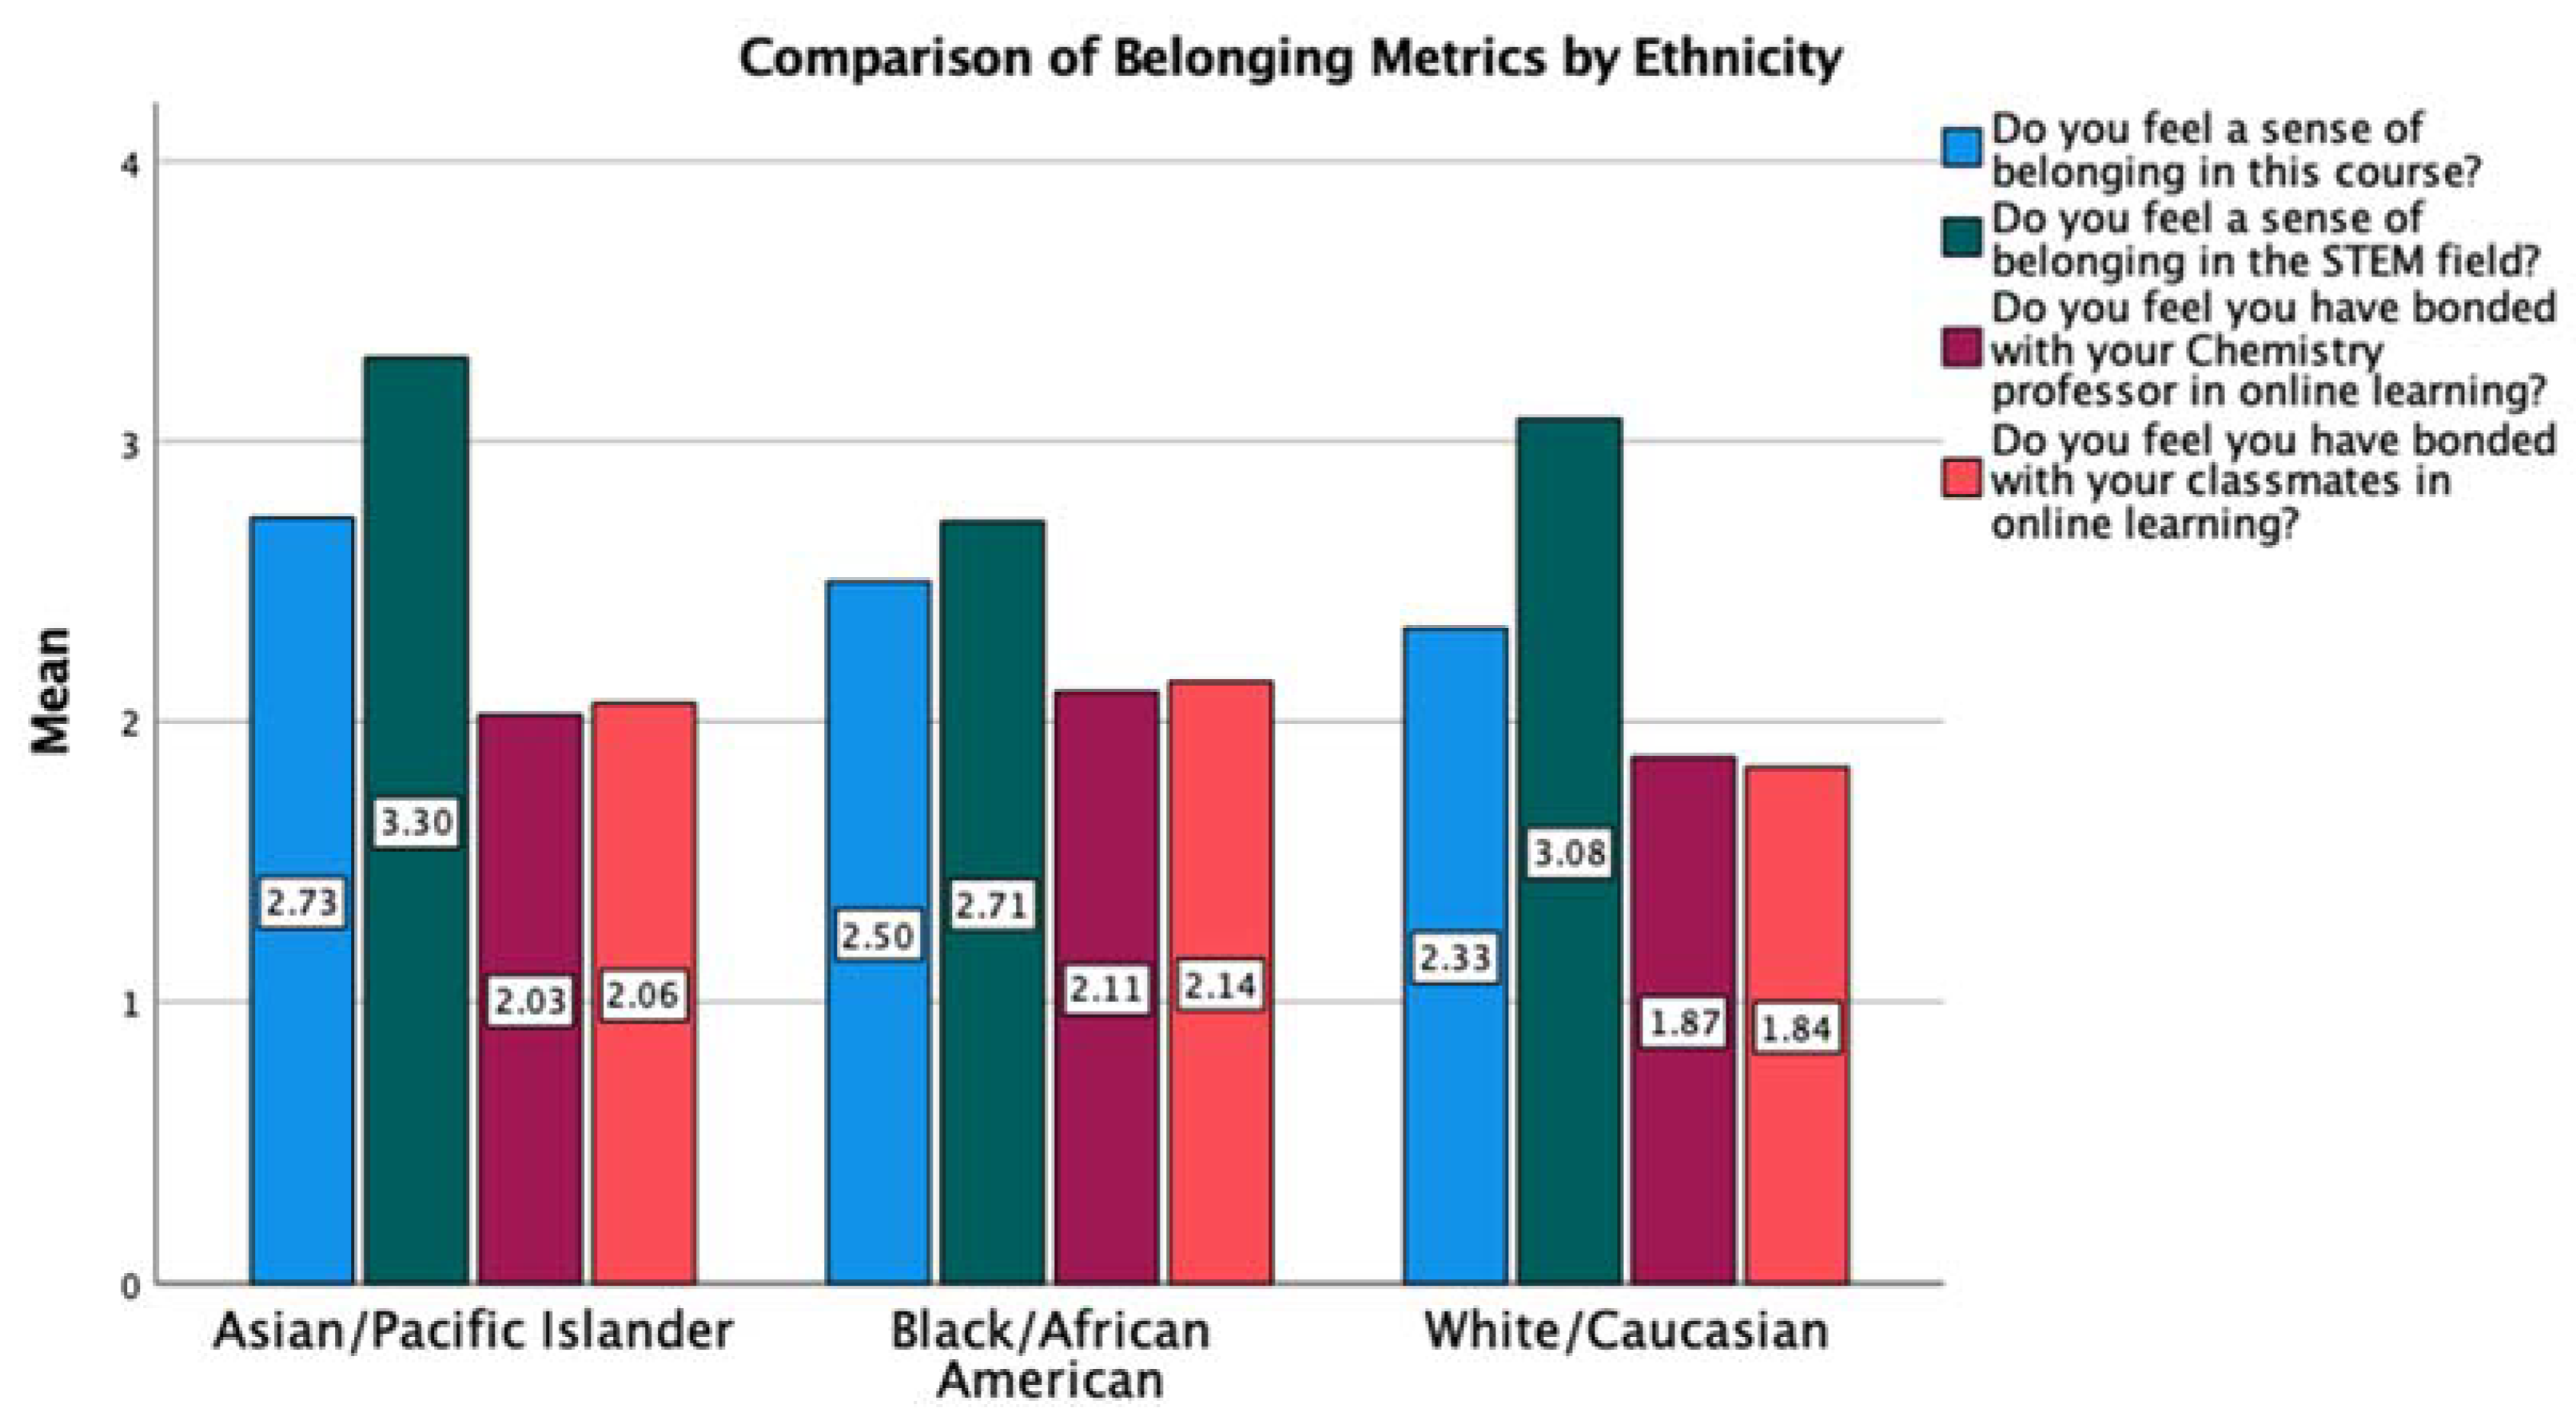
In comparing ethnicity and sense of belonging, Asian/Pacific Islander students reported a higher sense of belonging in each of the survey items. A statistical difference was observed between Asian/Pacific Islander students and Black/African students with regard to bonding with their classmates in the online environment, with Black/African students reporting a lower interaction with their classmates. Asian/Pacific Islander students reported a statistically higher sense of belonging in STEM than White/Caucasian and Black/African students. There was no statistical difference between Black/African and White/Caucasian students regarding their sense of belonging in STEM. Figure 8 summarizes the averages of the belonging items by ethnicity. Table 9 outlines the comparisons between sense of belonging and ethnicity.

3.3. Pros and Cons of Online Learning

The last three items on the survey were open-ended to collect students’ opinions about advantages and disadvantages associated with online learning. The responses for the disadvantages and what I wish my professor knew items were grouped and coded. The key advantage that was noted most often was the flexibility associated with remote learning. Additionally, the recorded lectures provided opportunities to review specific concepts from lecture.
A similar approach was used for grouping and coding students’ responses for disadvantages. Figure 9 summarizes these findings. The lack of engagement and lack of community were the two issues that students noted as being the two greatest disadvantages. Additionally, students outlined difficulties with communication and class organization—including perceptions that the online offering is more challenging.
The last question on the survey provided students an opportunity to provide additional insight into issues they wish their professor knew. As with the advantages and disadvantages of online learning, responses were grouped and coded. Figure 10 provides an overview of the codes and their count. Most notably, most students indicated that the course felt more challenging or more difficult than the face-to-face offering. Additionally, students noted that lectures are not engaging and more support is needed. Less common codes emphasized a variety of points including appreciation for the efforts taken by the professor and emphasis on the need for greater understanding and flexibility from instructors.

4. Discussion

Research Question 1: To what extent are statistical differences observed with academic standing and motivation or sense of belonging?
The findings regarding motivation, and particularly the decline in motivation, were expected given the online structure. Al-Tammemi et al. [21] reported a significant drop in motivation in their findings. Additionally, many students have reported zoom fatigue [35] which has led to significant reductions in motivation. From the research reported by Yu [16], it was hypothesized that freshman would experience the greatest challenge with motivation within the remote environment. The full scope of activities designed to build community within the incoming freshmen students were not implemented and students lacked pre-existing friends and connections from previous academic years. Both observations support the hypothesis that freshmen would have a lower sense of belonging. Neither of these hypotheses were correct. There was no statistical difference with any of the motivation or sense of belonging items for students with freshman or senior standing. However, statistical differences were observed with sophomores regarding their satisfaction with their work and their change in motivation since the start of the semester. These statistical differences were observed between sophomores and seniors as well as sophomores and freshman for both items. Additionally, statistical differences were observed between sophomores and seniors regarding bonding with classmates.
To explain the statistical differences observed, the undergraduate curriculum suggests that most sophomore students were taking organic chemistry. This is a significant observation because organic chemistry generally poses challenges for students regardless of the instructional mode. Research by Sunasee et al. [36] and Crucho et al. [37] reiterate challenges of teaching organic chemistry—particularly in the online setting. To further support this relationship, sophomores reported a statistically greater perception that the online course was more challenging than the course would have been in a traditional face-to-face mode. Sophomores reported spending a statistically (F = 13.2, p = 0.000) higher number of hours on course work compared to freshman and seniors. Sophomores reported spending 11.4 h per week on coursework compared to 8.4 h reported by freshmen and 7.6 reported by seniors. Additionally, freshmen also transitioned to remote learning in February during high school. Therefore, this could account for the lack of differences because they had already adapted to the remote learning environment.
Second year students expressed less satisfaction with their work despite the extensive time spent studying and reviewing. From Desi and Ryan’s research [13], competence and autonomy were two factors that promoted motivation. The decrease in motivation noted by sophomores can be attributed to their feeling of not having control of their understanding and feelings of incompetence. The organic chemistry students faced the challenge of navigating the online learning environment while engaging with challenging content.
Research Question 2: To what extent are statistical differences observed with first-generation status and motivation or sense of belonging?
Based upon prior research [11,24] with first-generation students, the research group hypothesized observing statistical differences between motivation and sense of belonging survey items between first-generation and non-first-generation students. However, no statistical differences were observed between first-generation and non-first-generation students. There was no statistical difference (F = 2.17, p = 0.14) between first-generation and non-first-generation with respect to the hours reported on coursework per week. These findings can be rationalized using the timeline for the survey. The pandemic impacted classes initially in the spring of 2020 and the survey data was collected in late fall. Students had time to adjust and recalibrate to adapt to the remote learning environment. By fall 2020, the university had instituted programs to provide students with e-learning technology, effectively supporting students with financial hardship, many of whom are first-generation. Additionally, in the fall, the university had developed more comprehensive support features to aid students and faculty, such as free online counseling and tutoring programs. Awareness of inequities and action by universities has proven successful in previous studies [38], and while no direct correlations were measured in this study, the lack of a statistical difference does support the benefits of university programs and actions.
Research Question 3: To what extent are statistical differences observed with gender and motivation or sense of belonging?
Although Wladis et al. [11] reported a statistically higher preference for the online learning format for female STEM majors, the study was based upon self-selection and similar metrics for measuring motivation and sense of belonging were not used to gauge impact. The findings presented yield a very different conclusion. In this study, females reported having statistically lower motivation in the online environment, greater decreases in motivation since the start of the semester, and a lower overall satisfaction with their work. Despite the statistically lower perceived motivation, females reported spending statistically more time on course work compared to males (F = 4.84, p = 0.03). On average, females reported spending 9.4 h a week on course work, including studying and homework, compared to 8.1 h a week reported by men. However, reduced motivation does not necessarily imply reduced effort. Further research will be conducted once face-to-face teaching resumes to gauge whether the weekly time commitment and perceived level of motivation varies by gender.
Females reported a statistically lower sense of belonging in the class and in STEM. The courses were taught completely remote, including the discussion section that incorporated active learning approaches to engage students. One explanation for the findings relates to previous research that illustrates females perform better in active learning environments [39]. Given the completely remote nature of the course, building connections with other students and faculty and having meaningful discussions were challenging. Although steps were taken to engage students in zoom using break out rooms and polls, the online environment posed challenges for students to actively engage. Hadi et al. [40] identified the human-side, technological, and environmental barriers that limit student engagement and remote active learning. Once face-to-face instruction resumes, further research will be conducted to probe whether the statistical difference between males and females persists regarding the sense of belonging in the course and STEM.
Females reporting lower perceived satisfaction and sense of belonging in online STEM courses can perhaps be explained by a larger trend of gender bias in STEM disciplines. These findings align with research by Dasgupta et al. [28] who outlined factors that may negatively impact female students’ motivation and sense of belonging in STEM. Thus, alongside further research assessing female STEM students’ motivation, belonging, and success in the classroom, evidence-based institutional initiatives, such as increasing professional development, increasing access to academic resources, and increasing female STEM faculty, may be necessary to support and promote female STEM students.
Research Question 4: To what extent are statistical differences observed with race/ethnicity and motivation or sense of belonging?
Three statistical differences were observed when comparing ethnicity. Black/African students reported a statistically lower motivation for online learning than Asian/Pacific Islander students. While differences in reported motivation were observed, there was no statistical difference (F = 0.24, p = 0.78) between the time spent on course work. White/Caucasian students reported a statistically lower sense of belonging than Black/African and Asian/Pacific Islander students. Finally, White/Caucasian and Black/African students both reported a statistically lower sense of belonging in STEM. These findings are consistent with research by Rainey et al. [27] who reported that African American students have consistently reported lower motivation and sense of belonging in STEM courses at predominantly white institutions across the United States [27]. The statistical differences between ethnicity observed need further research as previously noted with gender. A more detailed comparison for face-to-face versus remote learning is needed to determine the extent to which the teaching format may have impacted these findings. Perhaps the low presence of underrepresented minority students in STEM courses is exacerbated in the online setting where connecting with other students is more difficult.
Research Question 5: What are the advantages and disadvantages of remote learning?
From the open-ended responses, students outlined flexibility as being the key benefit for remote learning. Specifically, students enjoyed not having to commute and being able to watch lectures on their terms. Therefore, as many classes transition from an online to face-to-face format, making course content available online to supplement in-person instruction may afford students greater flexibility. In the upcoming semester, professor office hours and outreach hosted by teaching assistants will be remote in order to maintain social distancing and provide flexibility.
The open-ended responses for the advantages were more sporadic and did not have a specific theme as observed with both the disadvantages and What I Wish My Professor Knew items. Over 76% of the responses concerning disadvantages noted that classes were impersonal and described maintaining motivation in the remote environment as challenging. This observation is consistent with research on mental health [21,22] that noted online learning as a source of significant stress for students. Additionally, these comments were generally reiterated in the last open-ended item that provided students freedom to state facts that would be helpful for their professors for recalibrating and redesigning the courses. Responses such as the class structure is unfair (or too much work), additional resources are needed for remote learning, and lectures are not engaging were commonly noted and accounted for over 50% of the responses. As courses are recalibrated to meet in person again, these comments support the importance of providing opportunities for student engagement either through active learning in lectures, group projects, or simple items that allow for quick discussions which, if used correctly, will boost the relatedness component of motivation [12,13].

5. Conclusions

The transformation from in-person to remote learning was challenging for educators and students. Remote learning environments presented challenges to motivation, sense of belonging, and class satisfaction among students of different ethnicities, class years, and genders. Research illustrates that impacts to students were variable depending upon several metrics. It is imperative that we are cognizant of these differences—particularly with the start of the next academic term. The format of classes moving forward may be traditional, hybrid, or remote depending upon the location. Research has emphasized the importance of recognizing that students have different learning styles. Therefore, it is important to recognize and provide flexibility for challenges students may face in the less traditional environment.
This research also provides support for recalibrations needed once “traditional” instruction does resume. It may be advantageous for instructors to prioritize fostering student and faculty connection, flexibility, and supplementary academic resources in the classroom. Doing so may boost student self-efficacy, confidence, and inclusion in STEM. Future research is needed to determine if the motivation and inclusion gaps among female and underrepresented students in STEM persist outside of the online course environment. As universities transition back to in-person instruction, it is critical that instructors consider students’ noted challenges in the online format and modify their courses to place student engagement and flexibility at the forefront of their instruction methods.
From these findings, future research will be conducted into how both motivation and sense of belonging metrics change as we transition to the traditional classroom. More research is needed—particularly with sense of belonging in the course and STEM—to determine whether the differences between genders and ethnicities persist. If so, it is critical that paradigms be developed to promote inclusivity for all races and genders. The perceived weed out nature of chemistry has been attributed to stifling diversity in STEM. The findings reported in this study reiterate the need for more attention to this issue.

Supplementary Materials

The following are available online at https://www.mdpi.com/article/10.3390/educsci11090549/s1, The Online Learning Chemistry Survey.

Author Contributions

C.T.C.J. contributed the conceptualization, formal analysis, resources, supervision, and writing the original draft. N.S., A.B., J.F. and N.I. contributed to the investigation, validation, methodology, and writing–review and editing components of the research paper. All authors have read and agreed to the published version of the manuscript.

Funding

This research received no external funding.

Institutional Review Board Statement

The protocol was approved by Duke University Institutional Review Board (IRB Protocol Number 2021-0181).

Informed Consent Statement

Duke Charlie Cox is conducting a research study that explores how student experiences have evolved because of the transition from face-to-face to online instruction. Undergraduates enrolled in Chemistry 101, 201, 202 and 210, and residing in the US, are being asked to participate in a confidential survey.

Data Availability Statement

Data available on request due to restrictions (privacy and ethical).

Acknowledgments

The authors would like to thank Duke University for providing funds to complete the research project. Additionally, Charlie Cox would like to give thanks to Ruth Starkman for her support of this manuscript.

Conflicts of Interest

The authors declare no conflict of interest.

References

  1. Andrews, J.L.; de Los Rios, J.P.; Rayaluru, M.; Lee, S.; Mai, L.; Schusser, A.; Mak, C.H. Experimenting with at-home general chemistry laboratories during the covid-19 pandemic. J. Chem. Educ. 2020, 97, 1887–1894. [Google Scholar] [CrossRef]
  2. Karayilan, M.; Vakil, J.; Fowler, D.; Becker, M.L.; Cox, C.T., Jr. Zooming in on Polymer Chemistry and Designing Synthesis of High Sulfur-Content Polymers for Virtual Undergraduate Laboratory Experiment. J. Chem. Educ. 2021, 98, 2062–2073. [Google Scholar] [CrossRef]
  3. Campbell, C.D.; Challen, B.; Turner, K.L.; Stewart, M.I. # DryLabs20: A new global collaborative network to consider and address the challenges of laboratory teaching with the challenges of COVID-19. J. Chem. Educ. 2020, 97, 3023–3027. [Google Scholar]
  4. Buchberger, A.R.; Evans, T.; Doolittle, P. Analytical Chemistry Online? Lessons Learned from Transitioning a Project Lab Online Due to COVID-19. J. Chem. Educ. 2020, 97, 2976–2980. [Google Scholar] [CrossRef]
  5. Dunnagan, C.L.; Gallardo-Williams, M.T. Overcoming physical separation during COVID-19 using virtual reality in organic chemistry laboratories. J. Chem. Educ. 2020, 97, 3060–3063. [Google Scholar] [CrossRef]
  6. Prince, M.; Felder, R.; Brent, R. Active student engagement in online STEM classes: Approaches and recommendations. Adv. Eng. Educ. 2020, 8, 1–25. [Google Scholar]
  7. Lowenthal, P.; Borup, J.; West, R.; Archambault, L. Thinking beyond Zoom: Using asynchronous video to maintain connection and engagement during the COVID-19 pandemic. J. Technol. Teach. Educ. 2020, 28, 383–391. [Google Scholar]
  8. Venton, B.J.; Pompano, R.R. Strategies for Enhancing Remote Student Engagement through Active Learning; Springer: Berlin/Heidelberg, Germany, 2021. [Google Scholar]
  9. Perets, E.A.; Chabeda, D.; Gong, A.Z.; Huang, X.; Fung, T.S.; Ng, K.Y.; Bathgate, M.; Yan, E.C. Impact of the emergency transition to remote teaching on student engagement in a non-STEM undergraduate chemistry course in the time of COVID-19. J. Chem. Educ. 2020, 97, 2439–2447. [Google Scholar] [CrossRef]
  10. Jimenez, L. Student Assessment During COVID-19; Center for American Progress: Washington, DC, USA, 2020.
  11. Wladis, C.; Hachey, A.C.; Conway, K. Which STEM majors enroll in online courses, and why should we care? The impact of ethnicity, gender, and non-traditional student characteristics. Comput. Educ. 2015, 87, 285–308. [Google Scholar] [CrossRef] [Green Version]
  12. Deci, E.L.; Vallerand, R.J.; Pelletier, L.G.; Ryan, R.M. Motivation and Education: The Self-Determination Perspective. Educ. Psychol. 1991, 26, 325–346. [Google Scholar] [CrossRef]
  13. Deci, E.L.; Ryan, R.M. Self-determination theory: A macrotheory of human motivation, development, and health. Can. Psychol./Psychol. Can. 2008, 49, 182. [Google Scholar] [CrossRef] [Green Version]
  14. Vallerand, R.J. Deci and Ryan’s self-determination theory: A view from the hierarchical model of intrinsic and extrinsic motivation. Psychol. Inq. 2000, 11, 312–318. [Google Scholar]
  15. Niemiec, C.P.; Ryan, R.M. Autonomy, competence, and relatedness in the classroom: Applying self-determination theory to educational practice. Theory Res. Educ. 2009, 7, 133–144. [Google Scholar] [CrossRef]
  16. Yu, Z. The effects of gender, educational level, and personality on online learning outcomes during the COVID-19 pandemic. Int. J. Educ. Technol. High. Educ. 2021, 18, 14. [Google Scholar] [CrossRef]
  17. Artino, A.R., Jr.; Stephens, J.M. Academic motivation and self-regulation: A comparative analysis of undergraduate and graduate students learning online. Internet High. Educ. 2009, 12, 146–151. [Google Scholar] [CrossRef]
  18. Bradley, R.L.; Browne, B.L.; Kelley, H.M. Examining the influence of self-efficacy and self-regulation in online learning. Coll. Stud. J. 2017, 51, 518–530. [Google Scholar]
  19. Fruehwirth, J.C.; Biswas, S.; Perreira, K.M. The Covid-19 pandemic and mental health of first-year college students: Examining the effect of Covid-19 stressors using longitudinal data. PLoS ONE 2021, 16, e0247999. [Google Scholar] [CrossRef] [PubMed]
  20. Wang, X.; Hegde, S.; Son, C.; Keller, B.; Smith, A.; Sasangohar, F. Investigating mental health of US college students during the COVID-19 pandemic: Cross-sectional survey study. J. Med. Internet Res. 2020, 22, e22817. [Google Scholar] [CrossRef]
  21. Al-Tammemi, A.A.B.; Akour, A.; Alfalah, L. Is It Just About Physical Health? An Online Cross-Sectional Study Exploring the Psychological Distress Among University Students in Jordan in the Midst of COVID-19 Pandemic. Front. Psychol. 2020, 11, 1–11. [Google Scholar] [CrossRef]
  22. Son, C.; Hegde, S.; Smith, A.; Wang, X.; Sasangohar, F. Effects of COVID-19 on college students’ mental health in the United States: Interview survey study. J. Med. Internet Res. 2020, 22, e21279. [Google Scholar] [CrossRef]
  23. Huckins, J.F.; DaSilva, A.W.; Wang, W.; Hedlund, E.; Rogers, C.; Nepal, S.K.; Wu, J.; Obuchi, M.; Murphy, E.I.; Meyer, M.L. Mental health and behavior of college students during the early phases of the COVID-19 pandemic: Longitudinal smartphone and ecological momentary assessment study. J. Med. Internet Res. 2020, 22, e20185. [Google Scholar] [CrossRef]
  24. Aucejo, E.M.; French, J.; Araya, M.P.U.; Zafar, B. The impact of COVID-19 on student experiences and expectations: Evidence from a survey. J. Public Econ. 2020, 191, 104271. [Google Scholar] [CrossRef]
  25. Youmans, M.K. Going remote: How teaching during a crisis is unique to other distance learning experiences. J. Chem. Educ. 2020, 97, 3374–3380. [Google Scholar] [CrossRef]
  26. Mervis, J. Weed-Out Courses Hamper Diversity; American Association for the Advancement of Science: Washington, DC, USA, 2011. [Google Scholar]
  27. Rainey, K.; Dancy, M.; Mickelson, R.; Stearns, E.; Moller, S. Race and gender differences in how sense of belonging influences decisions to major in STEM. Int. J. STEM Educ. 2018, 5, 10. [Google Scholar] [CrossRef] [Green Version]
  28. Dasgupta, N.; Stout, J.G. Girls and Women in Science, Technology, Engineering, and Mathematics:STEMing the Tide and Broadening Participation in STEM Careers. Policy Insights Behav. Brain Sci. 2014, 1, 21–29. [Google Scholar] [CrossRef] [Green Version]
  29. Skulmowski, A.; Rey, G.D. COVID-19 as an accelerator for digitalization at a German university: Establishing hybrid campuses in times of crisis. Hum. Behav. Emerg. Technol. 2020, 2, 212–216. [Google Scholar] [CrossRef]
  30. Triyason, T.; Tassanaviboon, A.; Kanthamanon, P. Hybrid Classroom: Designing for the New Normal after COVID-19 Pandemic. In Proceedings of the 11th International Conference on Advances in Information Technology, Bangkok, Thailand, 1–3 July 2020; pp. 1–8. [Google Scholar]
  31. Das, K.R.; Imon, A. A brief review of tests for normality. Am. J. Theor. Appl. Stat. 2016, 5, 5–12. [Google Scholar]
  32. Ross, S.M. Chapter 7–Distributions of Sampling Statistics. In Introductory Statistics, 4th ed.; Ross, S.M., Ed.; Academic Press: Oxford, UK, 2017; pp. 297–328. [Google Scholar] [CrossRef]
  33. Hayes, A.F.; Coutts, J.J. Use omega rather than Cronbach’s alpha for estimating reliability. But…. Commun. Methods Meas. 2020, 14, 1–24. [Google Scholar] [CrossRef]
  34. Deng, L.; Chan, W. Testing the difference between reliability coefficients alpha and omega. Educ. Psychol. Meas. 2017, 77, 185–203. [Google Scholar] [CrossRef] [PubMed]
  35. Peper, E.; Wilson, V.; Martin, M.; Rosegard, E.; Harvey, R. Avoid Zoom fatigue, be present and learn. NeuroRegulation 2021, 8, 47. [Google Scholar] [CrossRef]
  36. Sunasee, R. Challenges of teaching organic chemistry during COVID-19 pandemic at a primarily undergraduate institution. J. Chem. Educ. 2020, 97, 3176–3181. [Google Scholar] [CrossRef]
  37. Crucho, C.I.; Avó, J.; Diniz, A.M.; Gomes, M.J. Challenges in teaching organic chemistry remotely. J. Chem. Educ. 2020, 97, 3211–3216. [Google Scholar] [CrossRef]
  38. Schwartz Poehlmann, J.; Cox, C.T., Jr.; Pretlow, B. Building a Chemistry Community through the Leland Scholars Program. In Active Learning in General Chemistry: Specific Interventions; ACS Publications: Washington, DC, USA, 2019; pp. 99–116. [Google Scholar]
  39. Roberts, J.A.; Olcott, A.N.; McLean, N.M.; Baker, G.S.; Möller, A. Demonstrating the impact of classroom transformation on the inequality in DFW rates (“D” or “F” grade or withdraw) for first-time freshmen, females, and underrepresented minorities through a decadal study of introductory geology courses. J. Geosci. Educ. 2018, 66, 304–318. [Google Scholar] [CrossRef]
  40. Hadi Mogavi, R.; Zhao, Y.; Ul Haq, E.; Hui, P.; Ma, X. Student Barriers to Active Learning in Synchronous Online Classes: Characterization, Reflections, and Suggestions. In Proceedings of the Eighth ACM Conference on Learning@ Scale, Virtual Event, 22–25 June 2021. [Google Scholar]
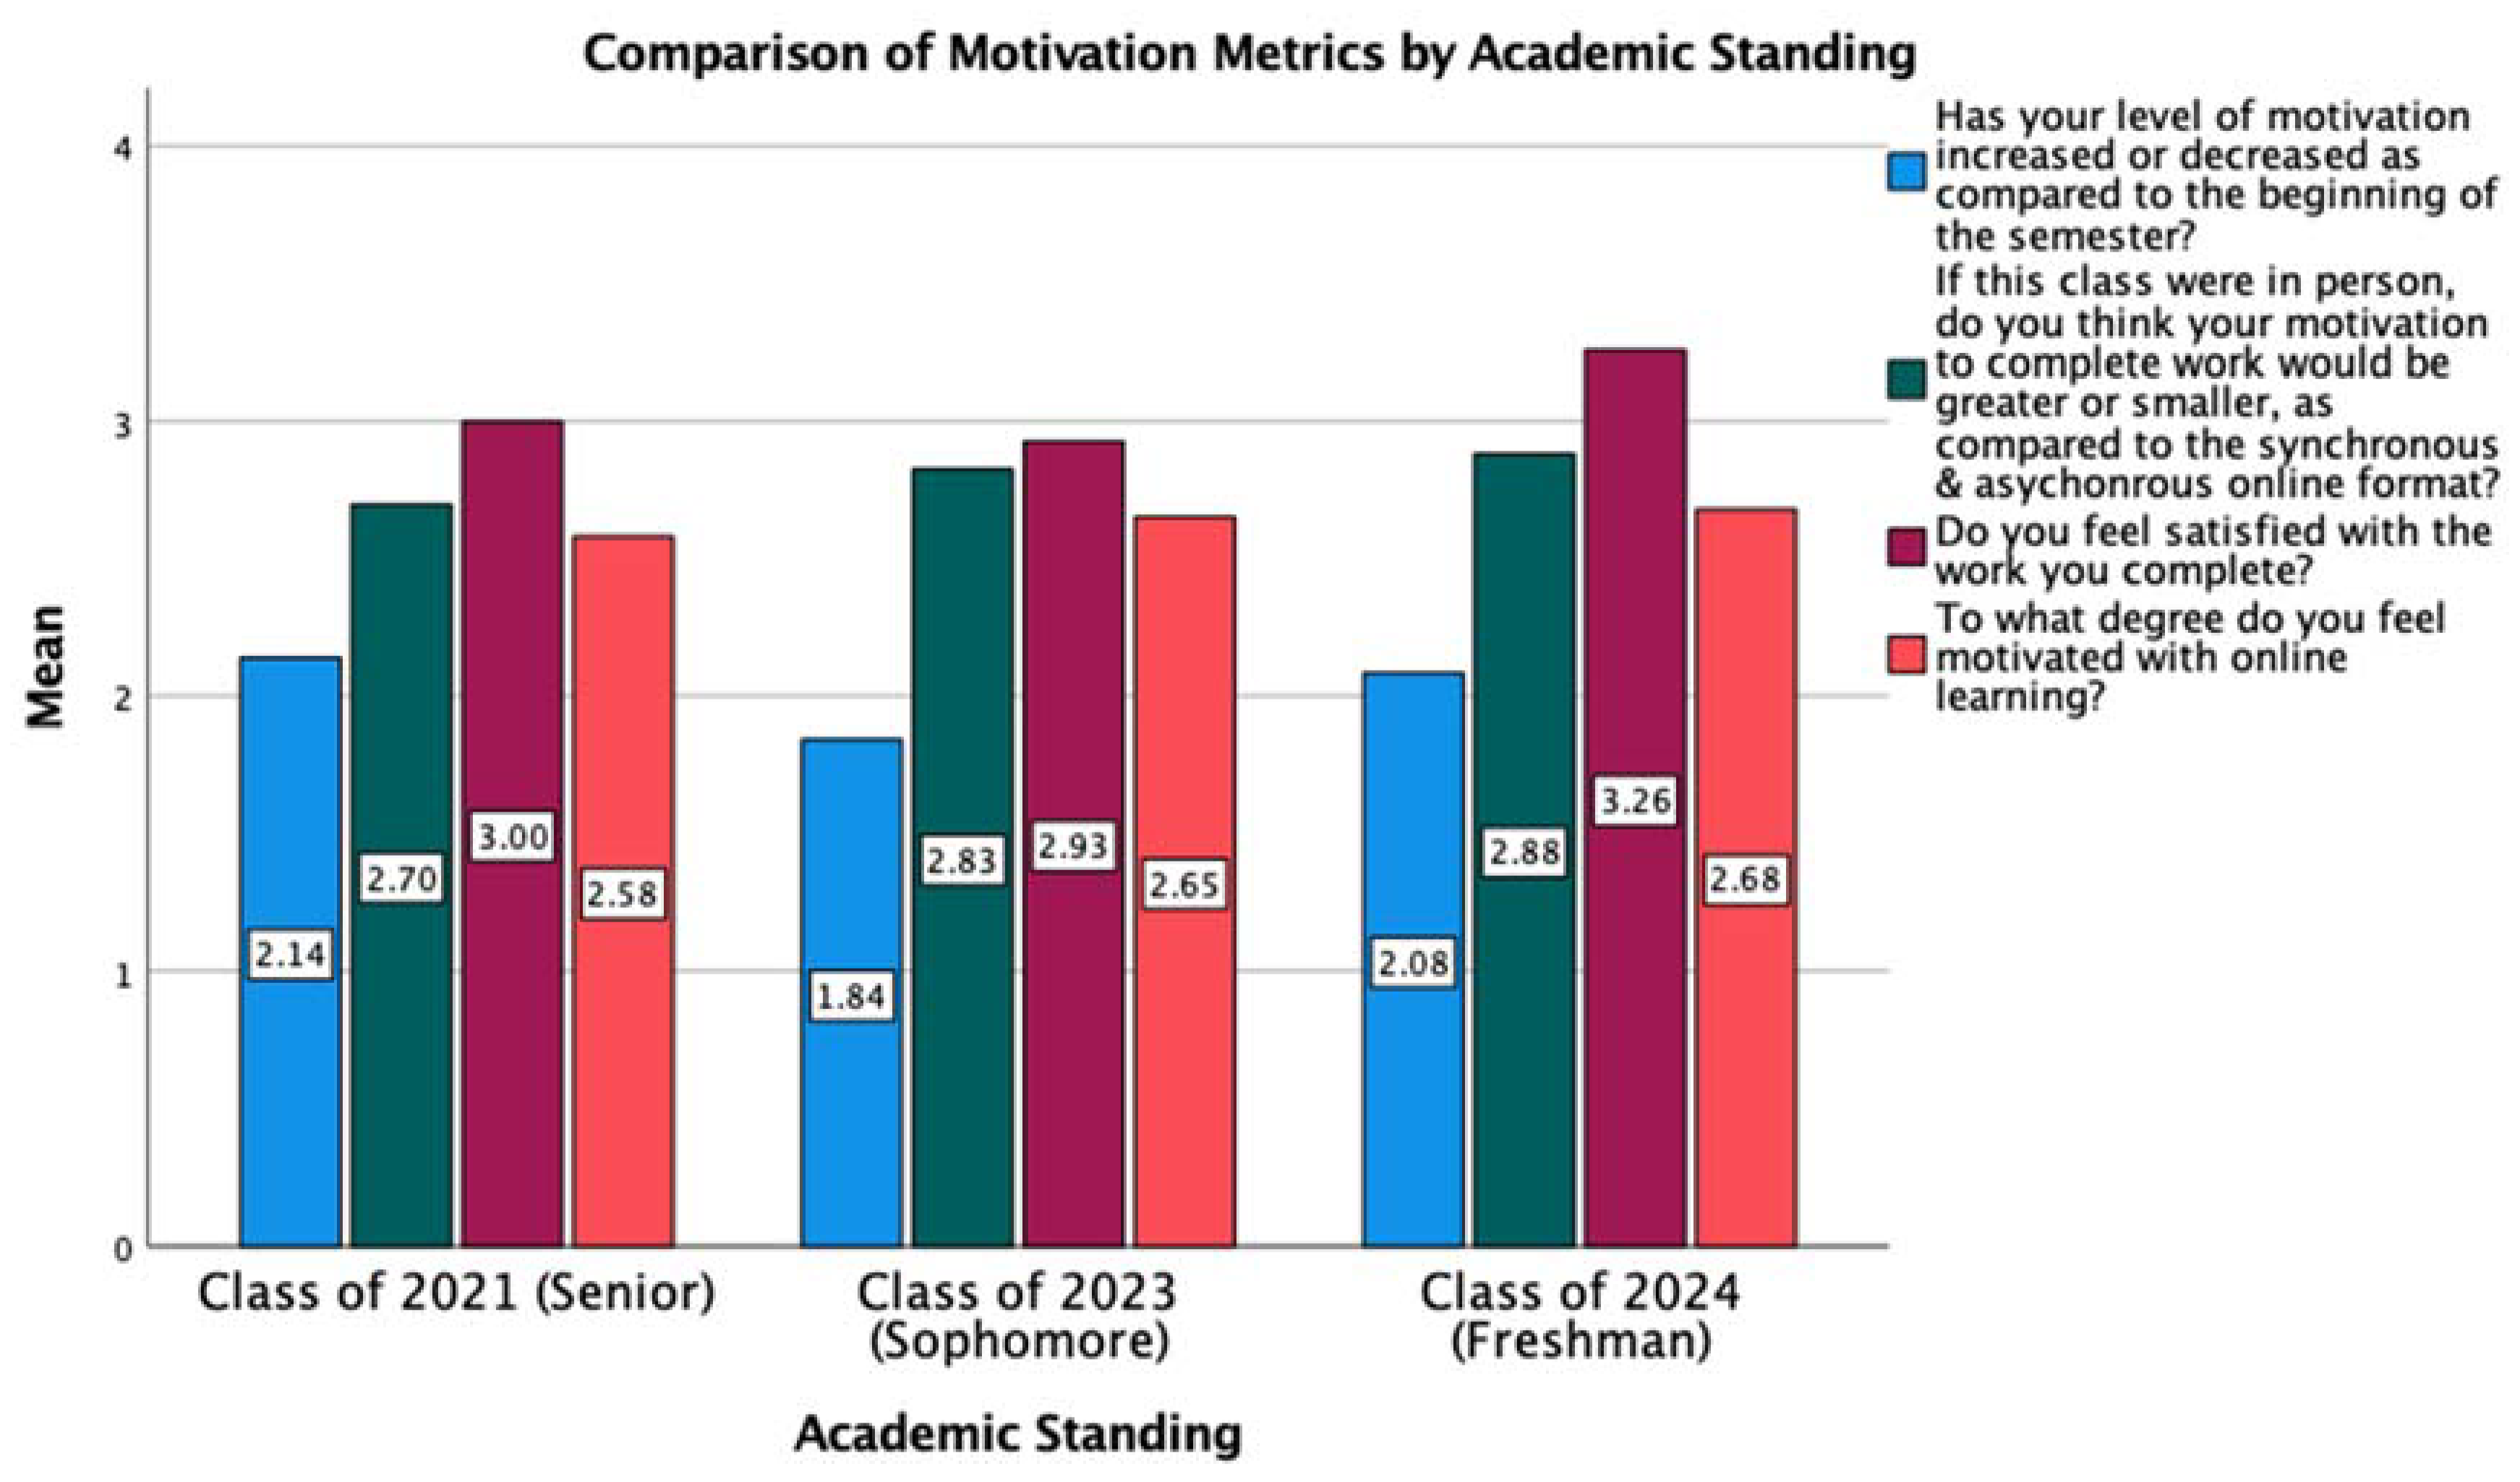
Figure 1. Comparison of Motivation Survey Items by Academic Standing.
Education 11 00549 g001
Figure 2. Comparison of Motivation Survey Items by Gender.
Education 11 00549 g002
Figure 3. Comparison of Motivation Survey Items by First-Generation Status.
Education 11 00549 g003
Figure 4. Comparison of Motivation Survey Items by Ethnicity.
Education 11 00549 g004
Figure 5. Sense of Belonging Averages by Academic Standing.
Education 11 00549 g005
Figure 6. Sense of Belonging Averages by First-Generation Status.
Education 11 00549 g006
Figure 7. Sense of Belonging Averages by Gender.
Education 11 00549 g007
Figure 8. Sense of Belonging Averages by Ethnicity.
Education 11 00549 g008
Figure 9. Summary of the coded data regarding the disadvantages associated with online learning.
Education 11 00549 g009
Figure 10. Summary of the coded data from the open-ended question: “What I wish my professor knew”.
Education 11 00549 g010
Table 1. Demographic Information for Survey Participants Who Responded to the Survey Item.
DemographicIdentification
GenderMale (N = 100)
Female (N = 182)
Nonbinary (N = 1)
EthnicityAsian/Pacific Islander (N = 81)
White/Caucasian (N = 144)
Black/African (N = 33)
Hispanic/Latinx (N = 16)
American Indian (N = 4)
Other (N = 4)
More Than One Race (N = 40)
Socioeconomic StatusFirst Generation/Low Income (N = 40)
Not First Generation/Low Income (N = 242)
Academic StandingFreshman/First Year (N = 144)
Sophomore/Second Year (N = 69)
Junior/Third Year (N = 26)
Senior/Fourth Year (N = 43)
StatusDomestic (N = 274)
International (N = 9)
Table 2. Survey Items Regarding Motivation and the Average Response.
QuestionSurvey Scale
To what degree do you feel motivated with online learning?No motivation (1)
Little motivation (2)
Moderate motivation (3)
Strong motivation (4)
2.6
Has your level of motivation increased or decreased as compared to the beginning of the semester?Greatly decreased (1)
Somewhat decreased (2)
Neither decreased nor increased (3)
Somewhat increased (4)
Greatly increased (5)
2.0
Do you feel satisfied with the work you complete?Extremely dissatisfied (1)
Somewhat dissatisfied (2)
Neither satisfied nor dissatisfied (3)
Somewhat satisfied (4)
Extremely satisfied (5)
3.1
If this class were in person, do you think your motivation to complete work would be greater or smaller, as compared to the synchronous/asynchronous online format?Greater (3)
No change (2)
Smaller (1)
2.3
Table 3. Statistical Comparison of Motivation Survey Items and Academic Standing.
QuestionDemographic Comparison by Academic Standing
To what degree do you feel motivated with online learning?Freshman and Sophomore (tcalc = 0.219, tcrit = 1.97, p = 0.83) Freshman and Senior (tcalc = 0.671, tcrit = 1.97, p = 0.53)
Sophomore and Senior (tcalc = 0.389, tcrit = 1.98, p = 0.70)
Has your level of motivation increased or decreased as compared to the beginning of the semester?Freshman and Sophomore (tcalc = 2.01, tcrit = 1.97, p = 0.045) * Freshman and Senior (tcalc = 0.398, tcrit = 1.97, p = 0.69)
Sophomore and Senior (tcalc = 1.66, tcrit = 1.98, p = 0.10)
Do you feel satisfied with the work you complete?Freshman and Sophomore (tcalc = 2.13, tcrit = 1.97, p = 0.034) * Freshman and Senior (tcalc = 1.40, tcrit = 1.97, p = 0.16)
Sophomore and Senior (talc = 0.34, tcrit = 1.98, p = 0.73)
If this class were in person, do you think your motivation to complete work would be greater or smaller, as compared to the synchronous/asynchronous online format? Freshman and Sophomore (tcalc = 2.27, tcrit = 1.97, p = 0.024) *
Freshman and Senior (tcalc = 0.63, tcrit = 1.97, p = 0.53)
Sophomore and Senior (tcalc = 2.17, p = 1.98, p = 0.032) *
* Statistically different at a 95% level of confidence.
Table 4. Statistical Comparison of Motivation Survey Items and First-Generation Status and Gender.
QuestionDemographic Comparison by First-Generation Status and Gender
To what degree do you feel motivated with online learning?Male and Female (tcalc = 2.36, tcrit = 1.97, p = 0.019) *
First Gen/Low-Income and Non-First-Gen/Low-Income (tcalc = 0.63, tcrit = 1.97, p = 0.53)
Has your level of motivation increased or decreased as compared to the beginning of the semester?Male and Female (tcalc = 2.25, tcrit = 1.97, p = 0.025) *
First Gen/Low-Income and Non-First-Gen/Low-Income (tcalc = 1.22, tcrit = 1.97, p = 0.22)
Do you feel satisfied with the work you complete?Male and Female (tcalc = 2.82, tcrit = 1.97, p = 0.0051) *
First Gen/Low-Income and Non-First-Gen/Low-Income (talc = 0.59, tcrit = 1.97, p = 0.55)
If this class were in person, do you think your motivation to complete work would be greater or smaller, as compared to the synchronous/asynchronous online format? Male and Female (tcalc = 1.848, tcrit = 1.97, p = 0.066)
First Gen/Low-Income and Non-First-Gen/Low-Income (tcalc = 0.32, tcrit = 1.97, p = 0.75)
* Statistically different at a 95% level of confidence.
Table 5. Statistical Comparison of Motivation Survey Items and Ethnicity.
QuestionDemographic Comparison by Ethnicity
To what degree do you feel motivated with online learning?Asian/Pacific Islander and Black/African (tcalc = 2.19, tcrit = 1.98, p = 0.030) *
Asian/Pacific Islander and White/Caucasian ((tcalc = 1.36, tcrit = 1.97, p = 0.18)
Black/African and White/Caucasian (tcalc = 1.24, tcrit = 1.97, p = 0.21))
Has your level of motivation increased or decreased as compared to the beginning of the semester?Asian/Pacific Islander and Black/African (tcalc = 1.55, tcrit = 1.98, p = 0.125)
Asian/Pacific Islander and White/Caucasian (tcalc = 0.56, tcrit = 1.97, p = 0.576)
Black/African and White/Caucasian (tcalc = 1.28, tcrit = 1.97, p = 0.204)
Do you feel satisfied with the work you complete?Asian/Pacific Islander and Black/African (tcalc = 1.43, tcrit = 1.98, p = 0.15)
Asian/Pacific Islander and White/Caucasian (tcalc = 1.27, tcrit = 1.97, p = 0.21)
Black/African and White/Caucasian (tcalc = 0.53, tcrit = 1.97, p = 0.597)
If this class were in person, do you think your motivation to complete work would be greater or smaller, as compared to the synchronous/asynchronous online format? Asian/Pacific Islander and Black/African (tcalc= 0.91, tcrit = 1.98, p = 0.37)
Asian/Pacific Islander and White/Caucasian (tcalc= 1.78, tcrit = 1.97, p = 0.078)
Black/African and White/Caucasian (tcalc= 0.18, tcrit = 1.97, p = 0.86)
* Statistically different at a 95% level of confidence.
Table 6. Survey Items Regarding Sense of Belonging and the Average Response.
QuestionSurvey Scale
Do you feel you have bonded with your Chemistry professor in online learning?Definitely yes (4)
Probably yes (3)
Probably not (2)
Definitely not (1)
2.0
Do you feel you have bonded with your classmates in online learning?Definitely yes (4)
Probably yes (3)
Probably not (2)
Definitely not (1)
2.0
Do you feel a sense of belonging in this course?Definitely yes (4)
Probably yes (3)
Probably not (2)
Definitely not (1)
2.4
Do you feel a sense of belonging in STEM?Definitely yes (4)
Probably yes (3)
Probably not (2)
Definitely not (1)
3.1
Table 7. Statistical Comparison of Sense of Belonging and Academic Standing.
QuestionDemographic Comparison by Academic Standing
Do you feel a sense of belonging in the course?Freshman and Sophomore (tcalc = 1.53, tcrit = 1.97, p = 0.13)
Freshman and Senior (tcalc = 0.97, tcrit = 1.97, p = 0.332)
Sophomore and Senior (tcalc = 0.28, tcrit = 1.98, p = 0.78)
Do you feel you bonded with your classmates in online learning? Freshman and Sophomore (tcalc = 1.36, tcrit = 1.97, p = 0.17)
Freshman and Senior (tcalc = 0.946, tcrit = 1.97, p = 0.35)
Sophomore and Senior (tcalc = 1.96, tcrit = 1.98, p = 0.052)
Do you feel you have bonded with your chemistry professor in online learning? Freshman and Sophomore (tcalc= 0.61, tcrit = 1.97, p = 0.54)
Freshman and Senior (tcalc= 2.14, tcrit = 1.97, p = 0.034) *
Sophomore and Senior (tcalc= 1.39, tcrit = 1.98, p = 0.16)
Do you feel a sense of belonging in the STEM field?Freshman and Sophomore (tcalc = 1.86, tcrit = 1.97, p = 0.064)
Freshman and Senior (tcalc = 0.852, tcrit = 1.97, p = 0.395)
Sophomore and Senior (tcalc = 0.647, tcrit = 1.98, p = 0.519)
* Statistically different at a 95% level of confidence.
Table 8. Statistical Comparison of Sense of Belonging and Comparison with Gender and First-Generation Status.
QuestionDemographic Comparison by First-Generation Status and Gender
Do you feel a sense of belonging in the course?Male and Female (tcalc = 2.72, tcrit = 1.97, p = 0.0070) *
First Gen/Low-Income and Non-First (tcalc = 1.89, tcrit = 1.97, p = 0.059)
Do you feel you bonded with your classmates in online learning? Male and Female (tcalc = 0.406, tcrit = 1.97, p = 0.685)
First Gen/Low-Income and Non-First-Gen/Low-Income (tcalc = 1.76, tcrit = 1.97, p = 0.080)
Do you feel you have bonded with your chemistry professor in online learning? Male and Female (tcalc = 0.39, tcrit = 1.97, p = 0.70)
First Gen/Low-Income and Non-First-Gen/Low-Income
(tcalc = 0.83, tcrit = 1.97, p = 0.40)
Do you feel a sense of belonging in the STEM field?Male and Female (tcalc 4.27, tcrit = 1.97, p = 0.00003) *
First Gen/Low-Income and Non-First-Gen/Low-Income (tcalc = 0.61, tcrit = 1.97, p = 0.53)
* Statistically different at a 95% level of confidence.
Table 9. Statistical Comparison of Sense of Belonging and Comparison with Ethnicity.
QuestionDemographic Comparison by Ethnicity
Do you feel a sense of belonging in the course?Asian/Pacific Islander and Black/African (tcalc = 1.45, tcrit = 1.98, p = 0.15)
Asian/Pacific Islander and White/Caucasian (tcalc = 3.32, tcrit = 1.97, p = 0.0010) *
Black/African and White/Caucasian (tcalc = 0.80 tcrit = 1.97, p = 0.43)
Do you feel you bonded with your classmates in online learning? Asian/Pacific Islander and Black/African (tcalc = 0.54, tcrit = 1.98, p = 0.59)
Asian/Pacific Islander and White/Caucasian (tcalc = 1.966, tcrit = 1.97, p = 0.0505)
Black/African and White/Caucasian (tcalc = 1.96, tcrit = 1.97, p = 0.052)
Do you feel you have bonded with your chemistry professor in online learning? Asian/Pacific Islander and Black/African (tcalc = 0.033, tcrit = 1.98, p = 0.973)
Asian/Pacific Islander and White/Caucasian (tcalc = 1.12, tcrit = 1.97, p = 0.26)
Black/African and White/Caucasian (tcalc = 0.820, tcrit = 1.97, p = 0.41)
Do you feel a sense of belonging in the STEM field?Asian/Pacific Islander and Black/African (tcalc = 3.38, tcrit = 1.98, p = 0.00098) *
Asian/Pacific Islander and White/Caucasian (tcalc = 2.42, tcrit = 1.97, p = 0.016) *
Black/African and White/Caucasian (tcalc = 1.45, tcrit = 1.97, p = 0.15)
* Statistically different at a 95% level of confidence.
Publisher’s Note: MDPI stays neutral with regard to jurisdictional claims in published maps and institutional affiliations.