1. Introduction
The Sars-CoV2 virus, causing the COVID-19 disease, began in Wuhan, China, in December 2019. COVID-19 was declared a pandemic by the World Health Organization (WHO) on 11 March 2020, forcing the world population to go through curfews and quarantines [
1]. By June 2021, almost a year and a half later, 177 million infected people and 3 million deaths were reported [
2]. The disruptive effects of the COVID-19 outbreak have caused a considerable impact around the world in different areas such as physical and mental health, education, economy, and telecommunications. In this research, all of these social areas are analyzed among students of several universities of Ecuador.
1.1. Physical and Mental Health Impacts
The COVID-19 pandemic has not only brought regulations to ensure social distancing but also misinformation related to how to treat the disease. The high mortality rate in hospitals has affected the mental health of many people around the world. However, the form and degree of this impact largely depends on the health system, the policies imposed by the governments, and the culture of the country where people live [
3,
4]. During the curfews and quarantines because of COVID-19, the fear of being infected and the little social contact increased the cases of anxiety, depression, anger, confusion, and post-traumatic symptoms [
5,
6,
7,
8,
9,
10]. Some studies have reported that the social distancing, self-isolation, quarantines, economic problems, and misinformation are the major contributing factors towards unusual depressive feelings [
11]. In Ecuador, people who suffered the biggest psychological impacts were women and young students according to [
3,
12].
Physical activity was also impacted during the pandemic [
13,
14]. According to [
14], less than 30% of people achieved “sufficient” levels of activity during the lockdowns. Additionally, research shows that the pandemic originated variations in people’s eating habits, causing considerable changes in their body weight [
15].
1.2. Economy Impacts
By June 2020, the global growth was about −4.9% according to the International Monetary Fund [
16]. However, according to the same entity, the expected growth for the end of 2021 is about 6% because of the early implementation of vaccination processes in many countries [
17]. Socioeconomic inequality between countries is an important variable to consider when talking about people’s mental health [
4]. Most of the countries and companies have decreased their production due to the mandatory quarantines around the world. As a result, the income of many families has been lost or reduced [
18]. In Latin America, most of the economical activity is based on the agro-industrial sector, which has been impacted by the confinement [
19]. In this context, Ecuador reported a growth of −8.86% by the end of 2020 [
20]. According to the study carried out by the United Nations Children’s Fund (UNICEF), in Ecuador, it is estimated that 3.1 million of children and adolescents felt into multidimensional poverty by the end of 2020. This means that their homes suffered one or more deprivations in education, health, food, housing, work, or social security [
21].
Regarding higher education, both public and private universities have been hit hard by the economic crisis [
22]. The budget of public universities has been reduced [
22] because governments have decreased their incomes. For its part, the budget of private universities has also been reduced because their incomes depend on the payments of the students [
23].
1.3. Education Impacts
An area impacted a lot by COVID-19 is education. Since the pandemic began, more than 100 million teachers have been affected, and 1.6 billion of students have lost access to education [
24]. In different countries, the academic activities have been greatly affected by generating new educational habits in students and teachers [
25,
26]. Additionally, the emotional and personal development of students are truncated due to the confinement. In this context, the universities changed their resources and material of the traditional onsite education system to online classes for the complete academic year [
27,
28,
29].
Surprisingly, some university programs have been positively impacted by virtual education. In a survey of 2197 people, the students of Computer Science felt more prepared, comfortable, and in general they felt better [
30]. Similarly, in social sciences, most of the students agreed that asynchronous virtual classes have positive consequences because it opens the possibility of a better time management [
31]. However, in disciplines such as medicine or engineering, the negative impact has been significant. The access to the practical learning processes has been lost or changed to a virtual modality, leading to a loss of development of practical skills [
32].
1.4. Telecommunication Impacts
During early 2020, the Sars-CoV2 virus rapidly spread worldwide, forcing many governments to impose strict lockdown measures to tackle this pandemic. This significantly changed the people’s mobility and the use of their mobile networks and electronic devices. Different business have focused their interest and dependence on digital communication systems [
33]. However, worldwide, approximately 3.6 billion people had no access to the Internet by April 2020 [
33]. In the US, during 2020, the Internet traffic related to online meetings for work and study activities grew by 300% compared with the past years (before the pandemic). [
34]. This problem is worse in Latin America, where only 14% of the rural population has access to the Internet [
35].
1.5. Method for Exploratory Studies PLS-SEM
In different exploratory studies, Partial Least Squares Structural Equation Modeling (PLS-SEM) is commonly used for analyzing social areas through questionnaires or interviews [
36,
37,
38,
39,
40]. For instance, in [
40], PLS-SEM was used to analyze the facilities that universities offered to their students in green entrepreneurship intentions during the COVID-19 lockdown. The research proposed in [
39] uses PLS-SEM to analyze the intention of university students to abandon online classes during the pandemic. For its part, the study conducted in [
38] explores the emotional effects caused by the adoption of new technologies for online classes. Another study [
37] used PLS-SEM to evaluate the economic impact and mental health of university students. In this context, the objective of our work is to analyze how the pandemic has affected the learning process of Ecuadorian university students.
1.6. Article Overview
The main contribution of this paper is the identification of relationships among different areas (dimensions) of Ecuadorian university students that have been affected during lockdown. For this analysis, data from 1841 students belonging to public and private universities of Ecuador were used. We have analyzed the factors which influence the students’ perception of online classes, such as family income, mood, teacher preparation, and access to learning tools, among others. The exploratory study is carried out among dimensions and responses to questions using Partial Least Squares Structural Equation Modeling (PLS-SEM).
The rest of this paper is organized as follows.
Section 2 presents the Materials and Methods, where we describe the dataset and methods used in this work. In
Section 3, the creation of the proposed dimensions with each related question is described. In
Section 4, the dimensional experiments to analyze the proposed hypothesis, and the results of these experiments are shown and analyzed. In
Section 5, a discussion over the results is presented. In
Section 6, the findings of this research as well as the outlines of the future work are mentioned.
2. Materials and Methods
2.1. Dataset
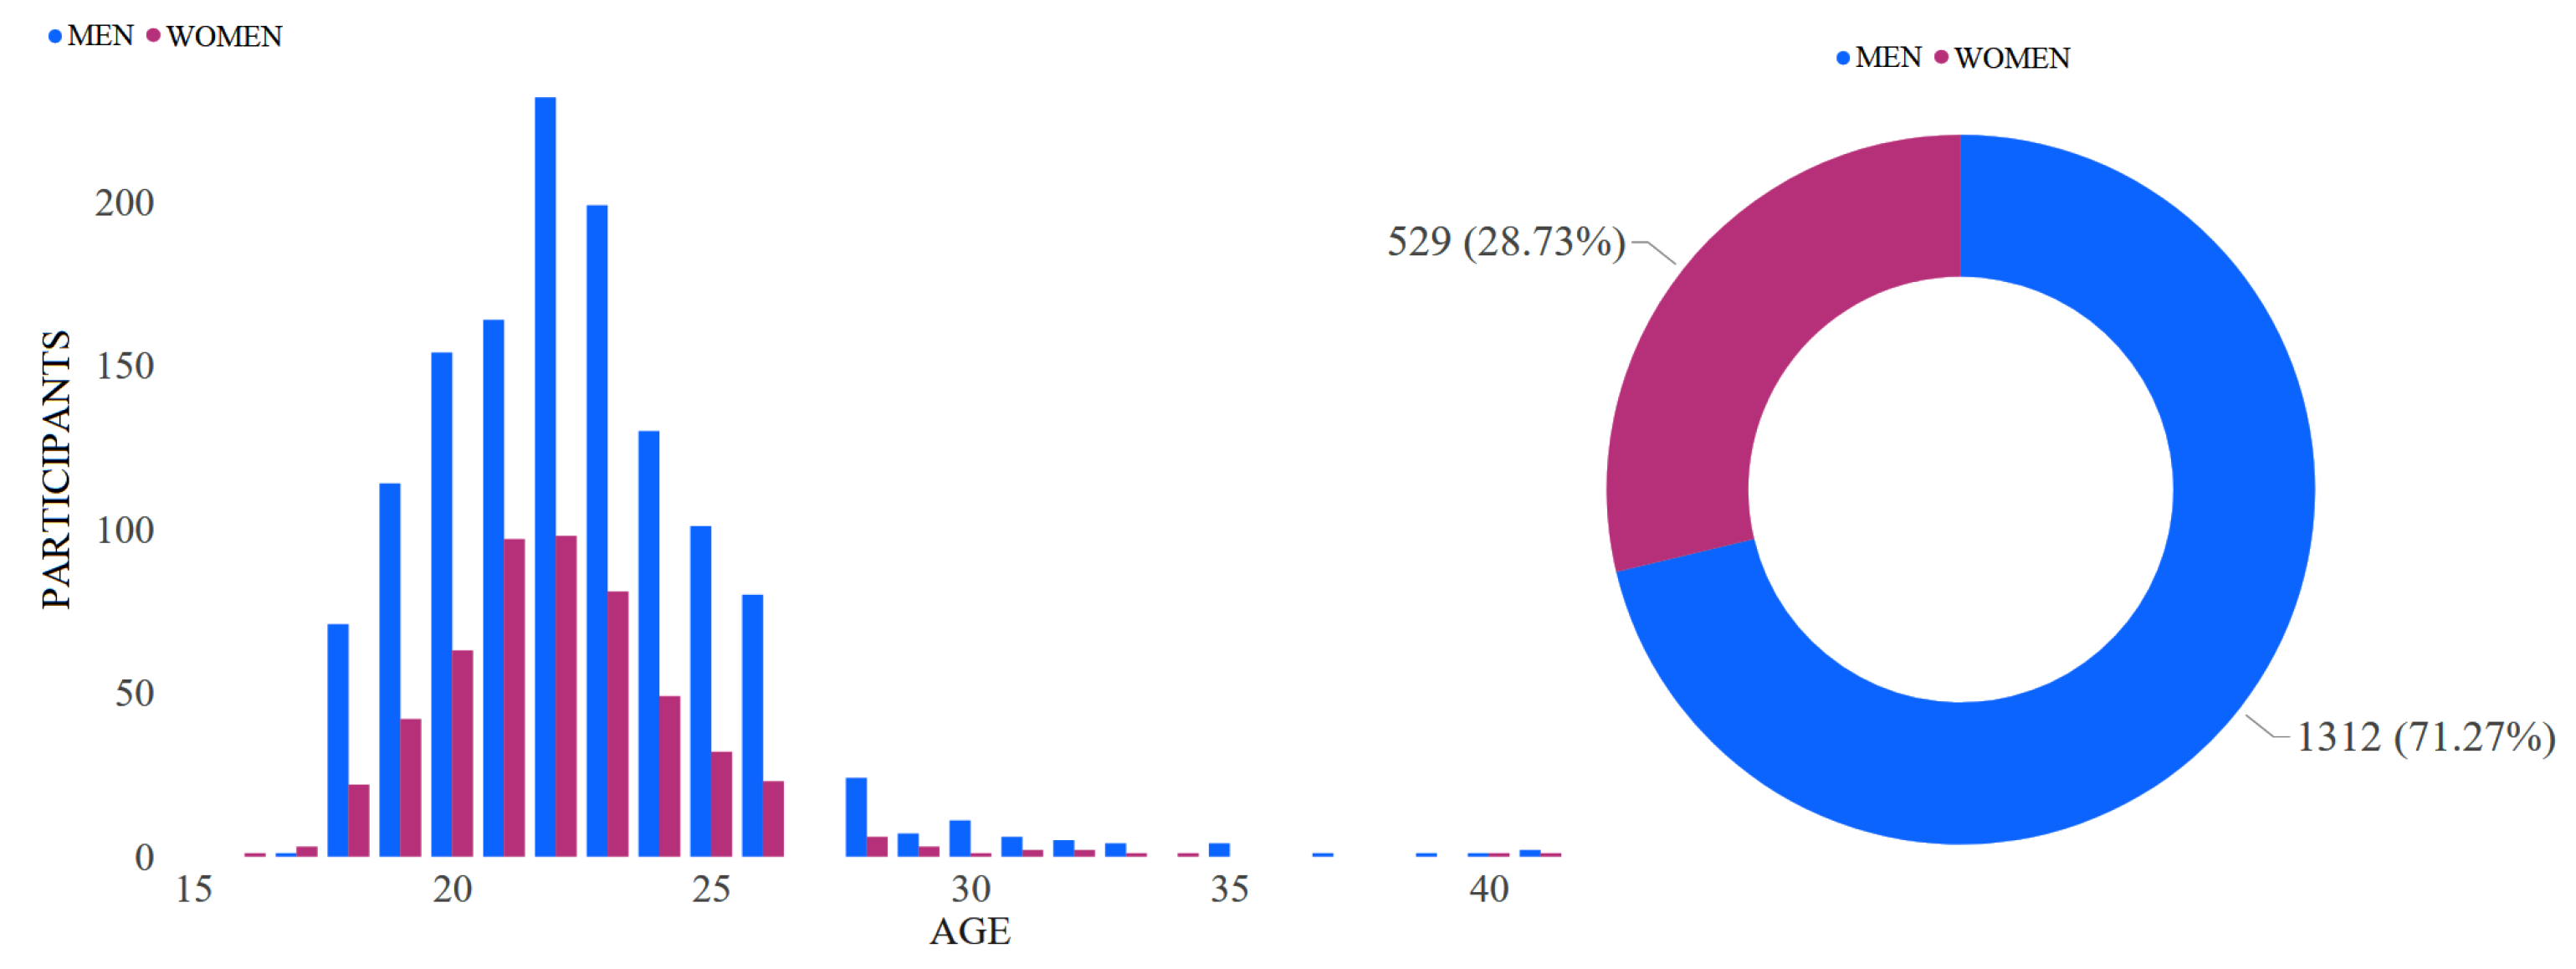
The participants in our study are students from 6 public and 5 private universities of Ecuador. The dataset was obtained between May and September 2020. The total number of participants is 1841, between 16 and 41 years old, who answered 47 questions. Of these, 1312 (71.27%) of the participants are men, and 529 (28.73%) are women, as can be observed in
Figure 1.
2.1.1. Universities
Out of the 1841 participants, 1235 (67.08%) and 606 (32.92%) students come from public and private universities, respectively.
2.1.2. Provinces and Cities
The participants come from 90 different cities belonging to the 24 provinces of Ecuador. The main cities and their corresponding number of participants can be seen in
Figure 2. It is important to note that Quito (in the Pichincha province) and Guayaquil (in the Guayas province) are the largest cities in the country.
2.2. Hypotheses
Different hypotheses have been formulated in our research looking for relationships between responses of questions and latent variables. These hypotheses are described below:
Hypothesis 1 (H1). Participants’ information (age, semester, and educational level) does not affect their opinion about online classes (continue online, qualified teachers, and opinion of online classes).
Hypothesis 2 (H2). The mood (emotional state and financial need) affects the students’ opinion of the online classes (continue online, qualified teachers, and opinion of online classes).
Hypothesis 3 (H3). Family income (income) influences how students access the Internet during online classes (simultaneous PC use, way of Internet access, Internet velocity, and tools for online learning).
2.3. Method
For SEM, there are two approaches: the analysis of structures of Covariance-Based SEM (CB-SEM), and the Partial Least Squares (PLS-SEM) based on analysis of variance.
CB-SEM and PLS-SEM are commonly used for doing research in social areas [
41,
42,
43]. To select an specific method, the following premises are recommended [
44,
45,
46,
47]:
PLS-SEM is recommended for the identification and validation of the inputs corresponding to a specific dimension (latent construct).
If the goal is to develop a theory evaluation, theory confirmation, or a comparison of two or more theories, CB-SEM is recommended.
If the objective is to create an exploratory structural theory, which is our case, PLS-SEM is recommended.
In our work, PLS-SEM is implemented through SmartPLS software version 3.3.3. PLS-SEM methodology presents two measurement approaches: formative and reflective. Formative measures analyze the relationships between dimensions, and reflective measures analyze the influence of variables within a dimension [
48].
Figure 3 shows the statistical tests used for the evaluation of the formative and reflective measurement models, and
Figure 4 describes the parameters for global evaluation of the structural model.
3. Dimensions
In our research, each question
, where
N denotes the number of question, has been grouped into seven dimensions
, where each dimension covers a particular topic. The questions selected for each dimension were selected based on the analysis shown in
Section 4 (Experiments and Results). It is important to note that some questions were excluded from the analysis because of the lack of enough answers for these questions. These excluded questions are shown in the
Appendix B.
3.1. Dimension Zero —Participant’s Personal Information
Six questions have been grouped in dimension zero (
). Out of the six questions, the following four questions were considered for the analysis. These questions are intended to collect the personal information of the participants (
Appendix B.1), as described below:
: What is your education level?
: What semester are you taking?
: What province are you currently in?
: What city are you currently in?
3.2. Dimension One —Online Classes
Three questions have been grouped in dimension one (
). These questions are intended to collect information about the satisfaction level of students with the new learning modality (
Appendix B.2).
: Based on your opinion, online classes, due to the pandemic, are better, the same or worse than face-to-face classes?
: Based on your opinion, after the pandemic ends, would you like to continue attending online classes?
: Based on your opinion, are your teachers trained to teach online?
3.3. Dimension Two —Basic Instruments for Online Learning
Three questions have been grouped in dimension two (
). These questions are intended to collect information about how students access electronic devices, computers, tablets, or necessary tools to take online classes (
Appendix B.3). The following questions are included in the current dimension:
: Do you have a computer for all-day use?
: How long do you have access to a computer per day?
: Do you have a smartphone or tablet?
3.4. Dimension Three —Internet Connection
Five questions have been grouped in dimension three (
). Out of the five questions, the following three questions were considered for the analysis. These questions are intended to collect information about students’ internet access conditions (
Appendix B.4):
: How do you access Internet?
: On average, how many people are using Internet simultaneously in your house?
: What is the download speed of your Internet connection?
3.5. Dimension Four —Mood and Physical State
Seven questions have been grouped in dimension four (
). Out of the seven questions, the following four questions were considered for the analysis. These questions are intended to collect information about the physical and emotional state of the students during the lockdown (
Appendix B.5):
: What has your mood been most of the time since March 2020 (start date of lockdown in Ecuador)?
: Has your weight changed during the pandemic?
: In one word, what have you missed the most during the lockdown?
: In one word, what is the most negative thing that you have experienced during the lockdown?
3.6. Dimension Five —Income and Financial Status
Seven questions have been grouped in dimension five (
). Out of the seven questions, the following four questions were considered for the analysis. These questions are intended to collect information about the financial status of the student (
Appendix B.6):
: If you are financially dependent, what is the monthly income of your family?. If you are financially independent, what is your monthly income?
: Since March 2020 (start date of the lockdown in Ecuador), have you had any temporary or permanent problem caused by the pandemic to cover any basic need (health, food, housing, clothing, and education)?
: What are these basic needs? (See ).
: Do you think that there will be a prosperous future in Ecuador after the pandemic ends?
3.7. Dimension Six —Relatives Affected by COVID-19
Fourteen questions have been grouped in dimension six (
). These questions are intended to collect information about COVID-19 from the students’ own experience (
Appendix B.7). We have used these questions only to contrast the answers to the previous dimensions. These questions reflect the opinion of the participants as well as information regarding the period of time in which we conducted this research. These questions are not used in the construction of the final model. Out of the 14 questions, the following questions were attached for visualization:
: Have you tested positive for COVID-19 (with a RT-PCR or a rapid test)?
: If the previous answer is yes, have you recovered from COVID-19?
: Do you have any relative who died from COVID-19?
: What do you think about the origin of the Sars-CoV2?
: When do you think we will return to the normal activities in Ecuador?
4. Experiments and Results
The experiments are based on identifying valid statistical relationships among the proposed dimensions. The results among dimensions
(
Section 4.2) as well as the results related to the input questions of each dimension (
Section 4.1) are detailed below.
4.1. Dimensions
As an exploratory detail for
(
Section 3.2), the acceptance of the students in returning to on-site classes is presented in
Figure 5. The information is ordered according to the Internet speed of the participants (axis
X). The average result shows that 63.78% of students prefer to return to on-site classes regardless of their condition of Internet connection.
In
Figure 6, the distribution of participants according to family income and Internet speed are exposed. The majority of participants have a low Internet connection speed. The result of the survey shows the polarization regarding Internet speed and the level of income during the lockdown period.
Figure 7 shows the changes in the physical state of the participants. The results indicate the gain or loss of weight of the participants during the period of the analysis. It can be noted that the 50.1% of participants suffered alterations in their body weight.
In
Figure 8, the results of the mood of the participants are presented. It can be seen that 74.24% of the participants show mostly stress, fear, boredom, sadness, or annoyance. For its part, normal and happiness states reach 23.1% and 2.66%, respectively.
An additional analysis such as mood (
) and income (
) can be found in
Figure A1. The mood (
) and desire to continue in online classes (
) are exposed in
Figure A2. Internet speed (
) and income (
) are described in
Figure A3. How students access the Internet (
) and their income (
) can be found in
Figure A4. All figures are described in the
Appendix A.
4.2. Structural Model
In our research, different models have been tested to obtain the best relationship between each input question and its dimension, as well as the relationships among dimensions (
Figure A6). The best relationships obtained between each dimensional input question are presented in
Figure 9. For instance, the best relation of dimension zero is obtained by combining the questions regarding age, educational level, and semester. This means that these three questions describe dimension zero by around 49.9%. In
Figure 10, we can see the path with the
t statistical value between connections of each dimension. For example, from dimension zero to dimension one, the model shows a
t value of 8.386, which indicates a strong relationship.
Reliability and Validity Evaluation
The reliability of the variables was tested using Composite Reliability (CR) [
52,
53]. For this purpose, the overall sample was assessed, and the items with a factor less than 0.6 were discarded. However, few factors with a correlation value less than 0.6 were taken into account due to their strong path relationship with the dimension, as it can be observed in
Figure 9 (e.g., Educational Level for
). The Average Variance Extracted (AVE) [
54] and CRs were higher or close to 0.500 and 0.700, respectively, which indicates that the model fitted to the data is valid. The AVE value, shown in each dimension in
Figure 9, indicates the percentage of the description of that dimension with the considered input questions. In
Table 1 the CR and the AVE values for each dimension are presented. For example, the AVE value for
indicates that its inputs describe 54.6% of this dimension, whereas the CR value indicates a composite reliability of the inputs of
of 0.763.
For the path model, in
Table 2, we can observe the
t statistics (the higher, the better) and the
p value (the lower, the better) for all paths. Most of the
t statistics are greater than 1.96 (95% of confidence level). The
p value of the path
is 0.352, suggesting that
is not related to
. It means that the mood (
) does not have direct relation to online classes (
); consequently, Hypothesis 2 is rejected.
5. Discussion
Hypothesis 1: Participants’ information (age, semester, and educational level) does not affect their opinion about online classes (continue online, qualified teachers, and opinion of virtual classes). Since the value of the t statistic is greater than 1.96 (8.207), this hypothesis is confirmed by the data. Additionally, our analysis indicates that the students want to return to on-site classes regardless of if they have the right tools to keep taking online classes.
Hypothesis 2: The mood (emotional state and financial need) affects the students’ opinion of the online classes (continue online, qualified teachers, and opinion of virtual classes). The value of the t-statistic of 0.932 indicates that the mood has a relative influence on the perception of students about online classes. Therefore, we cannot categorically reject this hypothesis.
Hypothesis 3: Family income (income) influences how students access the Internet during online classes (simultaneous PC use, way of Internet access, Internet velocity, and tools for online learning). Since the values of the t statistical are greater than the recommended 1.96, (8.731 for the path (Income) → (Basic instruments for online learning), 7.724 for the path (Income) →(Internet connection), and 12.958 for the path (Income) →(Internet access), this hypothesis is confirmed by the data.
Additionally, regarding the state of mind, we can observe that the students mostly present states related to feelings of sadness (9.02%), stress (39.73%), and fear (12.17%). Similarly, the physical state of the students changed. The percentage of students who experienced a change in their weight is 50.10%.
Comparison of Studies Carried Out before and during COVID-19
The study carried out in [
55] shows an analysis of several dimensions in the context of the pandemic of COVID-19 considering university students from Ecuador, Spain, and Italy. The data were acquired between March and April 2020. The study had responses from 300 participants. In Ecuador, 100 students from the Technical University of Machala participated in this research. One of the findings of this work is that online classes and the lack of enough tools (laptop, Internet, and smartphones) have contributed to negatively impacting the opinions of students about their learning process. In
Table 3, the data show the negative perception about online classes, with 93.00% in Spain, 83.30% in Ecuador, and 64.80% in Italy [
55]. Additionally, we add our results regarding the participants’ desire to not continue taking online classes.
To the best of our knowledge, in order to make a comparison between the results of our analysis during the COVID-19 pandemic and the results before this pandemic, the studies existing in Ecuador [
56,
57,
58,
59] do not have data of the variables analyzed in this work.
6. Conclusions
In this work, we surveyed 1841 Ecuadorian university students about the impact of COVID-19 in areas such as health, emotional state, perception of online classes, and economic income in a snapshot between May to September 2020. These students come from six public and five private universities. The analysis considered the responses to 21 questions out of a total of 47 questions, which were grouped to form 7 dimensions: participants’ information, online classes, basic instruments for online learning, Internet connection, mood and physical state, income and financial status, and relatives affected by COVID-19. The 26 discarded questions have no relevant information for the areas of the analysis of this work.
The PLS-SEM technique was used to analyze the relations between six dimensions. The reason why the dimension “relatives affected by COVID-19” was excluded from this analysis is because only a small number of participants answered the questions of this dimension. The results of this analysis show that participants’ income has a strong effect on the way how they access to the internet and the availability of electronic tools (computers, smartphones, and tablets) needed for online learning: The higher the income, the higher the speed of the Internet connection. Additionally, the higher the income, the larger the number of electronic tools and the longer the time of their availability.
We also found that the income affected the mood of the participants during the period of analysis. The participants with higher income experienced, most of the time, positive feelings: happiness and normal (such as before the pandemic); whereas the participants with lower income experienced, most of the time, negative feelings (sadness, fear, stress, and annoyance). The participants’ information strongly influences their perception about online classes: Older students and students from higher semesters think that online classes are better than face-to-face classes and want to continue in online education. The mood does not have a strong influence regarding to the opinion about online classes. We also observed that students’ perception about online classes is not affected by income, the availability of basic instruments for online learning, Internet connection, and the way they access the Internet.
In this research, we could not find reasons why students have a negative perception about online classes, which should be investigated in a future work. For another future work, a new study can be executed when students go back to face-to-face classes after the Sars-CoV2 pandemic. This study will evaluate again their perception about online and face-to-face classes and its results can be compared with the results of this work.
Author Contributions
Conceptualization, L.B., Á.L.V. and M.E.B.; investigation, L.B., Á.L.V., V.H.V., and M.E.B.; project administration, L.B., Á.L.V. and M.E.B.; resources, L.B., Á.L.V., and M.E.B.; supervision, L.B., Á.L.V. and M.E.B.; validation, L.B., Á.L.V. and M.E.B.; data curation, V.H.V., D.V. and C.J.S.; software, V.H.V., D.V. and C.J.S.; visualization, V.H.V.; methodology, M.E.B.; formal analysis, M.E.B.; writing—original draft, L.B., Á.L.V., V.H.V., D.V. and C.J.S.; writing—review and editing, L.B., Á.L.V., V.H.V., and M.E.B. All authors have read and agreed to the published version of the manuscript.
Funding
This research received no external funding.
Institutional Review Board Statement
All subjects who contributed on this study participated on an entirely free and voluntary basis through an online form. The participants were informed that the data collected will be used for research and academic purposes only. In addition, to avoid the identification of the participants, the data collected for this study do not include any private information.
Informed Consent Statement
Informed consent was obtained from all subjects involved in the study.
Data Availability Statement
Acknowledgments
We thank the following people for their valuable contribution to collect the data used in this paper: Carla Manciati, Patricio Cruz, Marco Herrera, Lorena Jaramillo, Esteban Valencia, Miguel Flores, Jessica Ortiz, Víctor Andaluz, Jorge Sánchez, Marcelo Álvarez, Darío Mendoza, Diego Veloz, Miguel Duque, Xavier Sánchez, David Pozo, William Chumi, Ramiro Isa Jara, Juan Solano, Galo Valverde, Mónica Huerta, Paul Chasi, Susan Escobar, Karina Hidalgo, Jenny Rosales, Ricardo Flores, Freddy Benalcázar, Jaime Guilcapi, Rubén Nogales, and Diego Almeida. We also thank Daniel Velastegui and Cesar Santacruz for helping us to organize the data collected for this paper.
Conflicts of Interest
The authors declare no conflict of interest.
Appendix A. Additional Findings
Figure A1.
Mood of the participants in relation to their reported income. The color map is used to emphasize the number of people.
Figure A1.
Mood of the participants in relation to their reported income. The color map is used to emphasize the number of people.
Figure A2.
Participants’ mood () regarding the opinion of the online classes and qualified teachers (). The color map is used to emphasize the number of people.
Figure A2.
Participants’ mood () regarding the opinion of the online classes and qualified teachers (). The color map is used to emphasize the number of people.
Figure A3.
Participants’ Internet speed () according to their income (). The majority of participants have an Internet speed lower than 5 Mbps and an income less than $1000. The color map is used to emphasize the number of people.
Figure A3.
Participants’ Internet speed () according to their income (). The majority of participants have an Internet speed lower than 5 Mbps and an income less than $1000. The color map is used to emphasize the number of people.
Figure A4.
Figure shows how participants access to the Internet () according to their income (). Additionally, the availability of basic instruments for online learning () can be seen. The color map is used to emphasize the number of people.
Figure A4.
Figure shows how participants access to the Internet () according to their income (). Additionally, the availability of basic instruments for online learning () can be seen. The color map is used to emphasize the number of people.
Figure A5.
Different tested models: relation between participants’ information and their opinion about virtual classes (a) CR, (b) t-statistics. Relation between participants’ information and their opinion about to continue in online classes (c) CR, (d) t-statistics.
Figure A5.
Different tested models: relation between participants’ information and their opinion about virtual classes (a) CR, (b) t-statistics. Relation between participants’ information and their opinion about to continue in online classes (c) CR, (d) t-statistics.
Figure A6.
Model that shows no relationship between the perception of online classes () considering: income (), mood (), Internet connection (), Internet access (), and the availability of basic instruments for online learning ().
Figure A6.
Model that shows no relationship between the perception of online classes () considering: income (), mood (), Internet connection (), Internet access (), and the availability of basic instruments for online learning ().
Appendix B. Questionnaire
Appendix B.1. Dimension Zero—Participant’s Personal Information
Table A1.
Questions in Dimension Zero.
Table A1.
Questions in Dimension Zero.
| Dimension | Question |
|---|
| What is your gender? |
| How old are you? |
| What is your education level? |
| What semester are you taking? |
| What province are you currently in? |
| What city are you currently in? |
Appendix B.2. Dimension One—Online Classes
Table A2.
Questions in Dimension One.
Table A2.
Questions in Dimension One.
| Dimension | Question |
|---|
| Based on your opinion, online classes, due to the pandemic, are better, the same, or worse than face-to-face classes? |
| Based on your opinion, after the pandemic ends, would you like to continue attending online classes? |
| Based on your opinion, are your teachers trained to teach online? |
Appendix B.3. Dimension Two—Basic Instruments for Online Learning
Table A3.
Questions in Dimension Two.
Table A3.
Questions in Dimension Two.
| Dimension | Question |
|---|
| Do you have a computer for all-day use? |
| How long do you have access to a computer per day? |
| Do you have a smartphone or tablet? |
Appendix B.4. Dimension Three—Internet Connection
Table A4.
Questions in Dimension Three.
Table A4.
Questions in Dimension Three.
| Dimension | Question |
|---|
| How do you access Internet? |
| On average, how many people are using Internet simultaneously in your house? |
| Which is your Internet provider? |
| What is the download speed of your Internet connection? |
| What is the upload speed of your Internet connection? |
Appendix B.5. Dimension Four—Mood and Physical State
Table A5.
Questions in Dimension Four.
Table A5.
Questions in Dimension Four.
| Dimension | Question |
|---|
| What has your mood been most of the time since March 2020 (start date of lockdown in Ecuador)? |
| Have you ever thought about committing suicide due to the pandemic and the crisis caused by the Sars-CoV2 virus? |
| During the lockdown caused by the SARS-COV-2, were you alone or with company? |
| Has your weight changed during the pandemic? |
| In one word, what have you missed the most during the lockdown? |
| In one word, what is the most positive thing that you have experienced during the lockdown? |
| In one word, what is the most negative thing that you have experienced during the lockdown? |
Appendix B.6. Dimension Five—Income-Financial Status
Table A6.
Questions in Dimension Five.
Table A6.
Questions in Dimension Five.
| Dimension | Question |
|---|
| If you are financially dependent, what is the monthly income of your family? If you are financially independent, what is your monthly income? |
| Since March 2020 (start date of the lockdown in Ecuador), have you had any temporary or permanent problem caused by the pandemic to cover any basic need (health, food, housing, clothing, and education)? |
| If the answer of the previous question is yes, what are these basic needs that you have not able to cover? (See ). |
| How do you rate the management of the pandemic by the Ecuadorian government? |
| How do you rate the management of the economic crisis, caused by the pandemic, by the Ecuadorian government? |
| What is your perception about the level of corruption in Ecuador? |
| Do you think that there will be a prosperous future in Ecuador after the pandemic ends? |
Appendix B.7. Dimension Six—Relatives Affected by COVID-19
Table A7.
Questions in Dimension Six.
Table A7.
Questions in Dimension Six.
| Dimension | Question |
|---|
| Have you tested positive for COVID-19 (with a RT-PCR or a rapid test)? |
| If the previous answer is yes, have you recovered from COVID-19? |
| If you live with someone, has he/she tested positive for COVID-19 (with a RT-PCR or a rapid test)? |
| If the previous answer is yes, has he/she recovered from it? |
| Do you have any relative who died from COVID-19? |
| Has a friend of you tested positive for COVID-19 (with a RT-PCR or a rapid test)? |
| Has a friend of you died from COVID-19? |
| Has somebody in your neighborhood been infected with COVID-19? |
| Has somebody in your neighborhood died from COVID-19? |
| What is the probability that you estimate of being infected with the Sars-CoV2 virus until 31 December 2020? |
| Are you afraid of getting sick of COVID-19? |
| Are you afraid of dying from COVID-19? |
| What do you think about the origin of the Sars-CoV2? |
| When do you think we will return to the normal activities in Ecuador? |
References
- Cucinotta, D.; Vanelli, M. WHO declares COVID-19 a pandemic. Acta Bio Med. Atenei Parm. 2020, 91, 157. [Google Scholar]
- COVID Live Update: 177,162,819 Cases and 3,829,463 Deaths from the Coronavirus—Worldometer. Available online: https://www.worldometers.info/coronavirus/ (accessed on 15 June 2021).
- Mautong, H.; Gallardo-Rumbea, J.A.; Alvarado-Villa, G.E.; Fernández-Cadena, J.C.; Andrade-Molina, D.; Orellana-Román, C.E.; Cherrez-Ojeda, I. Assessment of depression, anxiety and stress levels in the Ecuadorian general population during social isolation due to the COVID-19 outbreak: A cross-sectional study. BMC Psychiatry 2021, 21, 212. [Google Scholar] [CrossRef]
- Nochaiwong, S.; Ruengorn, C.; Thavorn, K.; Hutton, B.; Awiphan, R.; Phosuya, C.; Ruanta, Y.; Wongpakaran, N.; Wongpakaran, T. Global prevalence of mental health issues among the general population during the coronavirus disease-2019 pandemic: A systematic review and meta-analysis. Sci. Rep. 2021, 11, 10173. [Google Scholar] [CrossRef]
- Saddik, B.; Hussein, A.; Albanna, A.; Elbarazi, I.; Al-Shujairi, A.; Temsah, M.H.; Saheb Sharif-Askari, F.; Stip, E.; Hamid, Q.; Halwani, R. The psychological impact of the COVID-19 pandemic on adults and children in the United Arab Emirates: A nationwide cross-sectional study. BMC Psychiatry 2021, 21, 224. [Google Scholar] [CrossRef]
- Wang, X.; Hegde, S.; Son, C.; Keller, B.; Smith, A.; Sasangohar, F. Investigating mental health of US college students during the COVID-19 pandemic: Cross-sectional survey study. J. Med. Internet Res. 2020, 22, e22817. [Google Scholar] [CrossRef]
- Zhai, Y.; Du, X. Addressing collegiate mental health amid COVID-19 pandemic. Psychiatry Res. 2020, 288, 113003. [Google Scholar] [CrossRef]
- Mukhtar, S. Pakistanis’ mental health during the COVID-19. Asian J. Psychiatry 2020, 51, 102127. [Google Scholar] [CrossRef] [PubMed]
- Pakpour, A.H.; Griffiths, M.D. The fear of COVID-19 and its role in preventive behaviors. J. Concurr. Disord. 2020, 2, 58–63. [Google Scholar] [CrossRef]
- Griffiths, M.D.; Mamun, M.A. COVID-19 suicidal behavior among couples and suicide pacts: Case study evidence from press reports. Psychiatry Res. 2020, 289, 113105. [Google Scholar] [CrossRef]
- Ahorsu, D.K.; Lin, C.Y.; Imani, V.; Saffari, M.; Griffiths, M.D.; Pakpour, A.H. The fear of COVID-19 scale: Development and initial validation. Int. J. Ment. Health Addict. 2020. Online ahead of print. [Google Scholar] [CrossRef] [PubMed] [Green Version]
- Paz, C.; Mascialino, G.; Adana-Díaz, L.; Rodríguez-Lorenzana, A.; Simbaña-Rivera, K.; Gómez-Barreno, L.; Troya, M.; Páez, M.I.; Cardenas, J.; Gerstner, R.M.; et al. Anxiety and depression in patients with confirmed and suspected COVID-19 in Ecuador. Psychiatry Clin. Neurosci. 2020, 74, 554–555. [Google Scholar] [CrossRef] [PubMed]
- Zachary, Z.; Brianna, F.; Brianna, L.; Garrett, P.; Jade, W.; Alyssa, D.; Mikayla, K. Self-quarantine and weight gain related risk factors during the COVID-19 pandemic. Obes. Res. Clin. Pract. 2020, 14, 210–216. [Google Scholar] [CrossRef]
- Gallo, L.A.; Gallo, T.F.; Young, S.L.; Moritz, K.M.; Akison, L.K. The impact of isolation measures due to COVID-19 on energy intake and physical activity levels in Australian university students. Nutrients 2020, 12, 1865. [Google Scholar] [CrossRef]
- Androutsos, O.; Perperidi, M.; Georgiou, C.; Chouliaras, G. Lifestyle Changes and Determinants of Children’s and Adolescents’ Body Weight Increase during the First COVID-19 Lockdown in Greece: The COV-EAT Study. Nutrients 2021, 13, 930. [Google Scholar] [CrossRef]
- World Economic Outlook Update, June 2020: A Crisis Like No Other, an Uncertain Recovery. Available online: https://www.imf.org/en/Publications/WEO/Issues/2020/06/24/WEOUpdateJune2020 (accessed on 15 June 2020).
- World Economic Outlook, April 2021: Managing Divergent Recoveries. Available online: https://www.imf.org/en/Publications/WEO/Issues/2021/03/23/world-economic-outlook-april-2021 (accessed on 15 June 2020).
- Tittonell, P.; Fernandez, M.; El Mujtar, V.E.; Preiss, P.V.; Sarapura, S.; Laborda, L.; Mendonça, M.A.; Alvarez, V.E.; Fernandes, G.B.; Petersen, P.; et al. Emerging responses to the COVID-19 crisis from family farming and the agroecology movement in Latin America—A rediscovery of food, farmers and collective action. Agric. Syst. 2021, 190, 103098. [Google Scholar] [CrossRef]
- Rodríguez, A.; Rodrigues, M.; Salcedo, S. The Outlook for Agriculture and Rural Development in the Americas: A Perspective on Latin America and the Caribbean. 2010. Available online: https://www.cepal.org/en/publications/1424-outlook-agricultureand-rural-development-americas-perspective-latin-america-and (accessed on 13 October 2021).
- Ecuador Nominal GDP Growth, 1992–2021|CEIC Data. Available online: https://www.ceicdata.com/en/indicator/ecuador/nominal-gdp-growth (accessed on 17 June 2020).
- El Choque COVID-19 en la Pobreza, Desigualdad y Clases Sociales en el Ecuador: Una Mirada a los Hogares con niñas, niños y Adolescentes, Quito, 21 de Octubre 2020-Ecuador. Available online: https://reliefweb.int/report/ecuador/el-choque-covid-19-en-la-pobreza-desigualdad-y-clases-sociales-en-el-ecuador-una (accessed on 10 November 2020).
- Tamrat, W.; Teferra, D. COVID-19 poses a serious threat to higher education. Univ. World News 2020, 9. Available online: https://www.universityworldnews.com/post.php?story=20200409103755715 (accessed on 13 October 2021).
- Parker, L.D. Australian universities in a pandemic world: Transforming a broken business model? J. Account. Organ. Chang. 2020, 16, 541–548. [Google Scholar] [CrossRef]
- One Year into COVID-19 Education Disruption: Where Do We Stand? Available online: https://en.unesco.org/news/one-year-covid-19-education-disruption-where-do-we-stand (accessed on 12 November 2020).
- Nguyen, D.V.; Pham, G.H.; Nguyen, D.N. Impact of the COVID-19 pandemic on perceptions and behaviors of university students in Vietnam. Data Brief 2020, 31, 105880. [Google Scholar] [CrossRef] [PubMed]
- Dwivedi, Y.K.; Hughes, D.L.; Coombs, C.; Constantiou, I.; Duan, Y.; Edwards, J.S.; Gupta, B.; Lal, B.; Misra, S.; Prashant, P.; et al. Impact of COVID-19 pandemic on information management research and practice: Transforming education, work and life. Int. J. Inf. Manag. 2020, 55, 102211. [Google Scholar] [CrossRef]
- Charissi, A.; Tympa, E.; Karavida, V. Impact of the COVID-19 Disruption on University Students’ Perceptions and Behavior. Eur. J. Educ. Stud. 2020, 7, 222–238. [Google Scholar] [CrossRef]
- Aristovnik, A.; Keržič, D.; Ravšelj, D.; Tomaževič, N.; Umek, L. Impacts of the COVID-19 pandemic on life of higher education students: A global perspective. Sustainability 2020, 12, 8438. [Google Scholar] [CrossRef]
- Osman, M.E.T. Global impact of COVID-19 on education systems: The emergency remote teaching at Sultan Qaboos University. J. Educ. Teach. 2020, 46, 463–471. [Google Scholar] [CrossRef]
- Crick, T.; Knight, C.; Watermeyer, R.; Goodall, J.; Goodall, J. The Impact of COVID-19 and “Emergency Remote Teaching” on the UK Computer Science Education Community. In Proceedings of the UKICER ’20: United Kingdom & Ireland Computing Education Research Conference, Glasgow, UK, 3–4 September 2020. [Google Scholar] [CrossRef]
- Mohamed, A.; Alawna, M.; Üniversitesi, G.; Elhadary, T.; Elhaty, I.A.; Mohamed, A.A. Evaluation of Academic Performance of Science and Social Science students in Turkish Universities during COVID-19 Crisis. J. Crit. Rev. 2020, 7, 1740–1751. Available online: https://www.researchgate.net/publication/342992199 (accessed on 13 October 2021).
- Franchi, T. The Impact of the COVID-19 Pandemic on Current Anatomy Education and Future Careers: A Student’s Perspective. Anat. Sci. Educ. 2020, 13, 312–315. [Google Scholar] [CrossRef]
- Kagame, P.; Slim, C. Special Emergency Session of the Broadband Commission Pushes for Action to Extend Internet Access and Boost Capacity to Fight COVID-19. 2020. Available online: https://www.itu.int/en/mediacentre/Pages/PR05-2020-Broadband-Commission-emergency-session-internet-COVID-19.aspx (accessed on 13 October 2021).
- Da Silva, C.A.G.; Ferrari, A.C.K.; Osinski, C.; Pelacini, D.A.F. The Behavior of Internet Traffic for Internet Services during COVID-19 Pandemic Scenario. arXiv 2021, arXiv:2105.04083. [Google Scholar]
- Wayne, D.B.; Green, M.; Neilson, E.G. Medical education in the time of COVID-19. Sci. Adv. 2020, 6. [Google Scholar] [CrossRef] [PubMed]
- Sánchez-Cañizares, S.M.; Cabeza-Ramírez, L.J.; Muñoz-Fernández, G.; Fuentes-García, F.J. Impact of the perceived risk from COVID-19 on intention to travel. Curr. Issues Tour. 2021, 24, 970–984. [Google Scholar] [CrossRef]
- Al-Okaily, M.; Alqudah, H.; Matar, A.; Lutfi, A.; Taamneh, A. Dataset on the Acceptance of e-learning System among Universities Students’ under the COVID-19 Pandemic Conditions. Data Brief 2020, 32, 106176. [Google Scholar] [CrossRef] [PubMed]
- Al-Maroof, R.S.; Salloum, S.A.; Hassanien, A.E.; Shaalan, K. Fear from COVID-19 and technology adoption: The impact of Google Meet during Coronavirus pandemic. Interact. Learn. Environ. 2020. [Google Scholar] [CrossRef]
- López-Aguilar, D.; Álvarez-Pérez, P.R. Modelo predictivo PLS-SEM sobre intención de abandono académico universitario durante la COVID-19. Rev. Complut. Educ. 2021, 32, 451. [Google Scholar] [CrossRef]
- Alvarez-Risco, A.; Mlodzianowska, S.; García-Ibarra, V.; Rosen, M.A.; Del-Aguila-Arcentales, S. Factors Affecting Green Entrepreneurship Intentions in Business University Students in COVID-19 Pandemic Times: Case of Ecuador. Sustainability 2021, 13, 6447. [Google Scholar] [CrossRef]
- Ringle, C.; Wende, S.; Becker, J. SmartPLS 3; SmartPLS GmbH: Boenningstedt, Germany, 2015. [Google Scholar]
- Fornell, C.; Larcker, D.F. Evaluating structural equation models with unobservable variables and measurement error. J. Mark. Res. 1981, 18, 39–50. [Google Scholar] [CrossRef]
- Lopez-Odar, D.; Alvarez-Risco, A.; Vara-Horna, A.; Chafloque-Cespedes, R.; Sekar, M.C. Validity and reliability of the questionnaire that evaluates factors associated with perceived environmental behavior and perceived ecological purchasing behavior in Peruvian consumers. Soc. Responsib. J. 2019, 16. [Google Scholar] [CrossRef]
- Streukens, S.; Leroi-Werelds, S. Bootstrapping and PLS-SEM: A step-by-step guide to get more out of your bootstrap results. Eur. Manag. J. 2016, 34, 618–632. [Google Scholar] [CrossRef]
- Jannoo, Z.; Yap, B.; Auchoybur, N.; Lazim, M.A. The effect of nonnormality on CB-SEM and PLS-SEM path estimates. Int. J. Math. Comput. Phys. Quantum Eng. 2014, 8, 285–291. [Google Scholar]
- Awang, Z.; Afthanorhan, A.; Asri, M. Parametric and non parametric approach in structural equation modeling (SEM): The application of bootstrapping. Mod. Appl. Sci. 2015, 9, 58. [Google Scholar] [CrossRef]
- Mozahem, N.A.; Adlouni, R.O. Using entrepreneurial self-efficacy as an indirect measure of entrepreneurial education. Int. J. Manag. Educ. 2021, 19, 100385. [Google Scholar] [CrossRef]
- Mueller, R.O.; Hancock, G.R. Structural Equation Modeling; Routledge/Taylor & Francis Group: Abingdon, UK, 2019. [Google Scholar]
- Hair, J.F., Jr.; Hult, G.T.M.; Ringle, C.M.; Sarstedt, M. A primer on Partial Least Squares Structural Equation Modeling (PLS-SEM); Sage Publications: London, UK, 2021. [Google Scholar]
- Klem, L. Structural Equation Modeling. 2000. Available online: https://psycnet.apa.org/record/2000-00427-007 (accessed on 13 October 2021).
- Stein, C.M.; Morris, N.J.; Nock, N.L. Structural equation modeling. In Statistical Human Genetics; Springer: Berlin/Heidelberg, Germany, 2012; pp. 495–512. [Google Scholar]
- Bacon, D.R.; Sauer, P.L.; Young, M. Composite reliability in structural equations modeling. Educ. Psychol. Meas. 1995, 55, 394–406. [Google Scholar] [CrossRef]
- Raykov, T. Coefficient alpha and composite reliability with interrelated nonhomogeneous items. Appl. Psychol. Meas. 1998, 22, 375–385. [Google Scholar] [CrossRef]
- Valentini, F.; Damasio, B.F. Average variance extracted and composite reliability: Reliability coefficients/variancia media extraida e confiabilidade composta: Indicadores de Precisao. Psicol. Teor. E Pesqui. 2016, 32. Available online: https://link.gale.com/apps/doc/A535612015/IFME?u=anon~cd247ff0&sid=googleScholar&xid=3bd0a0ae (accessed on 13 October 2021).
- Tejedor, S.; Cervi, L.; Tusa, F.; Parola, A. Education in times of pandemic: Reflections of students and teachers on virtual university education in Spain, Italy, and Ecuador. Rev. Lat. Comun. Soc. 2020. [Google Scholar] [CrossRef]
- Vinueza, S.F.V.; Gallardo, V.P.S. Impacto de las TIC en la Educación Superior en el Ecuador. Rev. Publicando 2017, 4, 355–368. [Google Scholar]
- Lagos, G.G. El M-learning, un nuevo escenario en la Educación superior del Ecuador. INNOVA Res. J. 2018, 3, 114–122. [Google Scholar] [CrossRef]
- Yamba-Yugsi, M.; Luján-Mora, S. Cursos MOOC: Factores que disminuyen el abandono en los participantes. Enfoque UTE 2017, 8, 1–15. [Google Scholar] [CrossRef] [Green Version]
- Ramírez Anormaliza, R.I.; Sabaté i Garriga, F.; Guevara Viejo, F. Evaluating student acceptance level of e-learning systems. In Proceedings of the ICERI2015: Proceedings 8th International Conference of Education, Research and Innovation, Seville, Spain, 16–18 November 2015; pp. 2393–2399. Available online: http://hdl.handle.net/2117/80996 (accessed on 13 October 2021).
| Publisher’s Note: MDPI stays neutral with regard to jurisdictional claims in published maps and institutional affiliations. |
© 2021 by the authors. Licensee MDPI, Basel, Switzerland. This article is an open access article distributed under the terms and conditions of the Creative Commons Attribution (CC BY) license (https://creativecommons.org/licenses/by/4.0/).


 ,
, 


