1. Introduction
The incursion of big data has produced a new “hyperbolic” phenomenon related to the datafication of society [
1], which is having a direct impact on higher education [
2,
3,
4]. Big data have been presented with great enthusiasm as the new engine of an intensive knowledge economy based on data mining techniques and artificial intelligence mechanisms for the generation of automated processes tailored to the user whose data are traced [
5]. It is what we call data science, an open term applicable to many disciplines, understood as the set of techniques and principles that regulate the collection and measurement of data on a given process.
In the field of education, data mining techniques have generated powerful movements, among which learning analytics particularly stands out [
6,
7,
8]. Along these lines, we define learning analytics as “the measurement, collection, analysis, and reporting of data about learners and their contexts in order to understand and optimize learning and the environments in which it occurs” [
9] (p. 8). This is why it is considered as an emerging field of research in education that is expanding and amplifying with the rise in blended and online teaching and learning. Learning analytics is a powerful tool that can provide us with information on the interaction processes between students when using digital learning environments [
10,
11]. In addition, there is a need for the teachers to track students and evaluate learning activities, and learning analytics facilitates both tasks [
12].
Learning analytics offers information to teachers thanks to the analysis and interpretation of data, allowing them to improve the educational practice and optimize student performance. In this sense, it enables the teacher to make a methodological change in the way they communicate and relate to students, enhancing the role of facilitator, guide, counselor, evaluator... offering more objective and detailed feedback, facilitating a true learning experience and, consequently, improving teaching and the academic results of students [
13].
Nevertheless, there are voices that highlight certain critical aspects of the use of learning analytics. Some authors such as Prinsloo [
14] consider that the most important challenge today is not the access to information or its exploitation by means of powerful algorithms, but rather the use of these data and the very fact of their mere existence, which can make a system vulnerable in ways that we cannot anticipate.
On the other hand, it should be noted, in relation to the quality of higher education [
15], that one of the key indicators refers to interactions in shared spaces of digital environments, which is reinforced by the existing literature establishing the positive relationship between interaction and learning performance in online education models [
16,
17]. Another indicator in online education is that the teacher’s presence (cognitive, social, teaching) in digital environments, manifested in monitoring and feedback, becomes crucial for the students’ learning progress [
18,
19].
In an online educational model, in line with Goodyear [
20] and Guardia [
21], it is essential to design the training project using a methodology that guides decision making for each of the elements that make up the course. Everything must be ready in the virtual environment when beginning the teaching and learning process: planning, activities, resources, tools, modeling, and evaluation criteria and instruments. In an online learning environment, to keep students in training and motivated, there are two key elements: the first is the collaborative processes between students [
22,
23], and the second is a continuous, complex, and diversified assessment [
24,
25] that is supported by a feedback process [
26,
27] focused on improving the student’s learning process.
In this context, this article shows the results of a case study with a control and an experimental group on the improvement in the design, monitoring, assessment, and evaluation of virtual discussions using a software based on web technologies, called DIANA (DIAlog ANAlysis), a learning analytics tool designed ad-hoc. This tool was created to calculate a set of metrics and to provide teachers with information on student performance (number of responses, popularity, temporality of messages, level of participation, dispersion…) when students interact with each other by exchanging messages in asynchronous online discussions. This activity is one of the most common and complex activities to evaluate in online and hybrid environments [
28]. The DIANA tool was used with two clear objectives; on the one hand, as a learning analytics tool to support the teaching process of teachers in those control and experimental groups where the tool was only used in the second group. On the other hand, DIANA was also used as a data collection instrument for the analysis of the communicative interaction between students.
According to the previous context, in this article, we show the results of applying a tool designed for the Moodle environment (DIANA) where the contributions are oriented in the field of improvement in the teaching–learning experience itself through an appropriate design of the subject that affects the personalization of learning. Furthermore, this experience also makes an approach toward the assessment and evaluation of online learning. At the end of the day, this study is framed in the project “Use of learning analytics in digital environments: impact on the improvement of university teaching practice” (LAxDigTeach-21085GE), where one of the objectives is to analyze the academic impact of applying learning analytics in university digital environments.
To answer this objective, we proposed the following research questions:
What changes does the DIANA tool facilitate in the design, monitoring, and assessment of asynchronous discussions for teachers?
What does learning analytics contribute to the improvement in student performance?
2. Materials and Methods
2.1. Research Context and Sample
The context in which this study takes place corresponds to the Master’s degree in Digital Education coordinated by the University of Extremadura in Spain during the year 2022/2023. The master’s degree is taught virtually and is focused on research (i.e., it provides the basis for developing research skills such as research methods) as well as critical and independent thinking in the field of educational technology.
Two of the master’s subjects were selected because they included an asynchronous online discussion as an assessment activity. We therefore contacted the teachers of these subjects and invited them to participate in the pilot study as part of the control and experimental groups.
Table 1 shows the duration of the subjects and the period in which the discussion activity took place.
The sample group participating in the subjects was made up of 20 students (the same number in each subject) and two teachers (one for each subject). The pilot study aimed to analyze the impact of using learning analytics in a subject without using the DIANA learning analytics tool (control group) and another using the tool (experimental group) in two different discussions.
Being two different subjects and not simultaneous in time, coordinated work was carried out between the two teachers regarding the design and presentation of the discussion activity and the information provided to the students in the virtual space. With the intention of reproducing the development of the activity under the same or very similar conditions, the following decisions were taken according to the indications of the research team:
The duration of the discussion would be between 10 and 15 days starting in the second week of the course.
The discussion would consist of three discussion threads with a start and end date for each thread.
At the end of the discussion there would be a final contribution by the teacher as a summary with the final conclusions.
2.2. Research Methodology
In the field of educational research, understanding student behavior during collaborative activities is fundamental to improving the teaching and learning processes. This study highlights the importance of using a diversity of research methods and tools that allow for a comprehensive analysis of the results integrating quantitative and qualitative perspectives.
Qualitative research methodology is especially valuable because it allows researchers to study the complexity of the interaction occurring between students in the virtual environment, and thus understand the factors that influence their performance and decision making. By employing qualitative methods such as participant observation, researchers can capture data that help build a global picture of the experiences involved in the main study. However, the inclusion of quantitative data can bring an additional dimension to qualitative research methodology by providing empirical, objective [
29], and measurable information. These data were obtained from instruments such as questionnaires and measurements made with ad-hoc analytical tools and statistical analyses that provide a broader and more generalizable view of the participants’ experiences.
By combining quantitative data with a qualitative perspective, we can obtain a more complete understanding of the phenomena studied and a greater triangulation of results [
30]. This combination allowed us to validate and enrich the findings as well as generate more solid and applicable recommendations for the improvement of educational practices and the design of more effective pedagogical interventions. Moreover, using both viewpoints in this study provides a hybrid research approach that allows researchers to address complex questions from different perspectives and levels of analysis. This combination strengthens the validity and reliability of the findings by integrating different forms of knowledge.
2.3. Data Collection Tools and Procedure
Before starting with the pilot phases, in September 2022, training sessions were held with all participating teachers. This training was essential to understand the options of the DIANA tool and how to use it. Different tools were used for data collection. In light of the research questions, we considered the perspective of both the teachers and the students to create the questionnaires.
Data were collected before and after each pilot (control and experimental groups). In the first phase, the evaluation questionnaire was sent to the participating teachers beforehand in order to obtain their profile as online teachers. This enabled us to compare the teachers’ knowledge of the use made of the student data available in the teaching and learning platform in order to monitor and evaluate the asynchronous online discussion.
In a second phase, once the pilots had been completed, information was collected from the students, since they had to evaluate, by answering a few simple questions, their level of satisfaction based on the feedback provided by the teacher on their participation in the evaluation activity. In this same phase, and only for the experimental pilot, XML data were collected from the metrics reported by the DIANA tool in the online discussion monitored with the help of learning analytics.
2.3.1. Teacher Profile Evaluation Questionnaire
Before starting the pilot phase of the research, all of the participating teachers had to complete a questionnaire to evaluate their professional profile as online teachers. The purpose of this questionnaire was to understand their professional teaching experience in the field of online education as well as their experience in the use of technological tools for online assessment and collaborative learning. The questionnaire was divided into the following blocks: (1) basic demographic data, (2) degree of application of the typologies of collaborative activities, (3) degree of application of different online assessment tools, (4) frequency of use of Moodle activities and resources, and (5) use of data mining techniques using Moodle registration.
2.3.2. Learning Analytics Tool Evaluation Questionnaire (for Teachers)
In the experimental group, it was also necessary to collect information on the use of the learning analytics tool used for the monitoring and evaluation of the asynchronous online discussion. This questionnaire evaluated the following variables of the observed phenomenon:
Level of importance of indicators and metrics: Teachers were asked about the importance they gave, based on their own professional experience, to each of the metrics calculated by the analytical tool; the objective was to learn which metrics had the greatest impact on the teaching process.
Descriptors of the transversal indicators: Transversal indicators are those that show the attitudes and behaviors of the students during the development of the evaluation activity. For these indicators, it is difficult to find data that facilitate their measurement, since they deal with moral and ethical aspects of the student’s performance. The teachers were therefore asked to analyze which of the previously used metrics could be used to measure the cross-cutting indicators by means of a data cross-tabulation table.
Finally, a collection was made of responses to questions on the transfer of learning analytics to professional teaching practice, assessment of the instrument used in the asynchronous online discussion activity, and the possible applications of learning analytics as perceived by the teachers involved in the study.
2.3.3. Student Satisfaction Questionnaire
Another important element of the project was to learn the students’ degree of satisfaction with the feedback received from the teacher in both the control and the experimental group. A questionnaire was therefore designed enabling students to rate two questions from 1 to 5 (where 1 is the lowest and 5 the highest rating): the first, their degree of satisfaction with the evaluation, and the second, on the feedback received from the teacher.
2.3.4. Learning Analytics Digital Tool
This experience required the design and programming of an IT solution based on web technologies as a tool for collecting data on student activity in the asynchronous online discussion activity. The digital tool created automatically analyzes the messages exchanged by students in the communication spaces of the Moodle learning environment. To design this tool, called DIANA (DIAlog ANAlysis), we used the list of metrics conceptualized in the study by [
28], which contains the description of a total of 21 metrics serving to evaluate different aspects of collaborative learning, which we called indicators.
The metrics reported by DIANA use reference values that can be customized by each teacher. The configuration panel shown in
Figure 1 requires prior authentication, thus protecting the system from unauthorized access and complying with the European General Data Protection Regulation [
31].
The configuration panel defines parameters such as the list of words that should be part of the semantic field of the conversation and the number of times these keywords should appear in the message exchange. Parameters can also be specified such as the minimum and maximum number of messages allowed, the maximum dispersion rate of the conversation based on the threads that form part of the discussion, and the maximum number of days a student can go without posting messages. Once the outline of the analysis to be performed in DIANA is defined, the metrics are grouped according to whether they are group metrics or individual metrics related to the performance of each student (
Figure 2).
2.4. Ethical Implication
In order to carry out the research, all students participating in the study were given a consent form to sign in the event that they wanted to participate in the pilot study. All of the students signed this consent form.
3. Results
In this section, we show the results obtained in relation to the communicative interaction of the experimental group offered by the DIANA tool in each of the conversation threads and considering the debate in general. On the other hand, we describe the changes that the use of the tool has entailed for the design of the subject from a methodological aspect and its implications in the evaluation process from the teacher’s perspective.
3.1. Methodological Possibilities for Teachers in the Experimental Group
In order to develop virtual teaching, it is essential to start from the design of the subject specific to the context in which it is taught. The Master’s degree in Digital Education has been underway for nine years and the guidelines for the design of the subjects follow a methodology based on webquest [
32], where choice of the tasks proposed for the students is made by the teachers. In the 22/23 academic year, three tasks were proposed on the subject: firstly, individual participation in a discussion forum to analyze the research perspectives in educational technology and their possibilities, secondly, work in small groups of five people to identify the research perspective applied in them by means of reading articles, and, finally, individual work where the student must choose a topic and draw up a draft justifying the possible investigation and research perspective applied. This activity is designed to make them start thinking about their master’s degree work.
Including the discussion forum activity has enabled a highly significant methodological change in the subject: restructured design of the subject itself. In this way, the virtual discussion has therefore become the central axis of the subject, while the remaining activities have taken place around it, enabling more coherent subject performance and activities than in previous courses. The subject has always had three activities to be performed by students; however, the activities themselves were independent from one another and failed to provide one another with adequate feedback. In this pilot experience, and with this new design, the subject has gained in internal coherence and natural approach during the activities, complementing one another and progressively adding demand and depth by means of the activities proposed over the weeks.
This restructuring has been crucial for specifying and defining the aspects to be analyzed with the DIANA tool. (1) The specific topic around which the discussion would proceed: on this occasion, analysis of the different research perspectives in educational technology. (2) The number of threads making up the discussion. For each of the threads, the following had to be specified: duration of the discussion; the minimum and maximum number of messages per student (between 2 and 3); the semantic field of the conversation (between 20–25 terms); the severity rate of the semantic control (10%); the maximum dispersion rate of the conversation (15%); the maximum inactivity time (2 days) (
Figure 3).
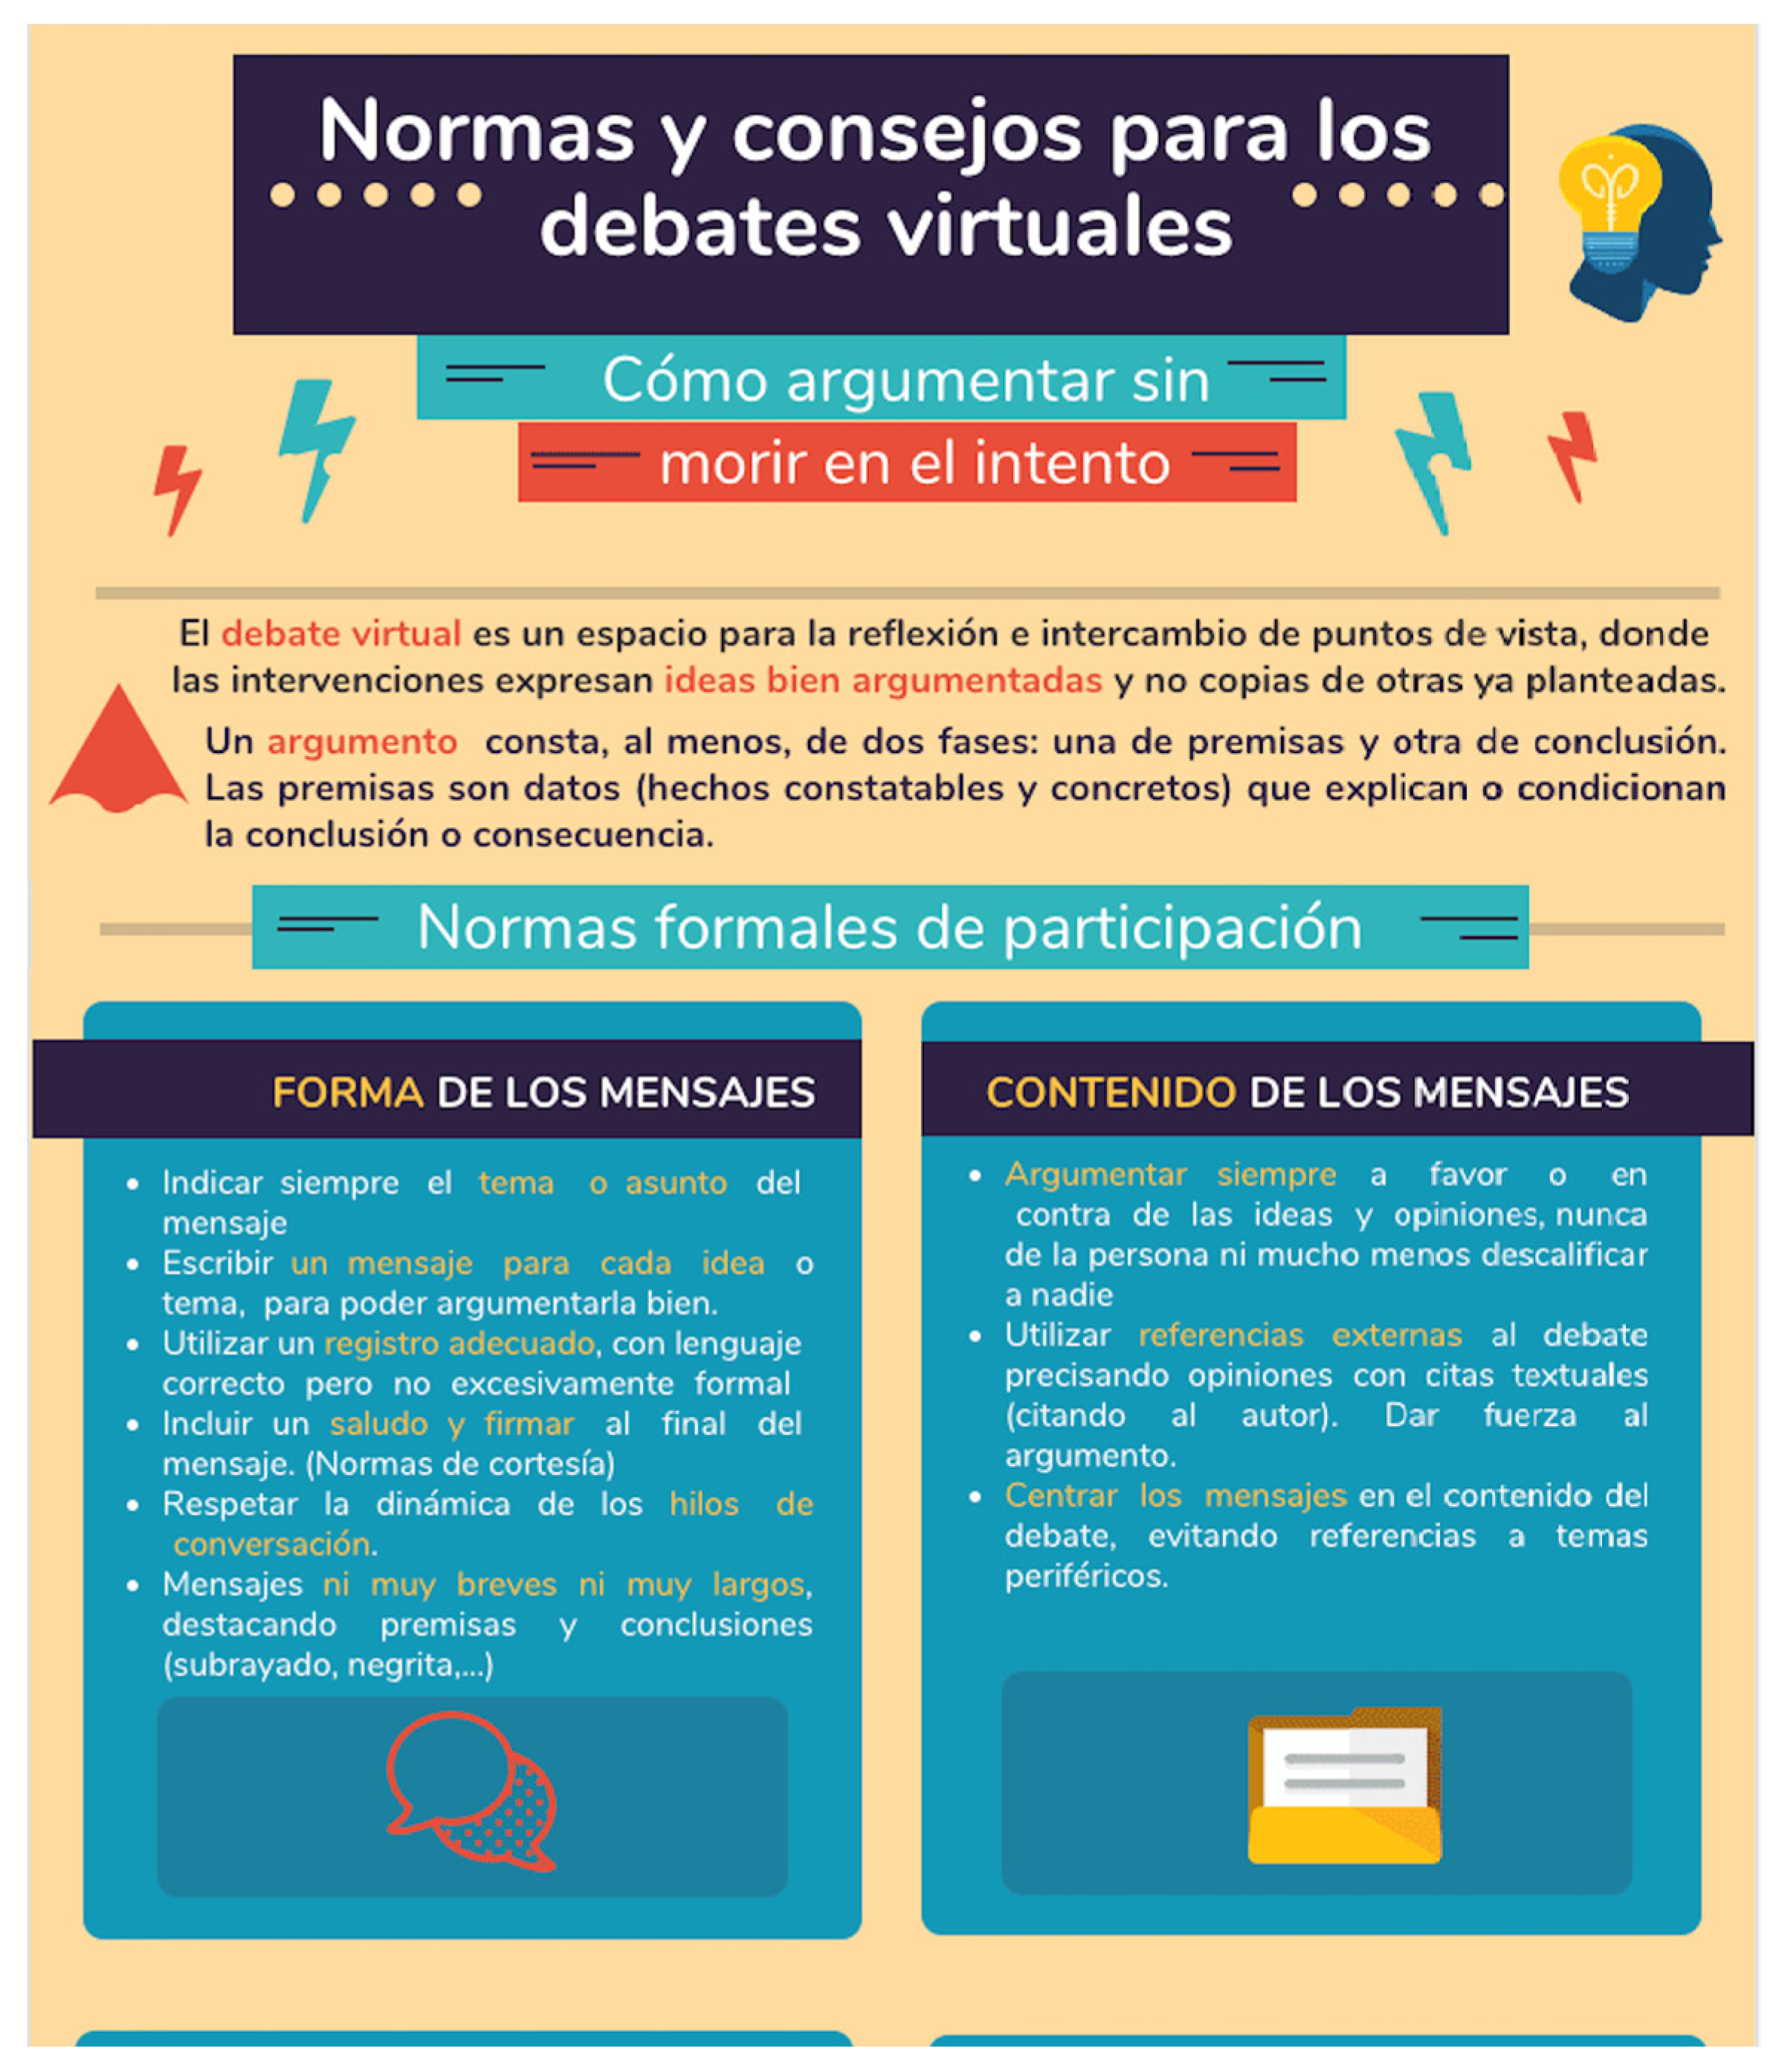
It is important to note that defining some of the parameters listed above was not an easy task due to the lack of previous experience with the tool. Hence, to define the severity rate and the maximum dispersion rate, we followed the recommendations of the research team, taking care not to exceed them by more than 15%. (3) How to present the activity in the virtual space and the specific indications on how to participate in the debate by means of an infographic presentation (
Figure 4).
The restructuring of the course has led to a second fundamental change related to the methodology: monitoring of the discussion through the three threads and, consequently, assessment and evaluation of the activity itself. The results provided by the DIANA tool have facilitated both tasks. The tool offers us data according to the definition of the parameters previously made by the teacher. This definition is related to the preferences and level of demand of the subject proposed by the teacher, meaning that considering these data enriches the interpretation of the qualitative results, achieving a more objective and accurate assessment and evaluation of the virtual discussion. The data provided by DIANA have made it possible to view student interaction and participation in different ways, for example, in the shape of word clouds, tables, bar charts, and node graphs. In addition to this, the students’ messages were read during the threads, and specific contributions were made to continue encouraging participation and dialogue, or otherwise, to redirect the thread.
At the end of the first and second discussion threads, individual messages created by the tool were sent to each of the students showing the type of participation they had had with the intention of seeking an improvement in the following threads and thus enabling the teacher to make an assessment of the process throughout the activity [
33]. This feedback was received very positively, as one student commented: “Hi Lorea. Thank you very much for the feedback. It is very helpful to receive it during the development of the course, as it allows us to improve. I will try to improve my participation in the debate. Thank you and best regards!”. It should be noted that these messages had a direct impact on the following discussion thread, in two ways: (1) increased the participation of students with low participation until then, and (2) maintained or increased the participation of the most participative students. At the end of the third thread and therefore of the activity, individual messages were also sent and, in addition, the students were provided with a summary document of group participation with some of the data provided by DIANA. In general, thanks to the different sources of visualization offered by the tool, it was possible to carry out the evaluation in a simpler, more effective, and more confident way than on previous occasions.
For final evaluation of the discussion activity, those previous steps were very important because the evaluation process was simpler and was conducted with greater confidence than on other occasions thanks to the different viewing sources offered by the tool and the monitoring realized. In the next section, we show the results of this monitoring with the DIANA tool.
3.2. Results Provided by DIANA in Relation to the Communicative Interaction of the Experimental Group
In this pilot study, use of the DIANA tool was limited to the experimental group teacher. The control group teacher did not use DIANA, meaning that the students were not assessed based on the tool’s statistics.
We will now proceed to show the results of the experimental group in relation to communicative interaction. The way we present these results is divided into each of the discussion threads carried out in the virtual debate and in relation to the following indicators: (1) Participation in communicative interaction with the number of messages contributed; (2) Encouragement of dialogue and negotiation through the answers sent and the degree of popularity among peers; (3) The communicative style considering the number of words written; (4) The constancy and regularity in group interaction throughout the days; (5) The exchange of information within the group with contributions of external links and/or attached documents. Subsequently, the overall results are shown considering the three discussion threads.
3.2.1. First Discussion Thread
This first thread took place in 2022, from 5 to 9 December. The students had to discuss the main characteristics of the different research perspectives in Educational Technology. Of the 20 students, 19 participated and the number of answers provided was 41 (including two from the teacher), showing a 100% level of dialogue. The messages were divided as shown in
Figure 5.
The number of words used in this thread ranged from 518 to 160, giving us an average of 314. As can be seen in
Figure 5 participation was constant and regular throughout these days. It should be noted that the second and fourth days (6 and 8 December) were holidays in Spain, meaning that the participation could have been affected; also note that the last day of the discussion was one of the days with the least participation.
Figure 6 shows how four students were particularly active in their participation (the fifth one was the teacher), contributing more messages or answers than those defined by the teacher in the initial configuration (the minimum was two and the maximum three). These four students made between three and four contributions, earning them the highest levels of popularity among their classmates, with one of them standing out with 9.76% compared to the other three, who obtained a level of popularity of 7.32%. Another four students only made one contribution, achieving low popularity (2.44%) as well as a low level of participation. The remaining 11 students complied with the minimum of two contributions and their level of popularity remained steady at 4.88%.
Finally, and in relation to the files or links attached by each student, no contribution was made in this thread.
3.2.2. Second Discussion Thread
This second thread took place between 10 and 14 December. A total of 19 students participated, and this time, the discussion focused on the pros and cons of each of the research perspectives. This discussion thread was more productive in terms of the number of contributions made by the students, with a total of 65 answers distributed as follows over the days (
Figure 7).
As can be seen in
Figure 6, participation on the first two days of the discussion was lower than on the last three days, with more contributions being made from the third day, then remaining regular until the end of the debate. Given that there had been no change in the initial configuration of the debate with a constant a minimum of two interventions and a maximum of three, the students were more active in this thread. Thus, the number of more participative students increased to seven while the number of those who did not reach the minimum of two messages decreased to only two students (
Figure 8).
As for the average number of words, the figure remained unchanged with respect to the previous thread. The student who participated most wrote 672 words and the least 135, meaning an average of 286 words, while only three students wrote fewer than 200 words. Finally, although in this thread there were no contributions of attached files by the students, there were contributions of external links with a total of 20. Especially noteworthy here is one student’s contribution with nine external links.
3.2.3. Third Discussion Thread
The last thread ran from 15 to 18 December. This thread consisted of drawing conclusions on what research perspective they considered could help them develop a good master’s thesis. This time, all 20 students participated with a total of 68 responses, distributed as follows (
Figure 9).
As we can see in
Figure 8, distribution of the messages was somewhat irregular over the four days, noting that 60% were made on the last day, meaning that the participation was concentrated on that day. In this discussion thread, the number of students who were highly participative increased with respect to the two previous threads. Here, there were particularly seven students who participated, while participation by another five was low (
Figure 10).
Regarding the number of words, the average in this last thread was 178, and this time, the external links shared by students increased significantly compared to the previous thread, with 29 external links and two files attached.
3.2.4. General Results Considering the Three Discussion Threads
In relation to interaction in communicative participation, all students participated with a total of 177 messages analyzed, obtaining a homogeneity rate of 57.86%, which, while it showed irregular participation by the students, was not excessively skewed from the average. If we focus on the promotion of dialogue, a total of 172 responses were collected, enabling a dialogue level of 97.73%.
Figure 11 shows the social network analysis from the students’ interactions in the forum. The graph represents one chain per thread of the forum, and the bigger points highlight messages which have received more responses due to their impact in the conversation.
Overall, a total of two files were exchanged and 52 external links collected, meaning that the students became strongly involved in justifying their contributions and responding to the thread raised with other resources not collected in the virtual space. The search for additional information is a clear indicator that the exchange of information encourages others to make contributions. Finally, in
Figure 12, we show a list of the 75 terms most frequently used in the discussion. The most significant ones are highlighted in green due to having been included in one of the three semantic fields previously defined by the teacher.
3.3. Comparison between the Control and the Experimental Groups
The information collected in order to be able to compare the differences between the control and experimental groups in relation to academic performance and student satisfaction was limited because it is only a pilot within the overall research and we do not currently have information from more pilots to make a more complete comparison. Regarding academic performance and student satisfaction with the evaluation and feedback received from the teacher, it should be remembered that the control and experimental groups were developed in two different subjects with two different teachers. Thus, although student performance in general was good or very good in both subjects, the distribution of grades was different (
Figure 13 and
Figure 14). In relation to satisfaction, it should be noted that the same trend was observed in the study by Cerro Martínez et al. [
28], where the students who were monitored using learning analytics showed a higher degree of satisfaction than the students in the control group. In this study, the median of the experimental group increased by a difference of one point with respect to the control group.
4. Discussion
The context in which this pilot was developed was based on the experience of a teacher who had no previous contact with learning analytics. Therefore, this study serves to compare the findings of other previous studies regarding the meaning of learning analytics when it comes to monitoring and evaluating the collaboration and interaction of students with respect to the tasks proposed in the subject. In this way, conducting collaborative activities in digital environments enables the collecting of evidence on interactions and the process of shared construction [
13].
One of the biggest challenges for teachers in virtual environments is the monitoring and continuous assessment [
33,
34] of the students’ collaborative activities in the study by Cerro Martínez et al. [
35]. It is therefore essential to have tools that help to visualize the collaborative action of students so that the data offered can help teachers to better interpret how this action is developed and enable them to act in the teaching–learning process. Note should be taken that the teaching action is determined by the monitoring carried out thanks to the pre-analysis performed with DIANA, and that the tool itself enables personalized feedback [
36] based on the specific work undertaken by the students, which has a positive effect [
37] including involvement and improvement in subsequent actions, as has been seen in the discussion threads, where the level of student participation has been growing, with an increasing number of participants showing a “highly participative” level in the thread [
36] in the experimental group. In this respect, the students that have made the greatest participation are the ones who obtain the highest grades, as shown by Cerro Martínez et al. [
35] in their previous study.
Online virtual discussions are one of the most widely used activities for enabling student interaction and collaboration; however, to develop an activity correctly, it is essential to have a good design [
38] specifying key elements, in order that, through learning analytics, good monitoring and evaluation of the activity can be obtained [
39]. We must not forget that the basic theory is data mining [
40], which, transferred to the educational context, is postulated as educational data mining where, through specific methodologies and tools, the aim is to study educational issues, as in the case of this article. The pedagogical component is projected when the data generated in collaborative interactions need to be given a meaning and an interpretation, hence the use of learning analytics acquires a primary value given that it helps both teachers and institutions to improve their work by making decisions and creating predictive models adapted to their specific contexts [
41].
The information provided by learning analytics is not self-sufficient but enables teachers by providing them with relevant information for their professional practice in both hybrid and online models. This means that they can offer students more objective and detailed suggestions that can be useful as feedback, which will facilitate a true learning experience and, consequently, improve teaching and the students’ academic results. The feedback offered by teachers enables students to self-regulate [
42] and will finally improve their performance.
5. Conclusions and Future Research Lines
Summing up and referring to the initial questions: “What changes does the DIANA tool enable in the design, monitoring, and assessment of asynchronous discussions for teachers?” and “What does learning analytics contribute to the improvement of student performance?” we can say, referring to the subject design and methodology, that using DIANA has given greater internal coherence to the proposed tasks. Thus, DIANA has also produced more progressive development of the tasks making up the contents. In the same way, discussion has been the central axis of the subject, while the remaining tasks have been based on the aspects shared in the discussion threads, thereby enabling students to proceed with collaborative and accompanied development of the tasks. On the other hand, DIANA has enabled combined and complementary monitoring and visualization of the quantitative metrics and indicators with the contributions made during the discussion, facilitating faster and more objective assessment, supervision, and evaluation of the task than without it. As a first pilot experience, the parameters defined by the teacher should be reviewed and checked for future editions, for example, definition of the semantic field. Although the severity rate has remained below the 15% established in each of the threads, a better selection of terms should be made, discarding those that have not been reflected in the conversation and were therefore not significant. The tool parameters can therefore be adjusted in the coming years, depending on the teacher’s requirements.
Regarding the contribution of learning analytics to improving student performance, this can be translated into individualized commitment and the desire to improve their participation in future interventions. After each discussion thread, each student was given feedback generated by DIANA on their participation, with the intention of encouraging them to either continue or improve in future discussion threads. While we cannot conclude that this feedback was the direct reason for improved levels of participation, the students did appreciate receiving it and found that it motivated them. While this feedback has served to create closer contact with the students, we are aware that this pilot study was limited due to the small number of teachers and students in the sample. Therefore, it could be interesting to contrast and compare this with more students and teachers.
Finally, and for future research lines, it is necessary to go further into one underlying aspect not addressed in the study: the impact of analytics on education from a critical viewpoint. A series of aspects will therefore have to be taken into account such as (a) purposeful design of the tool for teachers who criticized it [
43] for not coinciding with their needs; (b) if students are involved in the process, they should be allowed access to these analytics during development of the training action; (c) the diversity of existing analysis methods does not favor the generalized implementation of learning analytics from a standard point of view. Each context requires a specific technical approach, but this lack of standardization may not be taken into account in the measurement error [
44]. At the same time, work could begin on making a predictive perspective of the results of the analyses, as proposed by Herodotou et al. [
45].


