Article

Instructors’ Perceptions of the Use of Learning Analytics for Data-Driven Decision Making

1
Department of Mathematics, Science, and Technology Education, Tel Aviv University, Tel Aviv-Yafo 6997801, Israel
2
Kaneb Center for Teaching Excellence, University of Notre Dame, Notre Dame, IN 46556, USA
3
Virtual TAU—The Center for Digital Pedagogy, School of Education, Tel Aviv University, Tel Aviv-Yafo 6997801, Israel
*
Author to whom correspondence should be addressed.
Educ. Sci. 2024, 14(11), 1180; https://doi.org/10.3390/educsci14111180
Submission received: 15 August 2024 / Revised: 20 October 2024 / Accepted: 28 October 2024 / Published: 29 October 2024
(This article belongs to the Special Issue Unleashing the Potential of E-learning in Higher Education)

Abstract

:
In recent years, much effort has been put into developing dedicated dashboards for instructors, in which data about students’ activity are presented. However, in many cases, such endeavors take a top-down approach and do not involve instructors in the design process. In this paper, we present a study of instructors and teaching assistants in a research university in Israel (N = 253) who responded to an online questionnaire regarding their perceptions of data on students’ activity on course websites. Specifically, they were asked about the types of data they were most interested in, the aspects of student learning that they would consider important, and the actions they would take upon viewing the data. Overall, we found that participants’ scores were medium-high (2.5–3.5 on a 5-point Likert scale), with scores being higher for women compared with men and positively correlated with experience with Moodle. An overarching theme arises from our analyses of instructors’ interests and intentions, which portrays their idea of teaching as somewhat traditional and instructor-centered; however, their declared actions make it clear that they are willing to make some desirable changes to the benefits of students. Finally, we found that instructors’ perceptions of data use and data importance are positive predictors of taking action upon viewing student data.

1. Introduction

Data-driven decision making in education is the process by which various stakeholders collect and analyze data to guide and support their education-related decisions. One aspect of this process is the availability of data. In online learning, compared with traditional face-to-face courses, instructors are less exposed to visual cues, and part of student activity is harder to track, which might compromise data-driven instructional processes [1]. On the other hand, online learning environments, particularly learning management systems (LMS), constantly collect data that document students’ actions—such as downloading files, posting messages on discussion boards, or completing tasks—in high granularity, and could serve to inform decision making. Indeed, such data are often made accessible to instructors via reports and dashboards, which helps them to gain actionable insights into student actions in order to support educational decisions [2,3,4].
However, available data are not the sole factor that would ignite an ongoing, meaningful data-driven decision-making process. The other side of that coin is the instructors themselves. As Hora, Bouwma-Gearhurt, and Park [5] bluntly put it, “provision of data alone does not magically lead to improved teaching and learning” (p. 392). The educational agenda, attitudes towards teaching and learning, and data interpretations are amongst the components of instructors’ sense making of data. Therefore, it is important to involve instructors from the very first stages of designing learning analytics [6,7]; however, most studies in the field of LA tend to focus on students’ needs and perspectives, and our understanding of instructors’ viewpoints regarding the process of data-driven decisions is still limited [6]. We aim at bridging this gap by exploring the perceptions and intentions of instructors and teaching assistants (TAs) regarding data on student activity on course websites. In particular, we are focused on the following research questions:
  • Characterizing perceptions of educational data
    • Which types of educational data components are most important for instructors and TAs?
    • Which aspects of student learning would instructors/TAs use educational data to promote?
    • Which actions would instructors/TAs take upon viewing educational data?
  • What are their associations between educational data use in the course and the characteristics of instructors/TAs?
  • How can instructors/TAs’ potential action-taking upon viewing educational data be predicted based on their characteristics and perceptions?

2. Literature Review

2.1. Data-Driven Decision Making in Higher Education

Data-driven decision making refers to collecting, understanding, and analyzing educational data in order to guide and support educational decisions. Such educational data address the academic, behavioral, and socio-emotional aspects of the learning process, with relevant data being collected in a variety of ways, from academic assignments, through monitoring classroom participation, to observing students’ non-verbal communication during sessions. Based on educational data, instructors constantly make various decisions that may contribute to both instructors and students [8,9,10,11].
In many cases, such decisions are taken based on the instructor’s experience and understanding of the situation, and not necessarily on empirical evidence [12]. This is often the case in face-to-face teaching, where instructors are accustomed to immediately responding to the observed data [13]. However, when students are engaged in online learning, many of their actions (e.g., navigating through the course pages or multiple attempts to solve a problem) might be difficult to track. Such actions may be important, as they can help instructors to gain insights into students’ learning, and hence may assist instructors to promote students’ learning. Interestingly, data documenting such actions are often available, although not necessarily accessible to instructors, which we will discuss in the next sub-section.
Whatever data upon which instructors rely, they may not necessarily lead to decisions that truly support students. Higher education instructors are often focused on the here-and-now of teaching, and hence make their decisions based on contextually localized models of what students know and might do, rather than on general conceptions of teaching [14]. Part of this may be a result of outdated perceptions of student learning and of their own role in instructional design, which is not necessarily aligned with what is already known on student learning [15]. However, in a broader context, this may be a result of the de facto separation between teaching and research in higher education institutions; moreover, the linkage between teaching and research is, in theory, a desirable reality, but in practice it may be—and often is—dramatically affected by institutional priorities [16,17], which eventually impacts instructors’ priorities.

2.2. Instructors’ Perceptions of Data-Driven Decisions

The successful use of educational data to inform decisions highly depends on the acceptance of data by instructors. Understanding instructors’ perspectives regarding the use of educational data is critical, since they are the ones who access and interpret the data, draw conclusions, and make informed decisions. Hence, it has become clear that analytics systems should be made accessible in a way that is easy to understand and to act upon [18,19].
Of the major challenges faced by higher education instructors regarding data-driven decision making, data literacy is prominent; however, instructors often lack adequate data literacy skills [20]. Instructor data literacy refers to the ability to effectively engage with data and analytics to make better pedagogical decisions. The lack of such an ability might result in a poor interpretation of analytics, which in turn can lead to uneducated decisions that might harm students and create more inequalities in access to learning opportunities [6,19].
Another reported challenge is having overwhelmingly large amounts of data from different sources and a lack of personalized, accurate, and timely information [20,21]. It seems that, although instructors are expected to make rapid decisions in a dynamically changing environment, they often do not receive the information that they need for decision making in real-time and in an ‘actionable’ format. This is problematic, especially since accurate and timely data were documented as necessary to help instructors to make informed decisions regarding their teaching [22]. Therefore, bringing teachers into the loop of designing education dashboards is crucial to their success for at least two reasons. First, teachers may be resistant to implementations that they do not fully understand. Second, when discussing data-driven implementations that face toward teachers, it is important to make sure that the system would indeed address their needs and desires.

3. Development of the Theoretical Framework

Our research framework is based on Clow’s [23] Learning Analytics Cycle, which refers to the following four components: learners, data, metrics, and intervention. Herein below, we operationalize these dimensions in the context of teaching staff’s perspectives. Additionally, we refer to a host of independent variables that may be related to the use of student data, e.g., personal characteristics, teaching experience, experience with teaching with technology, and course characteristics. This stems from the need to include such variables when studying technology use in educational contexts. Indeed, recent literature reviews of technology adoption in education emphasize the importance of such variables [24,25,26,27,28,29].

3.1. Learners—Student Promotion

We were inspired by Kuh et al.’s [30] definition of student success, in which they include “academic achievement; engagement in educationally purposeful activities; satisfaction; acquisition of desired knowledge, skills, and competencies; persistence; and attainment of educational objectives” (p. 10). Therefore, we define the following four dimensions of student promotion: completion of course successfully, increasing engagement, increasing motivation, and enhancing learning skills. See Table 1 for a mapping between Kuh et al.’s definition and our dimensions.

3.2. Data—Course Website Use

We rely on Watson and Watson’s [31] definition of course management systems. According to them, these systems “are used primarily for online or blended learning, supporting the placement of course materials online, associating students with courses, tracking student performance, storing student submissions and mediating communication between the students as well as their instructor” (p. 29). As such, we refer to the following four dimensions: assessment, learning materials, communication, and online participation. See Table 1 for a mapping between Watson and Watson’s definition and our dimensions.

3.3. Intervention—Teacher Action

We refer to Brown et al.’s [32] professional development framework for teaching in higher education, particularly to the areas of the activity domain. Under this domain, six areas of activities are defined for teaching classes, as follows: design and planning, teaching, assessment, developing effective environments, integration of scholarship with teaching, and self-evaluation. As the last area (self-evaluation) is about teachers’ reflective processes that may lead to changes in each of the other activities, we only refer to the other five areas. For the area of effective environments for learning, we also consider Brown and Atkins’ [33] notion of a continuum of teaching methods in regard to the importance of the availability of methods where instructor participation and control are minimal. Therefore, we define the following six dimensions: changing course structure, changing pedagogy, changing assessment, communicating with students, adding self-practice opportunities, and changing topics taught. See Table 1 for a mapping between Brown et al.’s and Brown and Atkins’ definitions and our dimensions.

4. Methodology

4.1. Research Field and Research Population

This study was conducted in a large, truly multidisciplinary research university in Israel, with about 30,000 undergraduate and graduate students and about 4500 faculty members. It was approved by the institution’s Ethics Committee (#5055-1). Our sample included N = 253 instructors who filled in an online, anonymous survey that we sent out to all teaching staff. Of the participants, we had 128 males (51%) and 121 females (48%) (4 participants chose not to disclose their gender). We had 175 instructors (69%), with an average of 15.6 years of teaching experience (SD = 10.3), and 78 TAs (31%), with an average of 3.2 years of teaching experience (SD = 4.7), all of whom came from all of the faculties across the campus. Of them, 140 (56%) were teaching courses in the “soft” disciplines, and 113 (44%) were teaching courses in the “hard” disciplines.
Regarding their experience with Moodle, we observed a medium-high rate of using Moodle teaching tools, with an average of M = 3.1 (SD = 1.0). Contrary to that, the rate of using Moodle reports was low-medium, with an average of M = 1.9 (SD = 1.0). There was a mild correlation between these two variables, with Spearman’s ρ = 0.37, at p < 0.001.
As for the courses about which our participants reported (a single course per participant), 194 were at undergraduate level (77%) and 59 were at graduate level (23%). The average course size (based on the participants’ approximation) was 77 (SD = 79.6).

4.2. Research Variables

4.2.1. Independent Variables

Teacher Characteristics. We collected information about the participants’ gender [Man/Woman/Other or Not Wishing to Disclose], teaching experience, role in course [Instructor/TA], and faculty affiliation. For coding faculty affiliation, we coded the faculties into two broad categories, based on Biglan’s [34] taxonomy of academic areas, as follows: (1) “Hard”—Brain Sciences, Engineering, Exact Sciences, Life Sciences, and Medicine; and (2) “Soft”—Arts, Humanities, Law, Management, and Social Sciences.
Additionally, we collected data about the participants’ extent of using Moodle as a teaching tool and extent of using Moodle reports. Each of these was ranked on a 5-point Likert scale.
Course Characteristics. Courses to which participants referred while reporting on data-related perceptions were characterized by level [Graduate/Undergraduate] and course size [approximated number of students].

4.2.2. Dependent Variables

We had three sets of dependent variables that were derived from our theoretical framework dimension (see mapping in Table 1). All items for each variable were measured on a 5-point Likert scale and were then averaged.
Intentions of Using Data to Promote Students’ Learning. Regarding the Learner—Student Promotion dimension, this variable measures the instructors’ and TAs’ perceptions of the ways by which types of educational data could be used to promote students’ learning. We used the following question: “To what extent it is important to you to receive information on students’ activity on the website of the course you chose, in each of the following categories?”—with the following categories listed:
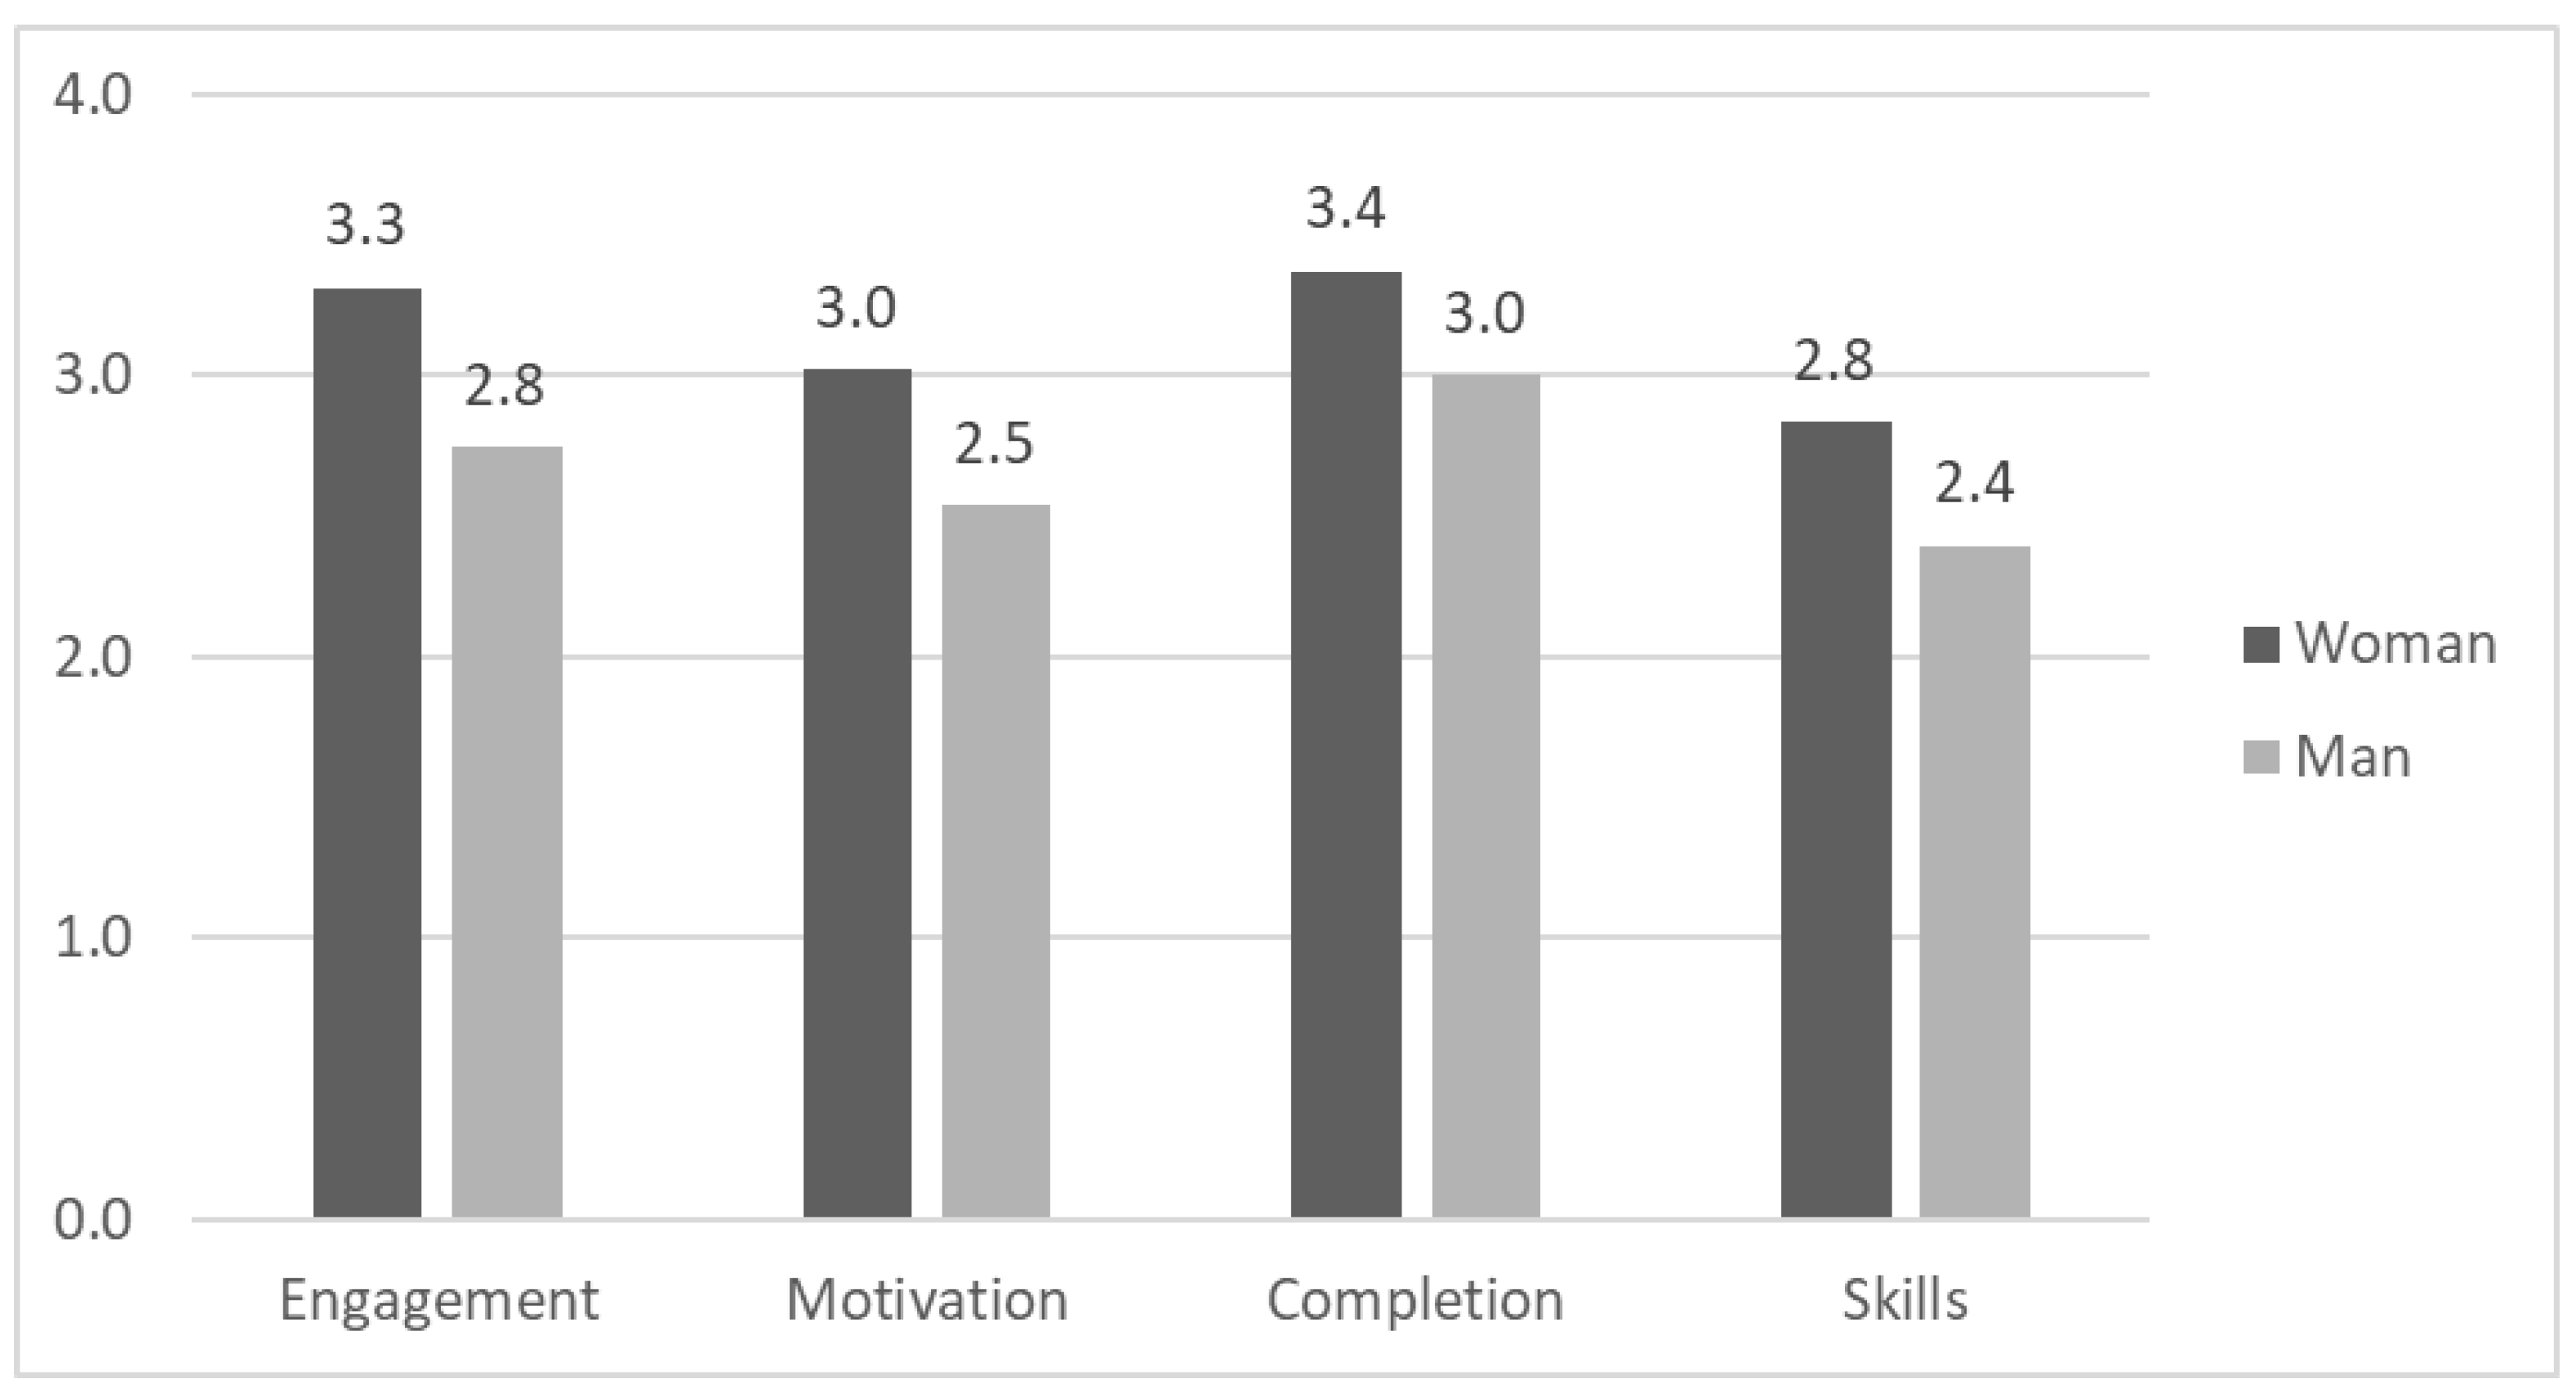
  • Increasing engagement in learning;
  • Increasing motivation for learning;
  • Completion the course successfully;
  • Enhancing learning skills (e.g., time management, collaboration, and self-regulated learning).
Perceptions of Data Type Importance. Regarding the Data—Course Website Use dimension, this variable measures the importance that the instructors’ and TAs’ attach to different types of educational data based on the usage they depict. We used the following question: “To what extent is it important to you to receive information on students’ activity on the website of the course you chose, in each of the following categories?”—with the following categories listed:
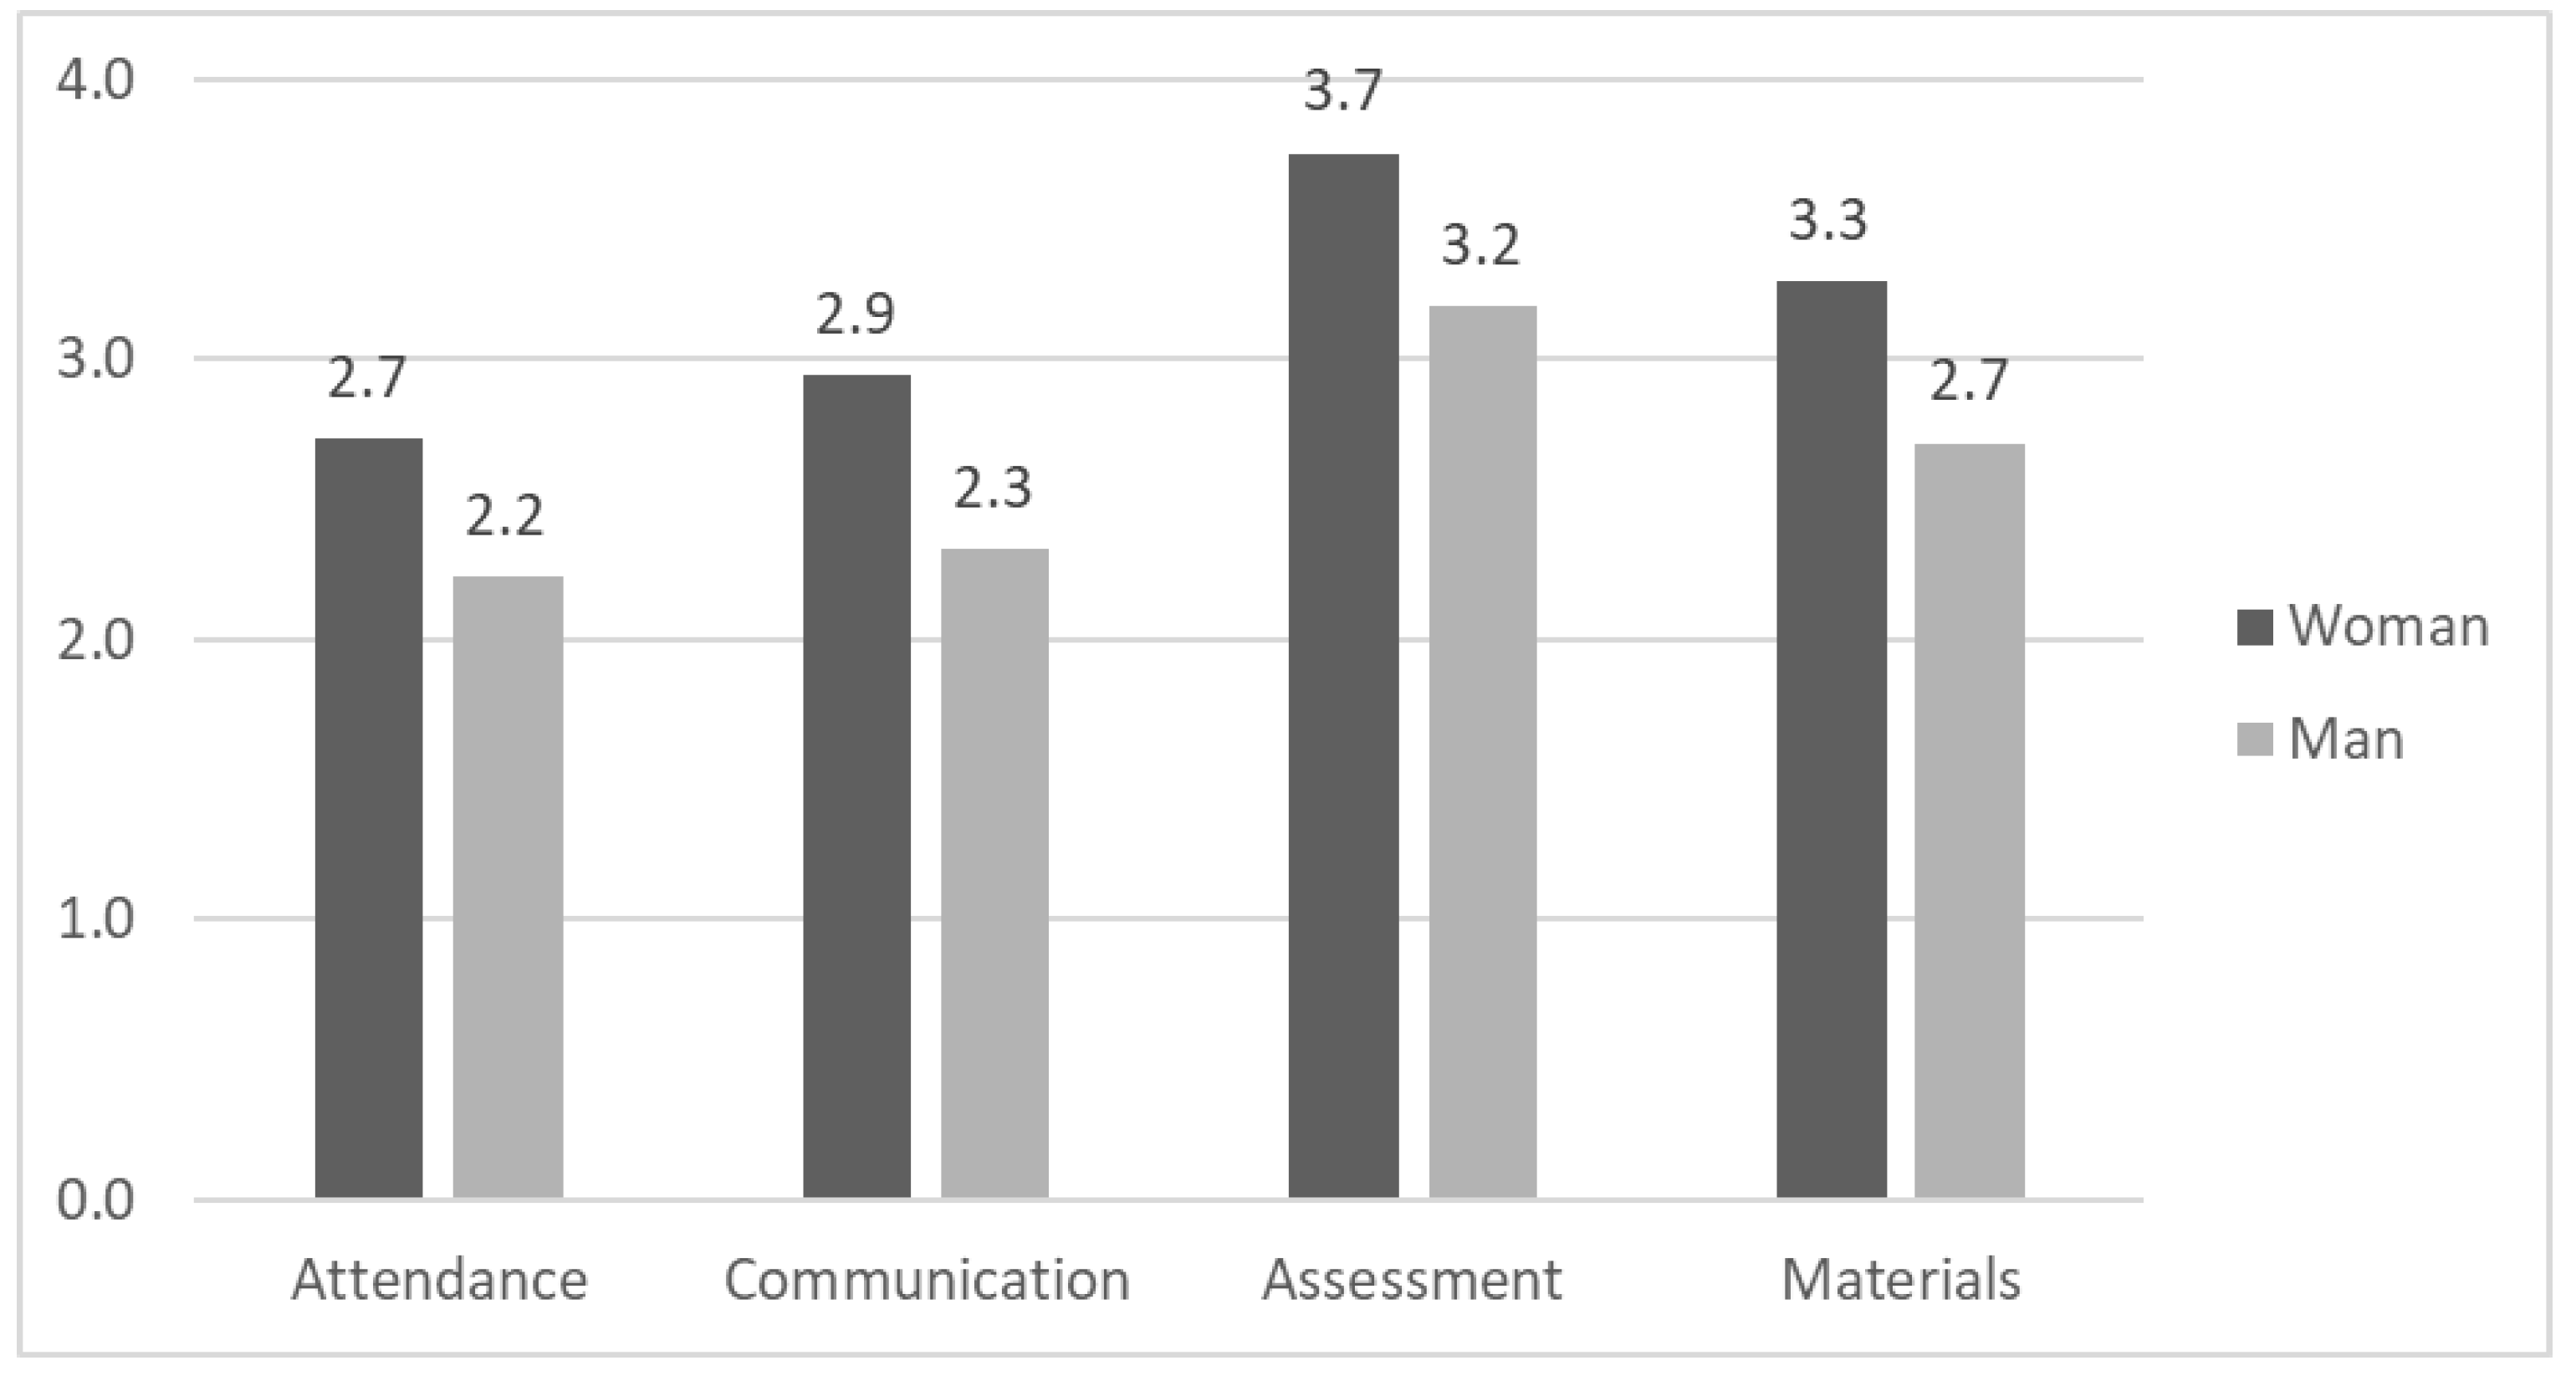
  • Online participation (number of entrances, % of participance, etc.);
  • Communication (number of forum messages, extent of participation in online discussions, etc.);
  • Assessment (grades on tasks and quizzes, % task submissions, submission attempts, etc.);
  • Learning materials (number of accessed files, number of hit hyperlinks, extent of video watching, extent of glossary use, etc.).
Potential Actions to Take Upon Viewing Data. Regarding the Intervention—Teacher Action dimension, this variable measures the extent to which the instructors and TAs would consider taking different actions upon viewing educational data. We used the following question: “If you would like to act upon viewing information on students’ activity on the website of the course you chose, which interventions would you consider?”—with the following interventions listed:
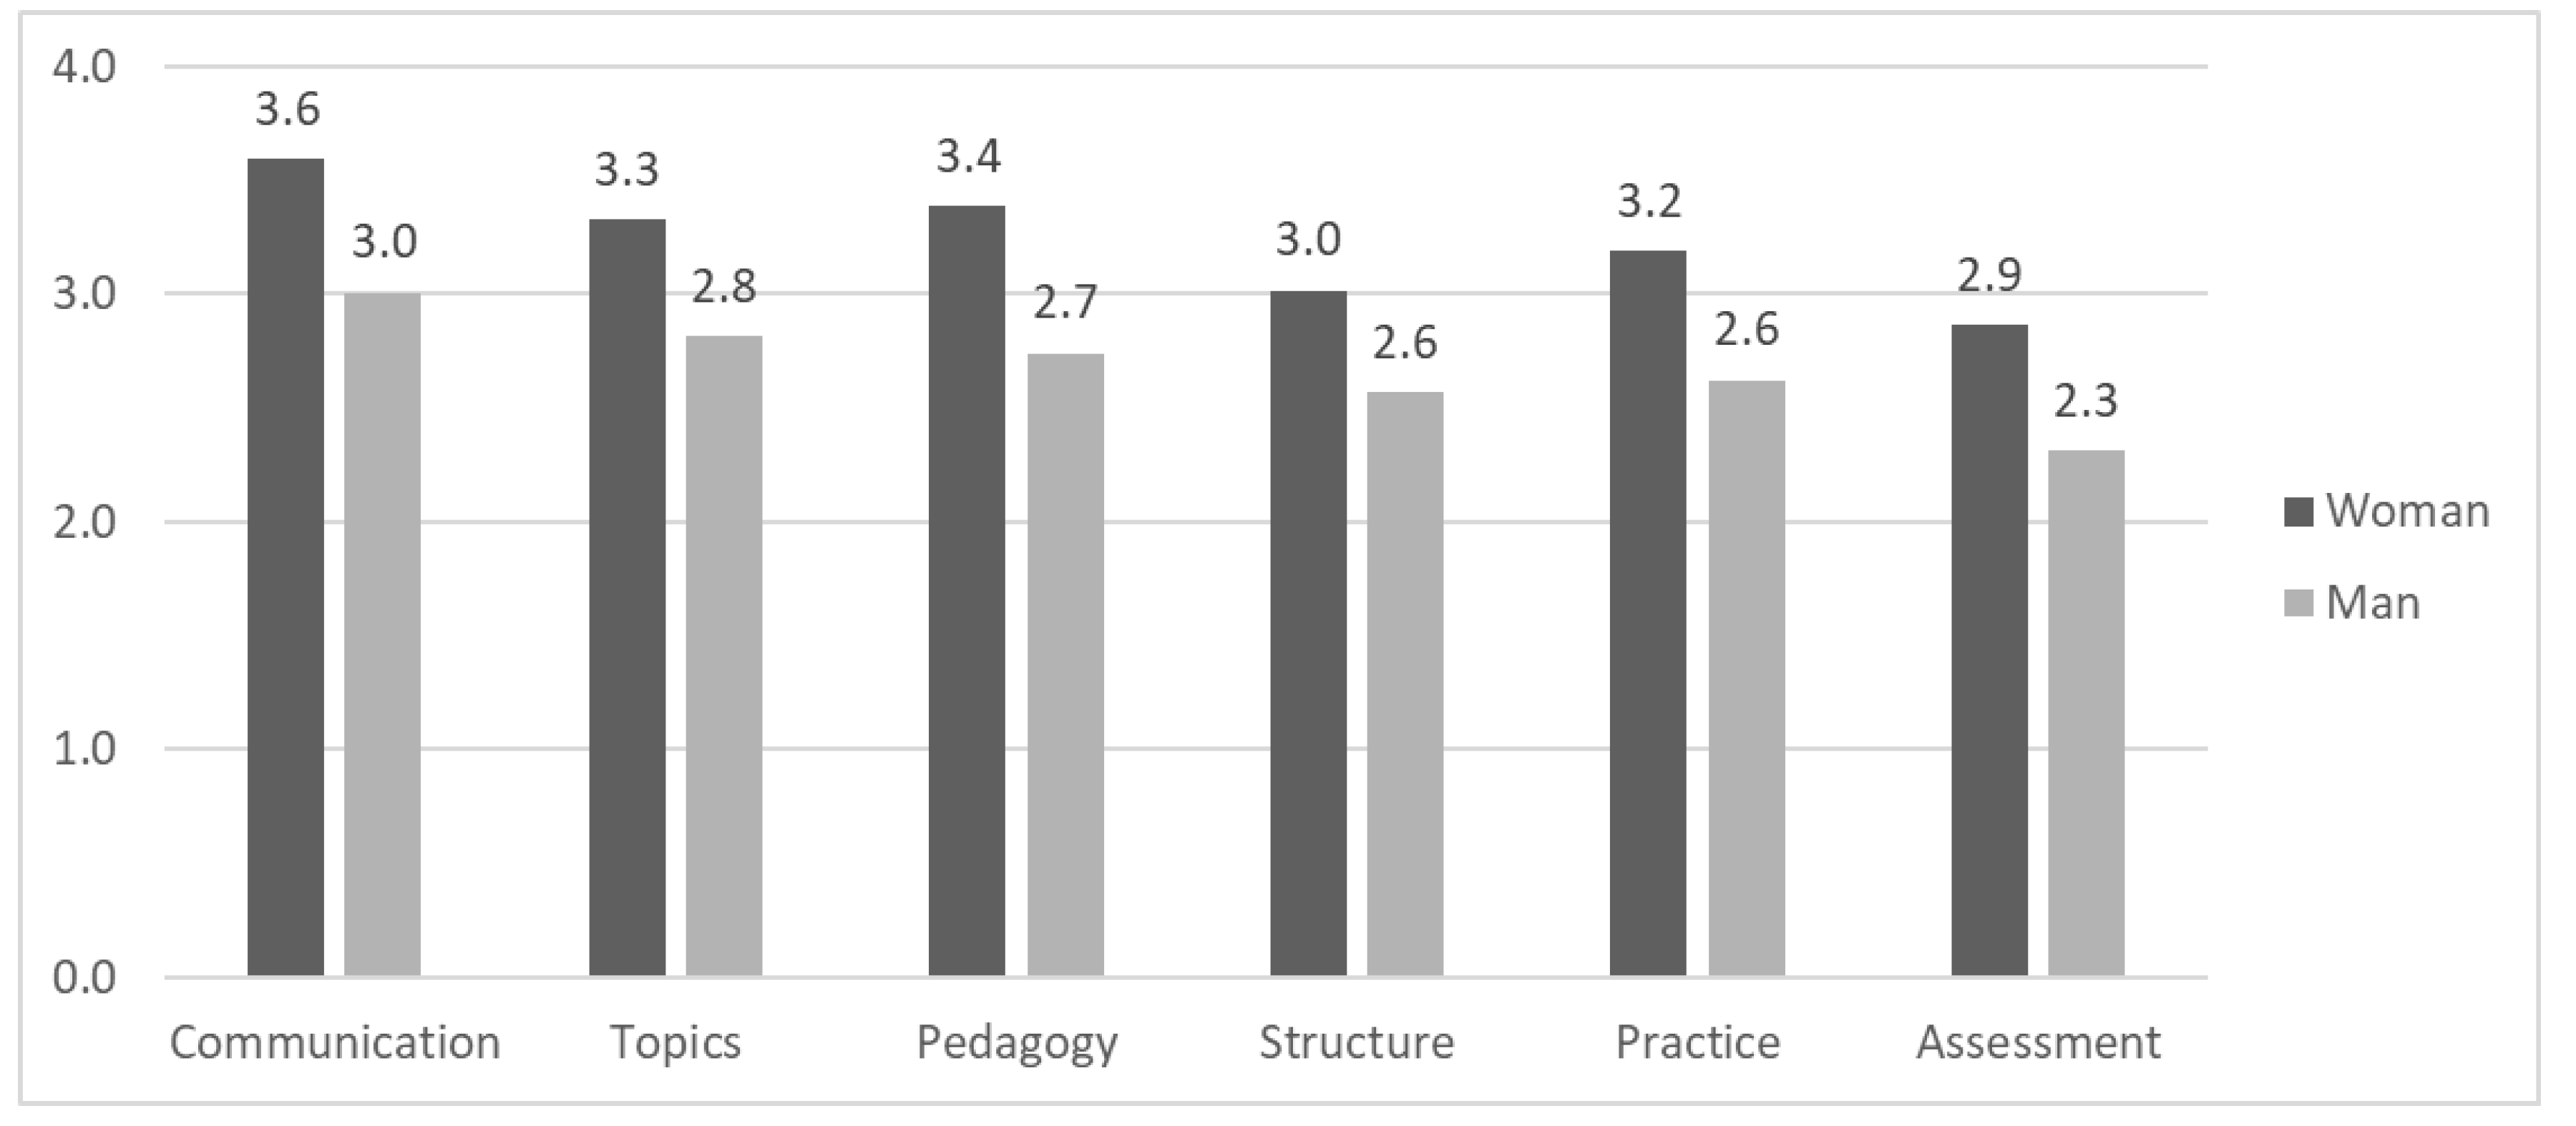
  • Promoting communication with the students (e.g., sending messages, office hours, and writing to a specific student);
  • Adjusting the topics taught in that course;
  • Adjusting the pedagogy (e.g., integrating hands-on activity and collaborative learning);
  • Changing the course structure (e.g., extra lessons and practice);
  • Adding self-practice opportunities for students (e.g., tasks or interactive activities);
  • Changing assessment (e.g., task structure or number of tasks).

4.3. Research Tool and Procedure

Data were collected using an online, anonymous self-report questionnaire (in Google Forms) that was built by the authors, based on the theoretical framework. The questionnaire included, besides eight questions to collect data for the independent variables, 14 items for the dependent variables, as follows: 4 items under the Learners dimension, 4 items under the Data dimension, and 6 items under the Intervention dimension. The questions are detailed above under Dependent Variables (Section 4.2.2). The reliability analysis of the latter part of the questionnaire yielded satisfactory Cronbach’s alpha values of 0.78, 0.90, and 0.89, accordingly.
The questionnaire was sent out via the university’s official mailing lists of instructors and TAs, with an overall number of about 4100 subscribers, and the response rate was 6%. Data collection took place during June–July 2022, at the very end of Spring Semester. For the items related to the dependent variable, the participants were asked to refer to one course that they were teaching.

4.4. Data Preprocessing and Analysis

For correlational and average-comparison analyses, we used non-parametric statistical tests, due to the nature of the scale for the dependent variable. All statistical analyses were performed using JASP software, Version 4.7.

5. Findings

5.1. Perceptions of Student Data (RQ1a-c)

5.1.1. Important Types of Data (RQ1a)

We found that the data about assessment were rated the highest, with a relatively high average of M = 3.5 (SD = 1.5), followed by data about the students’ use of learning materials, with a medium-high average of M = 3.0 (SD = 1.5). The data about the students’ communication on the course website were rated at a medium level (M = 2.6, SD = 1.4). Finally, the data about the students’ online participation were ranked the lowest, with a medium average of M = 2.5 (SD = 1.3). We tested for differences for each consecutive pair of types when ordered by their average, using the Wilcoxon Signed-Rank test, and found that all of the differences were statistically significant. Our findings are summarized in Table 2.

5.1.2. Intentions of Using Data to Promote Students’ Learning (RQ1b)

Of the suggested aspects of student learning, completion of course successfully was rated the highest, with a medium-high mean of M = 3.2 (SD = 1.3), followed by increasing engagement, with a medium-high mean of M = 3.0 (SD = 1.3). Increasing student motivation was rated medium, with a mean value of M = 2.8 (SD = 1.2), and enhancing learning skills was rated the lowest, with a medium mean value of M = 2.6 (SD = 1.2). We tested for differences for each consecutive pair of aspects when ordered by their average, using the Wilcoxon Signed-Rank test, and found that all of the differences were statistically significant. Our findings are summarized in Table 2.

5.1.3. Potential Actions upon Viewing Data (RQ1c)

Of the suggested interventions, communicating with students was rated the highest, with a medium-high mean value of M = 3.3 (SD = 1.2), followed by changing topics taught, with a medium-high mean value of M = 3.1 (SD = 1.2). The two lowest-ranked interventions, both with medium mean values, were changing course structure (M = 2.8, SD = 1.2) and changing assessment (M = 2.6, SD = 1.2). We tested for differences for each consecutive pair of interventions when ordered by their average, using the Wilcoxon Signed-Rank test, and found that all but one of the differences were statistically significant; moreover, the non-significant pair was changing topics taught and changing pedagogy. Our findings are summarized in Table 2.

5.2. Associations Between Data Use and Independent Variables (RQ2)

Unless stated otherwise, N = 253 in all of the following analyses.

5.2.1. Important Types of Data

Teacher Characteristics—Gender (N = 249). The four types of data were found to be ordered by the same order of importance among women (n = 121) and men (n = 128), however, women’s rankings were all significantly higher than men’s, with small effect sizes. Comparing the two sub-populations resulted in W = 9369 for Attendance, at p < 0.01, with RBC = 0.21; W = 9589 for communication, at p < 0.001, with RBC = 0.24; W = 9394 for assessment, at p < 0.01, with RBC = 0.21; and W = 9502 for materials, at p < 0.01, with RBC = 0.23. Our findings are summarized in Figure 1.
Teacher Characteristics—Teaching Experience. There were no significant correlations between teaching experience and either of the types of data. Spearman’s correlation resulted in values of ρ = 0.03 for Attendance, at p = 0.68; ρ = −0.01 for communication, at p = 0.88; ρ = −0.09 for assessment, at p = 0.14; and ρ = 0.06 for materials, at p = 0.37.
Teacher Characteristics—Role in Course. There were no significant differences between instructors and TAs in their perceptions of the importance of different types of student data. The Mann–Whitney values were W = 7704 for Attendance, at p = 0.09; W = 7378 for communication, at p = 0.29; W = 6536 for assessment, at p = 0.58; and W = 7523 for materials, at p = 0.18.
Teacher Characteristics—Faculty Affiliation. The only significant difference was found regarding the Attendance data, as follows: the participants from the hard disciplines scored Attendance data lower (M = 2.3, SD = 1.2, n = 113) than the participants from the soft disciplines (M = 2.6, SD = 1.4, n = 140), with W = 6785, at p < 0.05; however, this depicts a small effect size of RBC = 0.14. The other categories showed no significant differences, with W = 7354 for communication, at p = 0.32; W = 8565 for assessment, at p = 0.24; and W = 7466 for materials, at p = 0.43.
Teacher Characteristics—Extent of Using Moodle as a Teaching Tool. There were small, significant positive correlations between the extent of using Moodle for teaching and three types of data. Spearman’s correlation resulted in values of ρ = 0.13 for communication, at p < 0.05; ρ = 0.30 for assessment, at p < 0.001; and ρ = 0.13 for materials, at p < 0.05. No significant difference was found for Attendance, with ρ = 0.10, at p = 0.12.
Teacher Characteristics—Extent of Using Moodle Reports. There were small-medium significant positive correlations between the extent of using Moodle reports and all types of data. Spearman’s correlation resulted in values of ρ = 0.28 for communication, at p < 0.001; ρ = 0.21 for communication, at p < 0.001; ρ = 0.31 for assessment, at p < 0.001; and ρ = 0.21 for materials, at p < 0.001.
Course Characteristics—Level. The only significant difference was found regarding the assessment data, as follows: the participants teaching undergraduate-level courses scored assessment data higher (M = 2.5, SD = 1.4, n = 194) than the participants teaching graduate-level courses (M = 2.3, SD = 1.2, n = 59), with W = 4772, at p < 0.05; however, this depicts a small effect size of RBS = 0.17. The other categories showed no significant differences, with W = 5178 for Attendance, at p = 0.25; W = 6069 for communication, at p = 0.47; and W = 5674 for materials, at p = 0.92.
Course Characteristics—Course Size. There was a marginally significant, small positive correlation between course size and assessment data, with ρ = 0.12, at p = 0.06. There were no significant correlations with the other types of data. Spearman’s correlation resulted in values of ρ < 0.01 for Attendance, at p = 0.99; ρ = −0.01 for communication, at p = 0.83; and ρ = −0.03 for materials, at p = 0.67.

5.2.2. Intensions of Using Data to Promote Students’ Learning

Teacher Characteristics—Gender (N = 249). The four types of intentions of using data to promote students’ learning were found to be ordered by the same order of importance among women (n = 121) and men (n = 128), however, women’s rankings were all significantly higher than men’s, with small effect sizes. Comparing between the two sub-populations resulted in W = 9742 for engagement, at p < 0.001, with RBC = 0.26; W = 9462 for motivation, at p < 0.01, with RBC = 0.22; W = 8971 for completion, at p < 0.05, with RBC = 0.16; and W = 9329 for skills, at p < 0.01, with RBC = 0.21. Our findings are summarized in Figure 2.
Teacher Characteristics—Teaching Experience. There was a significant, small negative correlation between teaching experience and intention to use data to promote students’ course completion, with ρ = −0.16, at p < 05. Marginally significant correlations were found for engagement, with ρ = −0.11, at ρ = 0.08; and ρ = −0.11 for skills, at p = 0.08. There was no significant correlation with motivation, with ρ = −0.07, at p = 0.28.
Teacher Characteristics—Role in Course. There were no significant differences between instructors and TAs in their intentions to use data for promoting students’ education. The Mann–Whitney values were W = 6894 for engagement, at p = 0.90; W = 7121 for motivation, at p = 0.57; W = 6160 for completion, at p = 0.21; and W = 6725 for skills, at p = 0.85.
Teacher Characteristics—Faculty Affiliation. There were no significant differences between the participants from the hard and soft disciplines in their intentions to use data for promoting students’ education. The Mann–Whitney values were W = 7405 for engagement, at p = 0.37; W = 8323 for motivation, at p = 0.47; W = 8587 for completion, at p = 0.23; and W = 7990 for skills, at p = 0.89.
Teacher Characteristics—Extent of Using Moodle as a Teaching Tool. There were small, significant positive correlations between the extent of using Moodle for teaching and intentions to use data to promote students’ learning. Spearman’s correlation resulted in values of ρ = 0.23 for engagement, at p < 0.001; ρ = 0.18 for motivation, at p < 0.01; ρ = 0.19 for completion, at p < 0.01; and ρ = 0.21 for skills, at p < 0.001.
Teacher Characteristics—Extent of Using Moodle Reports. There were small, significant positive correlations between the extent of using Moodle reports and the intention to use student data to promote students’ learning. Spearman’s correlation resulted in values of ρ = 0.23 for engagement, at p < 0.001; ρ = 0.25 for motivation, at p < 0.01; ρ = 0.34 for completion, at p < 0.01; and ρ = 0.21 for skills, at p < 0.001.
Course Characteristics—Level. There were no significant differences between the participants’ intention to use data to promote students’ learning when comparing undergraduate and graduate courses, with W = 5853 for engagement, at p = 0.79; W = 5668 for motivation, at p = 0.91; W = 5223 for completion, at p = 0.30; and W = 6011 for skills, at p = 0.55.
Course Characteristics—Course Size. There were no significant correlations between course size and the participants’ intention to use data to promote students’ learning. Spearman’s correlation resulted in values of ρ = −0.07 for engagement, at p = 0.25; ρ = −0.08 for motivation, at p = 0.22; ρ = 0.08 for completion, at p = 0.19; and ρ = −0.06 for skills, at p = 0.35.

5.2.3. Potential Actions upon Viewing Data

Teacher Characteristics—Gender (N = 249). The six potential actions to be taken upon viewing student data were found to be ordered by the same order of importance among women (n = 121) and men (n = 128), however, women’s rankings were all significantly higher than men’s, with small effect sizes. Comparing between the two sub-populations resulted in W = 9913 for communication, at p < 0.001, with RBC = 0.28; W = 9659 for topics, at p < 0.001, with RBC = 0.25; W = 10,121 for pedagogy, at p < 0.001, with RBC = 0.31; W = 9364 for structure, at p < 0.01, with RBC = 0.21; W = 9772 for practice, at p < 0.001, with RBC = 0.26; and W = 9707 for assessment, at p < 0.001, with RBC = 0.25. Our findings are summarized in Figure 3.
Teacher Characteristics—Teaching Experience. There was a significant small negative correlation between teaching experience and acting with communication upon viewing student data, with ρ = −0.16, at p < 01. There were no significant correlations with the other potential actions. Spearman’s test resulted in ρ = −0.02 for topics, at p = 0.70; ρ = −0.04 for pedagogy, at p = 0.49; ρ = −0.02 for structure, at p = 0.75; ρ = −0.03 for practice, at p = 0.67; and ρ = 0.04 for assessment, at p = 0.53.
Teacher Characteristics—Role in Course. There were significant differences between the instructors and TAs in their intention to take communication- and assessment-related actions upon viewing the student data. The TAs were more like to take communication-related actions (M = 3.5, SD = 1.3, n = 78) than the instructors (M = 3.2, SD = 1.2, n = 175), with W = 5744, at p < 0.05, depicting a small effect size of RBC = 0.16; however, the instructors were more likely take assessment-related actions (M = 2.7, SD = 1.2, n = 175) than the TAs (M = 2.4, SD = 1.3, n = 78), with W = 7859, at p < 0.05, also depicting a small effect size of RBC = 0.15. No significant differences were shown for the other potential actions, with W = 7463 for topics, at p = 0.22; W = 7332 for pedagogy, at p = 0.33; W = 7289 for structure, at p = 0.36; and W = 7036 for practice, at p = 0.69.
Teacher Characteristics—Faculty Affiliation. There was only one significant difference, based on faculty affiliation, in the participants’ intention to act upon viewing student data, as follows: the participants from the soft disciplines were more likely to act in pedagogy (M = 3.3, SD = 1.2, n = 140) than the participants from the hard disciplines (M = 2.8, SD = 1.2, n = 113), with W = 6214, at p < 0.01, denoting on a small effect size of RBC = 0.21. No significant differences were found regarding the other potential actions, with W = 7739 for communication, at p = 0.76; W = 7339 for topics, at p = 0.31; W = 7733 for structure, at p = 0.75; W = 8113 for practice, at p = 0.72; and W = 7512 for assessment, at p = 0.48.
Teacher Characteristics—Extent of Using Moodle as a Teaching Tool. There were small significant positive correlations between the extent of using Moodle for teaching and all but one potential action. Spearman’s correlation resulted in values of ρ = 0.15 for communication, at p < 0.05; ρ = 0.18 for topics, at p < 0.01; ρ = 0.18 for pedagogy, at p < 0.01; ρ = 0.16 for practice, at p < 0.05; and ρ = 0.15 for assessment, at p < 0.05. No significant correlation was found regarding structure, with ρ = 0.10, at p = 0.13.
Teacher Characteristics—Extent of Using Moodle Reports. There were small, significant positive correlations between the extent of using Moodle for teaching and all potential actions. Spearman’s correlation resulted in values of ρ = 0.18 for communication, at p < 0.01; ρ = 0.16 for topics, at p < 0.05; ρ = 0.18 for pedagogy, at p < 0.01; ρ = 0.21 for structure, at p < 0.001; ρ = 0.24 for practice, at p < 0.001; and ρ = 0.15 for assessment, at p < 0.05.
Course Characteristics—Level. There were no significant differences in potential actions regarding the undergraduate and graduate courses, with W = 4934 for communication, at p = 0.10; W = 5714 for topics, at p = 0.99; W = 5660 for pedagogy, at p = 0.9; W = 5550 for structure, at p = 0.72; W = 4968 for practice, at p = 0.12; and W = 5998 for assessment, at p = 0.57.
Course Characteristics—Course Size. There was a small, marginally significant negative correlation between course size and the participants’ intent to act regarding pedagogy, with ρ = −0.11, at p = 0.09. No significant correlations were found for the other potential actions. Spearman’s correlation resulted in values of ρ = −0.04 for communication, at p = 0.54; ρ = −0.04 for topics, at p = 0.51; ρ = 0.02 for structure, at p = 0.78; ρ = 0.02 for practice, at p = 0.74; and ρ = −0.02 for assessment, at p = 0.73.

5.3. Predicting Potential Action-Taking (RQ3)

5.3.1. Constructing a Factor Model

We first ran Exploratory Factor Analysis (EFA) in order to examine whether the observed variables could be regrouped under fewer latent variables. We did so while factoring by minimum residual. As we did not assume that the questionnaire items were uncorrelated, we chose an oblique rotation, particularly promax [35]. Indeed, a correlation analysis of the items revealed that they are all intercorrelated—positively—with coefficients between 0.21 and 0.81, all at p < 0.001. The items were eliminated if loadings were less than 0.50. We achieved a 3-factor model, which broadly agreed with our pre-assumed structure. The exceptions were two items that were identified with high uniqueness values (>0.5), that is, were not included in the factor model, as follows: Importance of Data Use—Assessment, and Act Upon Data—Communication. The factor loadings are presented in Table 3.
Next, we tested for the construct validity of the 3-factor model—hence, verifying the factor structure previously found and testing for the relationship between the observed variables and their underlying latent constructs—using Confirmatory Factor Analysis (CFA). The model resulted in χ2 = 110.31 (df = 51), at p < 0.001. We achieved good fit measures, with CFI = 0.97 and LFI = 0.96, above the conventional 0.95 cut-off threshold, and RMSEA = 0.07 and SAMR = 0.03, below the conventional cut-off of 0.06 and 0.08, respectively.
Finally, we calculated three new variables, corresponding to the three factors, named Data Use, Importance of Data, and Act Upon Data. We kept the two items that were not included in the factor model as two additional variables.

5.3.2. Predicting Action-Taking

For this analysis, Act Upon Data are considered as a dependent variable. Since one of the items related to it (i.e., communication) was eliminated from the respective factor, we consider two dependent variables—factor-model-based and communication-item-based—and built two separate linear regression models. For the independent variables, we used the two variables that are based on the factor model (Importance of Data and Use of Data), and an additional single-item variable (Importance of Data—Assessment), while controlling for the other independent variables that describe the teacher and course characteristics.
Predicting Teachers’ Intentions to Act Upon Data (Factor-Model-Based Variable). We first built a linear regression model using the variables describing the teacher and course characteristics. This model served as the null model, H0. The model is significant with F(df = 8) = 5.74, at p < 0.001, and had an Adjusted R2 = 0.13 and RMSE = 0.94. Of the independent variables, Use of Moodle reports had a significant, positive coefficient (β = 0.22, at p < 0.001); gender (Male) had a significant, negative coefficient (β = −0.51, at p < 0.001); and role (TA) had a significant, negative coefficient (β = −0.36, at p < 0.05).
We then added the three independent variables, and achieved an improved model, H1, with F(df = 11) = 26.32, at p < 0.001. This model had an Adjusted R2 = 0.53 and RMSE = 0.69. In this model, only the questionnaire-related variables are significant, with positive contribution to the prediction, as follows: Importance of Data, with β = 0.21, at p < 0.001; Use of Data, with β = 0.41, at p < 0.001; and Importance of Data—Assessment, with Importance of Data Use, with β = 0.10, at p < 0.01. Our findings are summarized in Table 4.
Predicting Teachers’ Intentions to Act Upon Data—Communication (Single-Item-Based Variable). Here too, we first built a linear regression model using the variables describing the teacher and course characteristics. This model served as the null model, H0. The model is significant with F(df = 8) = 5.34, at p < 0.001 and had an Adjusted R2 = 0.12 and RMSE = 1.13. Of the independent variables, course size had a significant, negative coefficient, albeit negligible (β = −0.003, at p < 0.01); Use of Moodle reports had a significant, positive coefficient (β = 0.24, at p < 0.01); and gender (Male) had a significant, negative coefficient (β = −0.52, at p < 0.001).
We then added the three independent variables, and achieved an improved model, H1, with F(df = 11) = 15.86, at p < 0.001. This model had an Adjusted R2 = 0.40 and RMSE = 0.94. In this model, the questionnaire-related variables are significant, with positive contribution to the prediction, as follows: Importance of Data, with β = 0.26, at p < 0.001; Use of Data, with β = 0.32, at p < 0.001; and Importance of Data—Assessment, with Importance of Data Use, with β = 0.14, at p < 0.01. Additionally, course size is significant and negative, however, with a negligible coefficient of β = =0.002, at p < 0.05. Our findings are summarized in Table 5.

6. Discussion

In this quantitative exploration (N = 253), we studied instructors’ and TAs’ perceptions of using data about student activity on course websites, particularly aiming at uses that promote students’ learning. The current study takes a step forwards in bridging an existing gap in the literature, namely, a lack of research of teachers’ perceptions of using logged data. Looked at from the point of view of developing and implementing an institution-level learning analytics system, the current study is situated under the third dimension of SHEILA framework, “Identify desired behavioral change” [36]. Our findings raise a few issues that are worthy discussion, as they have theoretical and practical implications.

6.1. Global Patterns: Medium-High Scores, Women More Inclined than Men, Positive Associations with Experience with LMS

Overall, the participants ranked all data-related items at medium-high levels. These findings demonstrate an overall appreciation of student data, which is in line with previous studies [17,37]. These findings are promising, as using student data may be helpful to instructors as an important means to promote students’ learning and improve their teaching [38]. However, the actual use of learning analytics is not necessarily high, mostly due to a lack of institutional support and difficulties with access to and interpretation of data [17]. Note that women ranked all of the items higher than men, which is a new addition to the study of learning analytics in higher education and is in line with findings regarding K-12 teachers’ data-driven decision making [39]. This finding may not be easily explained by differences in teaching approach, as recent studies have often shown no such gender-based differences [40,41], and may not be easily explained by technology adoption, as the findings on this issue are mixed [42,43]. It may be related to teachers’ attitudes towards data, which echoes recent findings, according to which female students found a learning-analytics-supported environment more engaging and self-regulative than male students [44]. Hence, we recommend further studying the issue of gender-based differences in attitudes towards, or use of, educational data.
The findings about the positive associations with previous experience with Moodle across all dimensions are probably not surprising. Noticeably, there were almost no associations of the various studied dimensions with other teacher or course characteristics. This echoes van Leeuwen et al.’s [45] recent findings, showing that teacher characteristics were not associated with the use of data-driven education dashboards. Part of the explanations suggested by van Leeuwen et al. was that dashboard use may require some specific knowledge and skills that may not be associated with general teacher characteristics, like the ones they had measured (which resemble the characteristics that we used here). Therefore, we urge to further the research in the field towards this direction, i.e., to study which instructor and course characteristics may be associated with data use. This will help to promote the effective engagement of instructors with data about student activity and will eventually support student learning and well-being.

6.2. Perceptions of Instruction as Portrayed in the Findings

For the instructors who participated in this study, data about student assessment and student use of online resources were the most important, while data about students’ communication and participation were ranked the lowest. They were mostly interested in students completing the course and being engaged with it, and less interested in them being motivated towards learning or gaining learning skills. This new, nuanced understanding of instructors’ perceptions of student data depicts a rather traditional, instructor-centered perception of online learning that draws on the traditional face-to-face approach; in addition, according to the traditional approach, which seemingly still holds, students are expected to passively consume knowledge and are then tested on it—not necessarily because they want to do so, but mostly because this is merely the ways things have been carried out for decades. Recall that, in our study, the participants referred to the students using course websites, i.e., learning management systems. Such systems are easy to use and are very common in higher education institutions world-wide. However, their use is still rather shallow, and is mostly focused on communication, educational resources, and administrative aspects of teaching and learning [46]. Therefore, the continuous, large-scale use of such systems may seemingly portray a situation of technology adaptation, while, in reality, it fixates on a traditional approach to teaching that should have been changed long ago.
Our participants were less interested in changing the assessment or the course structure upon viewing the student data, were mostly willing to communicate with their students, and would have considered modifying the course topics. Interestingly, similar findings were recently presented from a four-country cross-case analysis, where providing feedback to the students and adapting the curriculum were commonly the most popular actions to be taken upon viewing learning analytics [47,48]. These seemingly small steps are not to be taken lightly and shed an important light on instructors’ potential actions; moreover, student success is not only dependent on instructors’ preparation, but also on instructors’ continuous guidance and assistance. Therefore, communicating with students—even when implemented via something as simple as an email message—may still have a powerful impact on both students and instructors [49]. Furthermore, while assessment and course structure are relatively difficult to change without proper, thoughtful preparation, the fact that instructors consider changing course topics is comforting and may suggest a nice consideration of their student needs.

6.3. Importance and Use of Data as Predictors of Action-Taking

Taking action upon viewing student data is key to the implementation of effective learning analytics and is considered an integral part of the learning analytics life cycle; in addition, data are made available for instructors—and, generally, for learning analytics stakeholders—in order for them to act upon them [50]. Moreover, students expect instructors and institutions to use learning analytics in various ways that would promote their education, including having meaningful feedback and promoting them academically [19,51]. Therefore, our findings are important in that they demonstrate that the predictors of action-taking upon viewing student data are teachers’ perceptions of the importance of student data and their intentions to use student data. Rogers’ [52] theory of the diffusion of innovation emphasized that one’s perceptions of the advantages of a given technology predict its adoption. Indeed, this has been repeatedly shown to be relevant in educational contexts [53,54]. Combined with our findings about the positive associations between experience with Moodle and all of our data-related variables, the importance of familiarity of and experience with student data is strengthened, as it may lead to a positive change in perceptions [55]. Furthermore, such familiarity and expertise can help in decreasing the levels of caution from data-driven models and help in promoting the adoption of using data-driven models [56].

6.4. Contribution to the Understanding of Teachers’ Analytics Use

Wise and Jung’s [57] model of instructors’ use of analytics consists of two components, namely sense making and pedagogical response. This model emphasizes that instructors do not always come to analytics with a specific purpose, but rather with general, curiosity-driven questions; moreover, the model highlights that possible pedagogical responses upon viewing analytics are either action-taking, adopting a wait-and-see strategy, or reflecting on pedagogy. Indeed, a recent study has shown how pedagogical beliefs are associated with the intentions of using—or not using—learning analytics in higher education [58]. Our study adds an important, nuanced understanding of this process by highlighting what types of data are most interesting for teachers, what is important for them vis à vis promoting students, and what types of interventions that they would take. This further emphasizes the important role that instructors should have in the design of learning analytics [7,59], as part of a broader, institutional data ecosystem [60]. Of course, learning analytics design is an ongoing iterative process, and it would also feed itself on the evaluation of actual use [36,61]. Therefore, it is important to keep studying instructors’ de facto use of student data and how their interests, intentions, and potential actions evolve along with that use.

6.5. Limitations

This study has some limitations, as portrayed herewith. First, we relied solely on a self-report questionnaire, therefore, the participant responses may be biased. Furthermore, the questionnaire was administered online, which may have biased sample selection. Second, the study was situated in a single country with specific educational, technological, and cultural characteristics, hence its findings may not be generalizable to other countries. Moreover, we do not assume that our sample is representative of the teaching staff in this country, and not even in the studied institution. Third, our participants referred to a single learning management system (Moodle), and our findings may be limited to the common practices using data in this platform. These limitations may be viewed as a potential subject for future research in other educational settings. Additionally, we studied the intention to take actions, and future research should explore the actions taken in practice.

Author Contributions

Conceptualization, T.S.; Methodology, A.H.; Validation, T.S.; Formal analysis, A.H.; Investigation, G.A.A.; Resources, G.A.A. and T.S.; Data curation, A.H. and T.S.; Writing–original draft, A.H.; Writing–review & editing, G.A.A. and T.S. All authors have read and agreed to the published version of the manuscript.

Funding

This work was supported by the Schlindwein Family Tel Aviv University–Notre Dame Research Collaboration Grant.

Institutional Review Board Statement

This study was conducted in accordance with the Declaration of Helsinki and approved by the Ethics Committee of Tel Aviv University (Ref:0005055-1); Date of approval: 8 June 2022.

Informed Consent Statement

Informed consent was obtained from all subjects involved in the study.

Data Availability Statement

The data presented in this study are available on request from the corresponding author.

Conflicts of Interest

The authors declare no conflicts of interest.

References

  1. Gašević, D.; Dawson, S.; Pardo, A.; Gašević, D.; Dawson, S.; Pardo, A. How do we start? State and Directions of Learning Analytics Adoption. In Proceedings of the 2016 ICDE Presidents’ Summit, Sydney, Australia, 20–23 November 2016; pp. 1–24. [Google Scholar] [CrossRef]
  2. Khalil, M.; Prinsloo, P.; Slade, S. The use and application of learning theory in learning analytics: A scoping review. J. Comput. High. Educ. 2022, 35, 573–594. [Google Scholar] [CrossRef]
  3. Paulsen, L.; Lindsay, E. Learning analytics dashboards are increasingly becoming about learning and not just analytics—A systematic review. Educ. Inf. Technol. 2024, 29, 14279–14308. [Google Scholar] [CrossRef]
  4. Kustitskaya, T.A.; Esin, R.V.; Kytmanov, A.A.; Zykova, T.V. Designing an education database in a higher education institution for the data-driven management of the educational process. Educ. Sci. 2023, 13, 947. [Google Scholar] [CrossRef]
  5. Hora, M.T.; Bouwma-Gearhart, J.; Park, H.J. Data driven decision-making in the era of accountability: Fostering faculty data cultures for learning. Rev. High. Educ. 2017, 40, 391–426. [Google Scholar] [CrossRef]
  6. Ndukwe, I.G.; Daniel, B.K. Teaching analytics, value and tools for teacher data literacy: A systematic and tripartite approach. Ndukwe Daniel Int. J. Educ. Technol. High. Educ. 2020, 17, 22. [Google Scholar] [CrossRef]
  7. Sarmiento, J.P.; Wise, A.F. Participatory and co-design of learning analytics: An initial review of the literature. In Proceedings of the LAK22: 12th International Learning Analytics and Knowledge Conference, Online, 21–25 March 2022; ACM International Conference Proceeding Series. Association for Computing Machinery: New York, NY, USA, 2022; pp. 535–541. [Google Scholar] [CrossRef]
  8. Gaftandzhieva, S.; Hussain, S.; Hilčenko, S.; Doneva, R.; Boykova, K. Data-driven decision making in higher education institutions: State-of-play. Int. J. Adv. Comput. Sci. Appl. 2023, 14, 397–405. [Google Scholar] [CrossRef]
  9. Asfaw, Z.; Alemneh, D.; Jimma, W. Data-driven decision-making and its impacts on education quality in developing countries: A systematic review. In Proceedings of the 2023 International Conference on Information and Communication Technology for Development for Africa (ICT4DA), Bahir Dar, Ethiopia, 26–28 October 2023; IEEE: Piscataway, NJ, USA, 2023; pp. 198–203. [Google Scholar] [CrossRef]
  10. Usher, M.; Hershkovitz, A. Data-driven decisions of higher education instructors in an era of a global pandemic. Online Learn. 2023, 27, 170–186. [Google Scholar] [CrossRef]
  11. Wilcox, G.; Conde, C.F.; Kowbel, A. Using evidence-based practice and data-based decision making in inclusive education. Educ. Sci. 2021, 11, 129. [Google Scholar] [CrossRef]
  12. Andrews, T.C.; Lemons, P.P. It’s personal: Biology instructors prioritize personal evidence over empirical evidence in teaching decisions. CBE Life Sci. Educ. 2015, 14, ar7. [Google Scholar] [CrossRef]
  13. Herodotou, C.; Hlosta, M.; Boroowa, A.; Rienties, B.; Zdrahal, Z.; Mangafa, C. Empowering online teachers through predictive learning analytics. Br. J. Educ. Technol. 2019, 50, 3064–3079. [Google Scholar] [CrossRef]
  14. Chan, C.K.Y.; Luo, J. Exploring teacher perceptions of different types of ‘feedback practices’ in higher education: Implications for teacher feedback literacy. Assess. Eval. High. Educ. 2022, 47, 61–76. [Google Scholar] [CrossRef]
  15. Trinidad, J.E. Understanding student-centred learning in higher education: Students’ and teachers’ perceptions, challenges, and cognitive gaps. J. Furth. High. Educ. 2020, 44, 1013–1023. [Google Scholar] [CrossRef]
  16. McKinley, J.; McIntosh, S.; Milligan, L.; Mikołajewska, A. Eyes on the enterprise: Problematising the concept of a teaching-research nexus in UK higher education. High Educ. 2021, 81, 1023–1041. [Google Scholar] [CrossRef] [PubMed]
  17. Usher, M.; Hershkovitz, A. Interest in educational data and barriers to data use among massive open online course instructors. J. Sci. Educ. Technol. 2022, 31, 649–659. [Google Scholar] [CrossRef] [PubMed]
  18. Clark, J.-A.; Tuffley, D. Enhancing higher education with Learning Analytics in the digital age. ASCILITE Publ. 2023, 56–65. [Google Scholar] [CrossRef]
  19. Falcão, T.P.; Rodrigues, R.L.; Cechinel, C.; Dermeval, D.; de Oliveira, E.H.T.; Gasparini, I.; Araújo, R.D.; Primo, T.; Gasevic, D.; Mello, R.F. A penny for your thoughts: Students and instructors’ expectations about learning analytics in Brazil. In Proceedings of the LAK22: 12th International Learning Analytics and Knowledge Conference, Online, 21–25 March 2022; ACM: New York, NY, USA, 2022; pp. 186–196. [Google Scholar] [CrossRef]
  20. Hilliger, I.; Ortiz-Rojas, M.; Pesántez-Cabrera, P.; Scheihing, E.; Tsai, Y.-S.; Muñoz-Merino, P.J.; Broos, T.; Whitelock-Wainwright, A.; Pérez-Sanagustín, M. Identifying needs for learning analytics adoption in Latin American universities: A mixed-methods approach. Internet High. Educ. 2020, 45, 100726. [Google Scholar] [CrossRef]
  21. Ifenthaler, D.; Yau, J.Y.K. Utilising learning analytics to support study success in higher education: A systematic review. Educ. Technol. Res. Dev. 2020, 68, 1961–1990. [Google Scholar] [CrossRef]
  22. Archer, E.; Barnes, G. Revisiting sensemaking: The case of the Digital Decision Network Application (DigitalDNA). Int. Rev. Res. Open Distance Learn. 2017, 18, 249–276. [Google Scholar] [CrossRef]
  23. Clow, D. The learning analytics cycle: Closing the loop effectively. In Proceedings of the 2nd International Conference on Learning Analytics and Knowledge, Vancouver, BC, Canada, 29 April–2 May 2012; pp. 134–138. [Google Scholar]
  24. Chanthiran, M.; Ibrahim, A.B.; Rahman, M.H.A.; Kumar, S.; Dandage, R.V. A systematic literature review with bibliometric meta-analysis of AI technology adoption in education. EDUCATUM J. Sci. Math. Technol. 2022, 9, 61–71. [Google Scholar] [CrossRef]
  25. Zhu, Y.; Areeprayolkij, W.; Thanyaphongphat, J.; Tumphasuwan, K. Literature review on influencing factors of university teachers’ attitude toward information and communication technology competence. In Proceedings of the 2021 IEEE 1st International Conference on Advanced Learning Technologies on Education & Research (ICALTER), Lima, Peru, 16–18 December 2021; IEEE: Piscataway, NJ, USA, 2021; pp. 1–4. [Google Scholar] [CrossRef]
  26. Akram, H.; Abdelrady, A.H.; Al-Adwan, A.S.; Ramzan, M. Teachers’ perceptions of technology integration in teaching-learning practices: A systematic review. Front. Psychol. 2022, 13, 920317. [Google Scholar] [CrossRef]
  27. Chun, T.W.; Yunus, M.M. Exploring teachers’ technology acceptance during COVID-19 pandemic: A systematic review (2020–2022). Int. J. Eval. Res. Educ. (IJERE) 2023, 12, 956. [Google Scholar] [CrossRef]
  28. Aurangzeb, W.; Kashan, S.; Rehman, Z.U. Investigating technology perceptions among secondary school teachers: A systematic literature review on perceived usefulness and ease of use. Acad. Educ. Soc. Sci. Rev. 2024, 4, 160–173. [Google Scholar] [CrossRef]
  29. Kaqinari, T. Facilitators and barriers to online teaching and educational technology use by university lecturers during COVID-19: A systematic review of qualitative evidence. Trends High. Educ. 2023, 2, 636–666. [Google Scholar] [CrossRef]
  30. Kuh, G.D.; Kinzie, J.; Buckley, J.A.; Bridges, B.K.; Hayek, J.C. Piecing Together the Student Success Puzzle: Research, Propositions, and Recommendations; John Wiley & Sons: Hoboken, NJ, USA, 2007. [Google Scholar]
  31. Watson, W.R.; Watson, S.L. What are learning management systems, what are they not, and what should they become? TechTrends 2007, 51, 28–34. [Google Scholar]
  32. Brown, N.; Bower, M.; Skalicky, J.; Wood, L.; Donovan, D.; Loch, B.; Bloom, W.; Joshi, N. A professional development framework for teaching in higher education. In Research and Development in Higher Education: Reshaping Higher Education; Devlin, M., Nagy, J., Lichtenberg, A., Eds.; Higher Education Research and Development Society of Australasia (HERDSA): Canberra, Australia, 2010; pp. 133–143. [Google Scholar]
  33. Brown, G.; Atkins, M. Effective Teaching in Higher Education; Routledge: London, UK, 2002. [Google Scholar]
  34. Biglan, A. The characteristics of subject matter in different academic areas. J. Appl. Psychol. 1973, 57, 195–203. [Google Scholar] [CrossRef]
  35. Gorsuch, R.L. Factor Analysis, 2nd ed.; Lawrence Erlbaum Associates: Hillsdale, NJ, USA, 1983. [Google Scholar]
  36. Tsai, Y.-S.; Moreno-Marcos, P.M.; Jivet, I.; Scheffel, M.; Tammets, K.; Kollom, K.; Gašević, D. The SHEILA framework: Informing institutional strategies and policy processes of learning analytics. J. Learn. Anal. 2018, 5, 5–20. [Google Scholar] [CrossRef]
  37. Gomes, T.C.S.; Falcão, T.P.; de Azevedo Restelli Tedesco, P.C. Exploring an approach based on digital games for teaching programming concepts to young children. Int. J. Child. Comput. Interact. 2018, 16, 77–84. [Google Scholar] [CrossRef]
  38. Erdemci, H.; Karal, H. Examination of instructors’ experiences for the use of learning analytics. Int. J. Inf. Learn. Technol. 2021, 38, 21–31. [Google Scholar] [CrossRef]
  39. Botvin, M.; Hershkovitz, A.; Forkosh-Baruch, A. Data-driven decision-making in emergency remote teaching. Educ. Inf. Technol. 2023, 28, 489–506. [Google Scholar] [CrossRef]
  40. Abdella, A.S.; Fataar, A. Teaching styles of educators in higher education in Eritrea. J. High. Educ. Afr. 2021, 19, 45–62. [Google Scholar] [CrossRef]
  41. Sabah, S.; Di, X. University faculty’s perceptions and practices of student centered learning in Qatar: Alignment or gap? J. Appl. Res. High. Educ. 2018, 10, 514–533. [Google Scholar] [CrossRef]
  42. Soomro, K.A.; Kale, U.; Curtis, R.; Akcaoglu, M.; Bernstein, M. Digital divide among higher education faculty. Int. J. Educ. Technol. High. Educ. 2020, 17, 21. [Google Scholar] [CrossRef]
  43. Scherer, R.; Howard, S.K.; Tondeur, J.; Siddiq, F. Profiling teachers’ readiness for online teaching and learning in higher education: Who’s ready? Comput. Human. Behav. 2021, 118, 106675. [Google Scholar] [CrossRef]
  44. Banihashem, S.K.; Noroozi, O.; Khaneh, M.P.A. Gender differences in engagement and self-regulation in an online constructivist learning design and learning analytics environment. In Proceedings of the International Conference on Studies in Education and Social Sciences, Antalya, Turkey, 11–14 November 2021; Balint, G., Antala, B., Carty, C., Mabieme, J.-M.A., Amar, I.B., Kaplanova, A., Eds.; Uniwersytet Śląski, Wydział Matematyki, Fizyki i Chemii: Katowice, Poland, 2021; pp. 171–176. Available online: https://eric.ed.gov/?id=ED625290 (accessed on 25 October 2024).
  45. van Leeuwen, A.; Campen, C.A.N.K.-V.; Molenaar, I.; Rummel, N. How teacher characteristics relate to how teachers use dashboards: Results from two case studies in k–12. J. Learn. Anal. 2021, 8, 6–21. [Google Scholar] [CrossRef]
  46. Kwon, S.; Kim, W.; Bae, C.; Cho, M.; Lee, S.; Dreamson, N. The identity changes in online learning and teaching: Instructors, learners, and learning management systems. Int. J. Educ. Technol. High. Educ. 2021, 18, 67. [Google Scholar] [CrossRef]
  47. Kollom, K.; Tammets, K.; Scheffel, M.; Tsai, Y.-S.; Jivet, I.; Muñoz-Merino, P.J.; Moreno-Marcos, P.M.; Whitelock-Wainwright, A.; Calleja, A.R.; Gasevic, D.; et al. A four-country cross-case analysis of academic staff expectations about learning analytics in higher education. Internet High. Educ. 2021, 49, 100788. [Google Scholar] [CrossRef]
  48. Li, Q.; Jung, Y.; d’Anjou, B.; Wise, A.F. Unpacking instructors’ analytics use: Two distinct profiles for informing teaching. In Proceedings of the LAK22: 12th International Learning Analytics and Knowledge Conference, Online, 21–25 March 2022; ACM: New York, NY, USA, 2022; pp. 528–534. [Google Scholar] [CrossRef]
  49. Hagenauer, G.; Muehlbacher, F.; Ivanova, M. ‘It’s where learning and teaching begins—Is this relationship’—Insights on the teacher-student relationship at university from the teachers’ perspective. High Educ. 2023, 85, 819–835. [Google Scholar] [CrossRef]
  50. Bartolini, A.C.; Running, C.L.; Duan, X.; Ambrose, G.A. Integrated closed-loop learning analytics scheme in a first-year engineering course. Presented at the ASEE Annual Conference and Exposition, Online, 22–26 June 2020. [Google Scholar] [CrossRef]
  51. Whitelock-Wainwright, A.; Gašević, D.; Tejeiro, R.; Tsai, Y.S.; Bennett, K. The student expectations of Learning analytics questionnaire. J. Comput. Assist. Learn. 2019, 35, 633–666. [Google Scholar] [CrossRef]
  52. Rogers, E.M. Diffusion of Innovation, 5th ed.; Free Press: New York, NY, USA, 2003. [Google Scholar]
  53. Assaf, M.; Spil, T.; Bruinsma, G. Supporting teachers adopting game-based learning in formal education: A systematic literature review. Proc. Eur. Conf. Games-Based Learn. 2021, 2021, 33–42. [Google Scholar] [CrossRef]
  54. Ramadhan, M.A.; Daryati, D. Online learning innovation at vocational schools in Indonesia during Covid-19 pandemic: A literatur review. AIP Conf. Proc. 2022, 2489, 030016. [Google Scholar] [CrossRef]
  55. Hershkovitz, A.; Daniel, E.; Klein, Y.; Shacham, M. Technology integration in emergency remote teaching: Teachers’ self-efficacy and sense of success. Educ. Inf. Technol. 2023, 28, 12433–12464. [Google Scholar] [CrossRef] [PubMed]
  56. Mckee, H. An instructor learning analytics implementation model. Online J. 2017, 21, 87–102. [Google Scholar] [CrossRef]
  57. Wise, A.F.; Jung, Y. Teaching with analytics: Towards a situated model of instructional decision-making. J. Learn. Anal. 2019, 6, 53–69. [Google Scholar] [CrossRef]
  58. Muljana, P.S.; Luo, T. Utilizing learning analytics in course design: Voices from instructional designers in higher education. J. Comput. High. Educ. 2021, 33, 206–234. [Google Scholar] [CrossRef]
  59. Caporarello, L.; Cirulli, F.; Milani, M. Design of a learning analytics framework proposal in academic context. Ital. J. Educ. Res. 2019, 23, 43–55. [Google Scholar] [CrossRef]
  60. Prinsloo, P.; Khalil, M.; Slade, S. Learning analytics as data ecology: A tentative proposal. J. Comput. High. Educ. 2023, 36, 154–182. [Google Scholar] [CrossRef]
  61. Syed, M.; Duan, X.; Anggara, T.; Ambrose, G.A.; Lanski, A.; Chawla, N.V. Integrated closed-loop learning analytics scheme in a first year experience course. In Proceedings of the 9th International Conference on Learning Analytics & Knowledge, Tempe, AZ, USA, 4–8 March 2019; ACM International Conference Proceeding Series. ACM: New York, NY, USA, 2019; pp. 521–530. [Google Scholar] [CrossRef]
Figure 1. Importance of types of data by gender.
Education 14 01180 g001
Figure 2. Intentions of data use by gender.
Education 14 01180 g002
Figure 3. Potential actions upon viewing data by gender.
Education 14 01180 g003
Table 1. Our framework for studying higher education teachers’ perceptions, intentions, and actions regarding data about students’ activity in course websites—mapping between definitions or teaching frameworks and our dependent variables.
Learners—Dimensions of Student Promotion
Aspects of Student Success
[30]
Our Research Framework Dimension
Academic achievementCompletion of course successfully
Engagement in educationally purposeful activitiesIncreasing engagement
SatisfactionIncreasing motivation
Acquisition of desired knowledge, skills, and competenciesEnhancing learning skills
PersistenceCompletion of course successfully
Attainment of educational objectivesCompletion of course successfully
Data—Course Website Use
LMS Use
[31]
Our Research Framework Dimension
Placement of course materials onlineLearning materials
Associating students with coursesOnline participation
Tracking student performanceAssessment
Storing student submissionsOnline participation
Mediating communication between the students and their instructorCommunication
Intervention—Teacher Action
HE Teachers’ Areas of Activity
[32]
Our Research Framework Dimension
Design and planningChange course structure
TeachingChanging pedagogy
AssessmentChange assessment
Developing effective environmentsCommunication with students;
Adding self-practice opportunities (inspired by [33])
Integration of scholarship with teachingChanging topics taught
Self-evaluationN/A
Table 2. Descriptive statistics for the dependent variables (N = 253).
Mean (SD)Difference from Next Data Type (Z a)
Learners—Dimensions of Student Promotion
Assessment3.5 (1.5)4.4 ***
Learning materials3.0 (1.5)3.8 ***
Communication2.6 (1.4)2.1 *
Online participation2.5 (1.3).
Data—Course Website Use
Completion of course successfully3.2 (1.3)2.3 *
Increasing engagement3.0 (1.3)4.6 ***
Increasing motivation2.8 (1.2)2.3 *
Enhancing learning skills2.6 (1.2).
Intervention—Teacher Action
Communication with students3.3 (1.2)2.9 **
Change topics taught3.1 (1.2)0.01, p = 0.995
Changing pedagogy3.0 (1.2)2.3 *
Adding self-practice opportunities2.9 (1.3)1.9 *
Change course structure2.8 (1.2)2.7 **
Change assessment2.6 (1.2).
a Across whole population, based on Wilcoxon Signed-Rank test. * p < 0.05, ** p < 0.01, *** p < 0.001.
Table 3. Factor loading for our Exploratory Factor Analysis of the questionnaire.
ItemFactor 1
(Act Upon Data)
Factor 2
(Use of Data)
Factor 3
(Importance of Data)
Uniqueness
Act Upon Data—Structure0.903 0.303
Act Upon Data—Practice0.870 0.325
Act Upon Data—Pedagogy0.786 0.259
Act Upon Data—Assessment0.669 0.498
Act Upon Data—Topics0.620 0.486
Use of Data—Motivation 0.952 0.207
Use of Data—Engagement 0.825 0.193
Use of Data—Skills 0.753 0.428
Use of Data—Completion 0.709 0.400
Importance of Data—Attendance 0.8980.317
Importance of Data—Materials 0.7790.409
Importance of Data—Communication 0.6800.408
Importance of Data—Assessment 0.760
Act Upon Data—Communication 0.561
Table 4. Regression model coefficients for Act Upon Data (factor-model-based).
Model UnstandardizedStandard ErrorStandardized atp
H0(Intercept)2.8200.279 10.124<0.001
Teaching Experience−0.0090.007−0.100−1.4150.159
Course Size−0.0018.204 × 10−4 −0.114−1.7880.075
Use of Moodle Teaching Tools0.0650.0670.0630.9730.332
Use of Moodle Reports0.2200.0650.2193.357<0.001
Faculty Category (Soft)−0.0820.130 −0.6310.528
Gender (Male)−0.5100.126 −4.050<0.001
Role (TA)−0.3610.156 −2.3110.022
Course Level (Undergraduate)0.1070.147 0.7240.470
H1(Intercept)1.0060.242 4.155<0.001
F_Importance of Data0.2090.0510.2494.109<0.001
F_Use of Data0.4060.0560.4387.250<0.001
Teaching Experience−0.0020.005−0.021−0.3880.698
Course Size−6.715 × 10⁻⁴ 6.086 × 10⁻⁴ −0.052−1.1030.271
Use of Moodle Teaching Tools−0.0180.050−0.017−0.3470.729
Use of Moodle Reports−0.0130.051−0.013−0.2480.804
F_Importance_Assessment0.1000.0350.1502.8270.005
Faculty Category (Soft)0.0620.098 0.6350.526
Gender (Male)−0.1800.096 −1.8790.062
Role (TA)−0.1980.116 −1.7010.090
Course Level (Undergraduate)0.0750.109 0.6830.496
a Standardized coefficients can only be computed for continuous predictors.
Table 5. Regression model coefficients for Act Upon Data—Communication (single-variable factor).
Model UnstandardizedStandard ErrorStandardized atp
H0(Intercept)3.1030.337 9.208<0.001
Teaching Experience−0.0130.008−0.117−1.6390.103
Course Size−0.0039.923 × 10−4 −0.174−2.7120.007
Use of Moodle Teaching Tools0.0670.0810.0540.8350.405
Use of Moodle Reports0.2350.0790.1952.9730.003
Faculty Category (Soft)−0.1410.157 −0.8970.371
Gender (Male)−0.5210.152 −3.423<0.001
Role (TA) 0.0910.189 0.4810.631
Course Level (Undergraduate)0.2790.178 1.5670.118
H1(Intercept)1.2930.329 3.925<0.001
F_Importance of Data0.2630.0690.2613.806<0.001
F_Use of Data0.3150.0760.2824.133<0.001
Teaching Experience−0.0060.007−0.052−0.8600.391
Course Size−0.0028.280 × 10−4 −0.126−2.3670.019
Use of Moodle Teaching Tools−0.0170.069−0.014−0.2540.800
Use of Moodle Reports−0.0040.069−0.004−0.0620.951
F_Importance_Assessment0.1440.0480.1792.9890.003
Faculty Category (Soft)−0.0050.133 −0.0370.970
Gender (Male)−0.1790.130 −1.3750.170
Role (TA)0.2700.158 1.7080.089
Course Level (Undergraduate)0.2240.149 1.5090.133
a Standardized coefficients can only be computed for continuous predictors.
Disclaimer/Publisher’s Note: The statements, opinions and data contained in all publications are solely those of the individual author(s) and contributor(s) and not of MDPI and/or the editor(s). MDPI and/or the editor(s) disclaim responsibility for any injury to people or property resulting from any ideas, methods, instructions or products referred to in the content.

