1. Introduction
The Internet of Things (IoT) is becoming a new disruptive paradigm that offers enormous possibilities in the technological advancements in many aspects of life [
1]. Furthermore, the capacities of IoT get reinforced by other emerging technologies, such as artificial intelligence, big data, and virtual reality, which help improve its potential benefits even more [
2]. This way, IoT is going to change the way we live thanks to its applications in all fields, which will affect us professionally and personally [
3].
However, IoT not only offers advantages but it also raises some concerns about cybersecurity and privacy, such as improper device updates, the misconfiguration of secure protocols, lack of user awareness, or the misuse of active device monitoring [
4]. On the other hand, other issues may arise in many IoT devices as dark patterns. For instance, some user interface designs could mislead users towards unwanted or unintentional behavior, which would not be adopted in a conscious manner [
5]. Hence, education in cybersecurity is the best way to try to tackle all those issues, focusing on the improvement of awareness raising and the design of more training initiatives [
6].
IoT may be seen from different points of view in the education field. One of the current trends is the Internet of Educational Things (IoET), which describes the use of IoT in order to improve academic, teaching, and campus infrastructures in colleges [
7]. The main benefit of including IoT in schools and universities is the adoption of smart technologies to create smart objects, which are able to communicate and coordinate to each other [
8]. Some instances of smart objects are smart classrooms, smart libraries, or smart administration, as well as smart teachers and smart learners [
9].
Some researchers use the concept of Education 4.0, also known as smart learning, within the use of IoT in the teaching–learning process, along with the deployment of virtual–physical models [
10]. In this context, Education 1.0 is related to traditional learning, where printed books and physical classrooms were used. Education 2.0 refers to digital learning, where digital media and virtual teaching came around with the popularization of internet. Education 3.0 is related to e-learning, where internet platforms such as learning management systems (LMS) and non-centralized teaching were promoted with the rise in the high bandwidth available [
11].
A smart environment in Education 4.0 is mainly focused on IoT devices, which play the roles of either sensors or actuators when they are connected through a communication network. In this context, IoT devices help provide an optimal environment for learning, supervise a student’s engagement, or check a student’s presence [
12]. Those IoT devices may produce large amounts of raw data, which need to be analyzed by smart decision-making applications, such as smart education or smart control resources, in order to transform the raw data into processed data. In turn, such data are stored in edge or cloud facilities in order for end users to get access to the data they are duly authorized [
13].
The adoption of IoT in education depends on a range of factors, such as environmental, organizational, technological, and individual. Regarding the first component, it just includes tools, while the second one covers online monitoring, auto attendance, financial constraints, and training. With respect to the third component, it includes networking and data security, technical support, ease of use, and ease of access, whilst the fourth one covers interaction and self-efficacy [
14]. Many different models have been proposed in the literature in recent years with respect to the introduction of IoT in education [
15], although it seems that generally speaking, both teachers and students have positive attitudes and high expectations about it [
16].
Nonetheless, some challenges may arise in the integration of IoT into the education system to establish smart education, such as computational issues and social resistance, along with problems inherited out of traditional education [
17]. Moreover, some of the IoT challenges in the education sector are the latency associated with cloud computing, the management of the massive amount of data generated, the need for mobility applications not only for teaching but also for assessing and grading, the concerns about security and privacy, tools to address ethical issues, and ways to deal with constrained budgets [
18].
The application of the Internet of Things to education opens up a whole range of new opportunities, which are generically referred to as IoET. Its deployment will lead to the improvement of learning outcomes by providing enhanced learning experiences, rising operational effectiveness, and obtaining real-time insights about students’ performance [
19]. Some of the applications furnished by IoET are distance learning, close monitoring, specific education, evolving methodologies and techniques, improved collaboration and productivity, monitoring the health of students, teachers, and staff, safety on the property, automatically recording attendance, or augmented reality equipped systems [
20].
Many instances of IoT-based courses have been mentioned in the literature. For instance, Gumina et al. referred to a practical course on IoT from the perspective of the main IT pillars, such as networking, programming, databases, human–computer interfaces, and web systems [
21]. Kotsifakos et al. talked about a course to teach the features of IoT sensor technologies and its differences with traditional types of sensors [
22]. Assumpçao et al. described a course based on the three-phase methodology approach with extensive experimentation in order to design, build, and test solutions based on IoT [
23].
Kumar et al. developed a smart learning environment with the aim of achieving better learning outcomes and higher retention rates by the use of IoT devices in order to raise the quality of e-learning [
24]. Rahman et al. proposed an educational kit for IoT online learning, composed of a combination of low-cost hardware and software, with the target of boosting online learning [
25]. Conceiçao et al. exposed an IoT model for securing operations and energy-saving consumption [
26]. Rivera et al. presented a set of IoT-based simulators that can interact with cloud servers for data storage in order to acquire computational competences [
27].
There are not many instances in the literature about teaching IoT through seminars. In this sense, Sánchez et al. exposed three seminars related to IoT cybersecurity within the Industry 4.0 field in order to acquire the necessary competences [
28]. Goeman et al. presented a seminar devoted to raising the awareness of IoT security from the point of view of offensive and defensive security specialists [
29]. Mondal et al. referred to an advanced seminar on IoT and big data analytics by means of use cases [
30].
Silvis proposed the study of IoT devices from a system engineering approach, considering the interactions among hardware, software, and humans, which, in fact, resulted in a holistic system-centric approach [
31]. Mz et al. presented a seminar focused on problem-solving related to the role of sensor technologies and robots in the industry [
32]. Rodriguez et al. exposed a series of seminars aimed to introduce problem-based learning and project-based learning strategies to facilitate real-time decision making [
33].
Due to the growing importance of IoT in the current society, including the educational field, in this paper, we propose a seminar in order to introduce the grounds of IoT. The goals of this seminar were twofold, as the first one was to outline the theoretical concepts under the IoT paradigm, and the second one was to design an easy and practical application of IoT with a specific software tool. This way, our target was to get students to be conscious of the role that IoT may play in the near future in many areas.
The projects proposed were carried out in groups, where each team had to present its project in the last session of the seminar. After each presentation, all the students had to evaluate the results of the project exposed with a specific construct, also known as a survey. The questions proposed within this construct were built for this event, and they were previously validated by a panel of five experts. Eventually, after all the presentations were performed, the students had to evaluate their level of engagement in the seminar with a standard construct for this matter. This way, we did not only measured their academic performance [
34], but we also assessed their degree of motivation [
35].
Section 2 is dedicated to expose the methodology used, then,
Section 3 displays the different results obtained, after that,
Section 4 is devoted to carry out the discussion about the results, and finally,
Section 5 draws the final conclusions.
2. Methodology
We are a group of teachers working in the Computer Engineering Department of a Spanish university. Most of our teaching activity is mainly related to two degrees, such as a Degree in Computer Science and a Degree in Telecommunication Engineering, where we are covering the courses that involve architecture and technology of computers, along with programming languages and computer networking. Therefore, our teaching field is included into the areas of science, technology, engineering, and mathematics (STEM) education.
Focusing on computer networks, there is a particular subject in both degrees devoted to introduce the foundations of networking, which is taught in the third semester. This subject presents the layers of the open systems interconnection (OSI) model, especially centering on the ones involved in network communications through transmission media, and its role is to establish the grounds for learning networking at a college level.
In this context, in the academic year 2023–2024, we organized a seminar for the students in both courses altogether in order to introduce them to the paradigm of IoT, as they did not face any specific course about it at that stage on neither of both degrees. Hence, the idea was to introduce them an outline of the basics of IoT, along with a practical activity to be carried out in groups.
All groups had to be integrated by students from both courses, such that students from one course were induced to collaborate with their peers from the other course. They are encouraged to work in teams with some unknown colleagues, which mirrors the situation that will happen to them when they get a new job and they know nobody around.
Regarding the participant recruitment, all students registered in both courses took part in the seminar, as it provided part of their final assessment for the course. Hence, the demographics of the study population were all men and women aged between 19 and 22 years old, which are the most common ages to be in college trying to get a university degree.
In addition to it, innovation in teaching technology are usually associated with innovative teaching topics, such as flipped classrooms, collaborative learning, or adaptive learning. However, it could also be carried out with traditional teaching methods, like a seminar, as its format allows for multiple combinations when it comes to organizing team work or setting up blended environments.
In this case, we decided to set up this seminar so as to bring students in touch with the emerging IoT paradigm, as it was a hot topic not covered in the course curriculum. The aim of this seminar was to get students familiar with IoT by undertaking basic projects on a software application. We considered that a seminar like this was the best option to do so, as it allowed students to interact in groups in different ways. For instance, they could interact both in-person and online, as well, they could do it synchronously and asynchronously because the seminar’s format is not as tight as the layout of a traditional master class. Eventually, according to the results exposed in this paper, it seems that there is no inconvenient in applying innovation in education with traditional teaching methods.
2.1. Dimensions
The seminar was planned for an overall amount of 60 students because both classes were composed of 30 students. However, we decided to establish different conditions in the seminar related to space and time. Regarding the spatial dimension, the seminar was scheduled when the students belonging to one degree were attending college, whereas the students being part of the other degree were not. Regarding the temporal dimension, some students in both degrees were working part-time or had to attend lessons elsewhere from other courses, so they could not attend the seminar, hence it was recorded in order for those students to visualize it later at their convenience.
Therefore, the learning environment could be considered as hybrid when it comes to space, where part of the scholars were attending the seminar on-site, or in-person, whilst the rest of them were doing it online. This hybrid connotation is commonly called blended when used in educational contexts [
36]. At the same time, the learning environment could be seen as hybrid when it comes to time, where some of the learners were attending the seminar live, while others were doing it on a recorded basis. Live attendance is usually referred to as synchronous in educational contexts, whereas asynchronous is used for non-live events, where the timing to access the content is irrelevant. This nuance of hybrid is going to be called mixed in this paper, although this word is often related to the same concept of blended in learning contexts [
37].
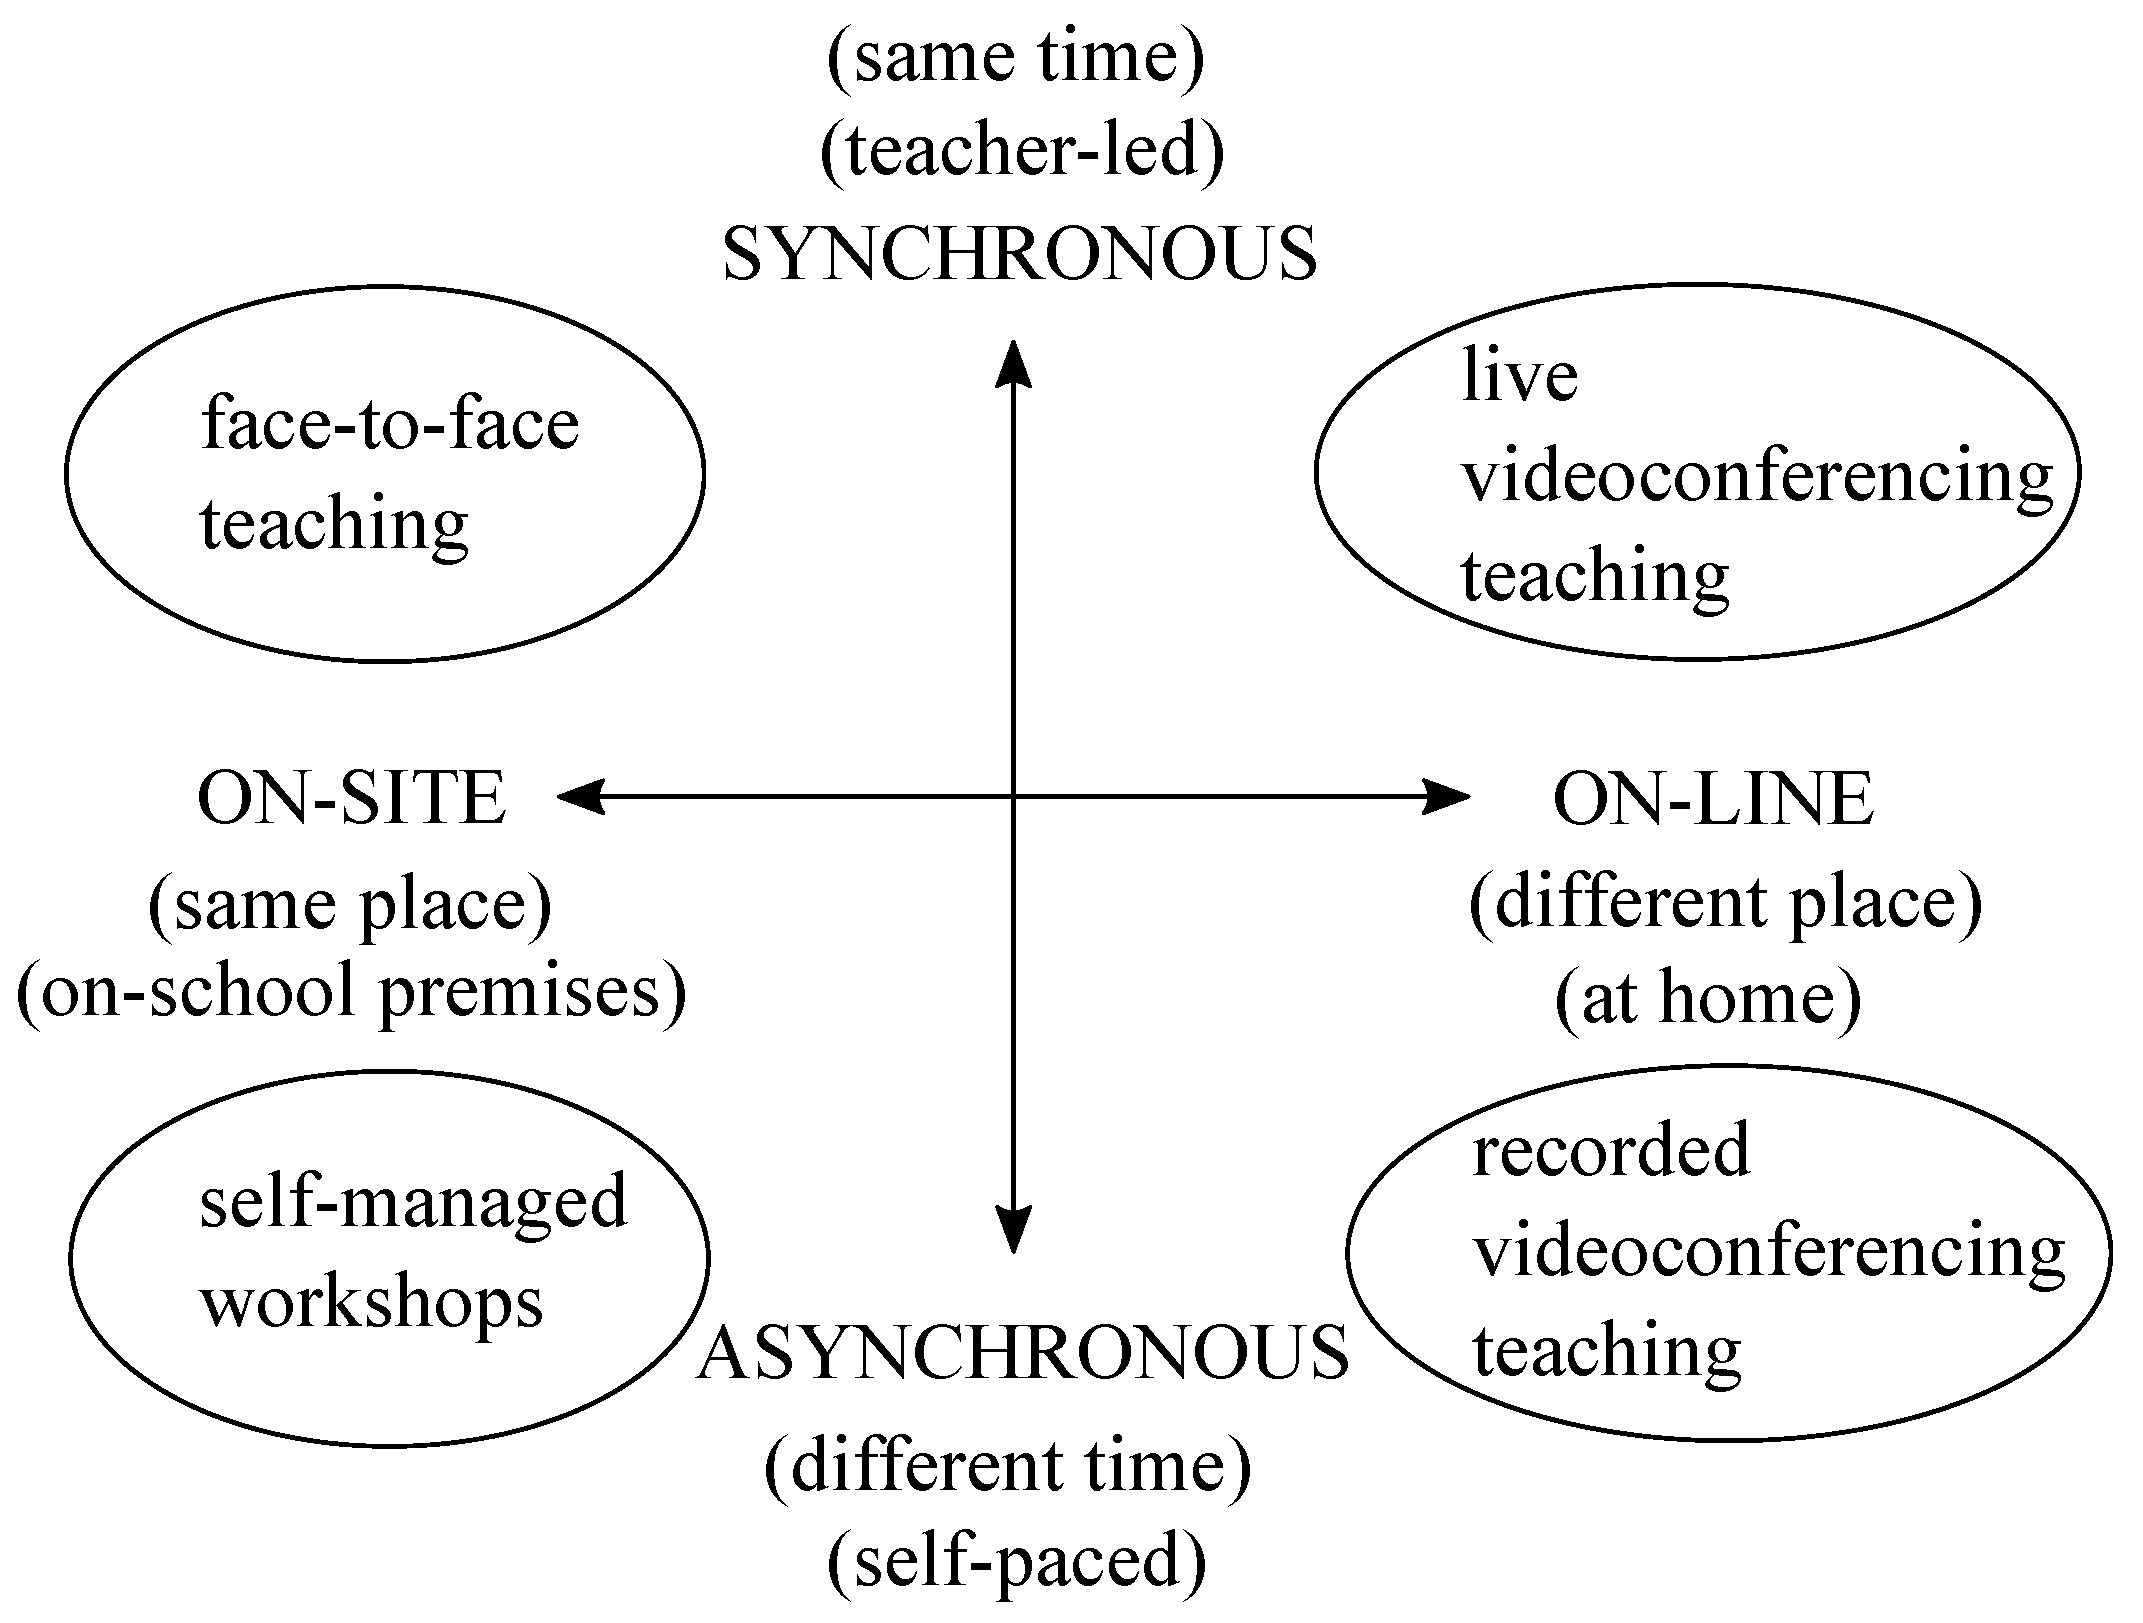
In other words, the spatial and temporal conditions could be associated to two different axes or dimensions, where the word, hybrid, has a specific connotation in each condition. In the case of this seminar, it stands for the chance to choose the physical location to take the lessons between on-site or online when it comes to the spatial dimension, whilst it refers to the fact for selecting the timing to attend the lessons between synchronous or asynchronous when it comes to the temporal dimension. In this sense,
Figure 1 exhibits the most common instances of the different types of teaching–learning depending on the different combinations of place and time [
38].
Furthermore, a third axis or third dimension could also be implemented in this case, as the lessons in the seminar could be dictated in the local language, which happens to be Spanish, or in the current ‘lingua franca,’ which is actually English. In this scenario, the word hybrid could be viewed as the possibility to choose the language to attend the course [
39]. However, this option has not been implemented in the current seminar because the language used in the lessons has been Spanish, although the adoption of a bilingual model has been contemplated as a potential improvement for future editions. Nonetheless, a sort of hybrid scenario has been set up when it comes to language, as bibliographic materials are mostly in English, which is also the case of the software application used to undertake the practical part of the seminar.
Additionally, different classroom framesets have been used throughout the diverse lessons that compose the seminar. On the one hand, frontal class refers to the scenario where a teacher plays an active role by providing the full content, while students listen to it and ask questions, thus playing a passive role. On the other hand, interactive class relates to the scenario where a teacher provides part of the content and also designs interactions for students to not only listen but also to interact with each other, and hands-on class responds to the scenario where a teacher designs the learning process and students are in charge of building content during their interactions. Hence, the classroom frameset could also be considered as a fourth dimension, where the term hybrid could be assigned to the interactive class [
40].
In summary,
Table 1 exhibits the four dimensions exposed, along with the possible values considered in each facet. In fact, the different combinations of all those features allow for the deployment of a wide variety of scenarios, which permit the adaptation to virtually any learning circumstances. Of course, the contents of this table are not immutable and could easily be extended with other dimensions and values if it was necessary to cope with specific situations.
Anyways, the seminar has been imparted in 5 lessons, where each of them was undertaken with different features regarding the dimensions exposed above. In fact,
Table 2 presents the features for each of the sessions held during the seminar.
It is obvious that some of the conditions established for the different sessions are not possible for conventional teaching scenarios. Those are characterized by in-person and synchronous lectures, hence, variations in spatial and temporal dimensions are out of scope for such scenarios. However, some other conditions are indeed exportable to conventional teaching scenarios, such as variations in language in order to apply multilingual approaches, or variations in the classroom frameset. Regarding the latter, a higher degree of interaction among students could be facilitated by moving chairs and tables to work in groups or the use of student response systems, like Wooclap, Kahoot, and Socrative, in order to keep scholars focused. Therefore, the outcome obtained in this seminar could be adapted to the features of any teaching scenario.
2.2. Session 1
The first session was scheduled to review some materials about the fundamentals of IoT and the software application to carry out a practical activity about IoT. Hence, it was not a physical session, as students could not attend in-person. Instead, a collection of tasks were assigned to be undertaken in a self-pace format during a period of two weeks on an online and asynchronous basis.
The materials chosen were self-paced online courses available on one of the Cisco’s learning platform called skillsforall.com and we recommended to access them in English, even though they were available in Spanish as well. The reason for this was to get students used to the terminology employed in the IoT field, which is commonly expressed in English. Similar courses are also available on another Cisco’s learning platform called netacad.com, even though the former was chosen because the courses selected have a more interactive layout.
The first of those courses was called “Getting Started with Cisco Packet Tracer”, which is a 2-h course whose target is to introduce a software tool called Packet Tracer. This is a proprietary application designed by Cisco Systems, even though free access is granted after the registration on any of the Cisco learning platforms quoted above. Furthermore, this piece of software could be downloaded from any of the platforms and its latest version at this point, which is 8.2.1, is available to be installed in Windows, Linux, and macOS.
The second course was called “Introduction to IoT and Digital Transformation”, which is a 6-h course with the aim of presenting IoT devices and how they are expected to help in the digital transformation of the physical world. Moreover, the third course was called “Exploring Internet of Things with Cisco Packet Tracer”, which is a 3-h course whose goal is to get Packet Tracer and IoT together in order to show how Packet Tracer could be used to simulate IoT environments.
Additionally, an optional fourth course was offered as well, called “Exploring Networking with Cisco Packet Tracer”, which is a 3-h course whose aim is to understand how to simulate computer networks in Packet Tracer. Packet Tracer was built up as a network simulator, although other functionalities related to cybersecurity and IoT were released at a later stage. A basic knowledge of networking can be helpful for students to better understand communications among IoT devices.
2.3. Session 2
The second session was scheduled to dictate a lecture about the basics of IoT and the implementation in Packet Tracer. This class was taught by a colleague who is an expert in the IoT field and works as a professor at an university located in Venezuela. As we are based in Spain, and Venezuela is a South American country whose mother tongue is Spanish, this was the language that he used to carry out his masterclass.
This lecture was set up in a blended learning format, where some of the students attended it on-site and could watch it on a wide-screen projector located in our usual classroom, whilst some others did it remotely online through their own end devices, like PCs, laptops, tablets, or smartphones. Either way, most students attended this lecture on a synchronous manner, although a few others did it asynchronously because they could not attend the lesson, so they could access the recording of the session at their convenience.
The classroom frameset of this session was frontal class, as the lecturer dictated the class through slides and practical examples designed in Packet Tracer, whereas students could ask questions about the contents related to IoT and their practical implementation in the software application. This session lasted around 2 h, where learners got very interested in the topics exposed.
2.4. Session 3
The third session was scheduled to form groups of five components in a blended manner, such that each group had to be composed by some learners in-person and some other online. As stated before, the former belonged to one degree and the latter to the other degree, hence each group had to be composed by students of both degrees. This way, in each group there were some students who had little or no relation among them, so we were trying to mirror what happens when they start working in production environments and they have to build up teams with unknown team mates.
The team formation process was carried out at random, where the only condition was to choose three students from one degree and two students from the other in order to obtain five students overall. Hence, the first task after forming the blended teams was as an ice-breaking activity, where students briefly introduced themselves to their team mates.
Afterwards, the teachers provided some insights to the audience, composed by students located either on-site or online, about the contents exposed in the masterclass regarding IoT and Packet Tracer, and, in turn, the members within the different teams began to plan their designs. In this sense, we established a home automation scenario, where each team had to design an IoT-based system in Packet Tracer, which could include any of the sensors, actuators, and network devices available in the software application.
During the rest of the session, team work was carried out by the different teams, while the teachers were giving advice to them regarding particular aspects of their designs, as each team was in charge of organizing the work flow and duties of each member. Furthermore, this session was performed in a synchronous manner, even though it ended up being also asynchronous because some students contacted us in order to advise them on their designs.
2.5. Session 4
The fourth session was scheduled to continue the tasks of each team in order to get the projects done. This session was set up as a hands-on class, where team members could complete their pending tasks in order to complete the projects. This way, the teachers acted as facilitators or dynamizers for the diverse teams in order to encourage them and to solve specific doubts about basic concepts regarding networking or programming IoT devices in Python or Javascript.
As in former sessions, this one was performed on a blended environment, where on-site and online components were interacting with each other. Likewise, it was performed in a mixed environment, as not all teams were able to finish their projects within the previous session and they had to do it later on at their convenience, whilst some of the team members could not attend the session on a synchronous manner and they interacted with their team colleagues on an asynchronous fashion.
The aim of this session was to complete a fully functional project in Packet Tracer, where a home automation system had to be implemented. Each project had to include some initial notions of programming, as some basic coding had to be added to the IoT devices to act upon a mouse click or a changing condition in the Packet Tracer environment, mirroring the way that sensors and actuators work within a sensing system. Each project had to include some initial notions of networking in order to be able to monitor the state of the IoT devices deployed within the scenario proposed by means of a remote end device duly configured in Packet Tracer.
2.6. Session 5
The fifth session was scheduled for each team to make a pitch presentation, which is a short presentation of a few minutes. A time slot of around 5 min was scheduled for each group, where a team representative exposed the team’s project to the audience, which was composed by the students belonging to all teams and the teachers involved. The goal of those presentations was to exhibit the home automation scenarios built up by each team, along with a small demo with two targets. The first one was to code some IoT devices to react to some particular inputs, where both the IoT devices and the inputs were chosen by the team. On the other hand, the second one was to design a monitoring application in Packet Tracer to keep track of those IoT devices from a remote monitoring device within Packet Tracer, where some network connections had to be configured so as to get the necessary communications up and running.
The pitch presentations had to be undertaken in-person by a team representative attending the session on-site. The presentation had to be held synchronously, as every student had to listen to it, either onsite or online, and, in turn, each of them had to evaluate different aspects of both the presentation and the project in a survey. This way, the outcome of the seminar for each group was evaluated on a peer review basis. This point was done by means of an online form, where 10-point Likert-type questions for each item were required, considering that Likert-type scales are commonly employed when it comes to social science research [
41].
A Likert-type scale question assigns quantitative values to qualitative data, such that it enables a user to indicate the degree of agreement about it. For instance, in a 5-point Likert-type question, the typical values of an answer are 1 to fully disagree, 2 to disagree, 3 to neutral, 4 to agree, and 5 to fully agree. Besides, in a 4-point Likert-type question, there is no answer corresponding to neutral, such that the usual values of an answer are 1 to totally disagree, 2 to disagree, 3 to agree, and 4 to totally agree. Moreover, in a 7-point Likert-type question, the common values are 1 to fully disagree, 2 to disagree, 3 to partially disagree, 4 to neutral, 5 to partially agree, 6 to agree, and 7 to fully agree.
The forms to be answered by the students in order to evaluate the work performed by the different teams were divided into three sections, such as prototype, communication, and relation to the SDG. In the first section, three aspects were asked, such as the quality of the solution implemented, along with the programming part and the networking part. In the second section, three factors were requested, such as the clarity in the explanation, soft skills of the presenter, and temporization. In the third section, three points were demanded, such as the degree of alignment with SDG, the degree of the contribution to meet SDG, and the facility of implementation to meet SDG.
In order to measure the degree of engagement of the students when they took part in this seminar, we prepared another survey according to the intellectual, social, affective (ISA) engagement scale, which was also filled in individually. This scale was originally intended to measure the degree of engagement of users when they are in working environments, although it was later extrapolated to other domains, such as in learning environments [
42]. The ISA engagement scale is composed of 3 dimensions, also known as facets, such as intellectual, social, and affective, whose aim is to calculate the degree of engagement related to cognitive motivation, social interaction, and emotional connection.
Each of those dimensions are measured by means of three different 7-point Likert-type standard questions, whose average value stands for the measure of the engagement of such a dimension. The average value expected for each dimension must be at least 6, accounting for all the answers related to the three questions included in a given dimension. Consequently, the average value of the three dimensions must also be above 6, while the average of the values obtained in the three dimensions yields the value of the overall engagement, which must be greater than 6 as well. This way, as the expected values are somewhere between 6 and 7, it implies that the level of engagement is somewhere between agree and fully agree.
The ISA engagement scale is made of 9 standard questions, also referred to as items, which are equally distributed among the intellectual, social, and affective dimensions. The use of ISA as an instrument to measure engagement in educational settings has been corroborated by different studies in the literature.
In this sense, Nwachukwu et al. [
43] defend the convenience of using the approach based on dimensions in the education field, where the intellectual dimension is related to the academic effort, the social dimension is related to the relationships with colleagues, and the affective dimension is tied to positive feelings about the place. This point of view is also shared by Sharma [
44], who stands for the convenience of using this model in education. Furthermore, Tortosa et al. [
45] presented a literature review on academic engagement of students, where it is shown that the ISA engagement scale is one of the most popular instruments for this matter.
Nonetheless, the primary focus of this seminar was not set on engagement, but on meaningful learning. In fact, getting a high engagement level is a way to better assimilate the expected knowledge, skills, and attitudes in a given course. With respect to the knowledge, the goal of the seminar was for students to get in touch with IoT in order to understand the basics of interconnecting things. With regards to the skills, they had to apply such knowledge in simple projects, which were carried out on a software application, where they also had to apply previous knowledge in networking and programming. Concerning the attitudes, the projects were carried out in groups, where they had to organize the corresponding roles and responsibilities.
3. Results
Three types of results are going to be shown, corresponding to three different surveys. The first one is related to the validity of the hand-crafted construct aimed to undertake the peer review evaluation of the projects. The construct had to be validated before making it available for students to evaluate the different presentations, so this survey was carried out by a group of five experts prior to the last session of the seminar.
The second one is related to the outcome obtained out of the peer review evaluation of the projects, so this survey was undertaken by the students who attended the fifth session, once per each project presented. Eventually, the third one is related to the measurement of the students’ engagement throughout the duration of the project, so this survey was also performed by students attending the fifth session just once at the end of the event. Additionally, the word “dimension” acquires a different meaning in each of the surveys considered, which is going to be exposed in the corresponding subsections.
3.1. 4-Point Likert-Type Survey for Experts to Assess the Peer Review Construct
Prior to presenting the peer review construct to the students, a panel of experts validated the questions or items within that survey.
3.1.1. Results Obtained with the Construct for the Panel of Experts
All students had to evaluate each of the projects presented by means of a survey, which could be effectively considered as a peer review system. This construct was composed of three categories, such as prototype, communication, and alignment with the Sustainable Development Goals (SDG), where three questions were assigned to each category in the construct.
Table 3 exposes those questions and the categories they belong to.
Regarding the items within the questionnaire, it is a common practice to mix positive and negative worded statements, where the latter are used to overcome biases by establishing control assertions [
46]. However, some authors claim that there are no evidence that the supposed advantages of including both positive and negative items overtake the disadvantages of mistakes and miscoding [
47], whilst some others state that such a mixing of positively and negatively worded items may lead to threats to the validity and reliability of the construct [
48]. Therefore, all of the items proposed herein take the positive approach.
The validity of the whole set of questions included in the survey has been measured by a panel of five experts by means of the Aiken’s V test. In fact, the nine questions proposed to evaluate the work of each team were ranked in a 4-point Likert-type scale, where each question was assessed considering two dimensions for the Aiken’s V test, such as the construction and the clarity of the question.
The average values received from the judges for each question and overall are displayed in
Table 4.
3.1.2. Validity Obtained with the Construct for the Panel of Experts
The average values obtained for each of the dimensions considered are the fundamentals on which the Aiken’s V test is based. The values attained in the Aiken’s V test go from 0 to 1, where the greater the value, the higher the evidence of validity for the content assessed, according to the panel of experts who took part in the evaluation process. Furthermore, validity could be applied to individual questions, even though it is usually applied to the dimensions contemplated and to the whole construct. Nonetheless, if a particular question gets rated well-below the rest, it is usually dropped out of the questionnaire, as it means the judges do not take it as a proper question.
Expression (
1) exhibits the way to calculate the value for the Aiken’s V test, where
stands for the average marks granted to the whole construct, or otherwise to each dimension considered,
l represents the lowest mark in the scale and
k accounts for the range of the scale used, meaning the difference between the top and the bottom values.
Different cutoff marks for the Aiken’s V test have been proposed in the literature, which accounts for a tougher agreement among judges for higher values or a looser agreement for lower values. The most common passing grades are 0.87, originally proposed by Aiken in 1985 [
49], which is considered as more conservative, whilst other values considered more liberals are 0.70, which was proposed by Charter in 2003 [
50], or 0.50, which was postulated by Cicchetti in 1994 [
51].
The results of the Aiken’s V test, according to the average values exposed by the judges, are shown in
Table 5. Hence, it can be concluded that the results obtained according to the evaluation of the judges about the nine questions proposed overcome the conservative cutoff mark proposed by Aiken. This way, as all dimensions are considered and the whole construct received scores above the cutoff mark are established, then there is no need to drop or modify any of the questions proposed.
3.2. 10-Point Likert-Type Survey for Students to Assess the Seminar on a Peer Review Basis
After the validation of the peer review construct by a panel of experts, this construct was presented to the students in order for them to evaluate the projects exposed.
3.2.1. Results Obtained with the Construct for Peer Review
Once the construct had been validated, then it was ready to be used by the students. This construct was composed of three categories, such as prototype, communication, and relation to the SDG, where each of those was made of three different questions.
With respect to the tally of the survey, there were 720 responses received overall, such that 12 groups of 5 students were created. Hence, the 60 students involved in the seminar filled in one survey per project presented, which accounted for 12 tests per student. Hence, these students had to rank each question on a 10-point Likert-type scale.
In summary,
Table 6 displays the most common centralization statistics applied to the outcome obtained, whereas
Table 7 shows the most common dispersion statistics referred to that outcome. The three categories exposed in the survey for experts are relabeled as dimensions in this survey for students within this subsection.
3.2.2. Reliability of the Construct for Peer Review
Once the results from the students had been collected, then the internal consistency of such data was measured, and the most commonly used method to assess the reliability of the answers in a Likert-type questionnaire is the Cronbach’s alpha [
52]. The range of values obtained goes from 0 to 1, where the higher the value, the greater the internal consistency of the data collected [
53]. In other words, when the value of the Cronbach’s alpha is closer to one, it means there is a higher correlation among the items and dimensions within a questionnaire.
Expression (
2) displays the way to calculate the value for the Cronbach’s alpha, where
k accounts for the number of items measured within the construct,
represents the sum of the variances corresponding to each item
i, whereas
stands for the variances corresponding to the overall scores associated with each student. Furthermore, the cutoff mark for an acceptable internal consistency is a Cronbach’s alpha value of 0.7, whereas values higher than 0.8 are considered good and values higher than 0.9 are branded as excellent.
Focusing on the results obtained for the Cronbach’s alpha for the three dimensions established for the students in the peer review questionnaire, as well as for the overall construct, all values of alpha are above 0.9, which accounts for excellent values of internal consistency and high correlation among items.
Table 8 depicts the results achieved.
3.2.3. Correlation among the Dimensions of the Construct for Peer Review
The high value of Cronbach’s alpha suggests a high correlation among the dimensions of the construct for peer review. This fact could be reinforced by actually calculating the values for the Pearson correlation coefficient, which describes the strength and the direction of the linear relationship occurring between two quantitative variables, where those variables are going to be considered as the data collected for the different dimensions proposed.
However, the Pearson correlation assumes that data are normally distributed, which happens to be a continuous distribution. On the other hand, the values obtained in the construct are discrete, as opposed to continuous, because they are natural numbers. Such numbers are considered as ordinal data, which could be seen as continuous enough, thus making the Pearson correlation a widely used tool when both variables are ordinal.
Nonetheless, the Spearman correlation would be fitter for ordinal variables, as it measures the rank correlation, which is defined as the statistical dependence that happens between the rankings of two variables. Actually, the Spearman correlation measures the monotonic relationships between two variables, which could be linear or otherwise. Additionally, the Spearman correlation, also known as the Spearman’s rank correlation, could be used with both continuous or discrete variables.
The Spearman correlation coefficient between two quantitative variables yields the same value as the Pearson correlation coefficient between the rank values of such variables.
Table 9 exposes both types of correlation among the three dimensions of the construct for peer review in order to check whether the values obtained are similar enough in both cases. In addition to it, values higher than 0.5 denote a strong positive correlation between the variables confronted.
3.3. 7-Point Likert-Type Survey for Students to Assess Their Engagement Level in the Seminar
At the end of the last session of the seminar, this survey was presented to the students in order to evaluate their level of engagement in the seminar.
3.3.1. Results Obtained with the Construct for Engagement Level
As stated above, the level of engagement for the whole seminar was measured by means of the ISA engagement scale, which is a specific construct composed of three dimensions, such as intellectual, social, and affective, where each of those are composed of three different questions [
54].
Table 10 exhibits those dimensions and the standard questions associated to each of them. In this sense,
Table 11 displays the centralization statistics referring to the results obtained regarding the questions of the ISA engagement scale, whilst
Table 12 shows the dispersion statistics related to them.
3.3.2. Reliability Obtained with the Construct for Engagement Level
The internal consistency of the results achieved by means of the ISA engagement scale have been assessed with the Cronbach’s alpha of the overall results, along with those that correspond to each dimension. In this sense,
Table 13 exhibits the reliability of the data collected.
3.3.3. Correlation among the Dimensions with the Construct for Engagement Level
The correlation among dimensions related to the data collected within the ISA engagement scale has been measured with both the Pearson correlation coefficient and the Spearman correlation coefficient, as shown in
Table 14.
4. Discussion
As exposed above, the results exhibited belong to three different surveys. To start with, the first one corresponds to a 4-point Likert-type construct, which was aimed at a panel of five experts with the purpose of validating the questions to be presented to the students attending the seminar. Then, the second one corresponds to a 10-point Likert-type construct containing the set of questions validated by the panel of experts, with the goal of assessing the results of the seminar. Each student had to fill in this construct in order to evaluate each of the projects presented by the different teams in the last session of the seminar on a peer review basis.
The third one corresponds to a 7-point Likert-type construct, whose goal was to measure the level of engagement of the students during the seminar. The first and second constructs are based on nine hand-crafted questions for this seminar, while the third construct is the ISA engagement scale, hence it contains its nine standard questions.
Regarding the results obtained in the first construct, the average values obtained in its both dimensions considered, namely, construction and clarity, are pretty close to four, which is the top level in a 4-point Likert-type scale. Specifically, the former yields 3.756, whilst the latter does 3.689, whist the average of all questions for all dimensions was 3.722. This values are quite close to four, which implies that the experts’ judgment about the items within the questionnaire was successful, as on average, they either agree or strongly agree with all those items, even though the latter prevailed in most questions.
Then, those values were used to calculate the Aiken’s V test in each dimension and overall, where the values obtained for construction and clarity went above the conservative cutoff mark established by Aiken, which is 0.87. Actually, the values obtained were 0.919 for the former and 0.896 for the latter, whilst the overall value was 0.907. Hence, those values led to validate the construct prepared for the students to evaluate the projects within the seminar.
With respect to the results obtained in the second construct, its different items were grouped into three dimensions, such as prototype, communication, and SDG. The average values obtained for those dimensions and the overall construct were all above eight in a range from 1 to 10, which stands for the fact that students performed quite well on average in the seminar. Furthermore, in all dimensions, the mode was 10, which is the highest score, as well as the 75th percentile, whilst the median was 9 and the 25th percentile is 7, which means that most students highly rated the outcome of the seminar. Moreover, the coefficients of variation attained were all around 0.2, which accounts for moderate variability because they did not overcome 0.3, which is the benchmark for high variability. The value achieved is considered as acceptable because it means that the relative dispersion, or variability, of data around the average is moderate.
Furthermore, the internal consistency of the data collected in all dimensions and the overall construct was excellent, as the Cronbach’s alpha in all cases were above 0.9. This fact also represents a high correlation among the dimensions, which was reinforced by means of calculating both the Pearson correlation coefficient and the Spearman correlation coefficient. The values of both coefficients were greater than 0.5, which is taken as the threshold to consider a high correlation between two quantitative variables.
With regards to the results attained in the third construct, the standard ISA engagement scale was employed, where items are grouped into three dimensions, such as intellectual, social, and affective. The average values achieved for each dimension and the overall construct were all above six, which is the cutoff mark to consider engagement according to the works on the ISA engagement scale. Specifically, all those average values are around 6.5, which clearly represents that students were engaged during the seminar and they enjoyed the activities proposed.
Moreover, in all dimensions, the mode, the median, and the 75th percentile were all 7, which is the highest score, whereas the 25th percentile was 6, which proves that students got very motivated in this seminar. Besides, the coefficient of variation in all the dimensions was around 0.1, which represents low variability of data around the average, as it goes under 0.15, and of course it is considered as acceptable.
Additionally, the internal consistency of the data compiled in each dimension was acceptable, as the Cronbach’s alpha in all cases were above 0.7, but lower than 0.8. On the other hand, the Cronbach’s alpha referred to the whole construct was over 0.9, which is excellent. Those values represent a significant correlation among the dimensions, which was proved by the calculation of the Pearson correlation coefficient, as well as the Spearman correlation coefficient. Both figures were higher than 0.5, which is the common benchmark to consider that two quantitative variables present a high correlation.
5. Conclusions
In this paper, a seminar to introduce the IoT paradigm at a college level has been presented. To start with, a set of four dimensions applied to the teaching–learning process has been defined. The first one is space, whose values may be on-site, online, or blended. The second one is time, whose options may be synchronous, asynchronous, or mixed. The third one is language, whose choices are Spanish, English, and bilingual. And the fourth one is classroom frameset, whose alternatives are the frontal class, the hands-on class, or the interactive class.
Taking them all into account, the seminar proposed was composed of five sessions, where each one had a different combination of those four dimensions. The final project of this seminar was to be carried out in groups of five students, where three of them came out of a course and the other two came from another course. Each team was in charge of preparing a basic project related to IoT, which had to be presented to the rest of students attending the last session of the seminar, and, in turn, they all had to evaluate each project on a peer review fashion.
A brand-new construct was built up to carry out this peer review with the help of a panel of five experts, who judged the items within the peer review construct. This assessment was made with a 4-type Likert-type survey, where two dimensions were considered for each of the nine items proposed, such as its construction and its clarity. The score obtained in both dimensions were used to calculate de Aiken’s V test, which accounted for an overall value of 0.907. Hence, as this value is higher than the usual cutoff marks cited in the literature, then the construct for peer review was considered to be validated. This outcome implied that the judges agreed with all the items included within the construct.
As said before, in the last session of the seminar, the students evaluated each of the projects presented by means of the peer review construct, which actually was a 10-type Likert-type survey. It was composed of three dimensions, such as prototype, communication, and SDG, where each of them was formed by three questions. Therefore, it accounted for nine questions overall, which, in fact, were the same questions previously validated by the judges.
The results obtained were successful, as the overall average of the evaluations made was 8.36, with a median of 9 and a mode of 10. Besides, the overall coefficient of the variation was 0.22, which is considered as a moderate variability of the data collected. On the other hand, the internal consistency of such data was measured through the Cronbach’s alpha, which accounted for a value of 0.929 for the overall construct, which is considered as an excellent figure. In addition to it, this value stands for a high correlation among dimensions, which was confirmed by means of both the Pearson correlation coefficient and the Spearman correlation coefficient.
Eventually, before the end of the last session of the seminar, another construct was filled in by the students in order to measure their engagement level. Actually, this construct was the ISA engagement score, which is composed of three dimensions, such as intellectual, social, and affective. Each of those dimensions was composed of three questions, which accounted for nine questions overall. This construct is a 7-point Likert-type survey, where the expected values for each dimension and overall is at least six.
The results achieved were successful because the overall average was 6.47, with a median and mode of 7. Moreover, the overall coefficient of variation was 0.11, which is branded as low variability of the data compiled. Additionally, the internal consistency of the data collected was calculated by means of the Cronbach’s alpha, which reached a value of 0.986 for the overall construct, which is labeled as an excellent value. Furthermore, this value represents a high correlation among dimensions, which was also confirmed through the values obtained for both the Pearson and the Spearman correlation coefficients.
In summary, the results obtained prove that it is possible to set up a seminar with an active learning approach in order to introduce the IoT paradigm to university students. This seminar was offered in five sessions, where each one was set up according to a combination of different learning dimensions, such as space (in-person or online), time (synchronous or asynchronous), language (Spanish or English), and classroom frameset (frontal, interactive, or hands-on).
The final goal of the seminar was to build up a prototype of an IoT system on a software application, which had to be undertaken in groups of five students. Eventually, each team had to carry out a pitch presentation about the prototypes they created, which, in turn, was evaluated by their colleagues on a peer review basis. This was performed by using a hand-crafted construct, which was previously validated by a panel of experts. The outcome obtained showed a high academic performance, which pointed out the quality of the designs proposed, as well as a high level of engagement, which was measured by a specific construct.
Those results encourage us to apply an analogous system to other university courses, as those kinds of active learning activities seem to motivate students to be more proactive in their learning processes. Additionally, future research may be geared to offer more content on hot topics in engineering, such as artificial intelligence or quantum computing. Furthermore, future research may also be devoted to obtain fully bilingual materials for coming seminars, as well as to substitute the frontal class sessions for interactive or hands-on sessions in order for students to be more participative.


