1. Introduction
Research in science has extensively explored human abilities, their development and their impact on performance [
1]. Gardner [
2], in his model of multiple intelligences, saw SA as one of the intelligences. According to his definition, SA is the ability to create a mental image of a spatial world and to imagine the motion of bodies or changes and processes occurring in them. This ability makes it possible to grasp the visual world accurately, change it and process it in the imagination.
Maier [
3] further refined Gardner’s multiple intelligences model and theory when he distinguished between five types of SA and intelligence:
Spatial perception is the horizontal and the vertical fixation of the direction regardless of disturbing information;
Visualization is the ability to describe situations when the components are pleasant to each other;
Mental rotation is the mental rotation of three-dimensional solids;
Spatial relations is the ability to identify the relations between the parts of a solid and
Spatial orientation is the ability to enter a given spatial state. Nowadays, the term spatial ability (SA) is commonly used, referring to spatial perception or visualization.
Buckley et al. [
4] explored the origins and evolution of SA in the broader context of human intelligence, aiming to provide a refined contemporary definition. One of its main discussions is the Cattell–Horn–Carroll (CHC) theory [
5,
6]. The CHC theory is currently recognized as the principal framework describing individual differences in the structure of human intelligence. As the CHC theory suggests a contemporary framework of cognitive factors, it is most appropriate to define SA based on its factor structure within this framework. The hierarchical structure contains one third-order factor, general intelligence (g), and 16 s-order factors representing the primary mental abilities. SA is represented as a second-order factor; however, it is referred to as the Gv factor or visual processing. While these two terms both describe the same factor, SA is its more commonly used name. The Gv factor is defined as the ability to leverage mental imagery to address problems [
6]. The CHC theory further breaks down SA into 11 first-order factors, which can be grouped into spatial skills, perceptual factors and memory factors. These first-order factors are described in
Table 1. Sorby [
7] offers a nuanced perspective, differentiating between innate spatial skills and learned spatial ability, a distinction that holds implications for educational strategies aiming to enhance SA.
Over the years, research shows SA to play a key role in the proper function of the environment in which we live and develop. Researchers and experts note that SA is not merely intuitive or genetically dictated, but is flexible and can be learned, acquired and improved [
8].
In another aspect, recent studies have shown the neurological basis of SA, exploring how different regions of the brain are activated during spatial tasks [
9,
10]. This neurological perspective provides a deeper understanding of why certain training methods might be more effective than others. Another dimension of SA research has been the exploration of gender differences. There is a growing body of research examining gender differences in spatial abilities, which is crucial for creating inclusive training programs [
11,
12].
The influence of digital technology on SA has also been a topic of interest. With the rise of digital technology, researchers have been examining how interaction with digital devices might be influencing our inherent spatial abilities [
13,
14] and even reduces gender differences in spatial cognition [
15]. Furthermore, with the immersive nature of virtual reality (VR) and augmented reality (AR), both are being explored as potent tools for enhancing spatial abilities, especially in educational settings. While VR provides a fully immersive environment, AR overlays digital information on the real world, offering a unique perspective that can be particularly beneficial for spatial tasks. Both technologies offer interactive experiences that can significantly aid in the understanding and manipulation of spatial constructs and improve learning immersion [
16,
17,
18].
The research on SA began from studying the relationship between SA and children’s mathematical achievements and capabilities. These studies have shown that SA plays a major role in mathematical thinking [
8,
19,
20]. Later studies have shown similar correlation in college students, showing SA to be among the cognitive factors that were identified as predictors of success in STEM fields [
20,
21]. Furthermore, large-scale studies show that SA can predict long term achievements in STEM, better than verbal and quantitative abilities [
22]. One of the common theories about the way this effect occurs explains that mathematical thinking is supported by spatial–mental representations [
23]. Thus, for example, some people create schematic representations of mathematical problems that include the spatial relationships described in the problems. Studies indicate that the solutions offered by these people are more correct on average [
24].
Recent research mentioned the significant role of SA in the field of architecture [
25]. Architects need good mathematical competence. It is essential for architects to possess strong mathematical skills, such as calculating the robustness of a structure or finding the optimal way of stabilizing a structure, and so on [
26]. Furthermore, the architectural design process involves multistep stages and processes of spatial adjustments, switching between perspectives and so on [
27]. Thus, the ability to visualize space is an integral skill in architecture [
25]. Having said that, there were no studies found to show similar correlations between better SA and success in architecture studies. Some recent studies have shown that architecture students, as engineering students, get better at SA after the first year of academic studies [
25]. Others found improved performance on SA tests among first-year students both in engineering and architecture after taking introductory engineering graphics course [
28,
29,
30,
31].
Although SA is a well-studied concept, there are but a few studies that have investigated the way training and improvement of the SA among students can enhance their performance in the field they have chosen. Maier, who introduced the five different types of SA, wrote the following: “The relevance of spatial ability leads to the following thesis as the approach for teaching: Based on psychological research findings, all five elements of spatial ability have to be specifically trained. The present conception of teaching space geometry does not come up to its cultural expectations.” [
3]. The same author further introduced a modular construction system based on the traditional system where polygons were joined with rubber bands. Maier used real models, because in his view those were the most successful in improving students SA [
3]. Although effective, this intervention is costly since it requires an expert teacher; it is also long and needs a lot of models if the students work individually [
32].
Later there have been some computer-based suggested training programs [
32,
33,
34] that seek to improve student’s spatial geometry ability and, according to the results, did so with success. Nevertheless, these interventions were mostly preliminary and limited in the kind of ability tested to improve geometry and in the number of subjects. Sorby [
7] reports on a study conducted among engineering students, and examined what develops their spatial imagery ability. It was found that in courses where students were required to draw models by hand (rather than using a computer) and work with tangible models (rather than models on a computer monitor), there was a development in their spatial performance. More recently there were attempts to use virtual reality (VR), augmented reality (AR) and mixed reality (MR) training programs to help improve student’s SA; they also yielded some success but were only tried on a few of the SA subtypes (mental rotation, spatial visualization and spatial orientation) and on a very small group of subjects [
35,
36].
The current study describes the efficiency of a new training program aimed to develop student’s SA. It was designed to be a short, interactive and experiential program that would incorporate both traditional and technology-based teaching methods and thus would attract and engage students and facilitate learning.
Research hypothesis:
Students who will attend the intervention program will significantly improve their SA scores compared to students who will not attend it;
Improvements in SA scores will be gained across different factors, including faculty affiliation, gender and previous mathematical abilities;
Exploratory analysis: will gender, math level or math grades affect the level of effectiveness of the intervention.
3. Results
3.1. Sample and Descriptive Statistics
Table 2 summarizes sample size across study groups, age and gender. This study’s sample consisted of participants from two academic disciplines: architecture and engineering, each divided into control and intervention groups. In total, the architecture discipline comprised 75 participants, with 33 (44%) in the control group and 42 (56%) in the intervention group. The engineering discipline included 79 participants, with 32 (41%) in the control group and 47 (59%) in the intervention group. The average ages of participants were 22.7 years (SD = 2.5) and 22.2 years (SD = 2.9) in the architecture control and intervention groups, respectively, and 22.9 years (SD = 2.3) and 23.7 years (SD = 2.4) in the engineering control and intervention groups, respectively. The age range extended from 18 to 30 years in architecture and 19 to 28 years in engineering, indicating a predominantly young adult cohort. Notably, the proportion of women in the groups varied significantly, with the architecture discipline showing a higher female representation at 83% in the control group and 76% in the intervention group, compared to 47% in the engineering control group and 45% in the intervention group.
Table 3 summarizes and reflects the math background of incoming undergraduates in architecture and engineering, divided into control and intervention groups, to evaluate their foundational math skills. In architecture, fewer students had high-level math (5 units) experience, with 9% in the control and 5% in the intervention groups, while in engineering, this was more common, with 19% in the control and 17% in the intervention groups. Medium-level math (4 units) was studied by 36% and 31% in the architecture groups and by a majority of 53% in both engineering groups, indicating stronger initial math level in engineering. Low-level math (3 units) was predominant in architecture, with 55% in the control and 64% in the intervention groups, versus 28% and 30% in engineering, respectively.
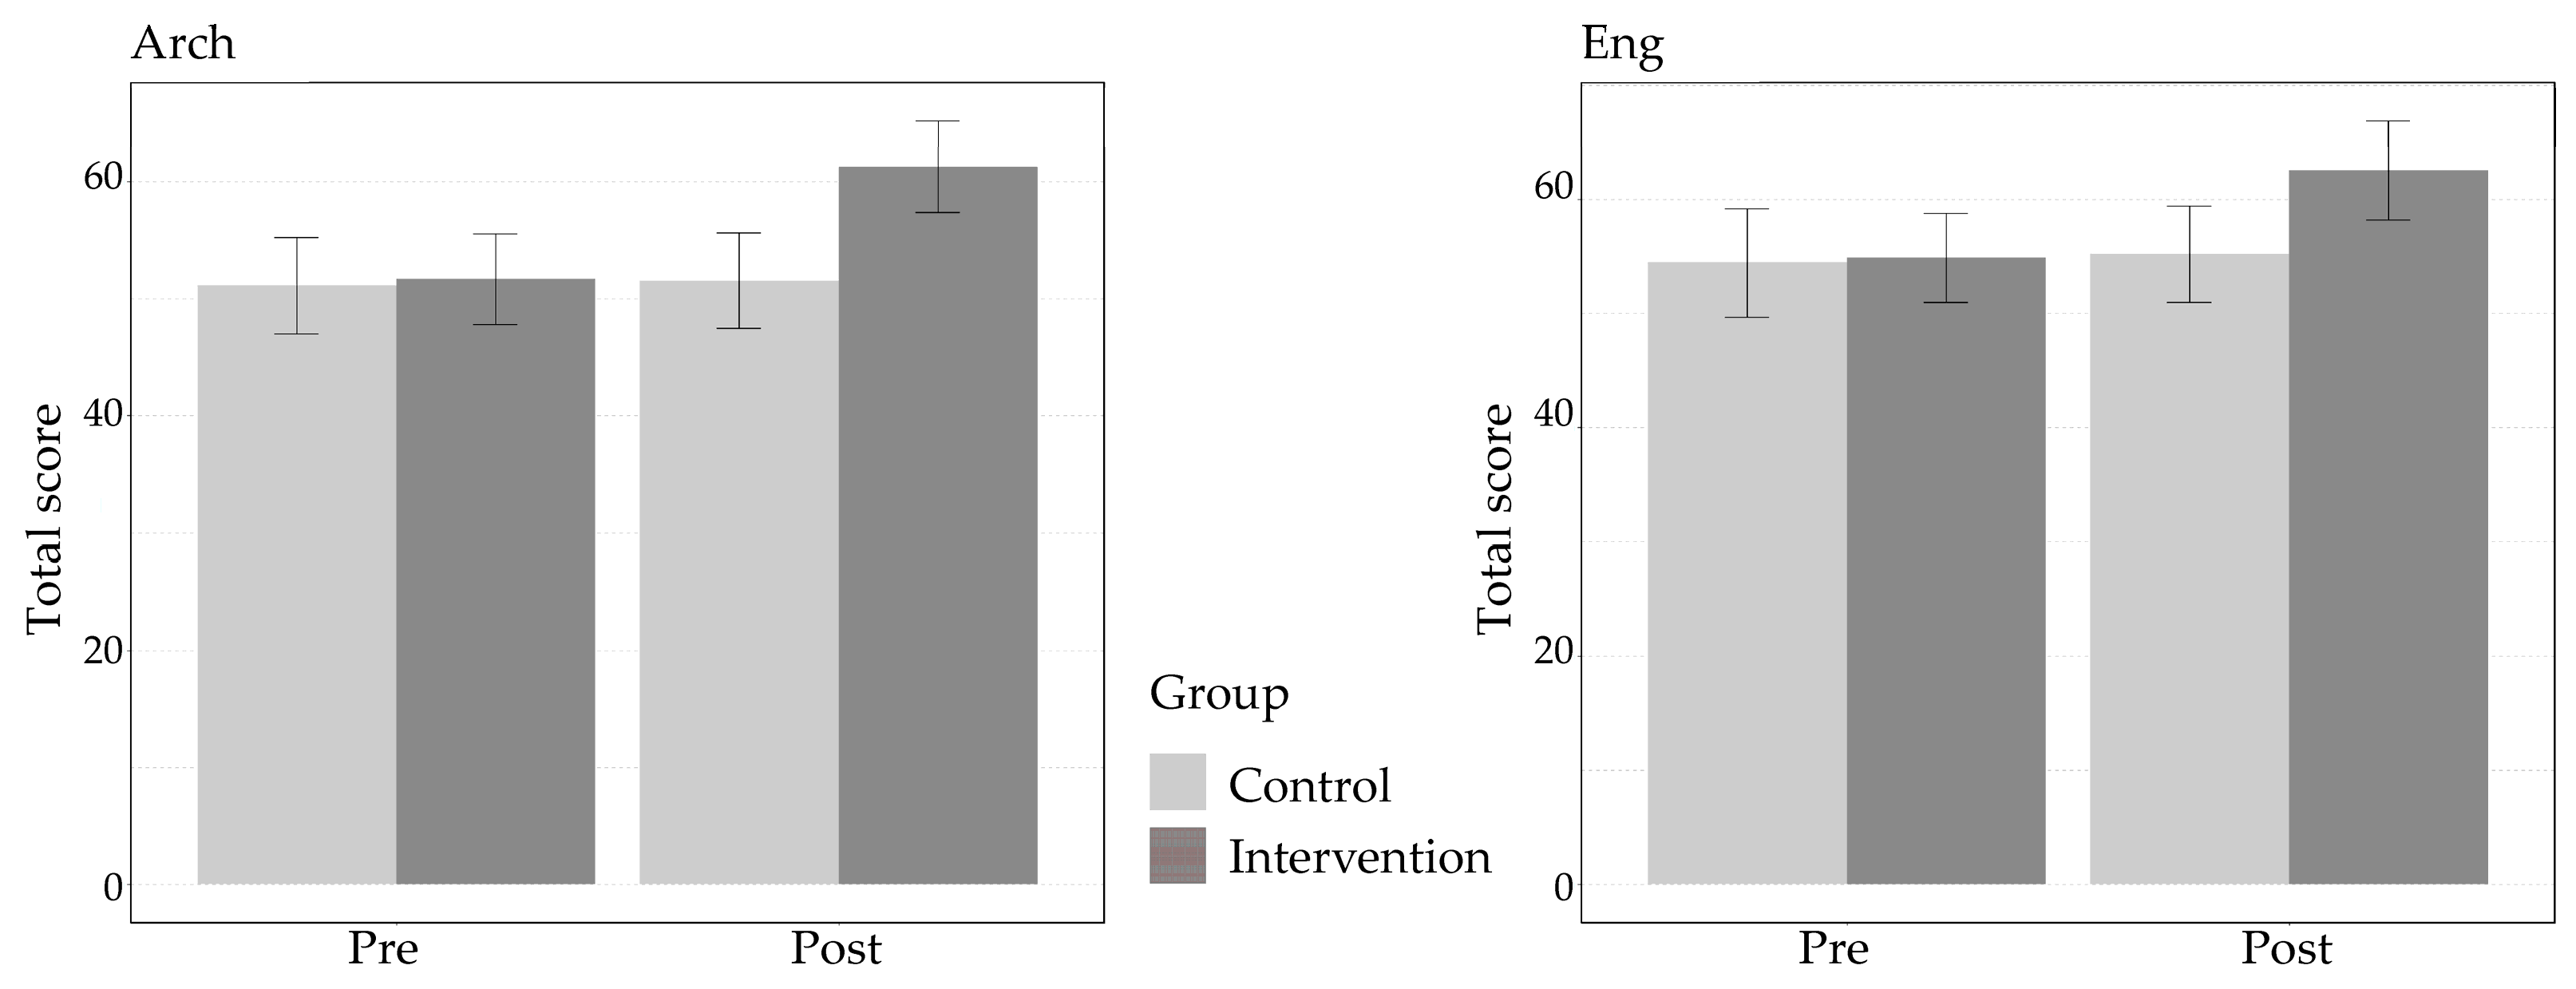
Table 4 presents descriptive statistics of the SA tests which were taken by the students before and after the intervention (i.e., dependent variable), employing subtests such as ULT, Packing-1, Packing-2, IPT, MCT and MRT.
In the architecture discipline, the control group’s ULT scores showed a slight decrease from pre- (Mean = 9.09, SD = 3.01) to postintervention (Mean = 8.79, SD = 2.93), while the intervention group demonstrated significant improvement, with scores rising from a preintervention mean of 9.29 (SD = 2.48) to a postintervention mean of 10.71 (SD = 2.41). The engineering discipline mirrored this positive trend, with the control group’s ULT scores marginally increasing from 9.94 (SD = 3.15) to 10.03 (SD = 2.78), and the intervention group’s scores improving from 9.96 (SD = 3.16) to 10.49 (SD = 3.12).
Packing tests further elucidated cognitive and spatial gains. For Packing-1, both control and intervention groups in architecture maintained or improved their scores slightly, with the intervention group notably advancing from a mean of 2.02 (SD = 1.09) to 2.50 (SD = 0.80). Engineering students also showed progress, especially in the intervention group, where scores increased from 1.96 (SD = 0.95) to 2.36 (SD = 0.94). Packing-2 results exhibited similar trends, with notable increases in the architecture intervention group from 1.88 (SD = 0.94) to 2.52 (SD = 0.92) and in the engineering intervention group from 2.11 (SD = 1.13) to 2.30 (SD = 1.10).
The IPT and MCT tests highlighted significant enhancements, particularly in the intervention groups. In architecture, IPT scores surged from 3.79 (SD = 1.85) preintervention to 4.90 (SD = 1.83) postintervention. Similarly, MCT scores in the same group improved from 3.60 (SD = 2.05) to 5.12 (SD = 2.09). Engineering students also exhibited growth in these areas, with IPT and MCT scores rising in the intervention group.
The MRT test showed substantial gains in the architecture intervention group, with mean scores escalating from 31.12 (SD = 7.65) to 35.52 (SD = 7.81). The engineering intervention group witnessed a remarkable increase from 32.83 (SD = 7.98) to 37.94 (SD = 8.72).
Overall, the total score, in line with the performance across tests, encapsulated the cumulative academic advancements. The architecture intervention group’s total score increased from a preintervention mean of 51.69 (SD = 12.48) to a postintervention mean of 61.29 (SD = 12.61). The engineering intervention group exhibited a similar trend, with the total score increasing from 54.91 (SD = 13.32) to 62.55 (SD = 14.86).
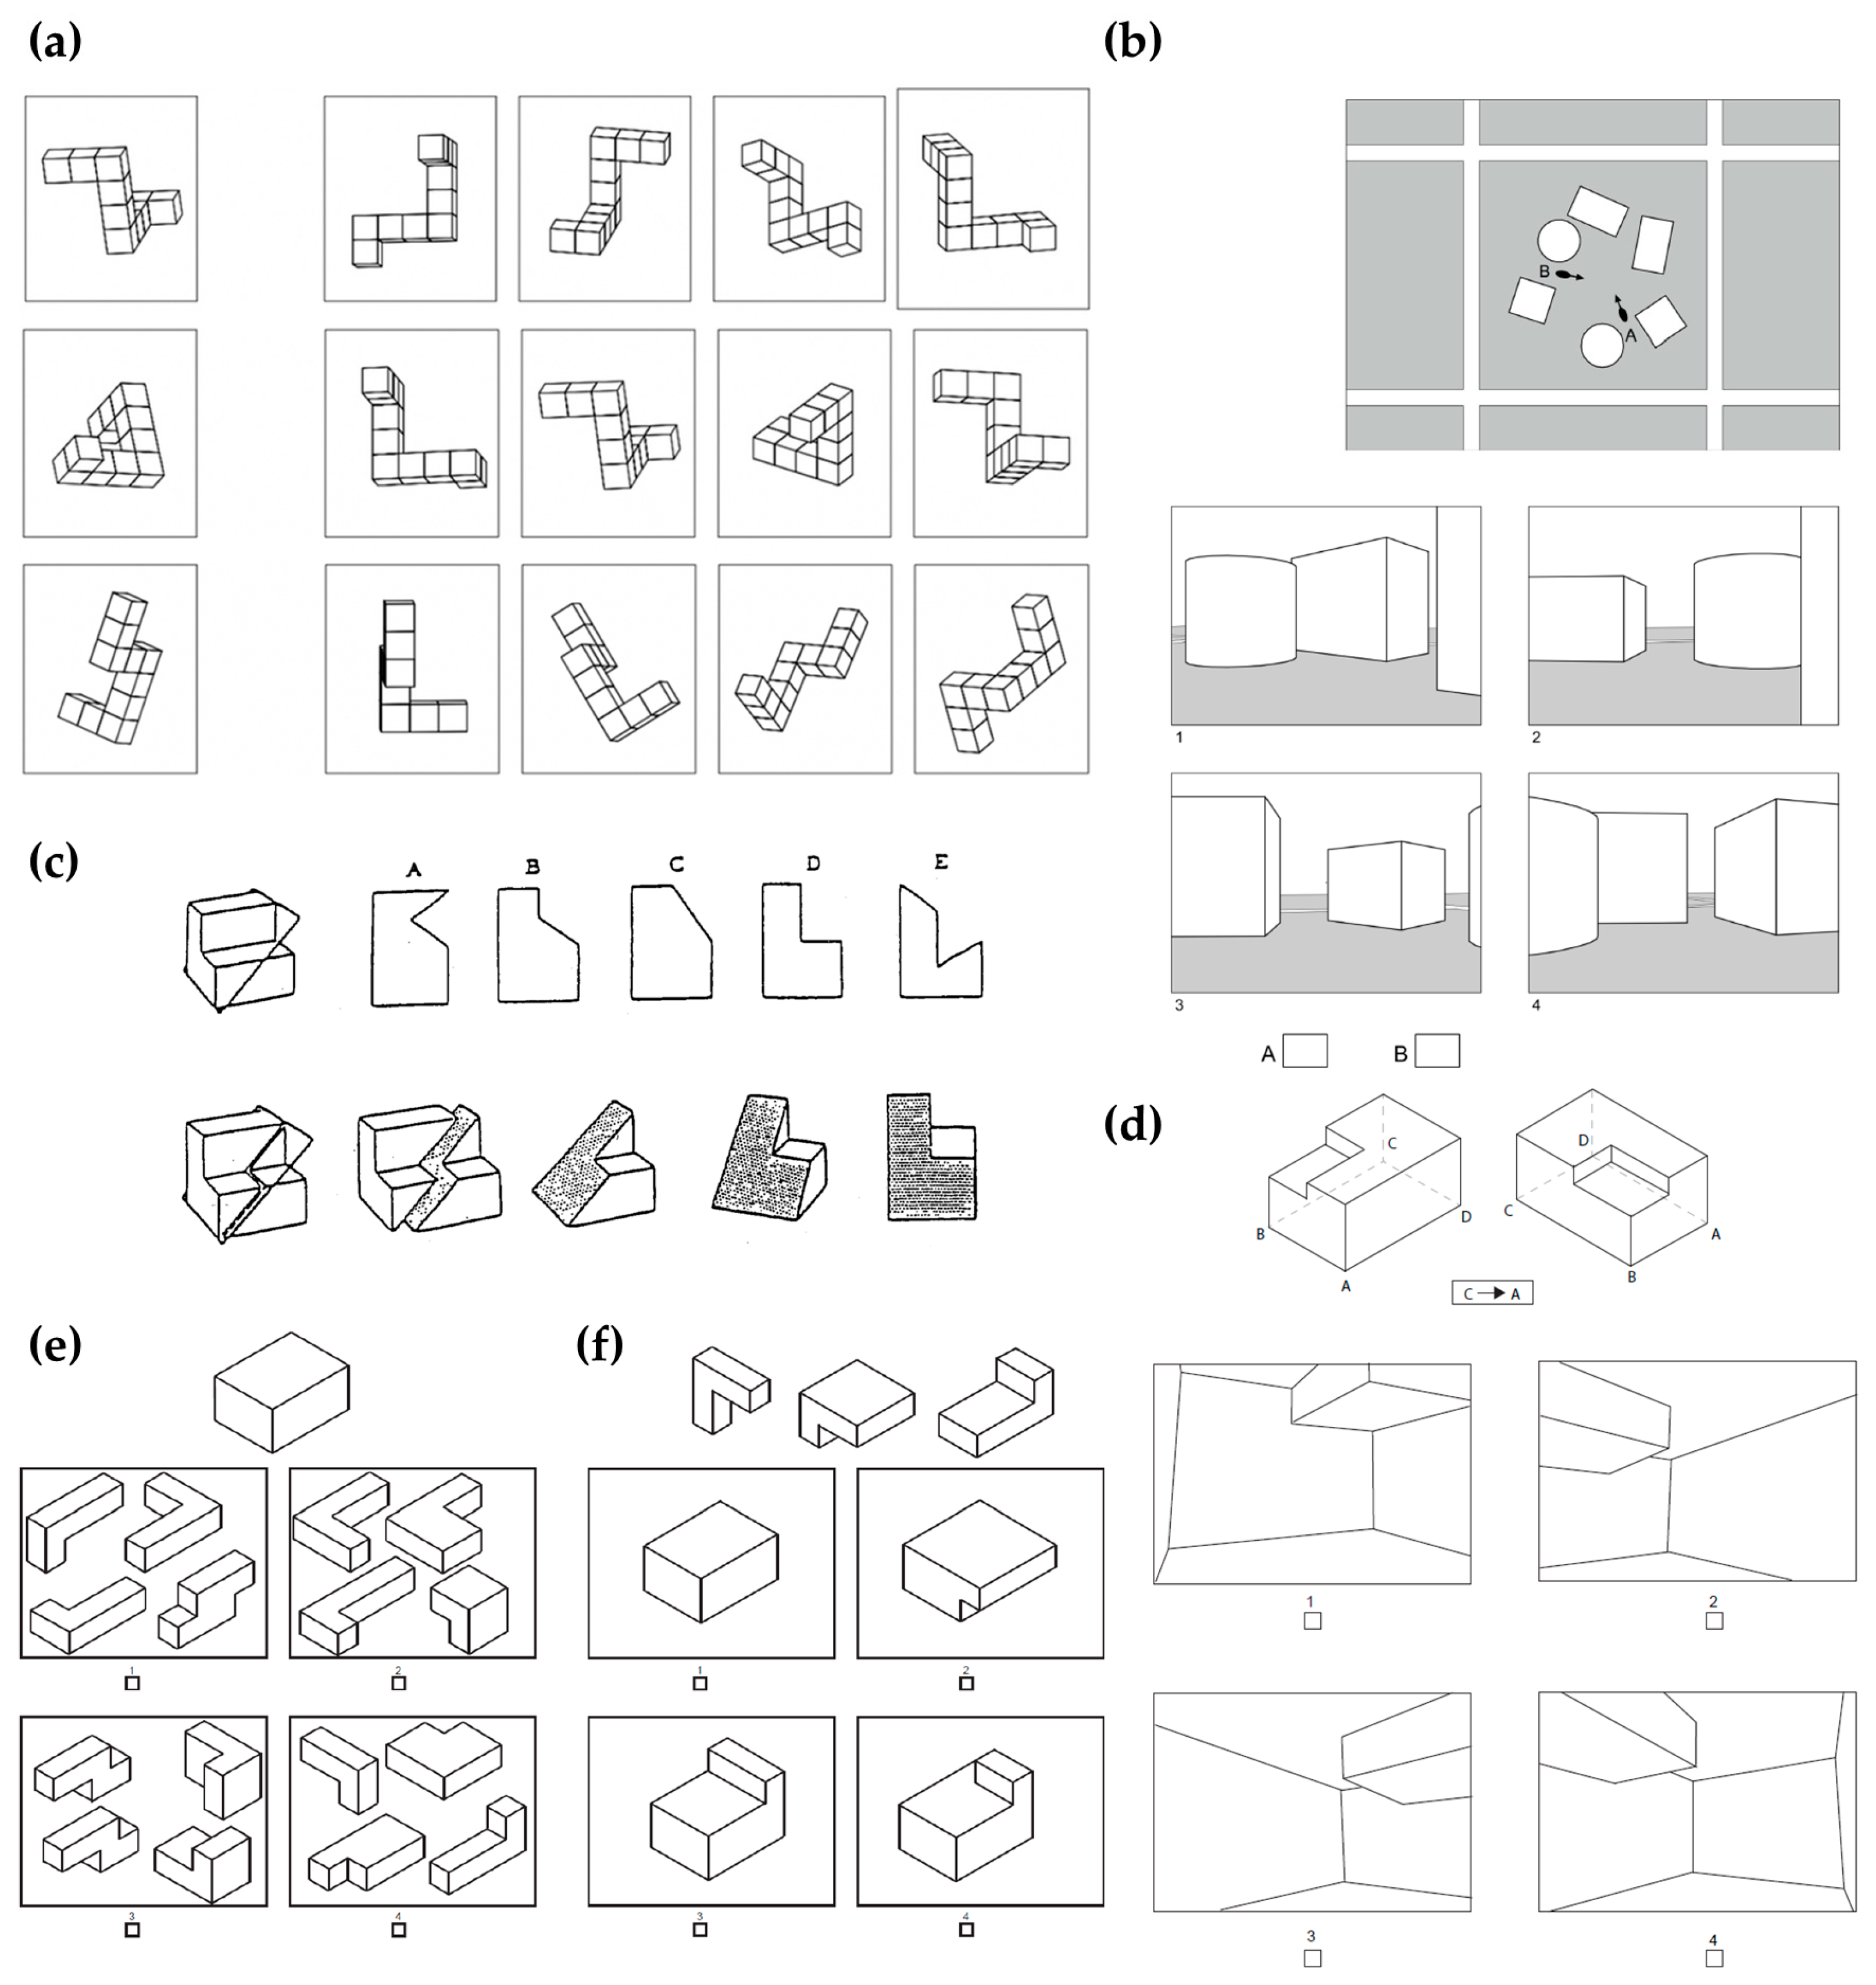
3.2. Intervention Effects
To assess the effect of intervention and compare pre–post group differences, we used an analysis of variance (ANOVA), with time (pre/post) as a within-subject factor and group (intervention/control) as a between-subject variable. Aggregated test scores (total score) served as the dependent variable. The model included two main effects and a time-by-group interaction. Results revealed significant effects for group (F(1,304) = 9.71,
p = 0.002) and time (F(1,304) = 12.6,
p < 0.001) and a significant time*group interaction (F(1,304) = 9.26,
p = 0.007). To ensure the results’ robustness, we conducted an analysis of co-variance (ANCOVA), which included the following covariates: age, sex, high school major (arts/humanities/sciences), level of high-school math and English studies, final high school scores in these subjects, academic field (architecture/engineering) and whether the student works or not. Results remained significant after accounting for covariates, with higher
p-values (all
p < 0.0025). Post hoc analyses revealed significant improvement from pre to post among the intervention group (t(88) = 10.7,
p < 0.0001, Cohen’s d = 1.14), while no significant improvement was observed in the control group (
p = 0.21). While no group differences were observed preintervention (
p = 0.76), the groups differed significantly postintervention (t(152) = 4.08,
p < 0.0001, Cohen’s d = 0.66) with the intervention group presenting higher scores (mean ± SD = 61.96 ± 13.78 vs. 53.35 ± 11.67). The results are shown in
Figure 2.
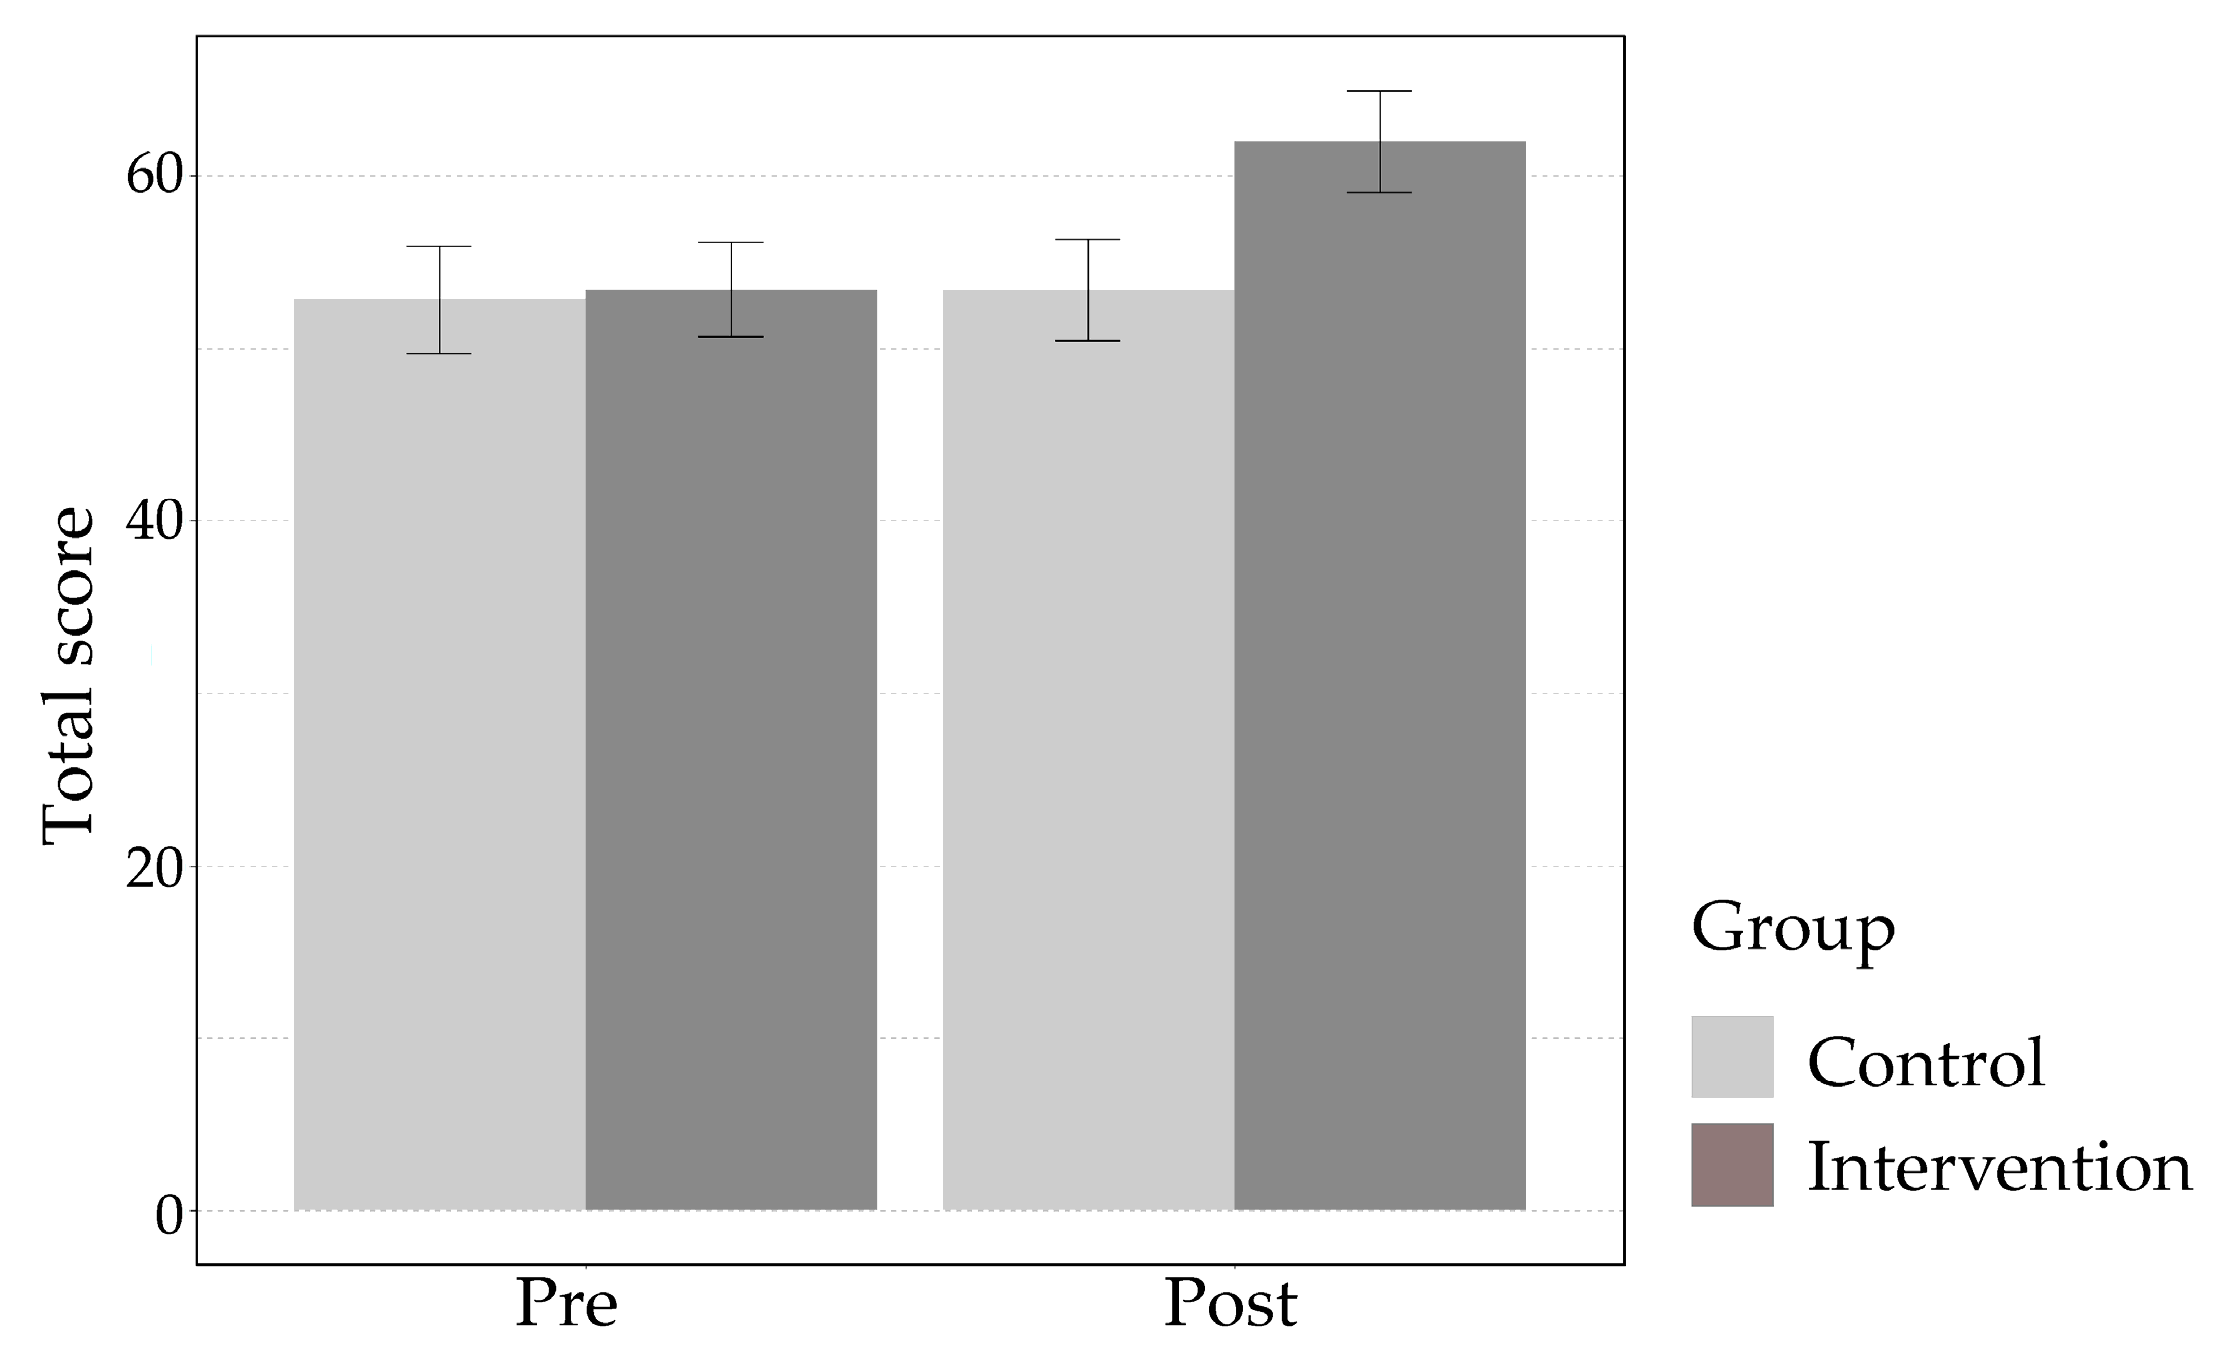
3.3. Intervention Effects among Architecture and Engineering Students
Next, we tested the intervention effects within the architecture and engineering student groups separately. Architecture and engineering students did not differ in SA scores at the pretest (mean score architecture: 51.4 + 12.0 and engineering: 54.7 + 13.2; t(152) = 1.62, p = 0.11, Cohen’s d = 0.26).
The architecture students group demonstrated similar effects as the primary analysis, with main effects for time (F(1,146) = 7.88, p = 0.006) and group (F(1,146) = 6.68, p = 0.011), and a significant time*group interaction (F(1,146) = 5.28, p = 0.022). Results held when accounting for multiple covariates in an ANCOVA. Similarly, the intervention group demonstrated significant improvement pre-to-post (t(41) = 8.04, p < 0.0001, Cohen’s d = 1.26), while the control group did not improve following intervention (p = 0.47).
Contrariwise, the engineering group only demonstrated a significant effect for group (F(1,154) = 5.12,
p = 0.025) with only a marginal time effect (
p = 0.08) and a nonsignificant effect for the time*group interaction (
p = 0.12). Noteworthy is that testing the groups separately revealed similar patterns with significant improvement for the intervention group (t(46) = 7.08,
p < 0.0001, Cohen’s d = 1.04) and no effect for the control group (
p = 0.32). While these hypothesis-supporting effects did not translate into significant interactions in the ANOVA, possibly due to lack of statistical power, ANCOVA revealed a significant time*group interaction (F(1,137) = 4.41,
p = 0.038), implying significant time-by-group differences while accounting for multiple covariates (
Figure 3).
3.4. Intervention Effects on Subtests
Next, we tested whether time*group interactions existed in subtests using a similar statistical approach, with subtests scores as the dependent variable in each analysis. Results were controlled for multiple comparisons with Bonferroni correction. While descriptive measures showed anticipated patterns for all subtests, the only significant interaction was observed for the Mental Rotations Test (F(1,304) = 8.57, adjusted
p = 0.022). The groups’ performance on subtests is depicted in
Figure 4.
3.5. Exploratory Analysis
Our final analyses were of an exploratory nature, aiming to assess whether sex and math levels affected total score and whether these groups react differently to the intervention.
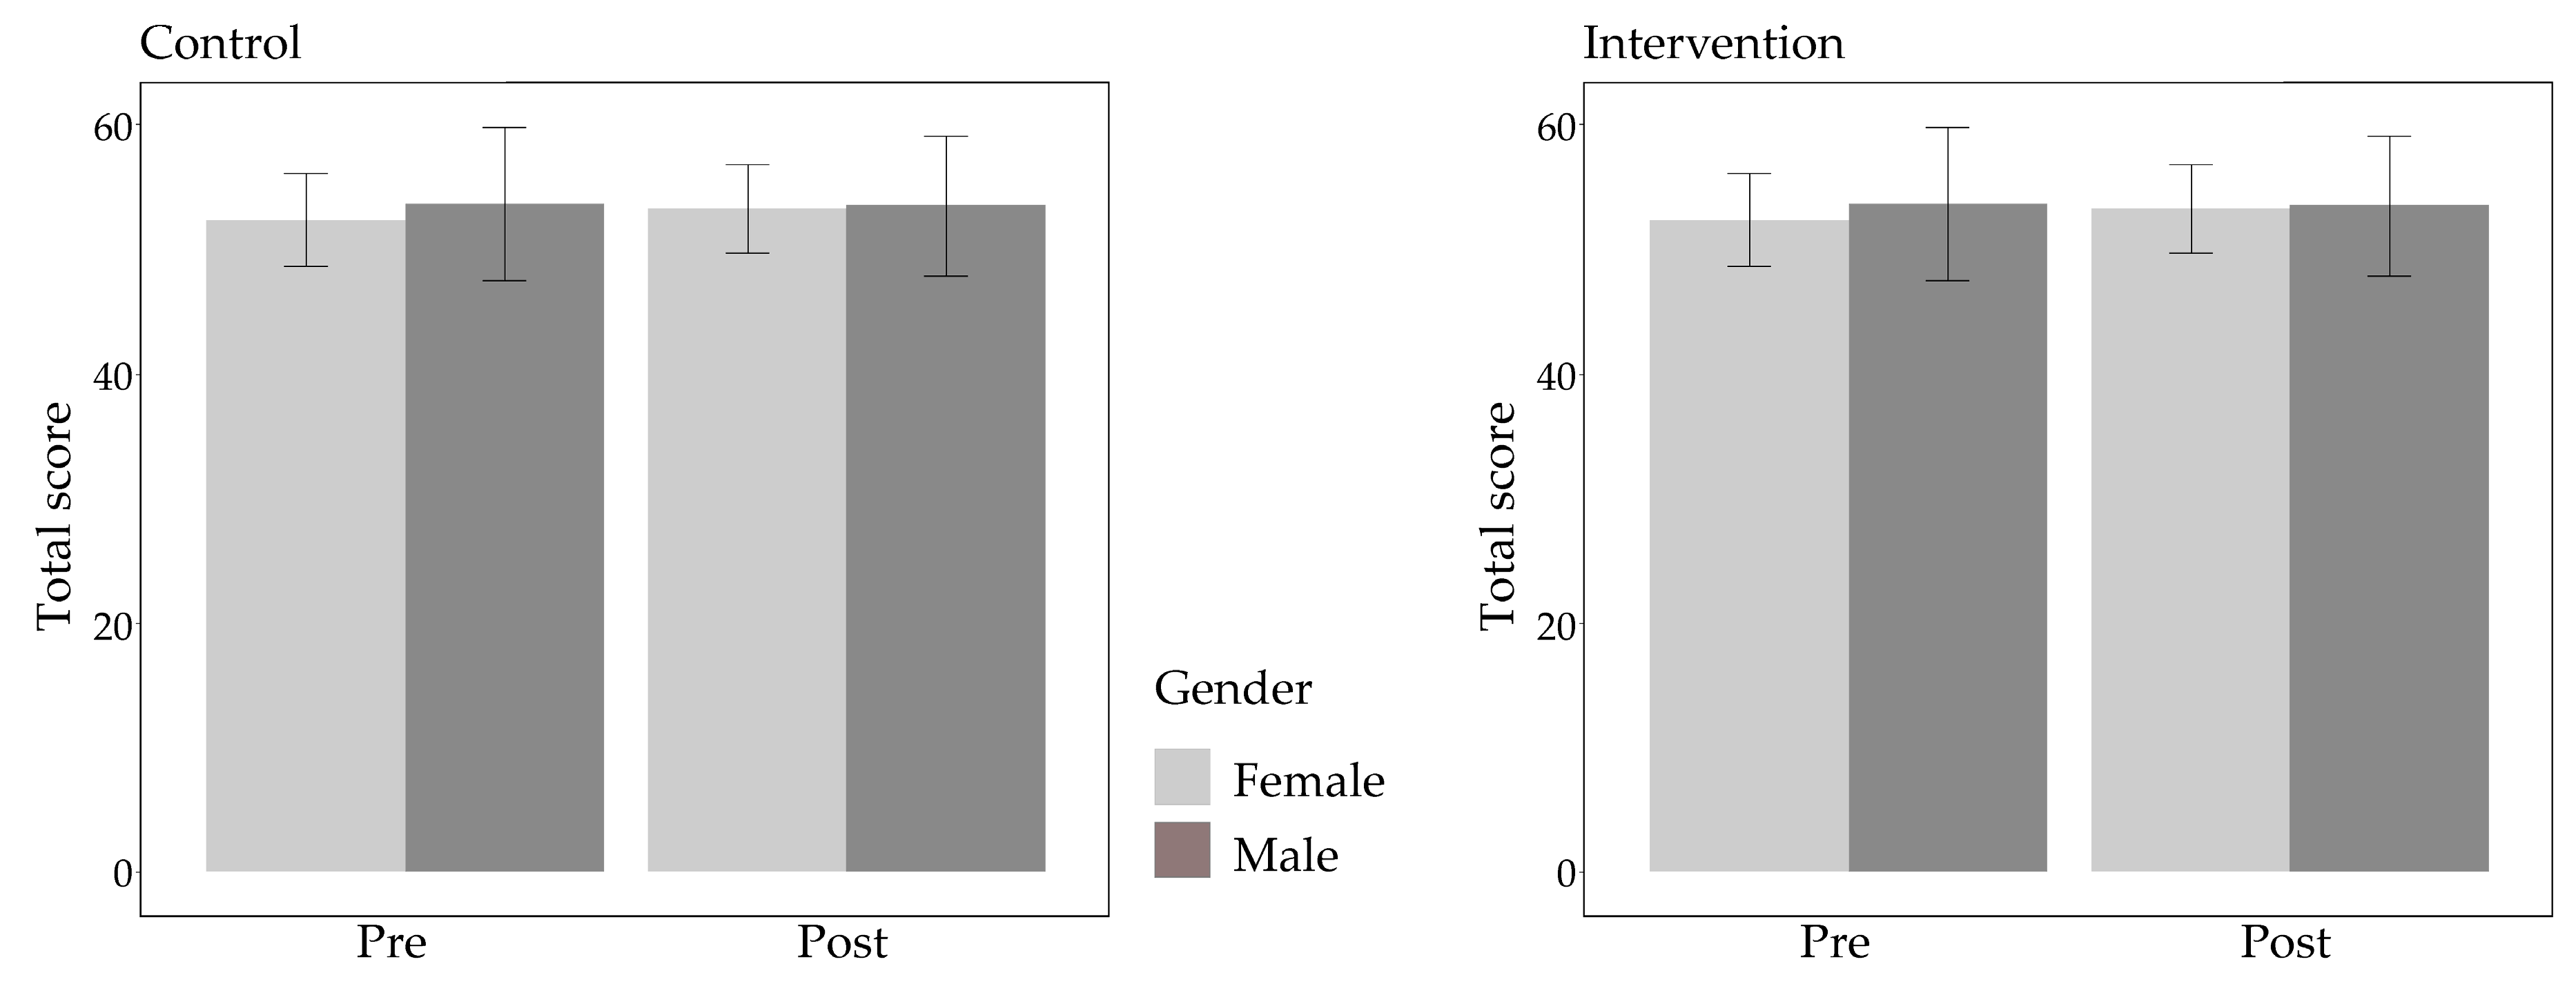
We conducted a t-test and ANOVA to compare males and females on total score. T-test revealed significant group differences (t(306) = 2.91,
p = 0.004, Cohen’s d = 0.33), showing that males scored significantly higher than females (mean ± sd = 58.62 ± 14.27 for males vs. 54.07 ± 12.58 for females). However, nonsignificant time*group*sex interaction in ANOVA implied that both groups responded similarly to the intervention (
Figure 5).
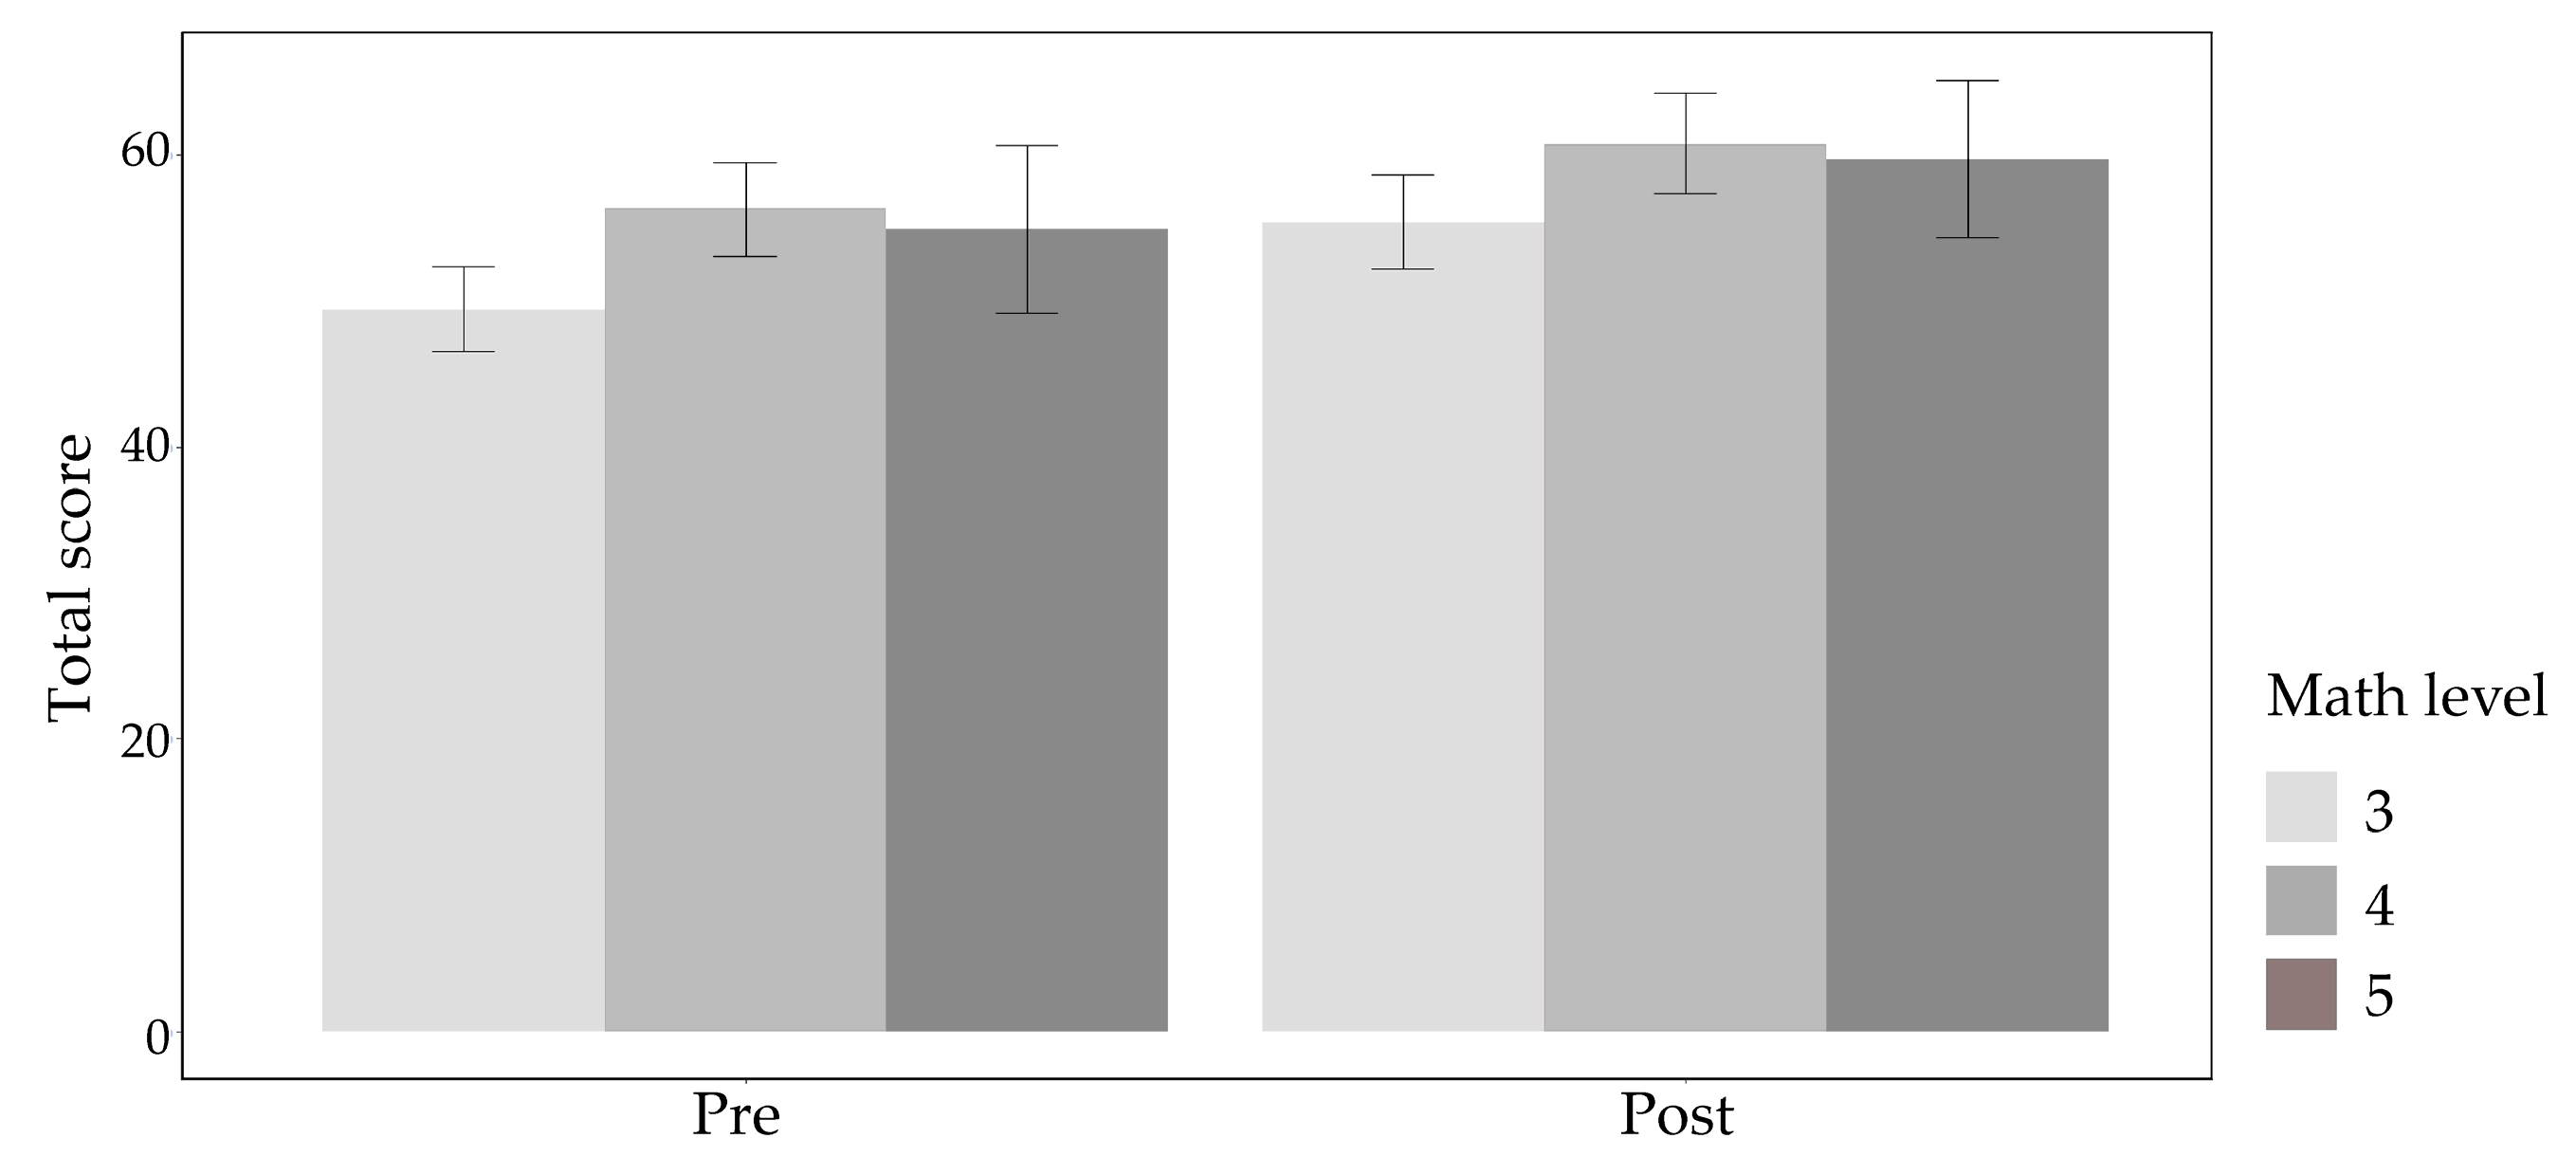
Finally, we conducted an ANOVA to test if math level affected total score. We conducted a similar analysis to the main one and added two additional independent variables: math level in high school final exams (either 3, 4 or 5 units of study, corresponding to the basic, intermediate and advanced levels of study appearing in the Israeli high-school diploma) and math scores in high school final exams (stratified to the following groups: 60–70, 71–80, 81–90 and 91–100, where 100 is the maximal score). We also included all possible interaction terms. Math level was significantly associated with total score (F(1,274) = 11.6,
p = 0.0008), while only marginally significant effects emerged for math scores (
p = 0.059) and math level by math score’s interaction (
p = 0.053). A marginally significant effect also emerged for a quadruple time*group*math level*math scores interaction (
p = 0.07). A post hoc analysis showed that students with low 3-unit level of math studies scored significantly lower on the test than students who had a 4-unit level math education (t(266) = 3.76,
p = 0.0002, Cohen’s d = 0.46) and students with a 5-unit level math education (t(172) = 2.11,
p = 0.036, Cohen’s d = 0.32). No significant differences were noted between students with 4- and 5-unit levels of math education (
p = 0.62). Results are depicted in
Figure 6.
4. Discussion
4.1. Effectiveness of the Intervention Program
The results of this study provide strong evidence supporting the effectiveness of the intervention program in enhancing SA among architecture and engineering students. Students who completed the intervention demonstrated substantial enhancements in their SA abilities compared to those who did not take the course.
The intervention program employed a range of teaching methods, including lectures, hands-on activities and interactive exercises, using 3D and VR, which allowed students to actively engage with spatial concepts and develop their skills. The concise, focused and innovative nature of the program ensured that students received targeted and effective instruction in spatial reasoning, enabling them to apply their newfound knowledge and skills to real-world architectural and engineering tasks. The cost-efficiency of the program made it accessible to a wide range of students, irrespective of their background. By offering a diverse set of teaching methods, the program catered to the varied learning styles and preferences of the students, ensuring maximum engagement and knowledge retention.
Overall, the intervention program successfully fulfilled its objectives of improving SA in architecture and engineering students.
4.2. Consistency across Different Factors
An important aspect of this study was the examination of the consistency of improvements in SA across different factors, including faculty affiliation, gender and previous mathematical abilities. The intervention program proved to be effective regardless of the participants’ background, indicating its potential applicability to a diverse student population. Architecture and engineering students, despite their different educational paths and curriculum content, both demonstrated significant improvements in SA. This suggests that the intervention program’s benefits extend beyond specific disciplines and can be adapted to various academic contexts.
The consistency of improvements across different factors indicates that the program targets foundational spatial reasoning skills that are crucial for success in architecture and engineering fields. However, it is worth noting that architecture students displayed more significant improvements in SA compared to their engineering counterparts. The reasons behind this discrepancy could be attributed to various factors, such as variations in teaching methods, curriculum content or the nature of spatial tasks encountered in each discipline. Architecture programs often emphasize design thinking and spatial visualization skills more explicitly, which could contribute to the observed differences. Furthermore, the limited statistical power of the current study suggests the need for future research with a larger sample size to provide a more comprehensive understanding of these differences and explore potential factors contributing to the varying improvements between architecture and engineering students.
4.3. Gender Differences in SA
Consistent with previous research conducted by Levine et al. [
42], significant differences in SA abilities were found between male and female participants, with males generally outperforming females. These gender differences in SA have been observed across various age groups and educational settings. However, despite these gender differences, no significant interaction effects were observed among time, group (intervention vs. control) and gender in the present study. This suggests that the intervention program equally benefited both male and female students in improving their SA abilities, potentially contributing to the reduction of gender-based disparities in spatial cognition.
The findings indicate that targeted spatial intervention programs can provide a level playing field for both genders, empowering female students to develop their SA and bridge the existing gap. By addressing gender disparities in spatial cognition, the intervention program has the potential to enhance diversity and inclusivity in architecture and engineering fields. Educators and institutions can use these findings to design interventions that support female students in developing their spatial skills and create a more equitable learning environment.
4.4. Relationship between Math Level and SA Scores
This study also investigated the relationship between SA scores and math level (based on the mathematics matriculation exam in Israel, commonly known as the math Bagrut exam. The math Bagrut is the official certificate awarded to Israeli high school students who successfully complete their secondary education).
The results revealed a significant association between math level and total SA scores, indicating that students with a higher level of math education (4-unit level) during high school achieved higher SA scores compared to those with a lower level of math education (3-unit level). Mathematics and SA are closely intertwined, and proficiency in mathematics may correlate with spatial thinking and problem-solving skills. Therefore, incorporating spatial training alongside mathematics education could enhance students’ overall cognitive abilities in disciplines that heavily rely on spatial skills. This highlights the importance of integrating spatial reasoning tasks into mathematics curricula and providing opportunities for students to apply mathematical concepts in spatial contexts. By recognizing the synergistic relationship between mathematics and SA, educators can optimize the development of students’ cognitive skills in architecture and engineering.
4.5. Implications for Educational Practice
The findings of this study have significant implications for educational practice in architecture and engineering disciplines. The effectiveness of the intervention program in enhancing SA abilities among students highlights the importance of implementing targeted interventions to promote cognitive skill development.
Institutions can incorporate similar intervention programs into their curriculum to enhance SA among their students, fostering their problem-solving, design and visualization skills.
The program’s success across different demographic groups, including both male and female students, as well as individuals with varying mathematical backgrounds, highlights its inclusive nature. Institutions can leverage these findings to create a supportive and inclusive learning environment that values diversity and promotes equal opportunities for all students.
Additionally, the results call for a more integrated approach to curriculum design that recognizes the interplay between SA and mathematical proficiency. By incorporating spatial training alongside mathematics education, institutions can enhance students’ overall cognitive abilities and prepare them for the spatial demands of architecture and engineering disciplines.
4.6. Future Directions
The findings of this study open avenues for future research in the field of SA and education. Future research endeavors with larger sample sizes will enable a more comprehensive exploration of the factors contributing to the observed differential improvements between architecture and engineering students. Further investigation into the specific teaching methods, curriculum content and spatial tasks encountered in each discipline can provide insights into the factors influencing the varying improvements. Longitudinal studies assessing the long-term effects of the intervention program can shed light on the sustainability and durability of the acquired SA. Additionally, exploring the adaptability of the intervention program to diverse educational contexts and subgroups within the architecture and engineering student populations will yield valuable insights for the development of tailored interventions. Understanding the long-term effects and adaptability of the intervention program will guide the refinement and optimization of educational interventions targeting SA.
The discussion surrounding future directions regarding the expected correlation between SA scores in SA tests and students’ academic achievements is of great significance in educational research and should be the next study’s focus. This future study aims to uncover the potential relationship between students’ SA skills, as measured by the SA test, and their overall academic performance. Exploring this correlation can provide valuable insights into the role of SA competencies in students’ educational outcomes and pave the way for targeted interventions and support systems.
Another crucial future direction lies in examining the generalizability of the correlation between SA scores and academic achievements across diverse student populations and cultural contexts. It is essential to explore potential variations in this correlation among different demographics, including age groups, socioeconomic backgrounds, and cultural contexts. Such analysis ensures that interventions and educational practices are tailored to meet the unique needs and challenges of specific student groups. By acknowledging the diversity of students’ backgrounds and experiences, researchers and educators can develop more inclusive and effective strategies to support students’ social–emotional growth and academic success.


