Article

Persistence of Conceptual Errors in First-Year University Physics Course and Its Possible Relationship with Learning Styles

Grupo de Innovación Educativa “Física Interactiva” and Grupo de Sistemas Complejos, E. T. S. Ingeniería Agronómica, Alimentaria y de Biosistemas, Universidad Politécnica de Madrid, 28040 Madrid, Spain
*
Author to whom correspondence should be addressed.
Educ. Sci. 2024, 14(4), 401; https://doi.org/10.3390/educsci14040401
Submission received: 14 December 2023 / Revised: 4 April 2024 / Accepted: 9 April 2024 / Published: 11 April 2024
(This article belongs to the Section STEM Education)

Abstract

:
In this work, we study the persistence of some fundamental previous ideas in physics in a group of freshmen at the Universidad Politécnica de Madrid (Spain). For this purpose, we analyze the answers to a questionnaire consisted of 24 multiple-choice items, most of them borrowed from the Force Concept Inventory (FCI). Our study is performed in two different ways by using, on the one hand, classical test theory and, on the other hand, the Pearson product–moment correlation. The survivance of some of the previous ideas at the end of the course is assessed by comparing and critically analyzing the answers of the students to the same test at the beginning and the end of the term. A possible connection with Honey–Alonso learning styles (LS) is also discussed. The results yielded by our study demonstrate the persistence of some of the initial and previous ideas, no matter the students’ previous qualifications or their current LS.

1. Introduction

Among the multiple different implications of any learning process [1], a change in the student’s mind is the most remarkable one. Sometimes, the learning process is successfully accomplished as students easily acquire the new knowledge or aptitudes within some particular field. However, in most cases, the adequate incorporation of new ideas usually involves several factors, such as modifying the already existing mental structures of the students [2]. These structures have been built up over the years and, as a consequence, can be extremely robust against any external input. Sometimes, the mental frames lie in previous ideas, usually known as “preconceptions” for short, which can well compromise the whole learning process [3].
Previous ideas related to physics phenomena emerge because of the necessity for human beings to explain the physical phenomena that take place around them. Although these explanations may fit our daily lives and appear to comply with the laws of Nature at first glance, most of them dramatically fail when tested using scientific methods [4,5,6].
Preconceptions are universal in the sense that they are and have been present in all cultures over history [7,8,9,10]. That is the case, for example, in Aristotelian thinking, which still has an influence on our current societies. As preconceptions are formed over several years, they have a deep impact on the human mind, a fact that makes them difficult to remove. Actually, they can survive different educational levels and remain present among adults, in many cases, even among postgraduates.
Preconceptions are generated due to the person’s own experience [11]. As a consequence, they are usually related to changing situations, which attract more attention than static scenarios [6]. There is usually a direct connection between causes and effects. Common previous ideas include the belief that an object in static equilibrium is not subjected to any force [12] and the preconception that heavy objects fall down faster than lighter ones, which is certainly wrong (at least in a vacuum) [13]. Some of the previous ideas persist even after students graduate because of the absence of any critical analysis using the scientific method [14].
In this work, we analyze the presence and persistence of preconceptions in a group of first-year university students enrolled in a physics course for the Agroenvironmental Engineering Degree at the Universidad Politécnica de Madrid (Spain). For this purpose, a questionnaire is completed by the students at the beginning and at the end of the term. This test contains 24 items related to different preconceptions on topics studied during the course. Most of the items have been borrowed from the seminal FCI [15], but others have been specifically created in order to focus on the concepts taught during the physics course. Moreover, the possible connection between previous ideas and the Honey–Alonso LS are also discussed.

2. Literature Review of Previous Ideas and Learning Styles

The literature on preconceptions and conceptual errors is very extensive [16,17,18], but there is no final conclusion on their emergence, on their identification or the way they can be removed. One probable reason to explain their appearance is the connection between the learning process and the students’ previous experiences [11]. Likewise, the cultural environment also has a strong influence on the development of preconceptions. Common language, technical vocabulary, and the media also contribute to the appearance of preconceptions [19].
In this sense, heat is a prominent example of a preconception that is not typically well described in textbooks: it is quite common to find textbooks entitled “Heat transfer”, but this particular nomination is quite redundant as heat is already transferred (thermal) energy so that “Heat transfer” actually means “Transfer of transferred thermal energy”.
McDaniel et al. have shown that interactive engagement courses can improve conceptual learning compared to traditional lecture-based courses [20]. However, conceptual-oriented and more active learning processes do not always imply better performance when students must solve qualitative problems [16].
Achieving meaningful learning depends on the correct interconnection between the newly incorporated concepts and those previously assimilated, and consequently, the importance of previous ideas must always be taken into account. From the point of view of the constructivist model, students learn significantly if the newly assimilated concepts have a place on the already established ones, fitting them like the bricks of a wall when successively placed on top of each other. Therefore, the previous knowledge the student has and his learning process are of vital importance [21,22]. Following Picquart [23], we can affirm that the work on didactic research that has been carried out over the last 40 years [24,25,26,27] reveals that traditional education, in which the teacher gives master classes and the students receive new knowledge as if they were the empty pages of a book that is being written, presents several limitations. Students, unlike professional scientists, generally understand physics as a set of independent ideas rather than as a coherent and related discipline. In traditional teaching, students study and learn, but no attention is usually paid to the influence of their previous ideas or to their possible modifications during the learning process. The absence of such studies can be quite disappointing for teachers, as they may notice that some of their students’ previous ideas are still present at the end of the course [7,8,9,10].
The quick and correct identification of previous ideas is essential when applying the most appropriate teaching methodologies that may facilitate the teaching–learning process [28,29,30]. Several different tools have been developed for this purpose. The individual interview, in which the student has to answer fairly open questions on certain topics, is one of the most successful [11]. Its main drawback is the amount of time it requires, especially in large groups of students. In that case, questionnaires are more appropriate as they greatly simplify the analysis of the student’s answers [31].
One of the main advantages of questionnaires is that they drastically reduce the amount of time needed to identify the existence of preconceptions since they allow the atomic analysis of students’ answers. There are several types of questionnaires: multiple choice, open, true–false, etc. Some questionnaires have been specifically created for the identification of their previous ideas. This is the case of the FCI introduced by Hestenes and collaborators in 1992 [15], which was developed to identify the conceptual errors that students present in understanding the concept of force and Newton’s laws.
Since its inception, the FCI has been applied in several studies. In fact, it is probably still the most widespread test nowadays for identifying a student’s comprehension of Newtonian mechanics. Some studies based on the FCI have been carried out with a very large number of students, such as the seminal works carried out by Hestenes and Halloun [32], which involved 10,000 students and 100 teachers, by Hake [33], related to 6500 students, and by Henderson [34], which considered a sample of almost 2200 students. More recently, we can mention the work focused on evaluating to which extent teachers were able to identify alternative conceptions related to force and movement in students of introductory physics [35]. Also noticeable are the works of Scott and Schumayer [27], who compiled data from 2109 students during the period 2008–2010, and the work of Artamonova and collaborators [36], which compiles studies carried out by the FCI in Latin America and in the United States.
Covián and Celemín [18] applied a Spanish version of the FCI to more than 1300 students. After 10 years of studies, they came to the following main conclusions:
  • The conventional learning process cannot eliminate some prior (erroneous) ideas, as some of them persist even after students have graduated.
  • Compared to American students, although Spanish university students have a better understanding of the concept of force, American students present a better performance in the FCI at the end of their studies.
In addition to preconceptions, another relevant factor in the teaching–learning process is the LS of the students, as assessed by, e.g., Abdelhadi et al. [37] and Kolb [38], among others. Kolb [38] posits that LS encompass how individuals perceive and process acquired knowledge. Alonso, Gallego, and Honey [39] and Estrada García [40] emphasize that LS represent the process by which abilities are gained and integrated. Smith [41] defines LS as the characteristic ways that individuals processing information feel and behave within specific learning environments. They are also considered personal variables, bridging intelligence and personality and influencing how students approach the learning process [42]. Furthermore, LS encompass cognitive, affective, and physiological aspects, serving as stable indicators of how students perceive, react, and respond to learning environments [43]. Finally, Honey and Mumford [44] describe LS as attitudes and behaviors determining an individual’s primary learning method. All these definitions converge on the notion that LS are integral to how students engage with the learning process.
While some studies indicate that there is a direct relationship between academic performance and LS [40,45], other studies do not seem to support that connection [46]. Following Kolb [38] and Lindsey [47], we consider that LS should not be regarded as fixed labels but as evolutionary characteristics of the students that may change over time. Within this reasoning, the different LS give information on the tendency toward certain ways of learning, something that is always useful to let the students reflect on their own learning. Likewise, it has been shown the usefulness of the knowledge of the LS of students with disabilities in order to facilitate their teaching–learning process [48].
Several models of LS have emerged over time, each addressing different dimensions or aspects of learning [49,50,51], meticulously discussed by Pantoja Ospina et al. [52]. Some models, like Charles Owen’s model [53,54], focus on knowledge creation. Others, such as the model introduced by A. F. Grasha and S. W. Riechman [55], emphasize interpersonal interaction. Alternatively, LS models like those proposed by N. Ramanaiah et al. [56], V. J. Marsick and K. E. Watkins [57], and N. J. Entwistle [58] are rooted in learning strategies. Brain bilaterality, personality traits, and organizational learning have also been subjects of study in relation to LS [59,60,61,62,63].
However, the most prevalent LS models focus on perception channels and learning experiences. Notably, the Dunn and Dunn model [64] places importance on perception channels, which are particularly influential in the United States. The VARK (visual, aural, read/write, and kinesthetic) model of N. D. Fleming [65,66] is among the most popular. Finally, models like those developed by Honey and Mumford [44] and Alonso et al. [36] also belong to this category.

3. Objectives and Research Questions

The objectives and the research questions of this work are as follows:
  • Unraveling the existence of previous ideas among a group of freshmen university students.
  • Analyze the persistence of the previously considered ideas at the end of the physics course.
  • Check if the presence of previous ideas is larger among students with a lower university access qualification than among those with a better performance.
  • Study possible relations between previous ideas and the Honey–Alonso learning styles.

4. Methodology

In this section, the tools used to unravel the presence and persistence of previous ideas and their connection to the LS are reported. For this purpose, we first describe the characteristics of the test that has been created to identify the presence of preconceptions. We also report in detail on the relationship between the different questions and the preconceptions and misconceptions in physics. Then, we present the indicators that have been considered in the test validation and analysis. Finally, we conclude by briefly summarizing some of the characteristics of the Honey–Alonso questionnaire that has been used in the LS study.

4.1. Physics Test to Identify Preconceptions

Based on the aforementioned studies, we have developed a test (see Supplementary Materials) to study the presence of previous ideas among first-year students. The test consists of 33 questions. The first nine questions are included in order to find out the general characteristics of the students, such as their age, gender, or university entrance qualification. To maintain anonymity and avoid potential biases in the students’ responses, their names are not requested.
The second part of the test consists of 24 multiple-choice questions covering various concepts from the introductory physics course (Physics I), including velocity, acceleration, and inertia. Most of the items have been borrowed from the FCI [15], a well-established questionnaire for the identification of preconceptions in Mechanics. However, 10 of the items have been specifically designed according to our previous experience with conceptual errors among first-year engineering students. In particular, three of the items (items 1 to 3) are related to measurements and uncertainties, two (items 22 and 23) are related to rotational motion, four (items 4 to 7) to the relation between forces and motion, and one (item 24) to the center of mass.
Comparing the responses at the beginning (test 1) and the end (test 2) of the course allowed us to identify the most persistent preconceptions. These ideas were quantitatively described using classical item theory and the Pearson product–moment correlation coefficient (P). It is worth mentioning that all students were encouraged to complete the tests, although it did not entail any additional incentives or extra credit in their final grades. Except for item 2, the answers of the students to the newly created items seem to improve between tests 1 and 2. Likewise, they present a Pearson coefficient and a difficulty index above the average, which indicates that they have been well designed. Furthermore, a principal component analysis (PCA) [67,68] of the students’ responses does not seem to allow a lower dimensional representation of the data in this case. PCA usually allows the characterization of a data set in a lower dimensional representation. For this purpose, PCA searches for the largest eigenvalues of the covariance matrix and considers the corresponding principal components, which are combinations of the original data as prescribed by the eigenvectors. For the case study, nonetheless, the two largest eigenvalues of the covariance matrix account for only 22% of the data dispersion. Notice that a lower-dimensional description of the data is typically significant when it accounts for at least 70% of the data dispersion, something that, in this case, requires the use of 10 principal components. This result shows that all items are significant. However, when analyzing in more detail the structure of the eigenvectors of the covariance matrix, items 6, 21, and 24 seem to be more important than the average. Conversely, items 11, 17, 18, and 22 are less significant than the average.

4.1.1. Analyzed Preconceptions

In Table 1, we present a classification of the preconceptions analyzed with our questionnaire, along with their description and the items associated with them. As can be seen, our questionnaire analyzes 27 preconceptions. Note also that most preconceptions are analyzed in more than one item.
We have grouped the preconceptions studied into 11 blocks:
  • Kinematics. Here, we consider concepts related to movement, such as position, velocity, and acceleration.
  • Inertia. The study of understanding Newton’s first law when investigating the effect of forces on the movement of different objects.
  • The second law of Newton. The effect of forces in different static and dynamic scenarios.
  • Newton’s third law. The interaction between two objects, that is, the relationship between action/reaction forces and masses.
  • Superposition principle. Analysis of the effect of various forces on an object.
  • Active forces. Effect of an obstacle on a moving object.
  • Resistant forces. Effect of forces that oppose the movement of an object.
  • Gravitational forces. Forces exerted by masses due to the law of Universal Gravitation.
  • Uncertainty. A way to correctly express experimental measurements (significant graphs, uncertainty, etc.).
  • The center of mass: The concept of the center of mass and the way to calculate it.
  • Rotatory motion. Effect of a change in the moment of inertia of a rotating object on its angular velocity. Relationship between angular and linear velocity.
Table 2 shows the concepts evaluated in the test, along with the correct answers. These concepts include the most important contents covered in the physics course.

4.1.2. Indicators Used in the Study of the Test on Conceptual Errors

In the next two subsections, we summarize the two procedures that have been used in our analysis. First, we briefly describe the indicators that have been used to characterize the different items in the tests individually. Second, we review the indices used for the global analysis of the test as a whole.

Individual Characterization of Items According to the Classical Theory Indices

The different indices that have been used in our work for the characterization of individual items are the ease index, the discrimination index, and the difficulty index, which belong to classical item theory and the Pearson product–moment correlation.
The ease index (EI) is a real number that is given by
EI = Number   of   correct   answers   to   the   item Total   number   of   answers   to   the   item ,
which is then related to the percentage of students that answer a particular item correctly. Table 3 provides an explanation of the implications of the value of the EI in different ranges according to Baladrón et al. [69]. Other alternatives can be found in the literature, such as those by Crocker and Algina [70] or that of Backhoff et al. [71]. In all cases, those questions with a very small (large) value should be discarded as they cannot characterize the students because they are too difficult (easy).
The EI takes values between 0 and 1. Very small values in the EI indicate that students find that item particularly complex or difficult. We will establish as a criterion in this work that those items whose degree of difficulty is between the values 0.3 < EI < 0.7 can be considered optimal in the study of the test.
The Discrimination Index (DI) quantifies the ability of a given item to differentiate between two groups of students: those who achieved the best results in the question under study and those who obtained the worst mark. For this purpose, the whole group, which is formed by N students, is divided into two (sub)groups: Group 1, which is formed by the G1 students who achieve the best results, and Group 2, which is formed by the G2 students who obtain the worst results. The DI is then computed as
DI = G 1 G 2 N / 2 = 4 G 1 N 2 ,
since G1 + G2 = N. The DI has a value between −1 (if G1 = 0) and 1 (if G2 = 0). The value DI = −1 corresponds to the worst possible case, when all the members of the group that perform worse obtain the correct answer in a particular item, while all those belonging to the group that performs better fail. Contrarily, the DI = 1 corresponds to a perfect discriminating item, where all students of the first group correctly answer the item, while none of those of the second group succeed. A value equal to DI = 0 indicates no discrimination for that particular item. In practice, an item is assumed to correctly discriminate for DI > 0.3 [71]. Accordingly, all items with DI < 0.3 should be removed if the test is repeated in the future, as they do not allow a correct discrimination of students.
An alternative indicator for item analysis is the difficulty index (Idiff), which is strongly related to the percentage of students who do not obtain the correct answer to a given item [71]. The Idiff is given by
I diff = 1     Average   mark   of   the   item Maximum   mark   of   the   item .
Note that the value of Idiff (3) is also related to that of the EI (1) since when students consider a question easy, many of them answer it correctly, and then both the average score and the EI are large, and, consequently, Idiff is small. Conversely, difficult questions are characterized by small values in the average score and the EI and large values in Idiff. In our case, we will consider that a question has an adequate degree of difficulty when 0.3 < Idiff < 0.7.
The three previous indicators all belong to the classical test theory. A more sophisticated parameter in the analysis of items is the Pearson product–moment correlation coefficient (P) [72].
For a test with n items that have been answered by N students, the P value for an item is given by
P = i = 1 N x i x ¯ y i y ¯ n σ x σ y = cov x y σ x σ y ,
where x i , and y i are the marks of student i in that particular item x i , and the mark in the entire test, respectively, x ¯ and y ¯ are the corresponding average values, σ x and σ y are the standard deviations of the item and the test, respectively, and cov(xy) is the covariance between the score on an individual item, x, and on the whole test, y.
P always has values that are between −1 and 1. If P is positive, the item can correctly discriminate students. This magnitude quantifies the correlation between the correct answers of each student in a particular item and their overall result in the whole test. Therefore, it studies the responses of students who obtain better results than those who obtain worse results in a particular item and compares them with their overall test results.

4.1.3. Global Characterization of Tests

Sometimes it is not only interesting to study the items individually but also groups of items, such as in the test. Let us note, however, that these types of global studies are not as significant as those associated with individual items since they report average values corresponding to aggregated information, thus neglecting the details in the test. Still, they are a good starting point to analyze tests as they can be used to check if they have adequate difficulty and a reasonable ability to discriminate items and students. Furthermore, some of them can also be used to study the success of the learning process.
The simplest way to define a group of items is to calculate the mean values of the considered indices (such as those given by Equations (1)–(3)).
Accordingly, the classical indicators given by Equations (1) and (2) for individual items can be generalized to a global questionnaire, such as
EI test = Mean   mark   of   the   test Number   of   items ,
DI test = Highest   mark Lowest   mark Number   of   items
Hake developed an alternative index to analyze the success of the learning process during the course [17]. To do this, the so-called Hake factor (h) compares the average percentages of correct answers of the students in the initial test 1 and the final test 2 by
h = M ¯ 2 M ¯ 1 100 M ¯ 1 ,
where Mi is the average percentage of correct answers for the questionnaire at time i. This factor is always between 0 and 1. The persistence of preconceptions after the teaching–learning process is low for h > 0.7, moderate for 0.3 < h < 0.7, and high for h < 0.3.

4.2. The Honey–Alonso Learning-Styles Questionnaire

In this work, we have used the Honey–Alonso questionnaire (usually known as CHAEA, the Spanish acronym standing for “Cuestionario Honey–Alonso de Estilos de Aprendizaje”) to assess the LS of our students. This questionnaire is probably the most widely used in the Spanish language [73]. Following the spirit of the Honey–Mumford learning-styles model [44], the Honey–Alonso questionnaire classifies students in the following four categories: activist, theorist, reflector, and pragmatist. In particular, according to Alonso et al. [36], the main characteristics of the previous categories are as follows:
  • Activist. Activist students prefer to learn through direct experimentation. These students like to try new experiences and opportunities, tackle multiple tasks, and work in groups. Contrarily, they do not like general topics with a lot of theory, care much about details, or repeat the same activity.
  • Reflector. Reflector students like to perform direct observations and data collection. These students like to review what they have done, exchange opinions, investigate carefully, and think before acting. On the contrary, reflector students feel uncomfortable when acting as leaders and participating in situations that require action without previous planning.
  • Theorist. Theorist students are attracted by abstract conceptualization. They like to work following a previously detailed plan and to methodically explore associations and relationships between ideas, events, and situations. Contrarily, they do not like to work on open problems or activities that lack a clear context and/or purpose.
  • Pragmatist. Pragmatist students are hands-on individuals who like to apply (preferably as soon as possible) what they have learned. These students do not like to study general theories or concepts that are distant from reality and/or practical purposes.
The Honey–Alonso questionnaire is formed by 80 statements that the students must answer with 0 s (if they do not agree) or 1 s (if they agree). There are 20 associated with each one of the LS. Data collection is simply performed by asking the students to fill out an Excel sheet with the 80 questions at the beginning of the course. The sum of the points associated with the questions related to the same LS (which ranges from 0 up to 20) permits the identification of the tendency toward the corresponding LS, as prescribed by Table 4.

5. Case Study and Results

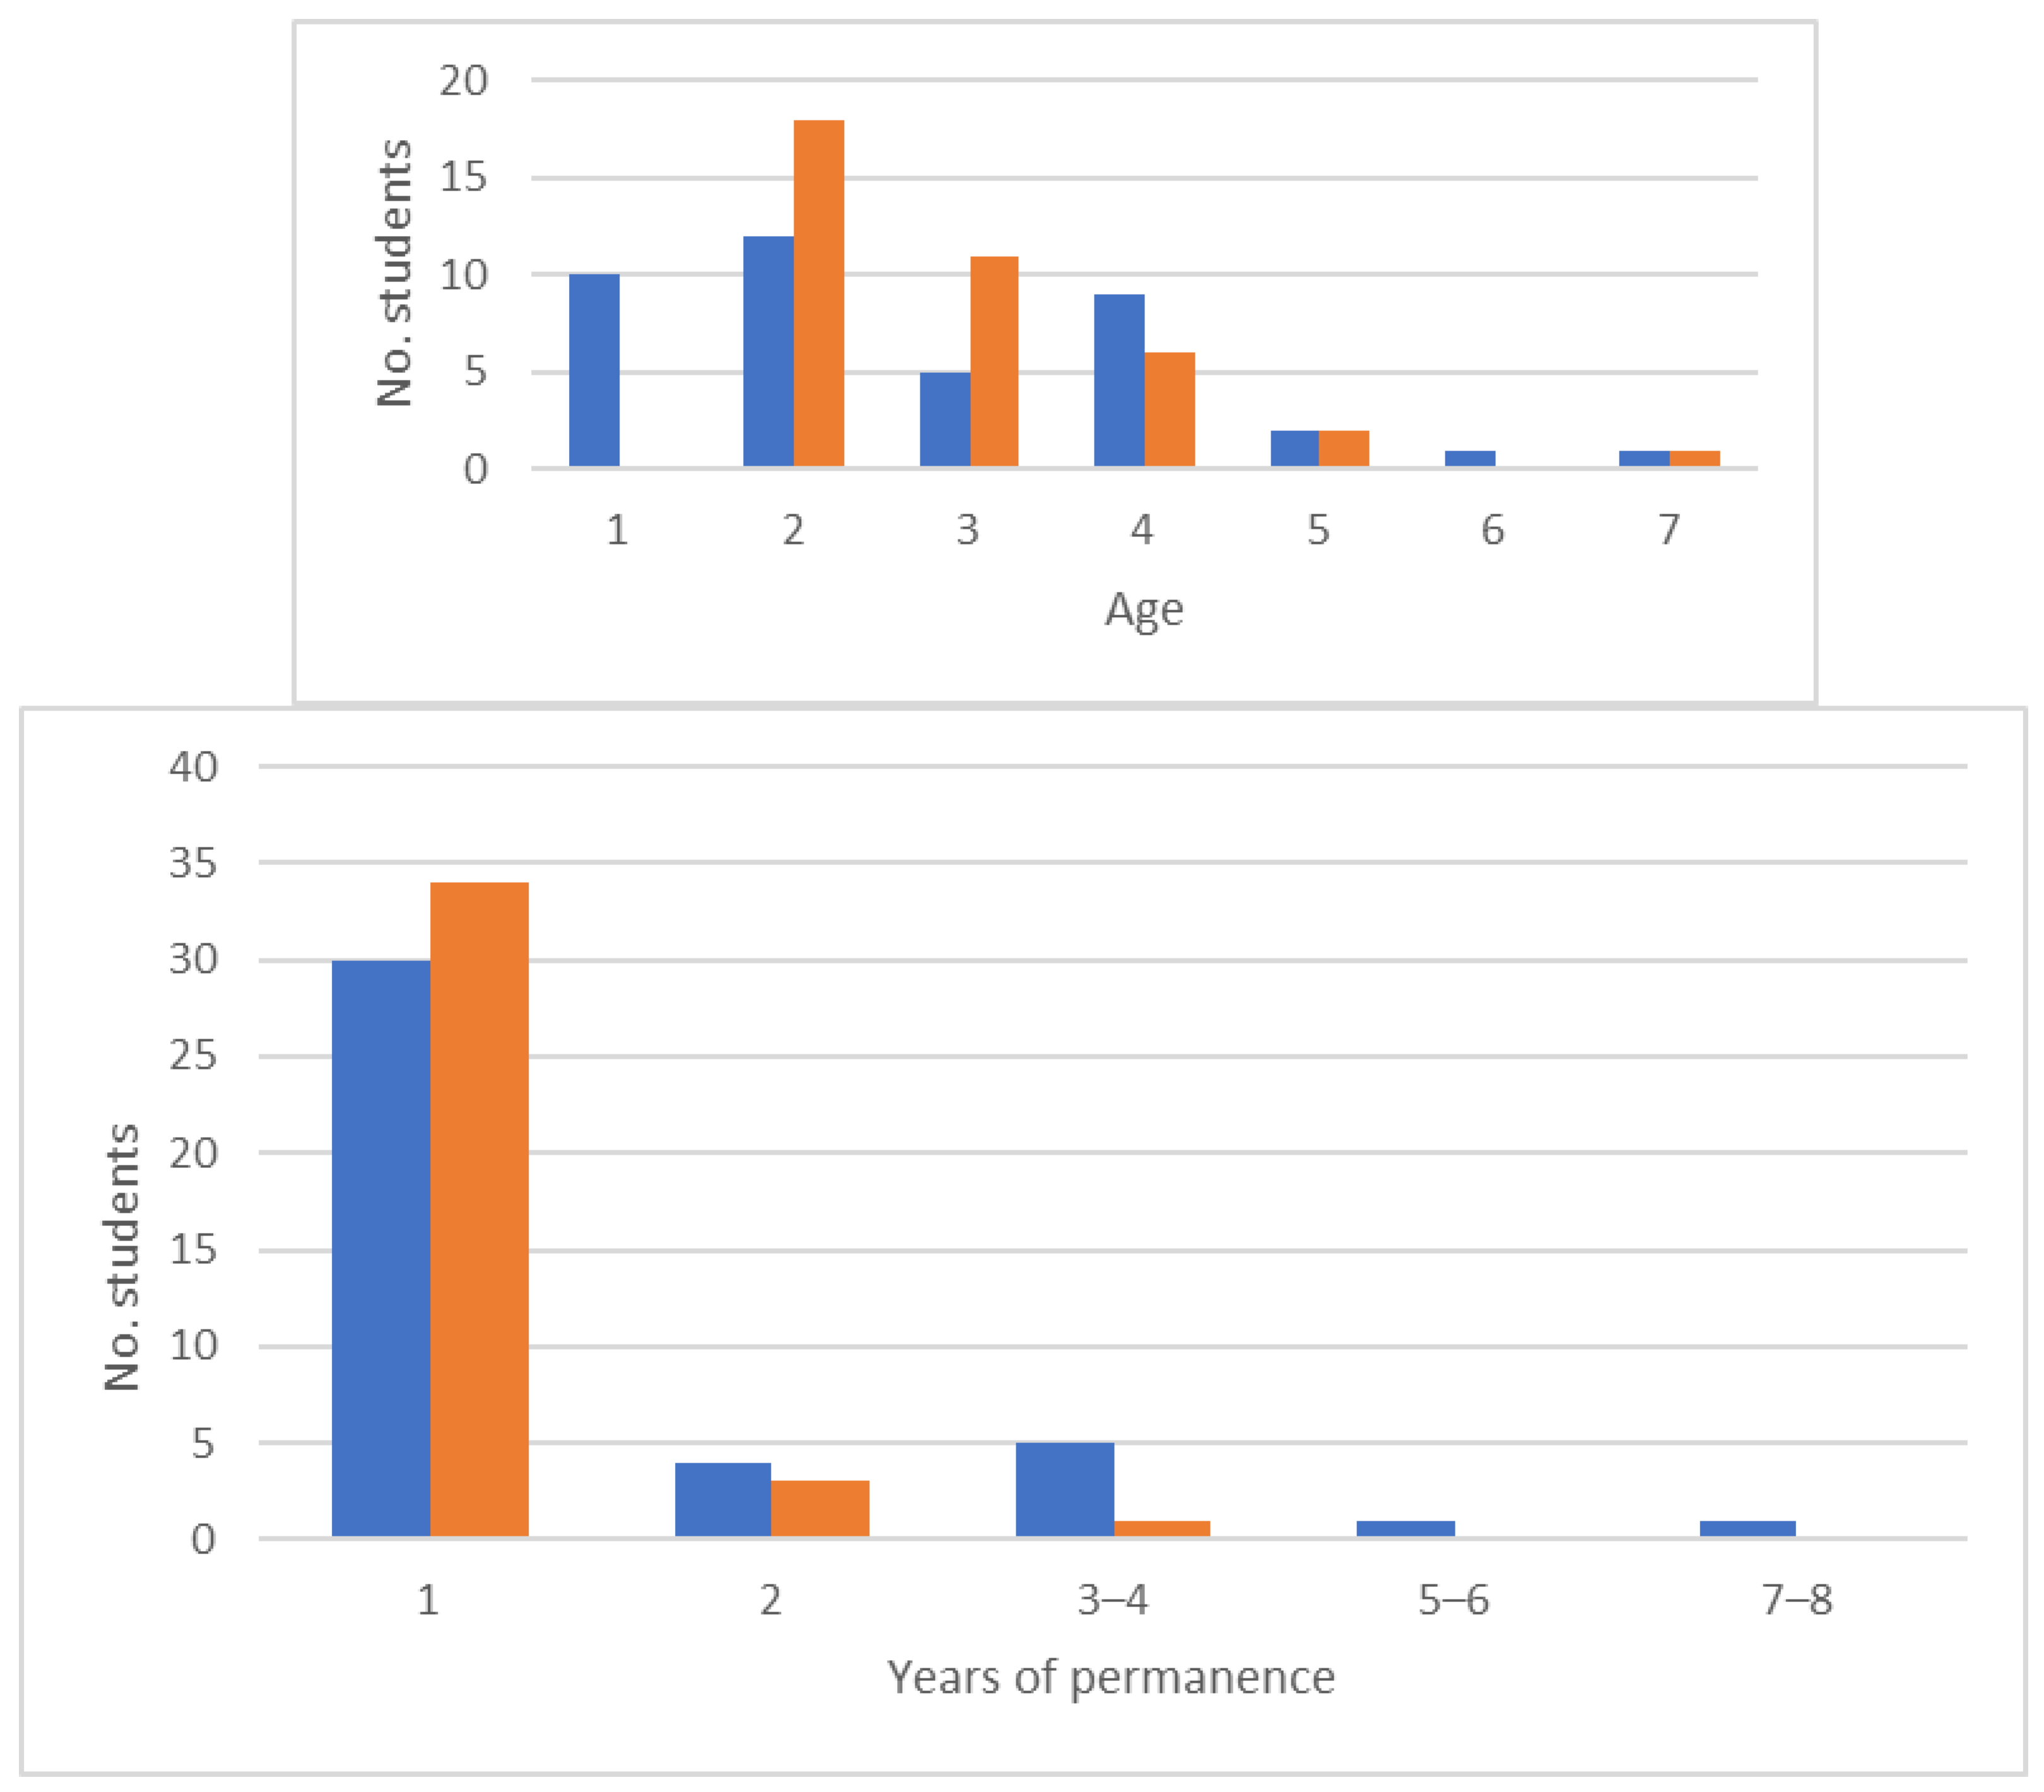
5.1. Description of the Case Study

The study group is made up of freshmen students in physics. The students were enrolled in three different degrees: Agroenvironmental Engineering Degree (Grado en Ingeniería Agroambiental), Food Engineering Degree (Grado en Ingeniería Alimentaria), and Engineering and Agronomic Sciences Degree (Grado en Ingeniería y Ciencia Agronómica). All the students considered are typically taught by the same teacher and in the same class three days per week (5 h total) for one semester (14 weeks). While enrolled in the physics course, the students also attend the following courses: Biology, Calculus, Chemistry, and Technical Drawing. All modules have six ECTS, so they have the same duration and require the same amount of work from the student.
The contents involved in the physics course correspond to the following topics:
  • Vector Calculus.
  • Kinematics of a point particle.
  • Kinematics of rigid solids.
  • Relative kinematics.
  • Point-particle dynamics.
  • Dynamics of rigid solids.
  • Static (equilibrium, center of gravity, and inertia moment).
In addition, the students completed three laboratory practice sessions. The purpose of these laboratories was threefold. First, students can experimentally test some fundamental concepts of physics, such as Newton’s second law, elastic collisions, measuring moments of inertia, etc. Second, the laboratory classes show students how to perform an experiment in physics. Third, special attention was devoted to teaching how to present experimental measurements, particularly with regard to error and uncertainty calculations.
In order to identify the persistence of preconceptions at the end of the teaching period, the students were administered the same preconceptions test twice, at the beginning (test 1) and at the end of the course (test 2), and, in addition, a test about learning studies at the beginning of the course.
At the beginning of the semester, the group was made up of 43 students, with 31 being women and the remaining 12 being men. Figure 1 shows the number of students based on their ages and the number of years at university. As it is noticed, the majority of them (more than 80%) were freshmen between 17 and 20 years old. There are a few that are older but have not passed the physics subject yet. As most students were enrolled in the physics course for the first time, the majority (60%) had no previous laboratory experience. Additionally, 65% of the students had some knowledge of spreadsheets, such as Excel or Open Office, probably because they had already used them in high school. At the end of the term, test 2 was completed by 38 students, consisting of 26 women and 12 men. Notice that the total number of students shown in Figure 1(top) and Figure 1(bottom) who completed tests 1, 40, and 41, respectively, is slightly smaller than the total number of students (43 in orange bars). The reason for this discrepancy is that some of the students did not provide information about their ages and years enrolled in college. However, this fact does not affect any of the results provided in this work.

5.2. Results

In this section, we analyze the results of our study. First, we discuss the results obtained by the students on the items individually. Second, we compare the overall results obtained in test 1 and test 2. Finally, we analyze the possible relationship between the results obtained with the LS.

5.2.1. Analysis of Individual Items

In Figure 2, we show the students’ grades in the university entrance test and the number of items answered correctly in the initial test 1 (blue circles) and the final test 2 (orange triangles squares). As can be seen, the data represented do not have a clear pattern, demonstrating the lack of correlation between test performance and college entrance scores. In other words, preconceptions are present even in those students who have the best academic records.
Concerning the results of the tests, below, we describe the results obtained by individually analyzing the most representative items.
With item 2, we examine whether students can discern the most precise measurement among several. Only 5% of the students who took the initial test and 3% of those who took the final test chose the correct option.
Item 4 deals with the concept of uniformly accelerated rectilinear motion. Notice that the majority opted for selecting option b (53% on the initial test and 55% on the final test) instead of c (16% and 18%, respectively), showing a lack of ability to distinguish between normal and tangential acceleration.
Item 5 had a success rate of 2% and 3% in the initial and the final tests, respectively. More than half of the students (67% on the initial test and 76% on the final test) chose option b, indicating that “an object always moves in the same direction as the force acting on it”, while 16% on both tests chose option a, ”if a body doesn’t accelerate, it’s because no force acts on it”, and finally, 12% for test 1 and 11% for test 2 chose option d, “if a body moves in a straight line, its acceleration is zero”.
Item 7 is related to the concept of weightlessness. It is noteworthy that only 14% in the initial test and 13% in the final test answered correctly. Most students, 67% and 58% respectively, believed that astronauts are not subject to Earth’s gravity, thinking that “there’s no gravity in space”.
Item 11 was correctly answered by 12% of the initial test respondents and 8% of the students in the final test. In this question about the ascent of an elevator at a constant speed, the majority (51% for the initial test and 66% for the final test) chose the option that leans toward the preconceived idea that “the greater force determines the movement, so if the elevator moves, it’s because one of the forces is greater”, and 30% and 21% respectively chose option d, which reveals the preconception that “only active bodies exert forces”.
Item 12 presents an illustration with several blocks moving to the right, asking which will have greater acceleration. With a 12% correct response rate in the initial test and 21% in the final test, it appears that students have some confusion about the concepts of velocity and acceleration. Analyzing the graph reveals that the blocks cover equal distances in equal times, so their velocities are constant, making option d correct: the acceleration of a is equal to the acceleration of b, both being zero. However, the majority of students (30% and 37% respectively) chose option c—aa < ab—indicating some “confusion between the concepts of acceleration and velocity”.
Item 13 studies the forces involved during the trajectory of a ball in the air. The majority of students chose option c (63% and 61%, respectively), believing that throughout the trajectory, gravity, the force of launch, and air resistance are involved, instead of choosing the correct option, d (19% and 18%), thus falling into the preconceived idea of “inertia due to a hit”.
Item 16 was answered correctly by only 9% and 13% in the initial and final tests, respectively. Most students chose option d (33% and 24%), which implicitly carries the preconceived idea of “loss or recovery of initial inertia”, while 30% and 21%, respectively, chose option c, “the last force acting is the one that determines the movement”.
Item 18, with a 12% correct response rate, studies the movement of an object under the action of a force. More than half of the respondents, 65% and 47%, chose option d, which shows the presence of the following preconception: ”movement always occurs when the acting force is greater than resistance”.
Item 19 was correctly answered by only 2% of the initial test students and 5% in the final test. The majority fell into the following preconceptions: “velocity is proportional to the applied force” (option a, 21% and 32%) and “movement occurs because the applied force is greater than resistance” (option b, 53% and 42%).
Item 20, related to 18, had a 35% correct response rate in the initial test and 26% in the final test. It is important to note that 35% of initial test students and 32% of those in the final test considered that the mass of bodies causes them to stop immediately, falling into the preconception that “motion requires the existence of forces” (option a), while 23% in the initial test and 32% in the final test chose option b, believing that after a force acts, the body will continue moving at a constant speed for a while and then gradually stop, indicating conceptual errors regarding “energy dissipation”.
The following items were considered more difficult in test 1 compared to test 2:
Item 6, which studies the displacement of a mobile placed on a table and connected to another suspended by a rope, was challenging, with a 26% correct response rate in the initial test.
Moreover, 28% of students answered item 8 correctly in the initial test. More than half (67%) chose option a, suggesting the preconception that “the greater the mass, the greater the force exerted by an object”, a poor result for students who should grasp the principle of action–reaction.
In Item 14, with a 19% correct response rate in the initial test, the behavior of a space rocket after being propelled by an engine is studied. Moreover, 37% chose option b, indicating the preconception that “the last force to act determines the movement”.
Item 15 deals with the trajectory followed by a rocket between two specific positions. Students showed some deficiencies in understanding the velocity reached by a mobile on which a constant force acts. Preconceptions evident in their answers were “a force acting eventually vanishes” (21%, option c) and “a force causes the acceleration of the mobile, but only up to a maximum velocity” (21%, option d).
In item 21, where two balls of different weights fall from the edge of a table, most students chose option d as valid (49%), indicating the preconception that “heavier objects fall faster”.
With Item 22, we study whether students understand the meaning of the concept of moment of inertia. Only 21% answered correctly in the initial test.
Item 24 studies whether students have correctly assimilated the concept of the center of mass. Only 14% answered correctly in test 1. The majority of students, 37%, chose options that involve the following conceptual errors: “the center of gravity always coincides with the center of mass” (option b) and “in a system of particles, there’s no center of mass, but there is a center of gravity” (14%, option d).
To contextualize these results, we apply the indices described in the previous section. Table 5 shows the results of the indicators given by Equations (1)–(4) for the 24 items that make up the test, along with the difference in the number of correct answers between test 1 and test 2 expressed as a percentage, % . As can be seen, this percentage is positive in 18 of the 24 items, showing that the vast majority of the students have a better performance in test 2 than in test 1. This improvement is particularly significant in 6 of the items (1, 6, 9, 14, 23, and 24), as % surpasses 20%. In the rest of this section, we only discuss those questions with % 5 % , a threshold that is considered sufficient to provide a complete description of the test as it is a value that is exceeded by 21 of the questions.
The most reliable items correspond to those that satisfy 0.3 < EI < 0.7, DI > 0.3, 0.3 < Idiff < 0.7, and P > 0.3, which have been highlighted with asterisks.
As can be deduced from Table 5, item 17 meets the previous criteria in both tests. Let us also note that items 1, 9, 17, 20, and 23 in test 1, and item 22 in test 2, also achieve a high degree of reliability. In general, students found both tests difficult, as can be deduced from the large number of items with IF < 0.3. In particular, the most difficult items in both tests, with the EI < 0.3, were 2, 4, 5, 7, 11, 12, 13, 16, 18 and 19. In test 1, items 6, 8, 14, 15, 21, 22, and 24 also turned out to be difficult, while in test 2, item 20 was also considered difficult. Despite the large number of difficult items, our tests were also able to discriminate between the group of students who achieved better results and those who were not as successful. Likewise, the EI is, in general, higher in test 2 than in test 1, which shows that the learning process has been positive, as reflected in Figure 3. As discussed in more detail in the next section, this result is also in good agreement with the average results for % , and the EI is shown at the bottom of Table 5 but does not seem to have any relation to DI or to P since both of these quantities have the same value in both tests.

5.2.2. Global Analysis of the Test

In order to carry out a global study of the learning process of our students, we have also calculated the global indicators of the tests. On the one hand, the EItest for the entire test, as defined in Equation (5), had a value of 0.23 for test 1 and 0.33 for test 2. These results corroborate the improvement made by the students in test 2, as shown in Figure 3. On the contrary, according to Table 5, the average value of Idiff (3) is reduced from 0.77 for test 1 to 0.67 for test 2. These results indicate that students found the tests difficult in both cases, as expected, due to the large number of individual items that were considered difficult. However, the students found test 1 more difficult than test 2. This fact is clearly demonstrated in Figure 4, where a histogram for the EI is shown. As can be seen, while more than 70% of the items were perceived by the students as difficult and none of them as easy in test 1, in test 2, only 46% of the items were difficult and 8% easy. Likewise, the average number of correct answers in test 2 was %   = 9.7% higher than in test 1, again in good agreement with the results shown in Figure 3.
On the contrary, the discrimination power of both tests is almost the same. On the one hand, P = 0.25 both for test 1 and test 2, which implies that the individual items have, on average, the same discriminatory power in both cases. On the other hand, the average value of the DI given by Equation (2) is also the same (DItest1 = DItest2 = 0.16), which shows that the two tests have the same capacity to discriminate between the group of students who obtained better results in the test and the group that performed worse, such as DI < 0.3. However, the discrimination of the tests is much better when calculated using Equation (6) since the obtained value equals 0.54 for both tests.
Next, to analyze the learning process, we have calculated the Hake factor h given by Equation (7). This factor was equal to 0.13 since the average percentage of students’ correct answers in the initial and final tests was, respectively, 22.87% and 32.57%. The low value of the Hake factor (being less than 0.3) demonstrates the need to modify the teaching methodologies that we are currently using to overcome the persistence of some of the preconceptions. Let us note here that the teachers did not have access to the students’ results in test 1 during the term. Therefore, they could not apply any specific strategy in order to modify preconceptions. Instead, they used traditional lecture-based teaching. A more active educational methodology based on projects, case studies, and directed projects can probably help in conceptually oriented learning [74,75,76]. It has been shown, e.g., that open-inquiry activities can improve the learning process [77,78,79] and make it more long-time lasting [80].
Finally, we carry out a more detailed description of the learning process by calculating the EI and the Hake factor, bringing together the items that are related to the same topic. To do this, we present in Table 6 the percentage of correct answers and the EI, as well as the corresponding Hake factor. As can be seen, the improvement in terms of understanding of concepts has been quite moderate, as expected from the global results already reported. In this way, the preconceptions in which the greatest improvement was observed were those dedicated to correctly expressing a measurement, the center of mass, and the rotation movement. On the contrary, there was almost no difference in the concepts related to Newton’s laws and the types of forces.

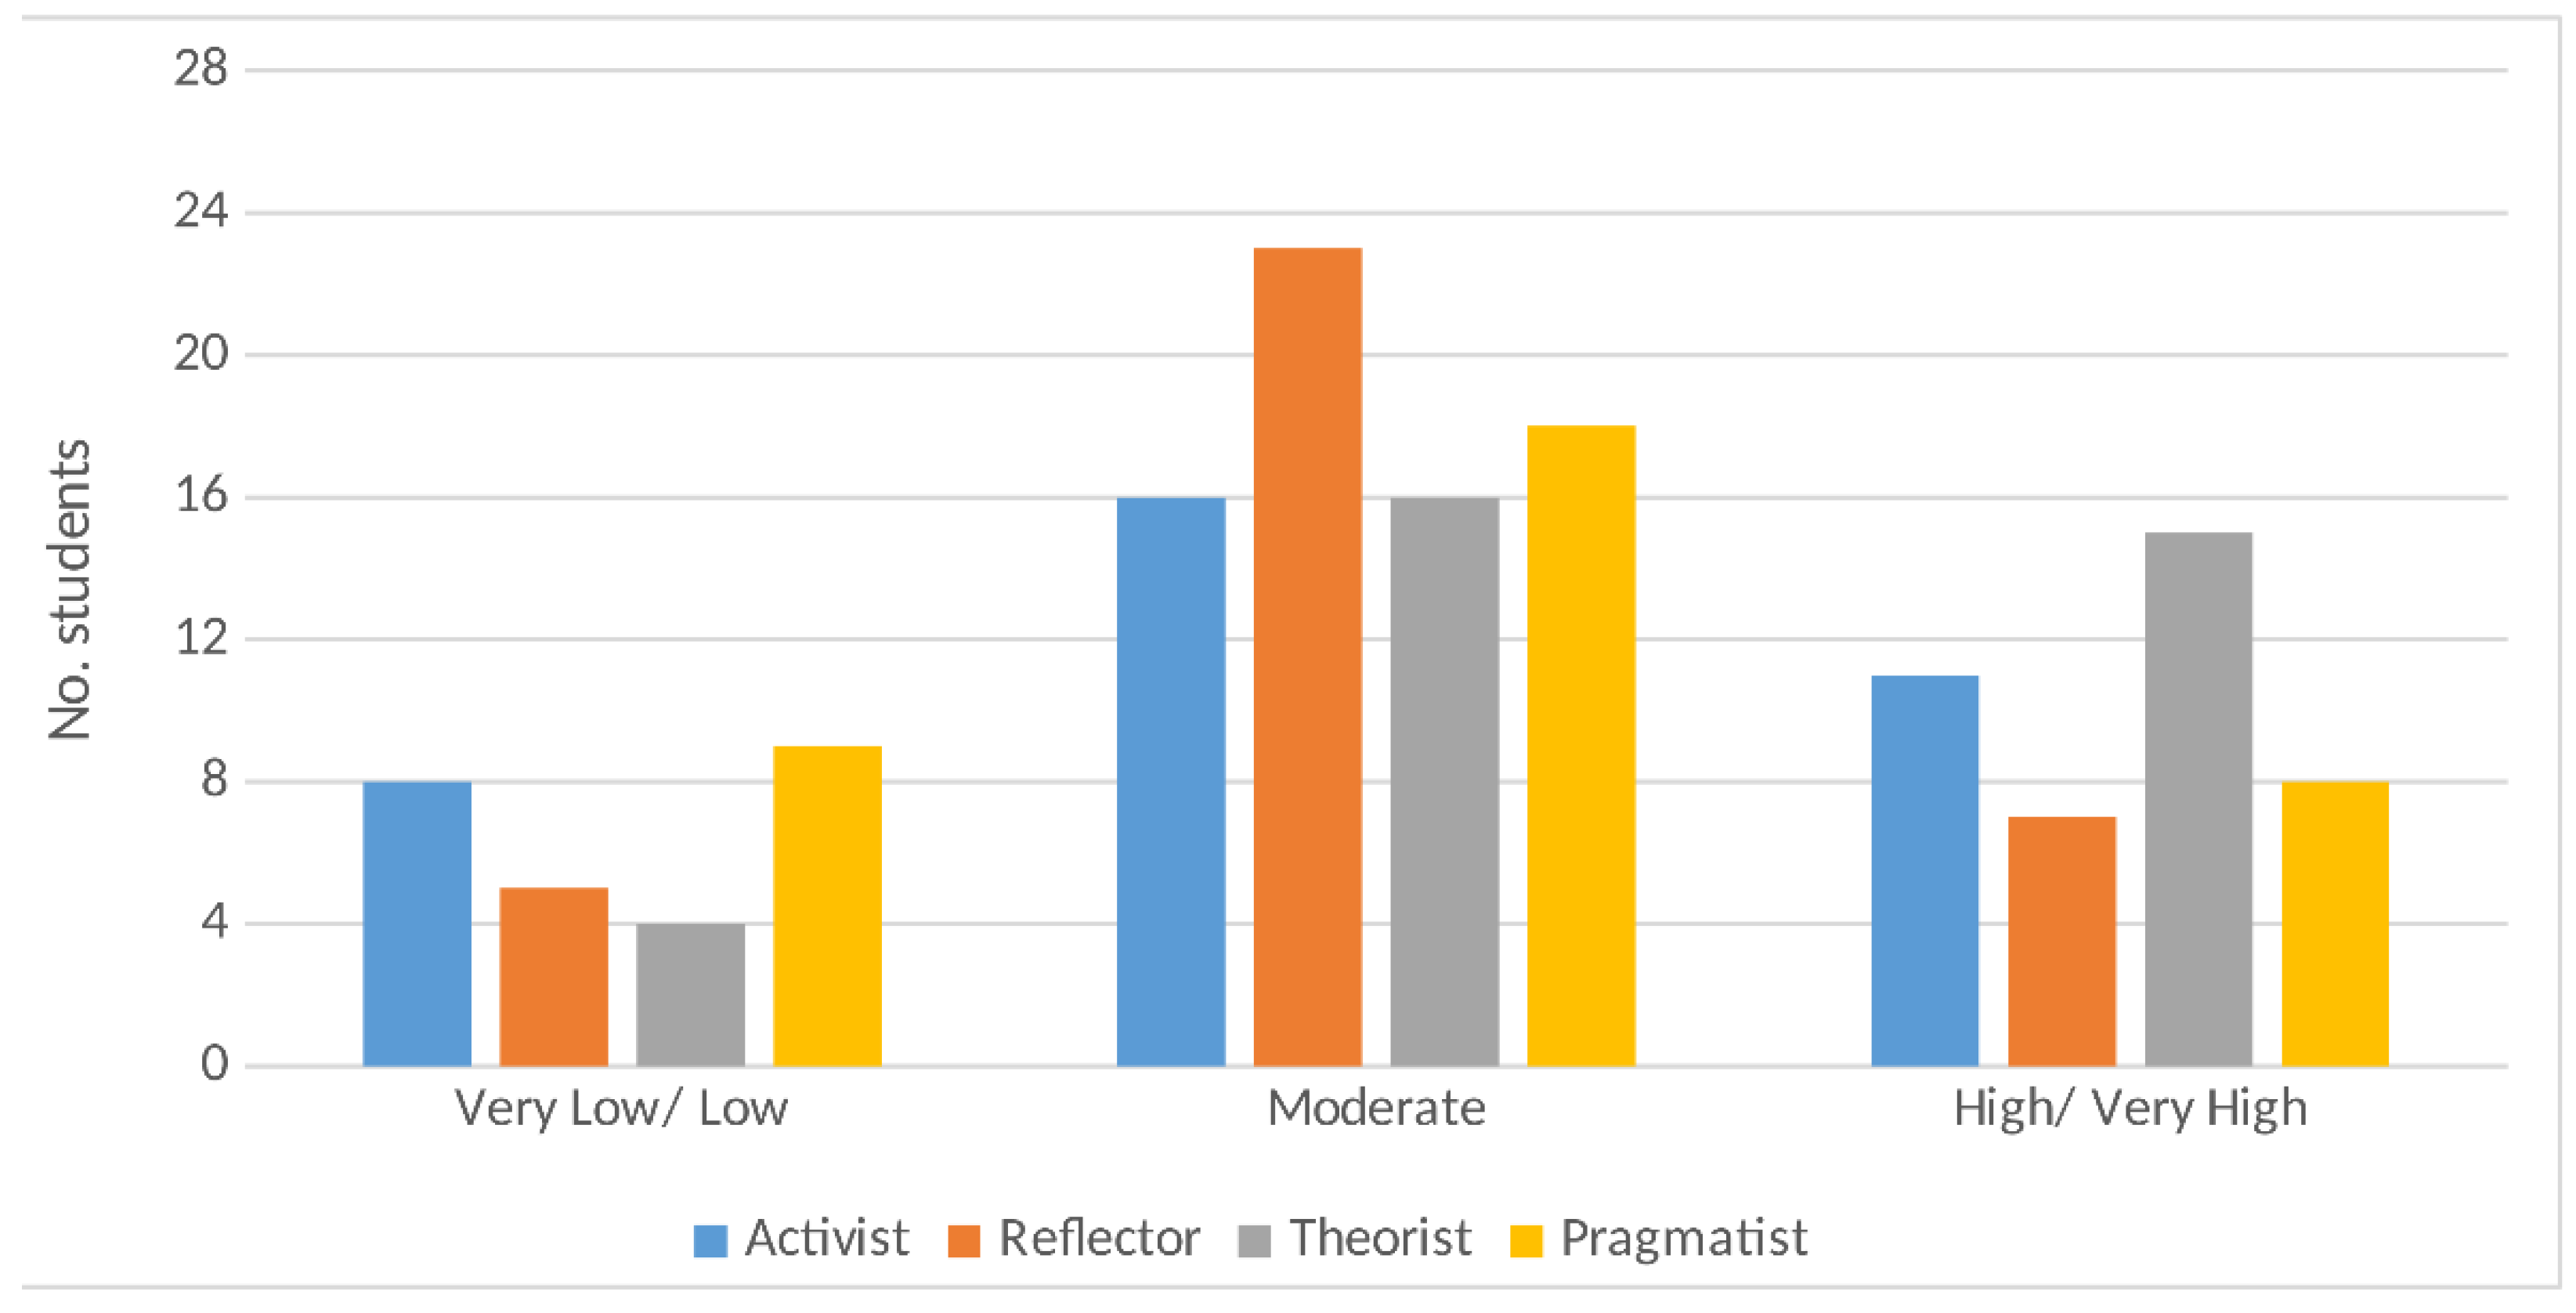
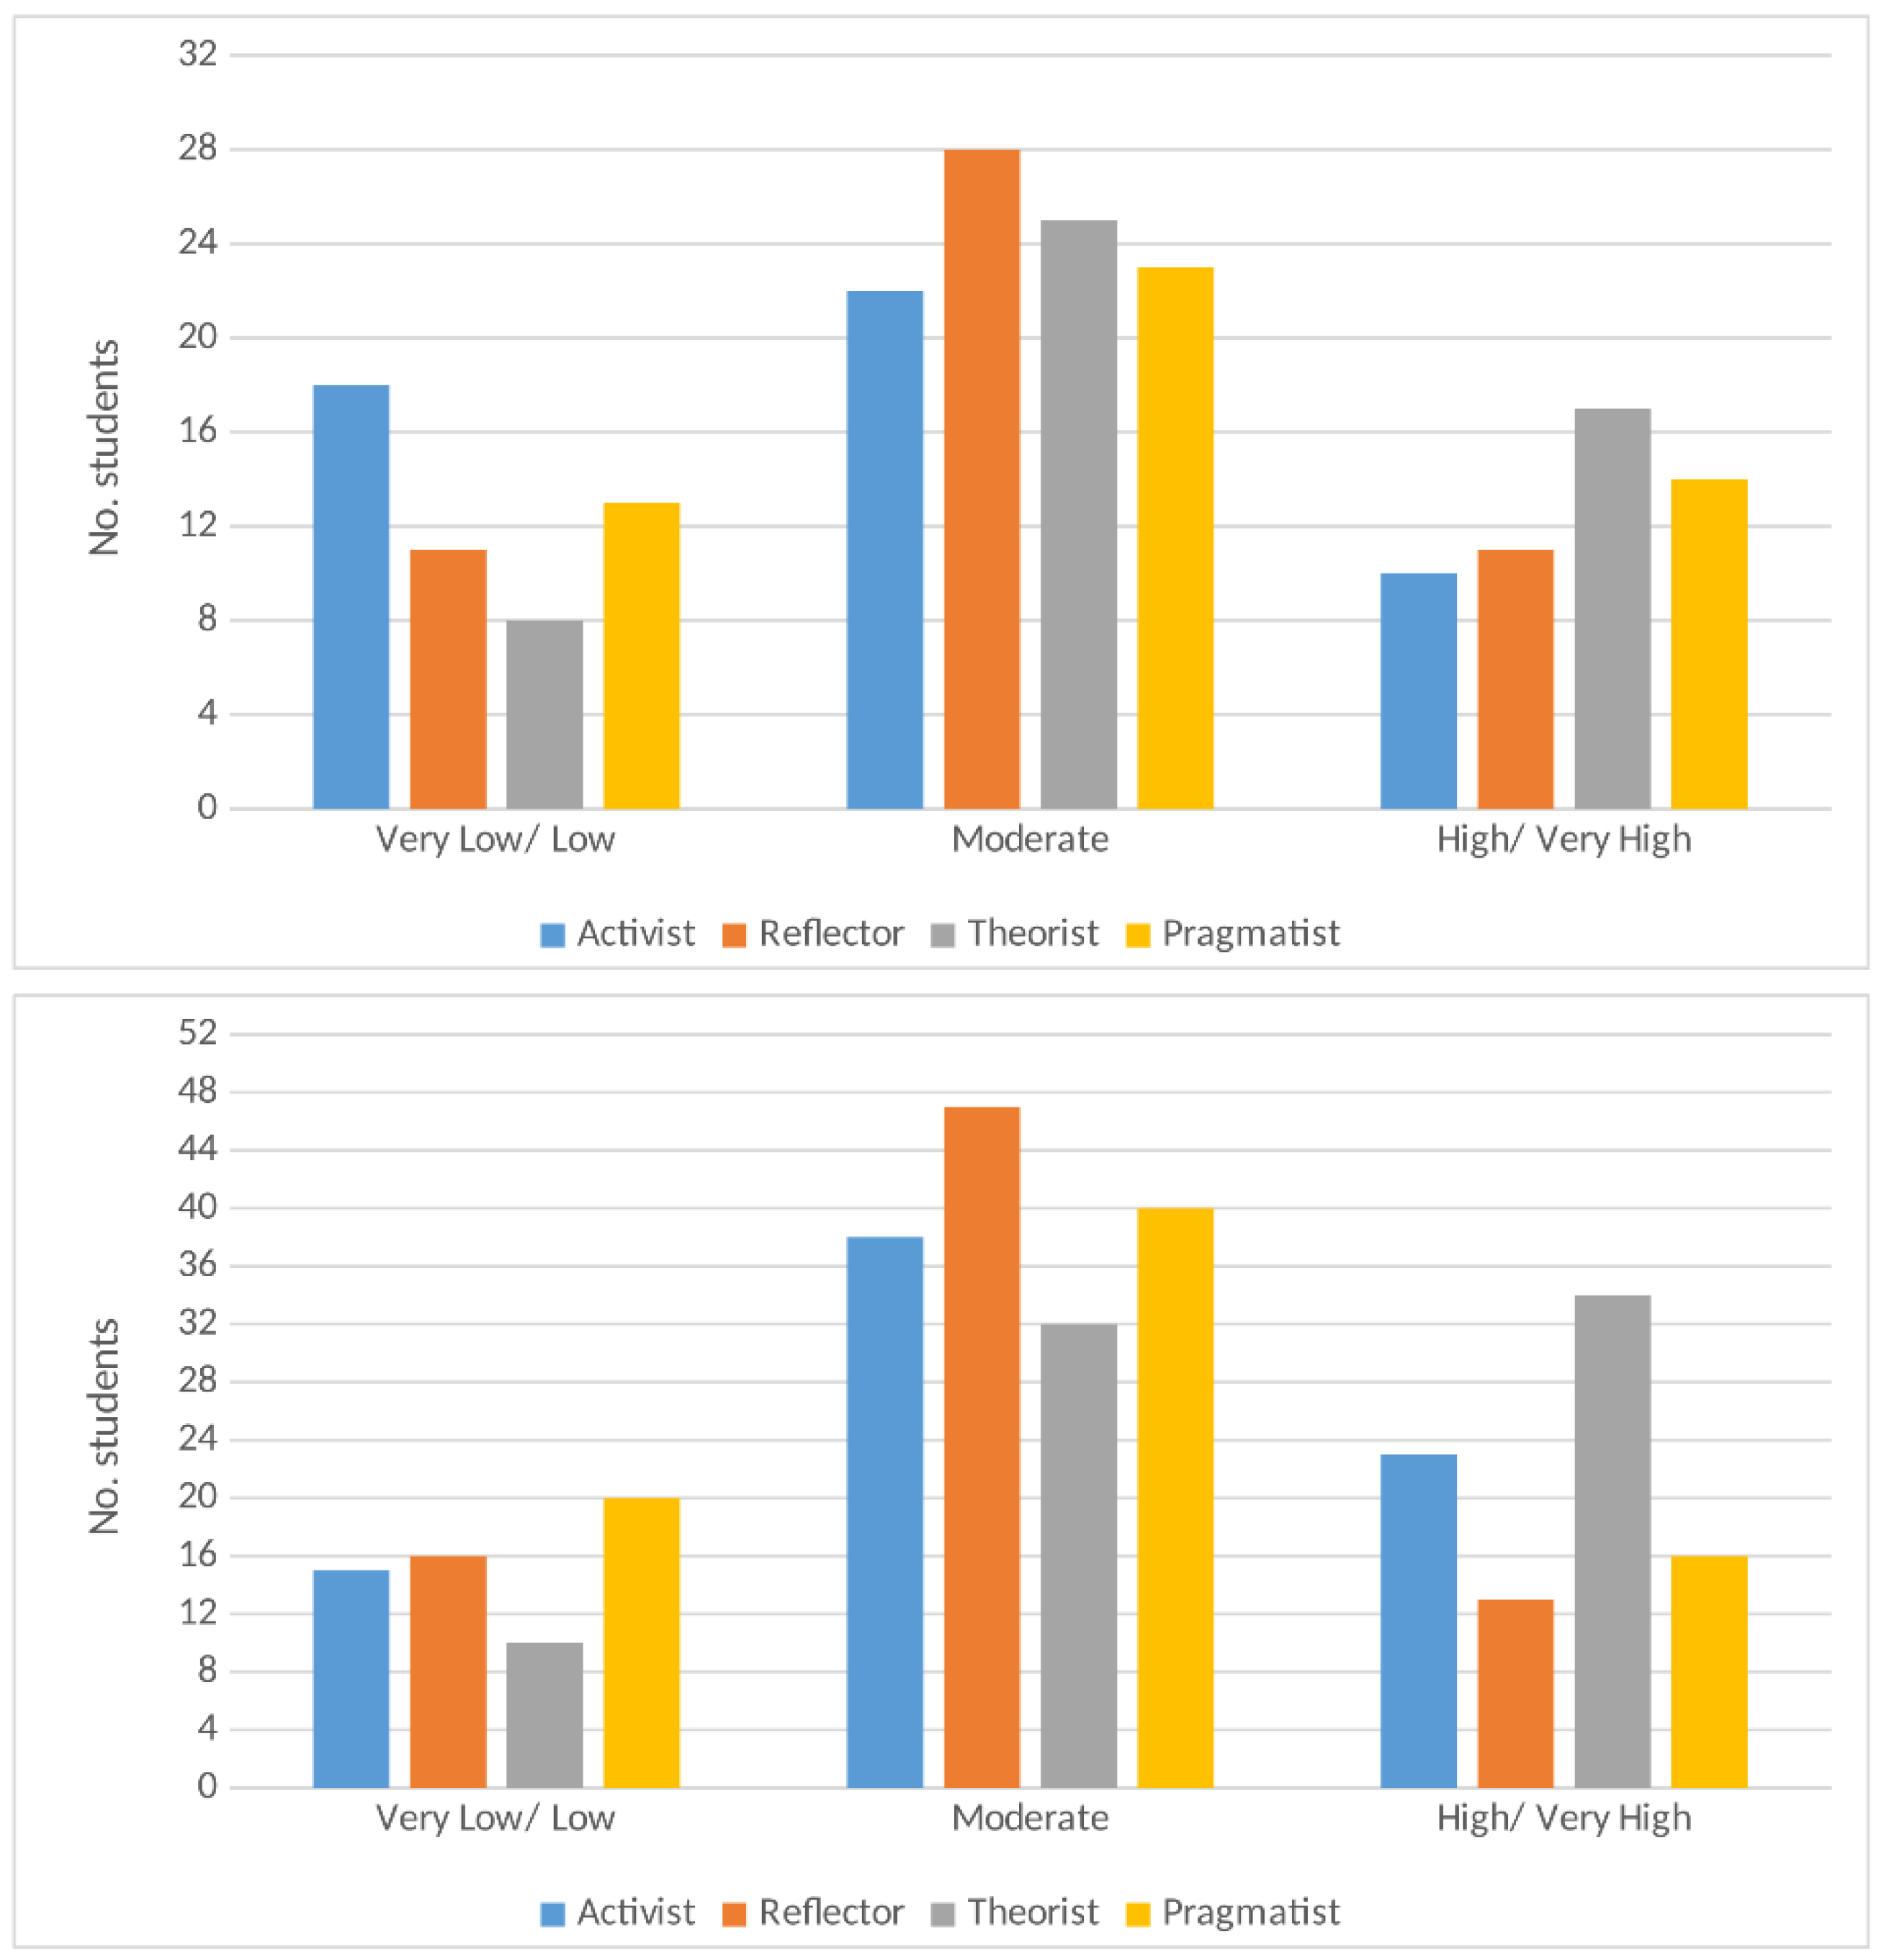
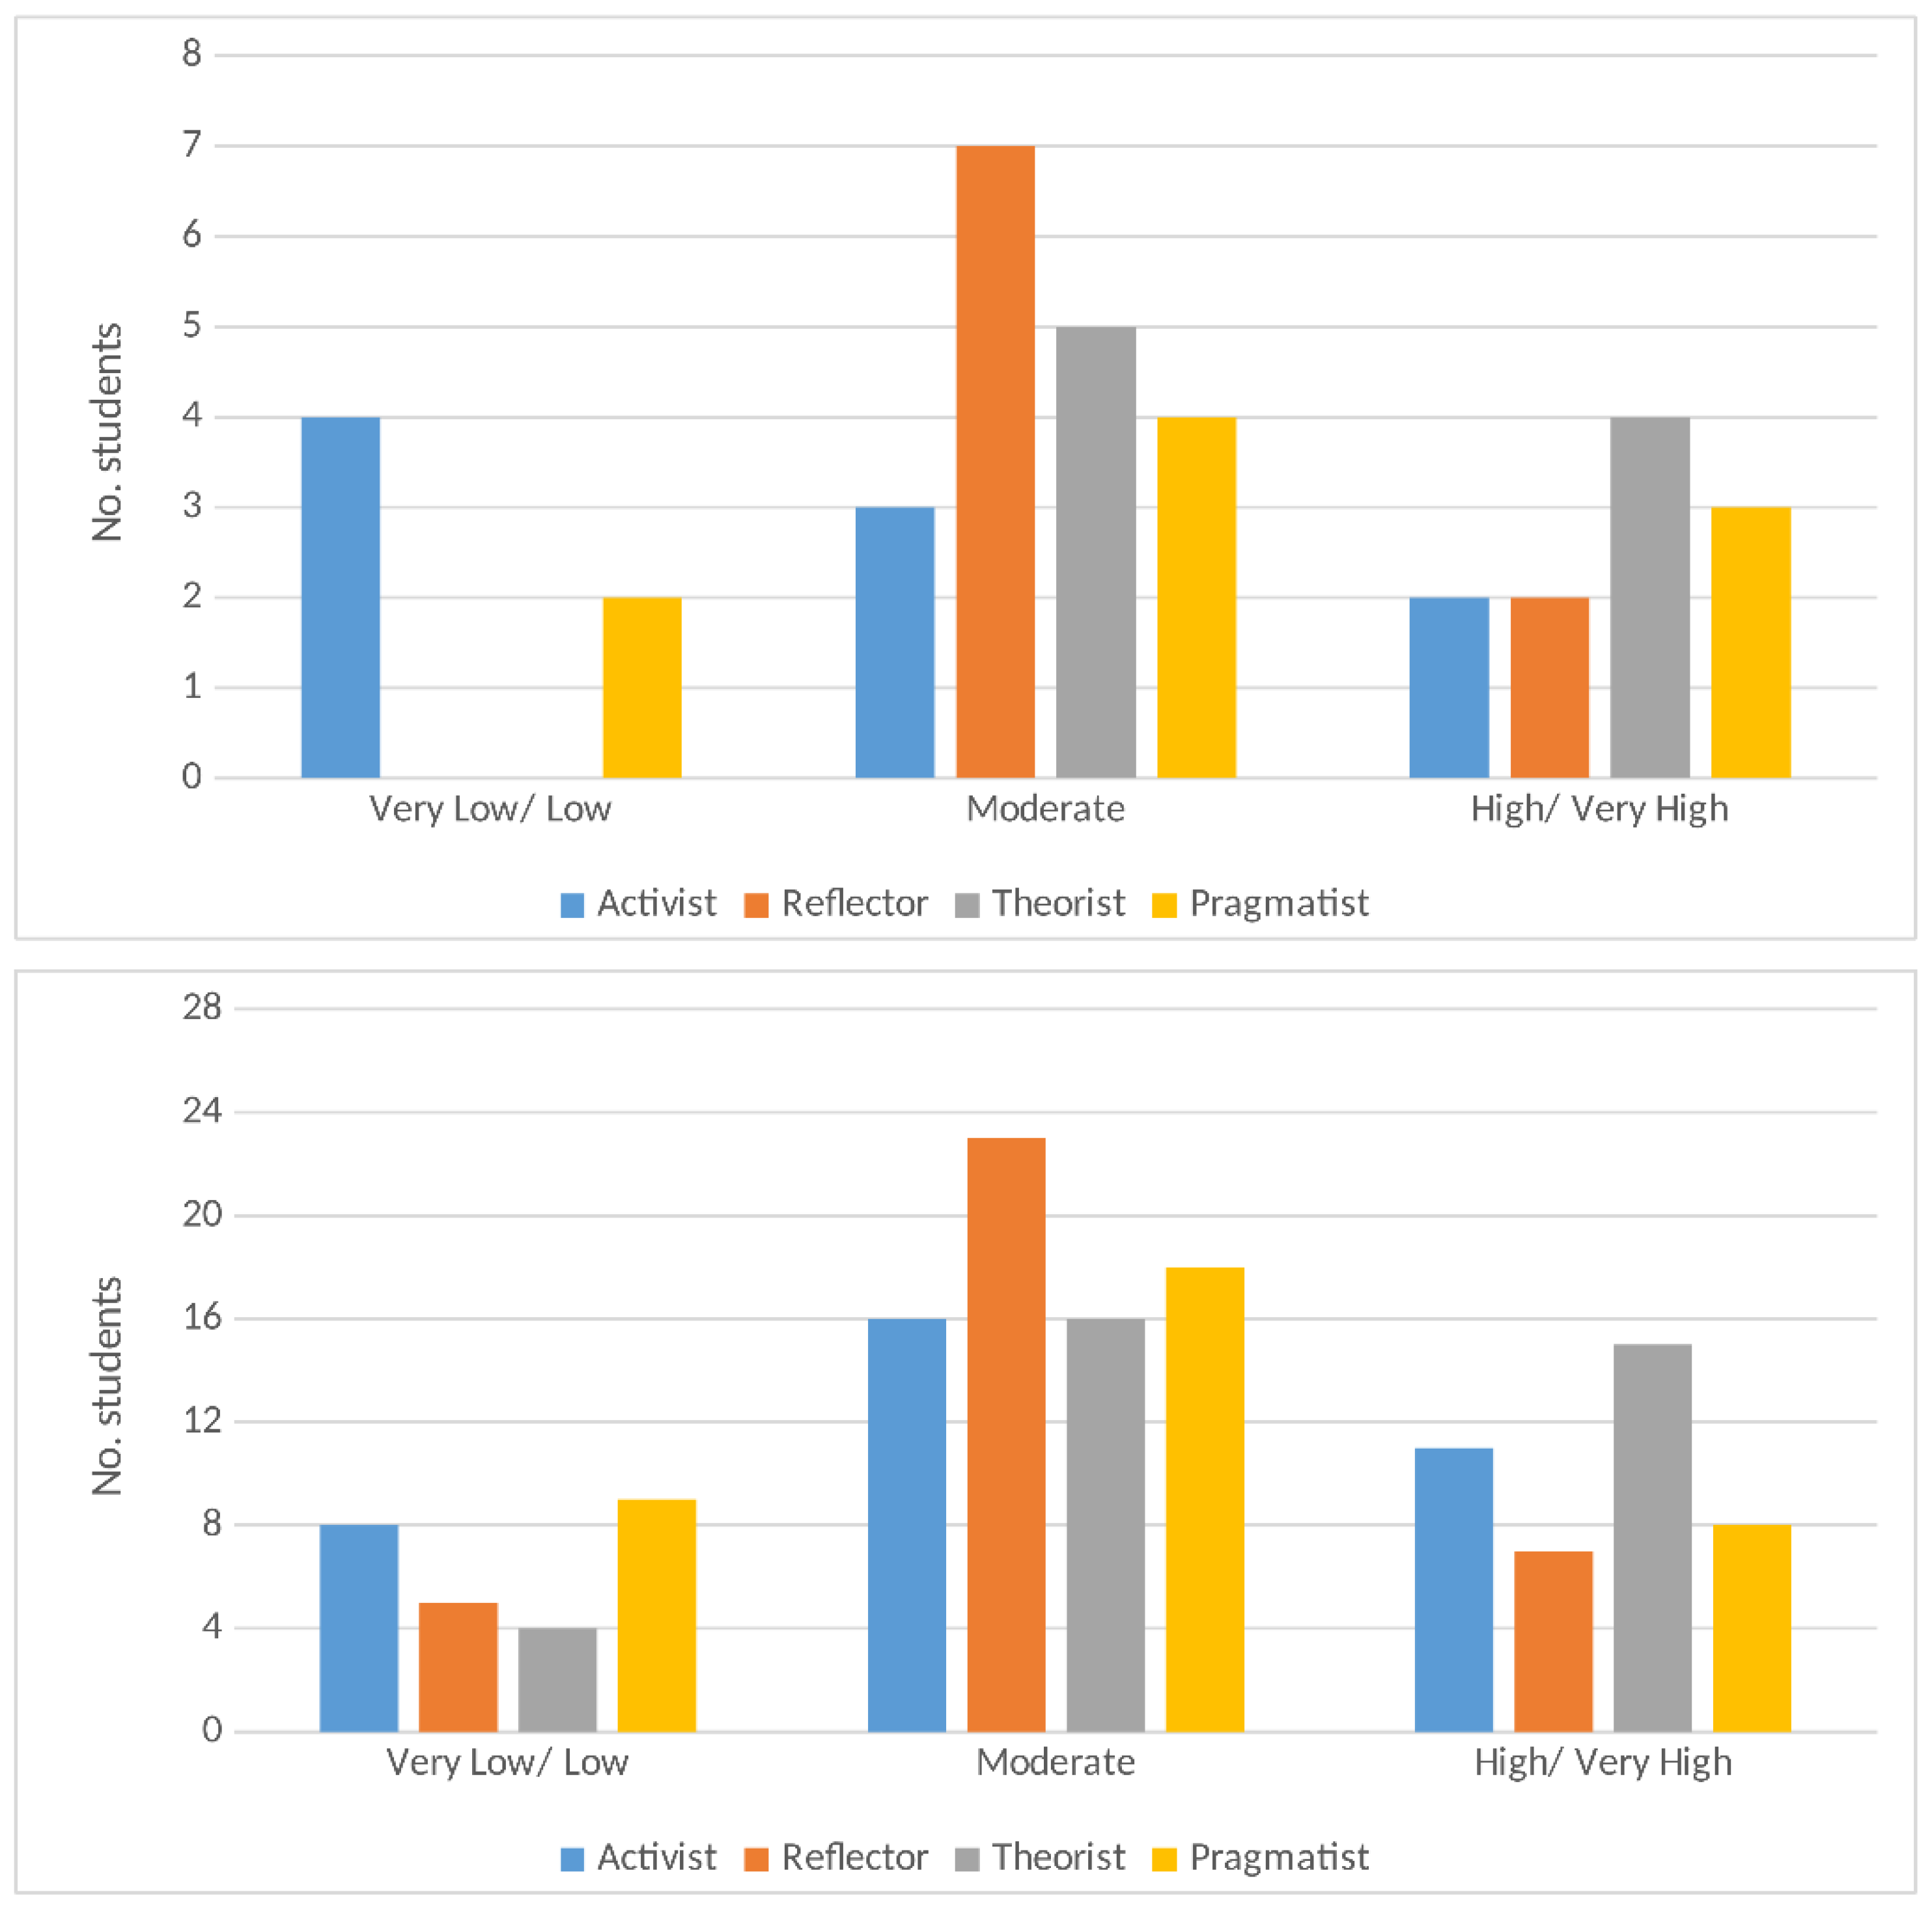
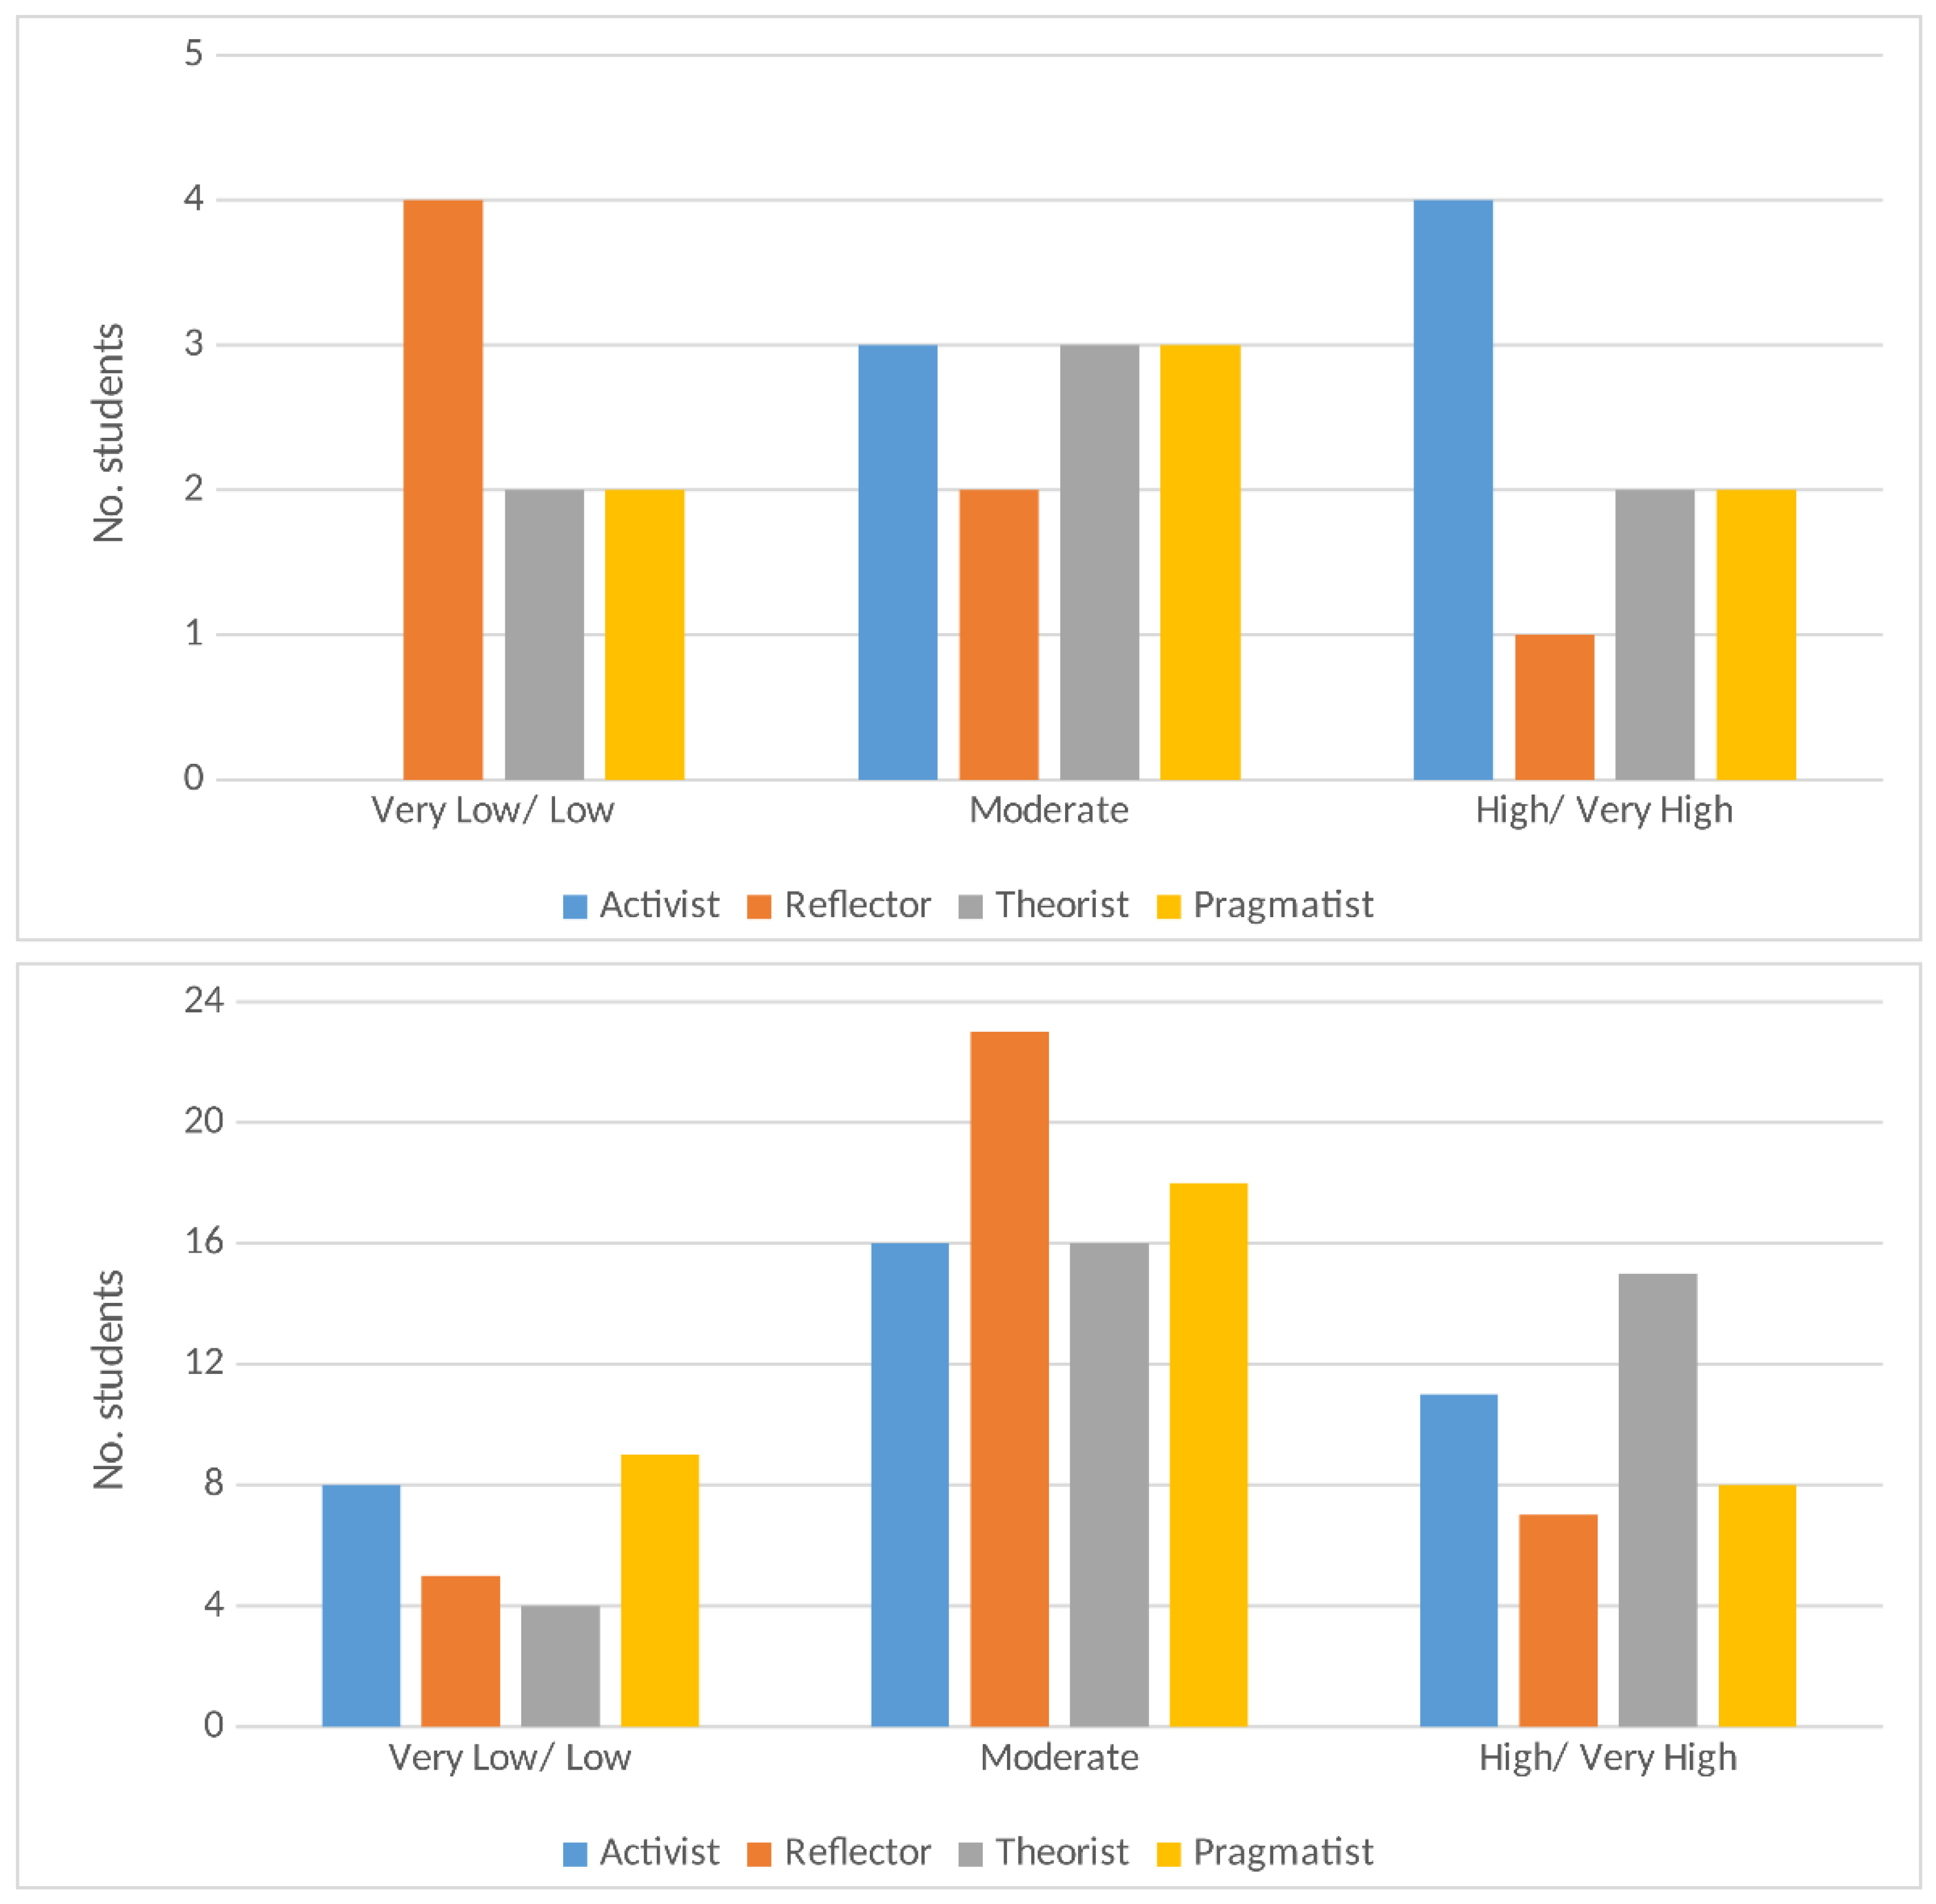
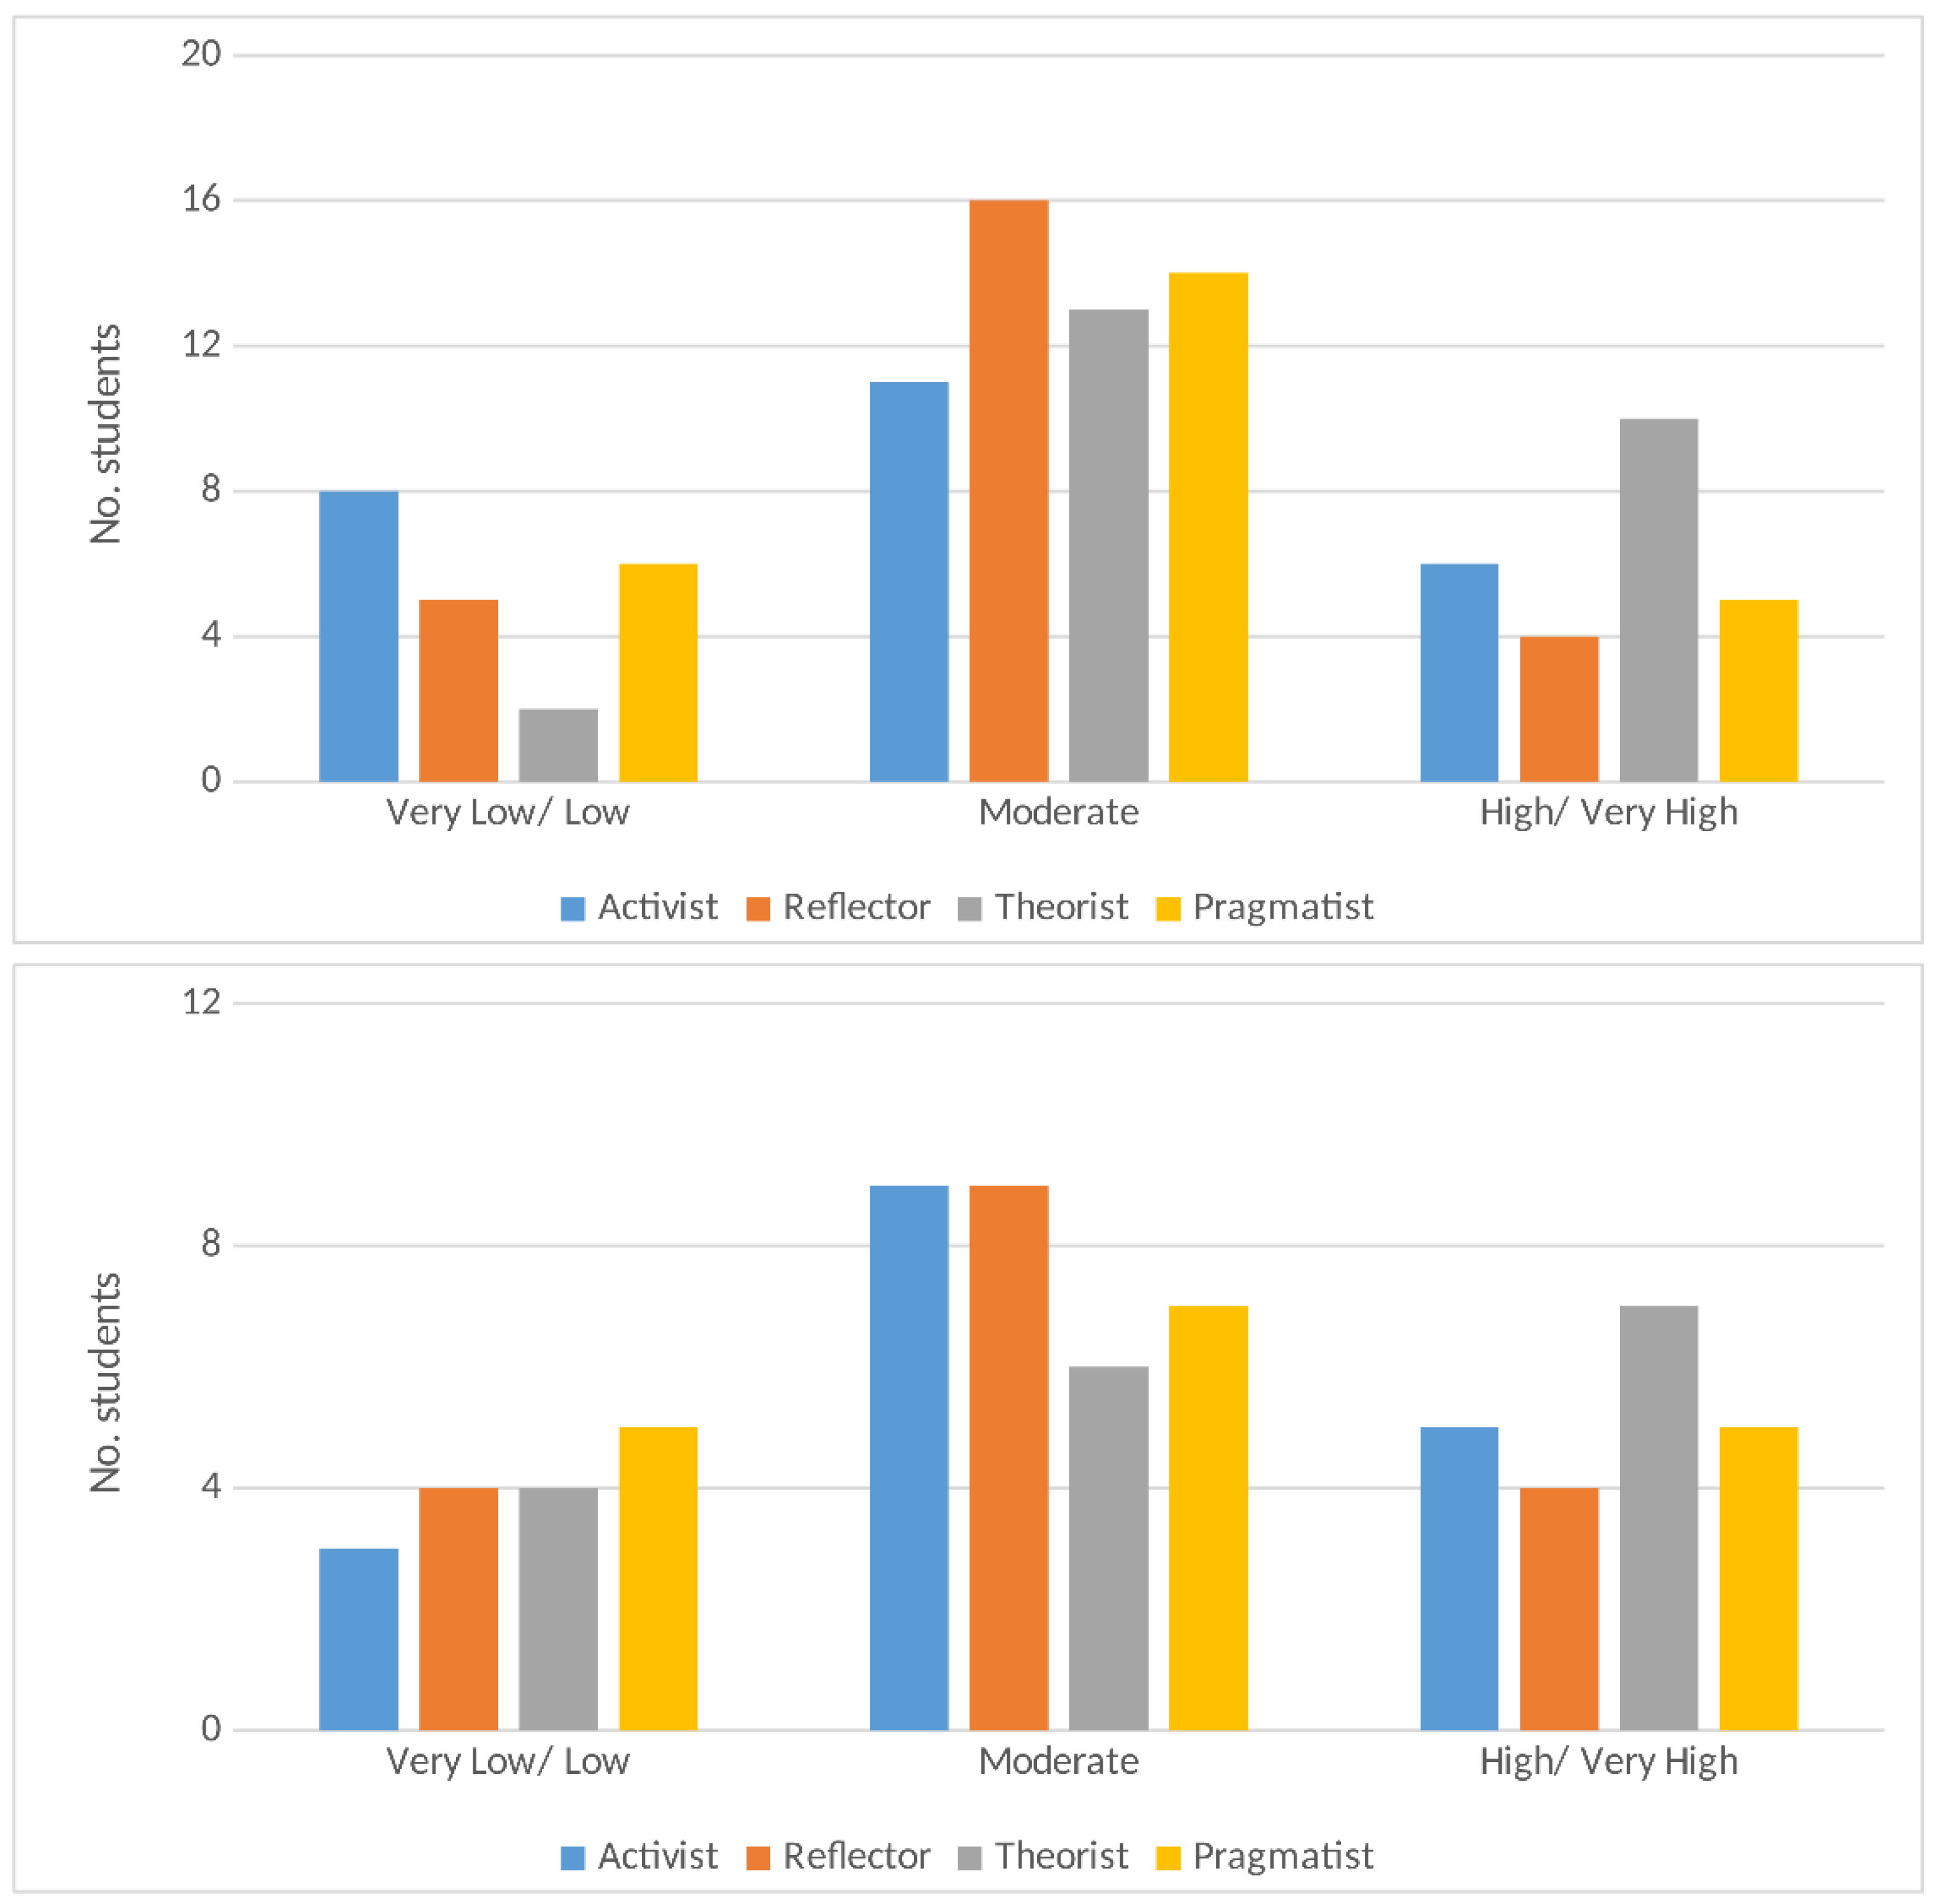
5.3. Learning Styles and Persistence of Conceptual Errors

In this subsection, we analyze the possible relationship between the different LS and preconceptions studied in the previous subsections. To begin with, we present in Figure 5 histograms with the qualitative tendencies (low and very low, moderate, and high and very high) of the LS of the group of students as prescribed by Table 4. As it is observed, the moderate tendency dominates among all LS. However, there is a clear high/very high tendency among theorists (which is almost three times larger than the low/very low tendency). For the other three LS, the low and high tendencies balance with each other.
Next, let us discuss the main LS of the students that present some characteristic preconceptions. First, it has to be mentioned that, in general, we have not observed remarkable differences between the dominant LS in students who present preconceptions and those who do not show them.
We present in Figure 6 the histograms for the questions related to the preconception “misunderstanding between the concepts speed and acceleration”. Among students with this preconception (bottom) and among those who do not present it (top), moderate tendencies dominate in all LS. Furthermore, both groups have a noticeable high/very tendency toward the theorist LS. Likewise, students with the preconception have a slightly larger preference to be activist with a high/very high tendency, while those who do not have it prefer a low/very low tendency toward this LS.
Now, we analyze the LS of the students in relation to the understanding of Newton’s third law. As can be inferred from visual inspection of Figure 7, most of the students provided wrong answers to the test, as they did not fully understand that two colliding bodies exert the same force between each other, no matter their individual masses. Here, a moderate tendency toward all the LS dominates, except for the activist LS among the students who lack the preconception and have a low/very low tendency toward it. As for the whole group, a high/very tendency toward the theorist LS is also noticeable.
As shown in Figure 8, preconception 6, “For there to be movement, there must be forces”, is much more present in the students, as only one-third of them answered the test correctly. Moreover, students who do not present this preconception on the relation between force and motion show a slightly stronger tendency toward the theorist LS, while those who fail have a larger low/very low tendency toward the activist LS. Still, all the tendencies seem to be approximately well balanced among all LS.
Finally, we conclude this discussion by showing in Figure 9 the histograms for the question related to preconception 26 of Table 1, which implies that “A change in the moment of inertia does not affect the angular velocity of the rotating object”. As in the previous cases, there is no remarkable difference in the main LS of the students who present this preconception and those who do not show it.

6. Conclusions

In this work, the presence of prior ideas in first-year university students has been studied, a fact that can have a strong influence on their study plans for future academic years. To do this, we have analyzed their responses to a test on physical concepts taken at the beginning and at the end of the semester. We have not observed a correlation between the university entrance mark and the performance of our students in any of the tests. This fact shows that conceptual errors are present even in those students who finish high school with a high grade. More importantly, we have also observed that some of these preconceptions are still present at the end of the introductory physics course. Using the Hake factor, we have shown that there is only a moderate improvement in modifying some of the preconceptions. In general, most students found it difficult to answer the test, both at the beginning and at the end of the term. Even so, we have observed a moderate improvement in their responses through the Hake factor. However, this parameter had a fairly low value, indicating the need for new strategies in the teaching process.
From the analysis of both tests, initial and final, we have observed that the most frequent preconceptions that the students present are as follows:
  • Difficulties when expressing the result of a measurement accompanied by its uncertainty and discerning the most precise measurement;
  • Confusion between the concepts of speed and acceleration;
  • The absence of movement implies the absence of forces;
  • A body always moves in the same direction as the resultant force;
  • There is no gravity in space;
  • Only active bodies exert forces;
  • The greatest force is what determines the movement;
  • Inertia due to the effect of the blow;
  • Loss or recovery of initial inertia;
  • The last force to act is the one that determines the movement;
  • Movement always occurs when the force acting is greater than the resistance;
  • Speed is proportional to the force applied;
  • A force causes acceleration to a maximum speed.
It should be noted that none of the teachers had access to the results of test 1, so they could not know the preconceptions present in their students at the beginning of the course, and therefore, they could not apply teaching aimed at modifying these preconceptions. As a consequence of these results, we propose to emphasize poorly understood concepts in the next academic year. Furthermore, new teaching methodologies can help improve the learning process in order to modify preconceptions. Moreover, more active teaching may improve the learning process [75]. One possible way to do this is by increasing the number of activities that students must perform in the laboratory, where conceptual errors can be tested experimentally. Additionally, we also think that teaching using project-based and case-study methods can dramatically reduce the most persistent preconceptions—those that remain at the end of the term. The comparison between these new methodologies and traditional teaching based on master classes will also be the subject of future studies.
Finally, using the Honey–Alonso questionnaire, we have also examined the dominant learning styles among our students. On average, most of the students have a moderate tendency toward all learning styles. However, a high/very high tendency toward the theorist learning style can be noticed. Though certain differences have been observed between the learning styles of students with certain preconceptions and those who do not have them, no significant relationship has been found between the learning styles and the persistence of preconceptions. Further studies with larger samples of students will be conducted in the future to try to elucidate this issue.

Supplementary Materials

The following supporting information can be downloaded at: https://www.mdpi.com/article/10.3390/educsci14040401/s1, Supplementary Material for “Persistence of conceptual errors in a first-year university course of Physics and its possible relationship with learning styles”.

Author Contributions

Conceptualization, F.R. and R.M.B.; methodology, J.A., F.R., J.C.L. and R.M.B.; software, J.A., validation, J.A. and J.C.L.; formal analysis, J.A. and J.C.L.; investigation, J.A., F.R., J.C.L. and R.M.B.; data curation, J.C.L.; writing—original draft, J.A., F.R. and J.C.L.; writing—review and editing, F.R., J.C.L. and R.M.B.; supervision, J.C.L. and R.M.B.; project administration, J.C.L.; funding acquisition, J.C.L. All authors have read and agreed to the published version of the manuscript.

Funding

This work has been supported by the Grant PID2021-122711NB-C21 funded by MCIN/AEI/10.13039/501100011033.

Institutional Review Board Statement

Ethical approval not required for this study.

Informed Consent Statement

Not applicable.

Data Availability Statement

The (anonymized) data that support the findings of this study are available from the corresponding author, J.C.L., upon reasonable request.

Conflicts of Interest

The authors declare no conflict of interest.

References

  1. Hattie, J. Visible Learning: A Synthesis of over 800 Meta-Analyses Relating to Achievement, 1st ed.; Routledge: London, UK, 2008. [Google Scholar] [CrossRef]
  2. Karagiannopoulou, E.; Entwistle, N. Students’ Learning Characteristics, Perceptions of Small-Group University Teaching, and Understanding through a “Meeting of Minds”. Front. Psychol. 2019, 10, 444. [Google Scholar] [CrossRef] [PubMed]
  3. Greca, I.M.; Moreira, M.A. The kinds of mental representations -models, propositions and images- used by college physics students regarding the concept of field. Int. J. Sci. Educ. 1997, 6, 711–724. [Google Scholar] [CrossRef]
  4. Bachelard, G.; McAllester, J.M. The Formation of the Scientific Mind: A Contribution to a Psychoanalysis of Objective Knowledge; Clinamen Press: Geneva, Switzerland, 2002. [Google Scholar]
  5. Gómez, M.A.; Pozo, J.I. Relationships between everyday knowledge and scientific knowledge: Understanding how matter changes. Int. J. Sci. Educ. 2004, 26, 1325–1343. [Google Scholar] [CrossRef]
  6. Reif, F.; Larkin, J.H. Cognition in scientific and everyday domains: Comparison and learning implications. J. Res. Sci. Teach. 1991, 28, 733–760. [Google Scholar] [CrossRef]
  7. Steinberg, M.S.; Brown, D.E.; Clement, J. Genius is not immune to persistent misconceptions: Conceptual difficulties impeding Isaac Newton and contemporary physics students. Int. J. Sci. Educ. 1990, 12, 265–273. [Google Scholar] [CrossRef]
  8. Baker, D.; Taylor, P.C.S. The effect of culture on the learning of science in non-western countries: The results of an integrated research review. Int. J. Sci. Educ. 1995, 17, 695–704. [Google Scholar] [CrossRef]
  9. Abrahams, I.; Homer, M.; Sharpe, R.; Zhou, M. A comparative cross-cultural study of the prevalence and nature of misconceptions in physics amongst English and Chinese undergraduate students. Res. Sci. Technol. Educ. 2015, 33, 111–130. [Google Scholar] [CrossRef]
  10. Niazi, H.K.; Dogar, S.R. A comparative study of misconceptions of physics curriculum among the students of O-level (University of Cambridge UK) and SSC level (Pakistani National Curriculum 2006). J. Res. Soc. Sci. 2016, 4, 28–53. [Google Scholar]
  11. Mora, C.; Herrera, D. A review of the previous ideas of the concept of force. Lat. Am. J. Phys. Educ. 2009, 3, 72–86. [Google Scholar]
  12. Clement, J. Students preconceptions in introductory mechanics. Am. J. Phys. 1982, 50, 66–71. [Google Scholar] [CrossRef]
  13. Camarazza, A.; McCloskey, M.; Green, B. Naive beliefs in sophisticated subjects: Misconceptions about trajectories of objects. Cognition 1981, 9, 117–123. [Google Scholar] [CrossRef]
  14. McDermott, L.C. Bridging the gap between teaching and learning: The role of research. AIP Conf. Proc. 1997, 399, 139–165. [Google Scholar] [CrossRef]
  15. Hestenes, D.; Wels, M.; Swackhamer, G. Force Concept Inventory. Phys. Teach. 1992, 30, 141–158. [Google Scholar] [CrossRef]
  16. Nelly, F.; Beleño, L.; Márquez, C.; Agudelo, J.d.J.; Muñiz, J.L. The conceptual evolution in the learning of physical concepts mediated by didactic units. Eng. Educ. Mag. 2019, 14, 1–8. [Google Scholar] [CrossRef]
  17. Alconchel, F.; Cámara, M.E.; Díaz, M.; Gámez, B.; Gámez, L.; Laguna, M.F.; Lávin, A.; Martín, P.; Ponce, A.; Seidel, L. Conceptual Quizzes in Physics: Assessment of Learning Outcomes and Misconceptions in Mechanics and Electromagnetism. In Proceedings of the III International Congress on Learning, Innovation and Competitiveness (CINAIC, 2015), Madrid, Spain, 14–16 October 2015; E.T.S.I. Industriales (UPM): Madrid, Spain, 2015. [Google Scholar]
  18. Covián, E.; Celemín, M. Ten years of evaluation of the teaching-learning of Newtonian mechanics in Spanish engineering schools. Academic performance and presence of preconceptions. Sci. Educ. 2008, 26, 23–42. [Google Scholar]
  19. Carrascosa, J. El problema de las concepciones alternativas en la actualidad (parte I). Análisis sobre las causas que las originan y/o mantienen. Rev. Eureka Sobre Enseñ. Divulg. Cienc. 2005, 2, 183–208. [Google Scholar] [CrossRef]
  20. McDaniel, M.A.; Stoen, S.M.; Frey, R.F.; Markow, Z.F.; Hynes, K.M.; Zhao, J.; Cahill, M.J. Dissociative conceptual and quantitative problem solving outcomes across interactive engagement and traditional format introductory physics. Phys. Rev. Phys. Educ. Res. 2016, 12, 020141. [Google Scholar] [CrossRef]
  21. Russell, T.; Martin, A.K. Learning to teach science. In Handbook of Research on Science Education; Routledge: London, UK, 2023; pp. 1162–1196. [Google Scholar]
  22. Pozo, J.I.; Gómez, M.A. Aprender y enseñar ciencia. In Del Conocimiento Cotidiano al Conocimiento Científico; Morata: Madrid, Spain, 1998; ISBN 978-8471124401. [Google Scholar]
  23. Picquart, M. What can we do to achieve meaningful learning in physics? Lat. Am. J. Phys. Educ. 2008, 2, 29–36. [Google Scholar]
  24. Engel-Clough, E.; Driver, R. A study of consistency in the use of students’ conceptual frameworks across different task contexts. Sci. Educ. 1986, 70, 473–496. [Google Scholar] [CrossRef]
  25. Helm, H. Misconceptions in physics among South African students. Phys. Educ. 1980, 15, 92–105. [Google Scholar] [CrossRef]
  26. Palmer, D.H. Exploring the link between students’ scientific and nonscientific conceptions. Sci. Educ. 1999, 83, 639–653. [Google Scholar] [CrossRef]
  27. Scott, T.F.; Schumayer, D. Conceptual coherence of non-Newtonian worldviews in Force Concept Inventory data. Phys. Rev. Phys. Educ. Res. 2017, 13, 010126. [Google Scholar] [CrossRef]
  28. Pinto, G.; Castro-Acuña, C.M.; López-Hernández, I.; Alcázar Montero, V. Learning Difficulties in the Interpretation of Matter at the Molecular Level by University Students—A Case Study: Dissolution of Oxygen in Water. Educ. Sci. 2023, 13, 781. [Google Scholar] [CrossRef]
  29. Rivera-Juárez, J.M.; Madrigal-Melchor, J.; Enciso-Muñoz, A.; López-Chávez, J. Persistence of previous ideas about Electricity of the students of the Physics degree at the Autonomous University of Zacatecas. Lat. Am. J. Phys. Educ. 2011, 5, 537–542. [Google Scholar]
  30. Fazio, C.; Battaglia, O.R.; Di Paola, B.; Persano Adorno, D. Analyzing the Conceptions on Modelling of Engineering Undergraduate Students: A Case Study Using Cluster Analysis. In Key Competences in Physics Teaching and Learning; Greczyło, T., Dębowska, E., Eds.; Springer Proceedings in Physics; Springer: Cham, Switzerland, 2017; Volume 190. [Google Scholar]
  31. Paniagua, M.A.; Swygert, K.A. How to Develop Questions for Written Assessments in the Area of Basic and Clinical Sciences; National Board of Medical Examiners: Philadelphia, PA, USA, 2016. [Google Scholar]
  32. Hestenes, D.; Halloun, I. Interpreting the Force Concept Inventory. A response to Huffman and Heller. Phys. Teach. 1995, 33, 502–506. [Google Scholar] [CrossRef]
  33. Hake, R. Interactive-engagement vs. Traditional methods: A six-thousand-student survey of mechanical test data for introductory physics courses. Am. J. Phys. 1998, 66, 64–74. [Google Scholar] [CrossRef]
  34. Henderson, C. Common concerns about the Force Concept Inventory. Phys. Teach. 2002, 40, 542–547. [Google Scholar] [CrossRef]
  35. Maries, A.; Singh, C. Teaching assistants’ performance at identifying common introductory student difficulties in mechanics revealed by the Force Concept Inventory. Phys. Rev. Phys. Educ. Res. 2016, 12, 010131. [Google Scholar] [CrossRef]
  36. Artamonova, I.; Mosquera, J.C.; Artamanov, J.D.M. Application of force concept inventory in Latin America for the evaluation of the understanding of the basic concepts of mechanics at the university level. Eng. Educ. Mag. 2017, 12, 56–63. [Google Scholar] [CrossRef]
  37. Abdelhadi, A.; Ibrahim, Y.; Nurunnabi, M. Investigating Engineering Student Learning Style Trends by Using Multivariate Statistical Analysis. Educ. Sci. 2019, 9, 58. [Google Scholar] [CrossRef]
  38. Kolb, D.A. Experiential Learning: Experience as the Source of Learning and Development, 2nd ed.; FT Press: Saddle River, NJ, USA, 2014; ISBN 978-0133892406. [Google Scholar]
  39. Alonso, C.; Gallego, D.; Honey, P. Los Estilos de Aprendizaje: Procedimientos de Diagnóstico y Mejora, 7th ed.; Mensajero: Bilbao, Spain, 2007; ISBN 978-84-271-1914-7. [Google Scholar]
  40. Estrada García, A. Estilos de aprendizaje y rendimiento académico. Rev. Bol. Redipe 2018, 7, 218–222. [Google Scholar]
  41. Smith, R.M. Learning How to Learn: Applied Theory for Adults, 1st ed.; Open University Press: Milton Keynes, UK, 1988; ISBN 9780335105854. [Google Scholar]
  42. Camarero Suárez, F.; Martín del Buey, F.; Herrero Diez, J. Estilos y estrategias de aprendizaje en estudiantes universitarios. Psicothema 2000, 12, 615–622. [Google Scholar]
  43. Keefe, J.W. Profiling and Utilizing Learning Style; NASSP Learning Style Series; ERIC: Stockholm, Sweden, 1988; ISBN 978-0882102078. [Google Scholar]
  44. Honey, P.; Mumford, A. The Manual of Learning Styles; Peter Honey Associates: Maidenhead, Berkshire, 1986; ISBN 978-0950844473. [Google Scholar]
  45. Pierart, C.G.A.; Pavés, F.R. Estilos de aprendizaje, género y rendimiento académico. Rev. Estilos Aprendiz. 2011, 4, 71–84. [Google Scholar] [CrossRef]
  46. Pashler, H.; McDaniel, M.; Rohrer, D.; Bjork, R. Learning Styles: Concepts and Evidence. Phycol. Sci. Public Interest 2008, 9, 105–119. [Google Scholar] [CrossRef]
  47. Lindsey, C.K.; Edwards, M.; Douglass Smith, M. Use of Learning Style Frameworks in Health Science Education. Am. J. Pharm. Educ. 2020, 84, 919–927. [Google Scholar] [CrossRef]
  48. Joswick, C.; Skultety, L.; Olsen, A.A. Mathematics, Learning Disabilities, and Learning Styles: A Review of Perspectives Published by the National Council of Teachers of Mathematics. Educ. Sci. 2023, 13, 1023. [Google Scholar] [CrossRef]
  49. Coffield, F.; Moseley, D.; Hall, E.; Ecclestone, K. Learning Styles and Pedagogy in Post-16 Learning: A Systematic and Critical Review; Learning and Skills Research Centre: London, UK, 2004. [Google Scholar]
  50. Rayner, S.; Cools, E. (Eds.) Style Differences in Cognition, Learning and Management; Routledge: New York, NY, USA, 2011; ISBN 9781136901638. [Google Scholar]
  51. Xu, W. Learning Styles and Their Implications in Learning and Teaching. Theory Pract. Lang. Stud. 2011, 1, 413–416. [Google Scholar] [CrossRef]
  52. Pantoja Ospina, M.A.; Duque Salazar, L.I.; Correa Meneses, J.S. Learning Styles Models: An upgrade for their revision and analysis. Rev. Colomb. Educ. 2013, 64, 79–105. [Google Scholar] [CrossRef]
  53. Owen, C.L. Understanding Design Research: Toward an Achievement of Balance. J. Jpn. Soc. Sci. Des. 1997, 5, 36–45. [Google Scholar] [CrossRef]
  54. Owen, C.L. Design Research: Building the Knowledge Base. Des. Stud. 1998, 19, 9–20. [Google Scholar] [CrossRef]
  55. Grasha, A.F.; Riechmann, S.W. Student Learning Styles Questionnaire; Faculty Resource Center, University of Cincinatti: Cincinatti, OH, USA, 1975. [Google Scholar]
  56. Ramanaiah, N.; Ribich, F.; Schmeck, R.R. Development of a Self-report Inventory for Assessing Individual Differences in Learning Processes. Appl. Psychol. Meas. 1977, 1, 413–431. [Google Scholar] [CrossRef]
  57. Marsick, V.J.; Watkins, K.E. Building the Learning Organization: A New Role for Human Resource Developers. Stud. Contin. Educ. 1992, 14, 115–129. [Google Scholar] [CrossRef]
  58. Entwistle, N.J. Styles of Learning and Teaching: An Integrated Outline of Educational Psychology for Student Teachers and Lecturers; David Fulton Publishers: London, UK, 1998. [Google Scholar]
  59. McCarthy, B. The 4MAT System: Teaching to Learning Styles with Right-Left Techniques; The Reading Teacher 35 (6) Barrington, Ill; Excel, Inc.: Lincolnton, NC, USA, 1987; ISBN 978-0960899203. [Google Scholar]
  60. Williams, L. Aprender Con Todo el Cerebro; Martínez Roca: Barcelona, Spain, 1986; ISBN 9788427010055. [Google Scholar]
  61. Myers, I.B. The Myers-Briggs Type Indicator: Manual; Consulting Psychologists Press: Washington, DC, USA, 1962. [Google Scholar]
  62. Argyris, C.; Schön, D.A. Organizational Learning: A Theory of Action Perspective; Addison-Wesley: Reading, MA, USA, 1978; ISBN 978-0201001747. [Google Scholar]
  63. McKee, D. An Organizational Learning Approach to Product Innovation. J. Prod. Innov. Manag. 1992, 9, 232–245. [Google Scholar] [CrossRef]
  64. Dunn, R.; Dunn, K. Teaching Students through Their Individual Learning Styles; Reston Publishing Company: Reston, VA, USA, 1978; ISBN 9780879098087. [Google Scholar]
  65. Fleming, N.D.; Mills, C. Not Another Inventory, rather a Catalyst for Reflection. Improv. Acad. 1992, 11, 137–155. [Google Scholar] [CrossRef]
  66. Fleming, N.D. Teaching and Learning Styles: VARK Strategies; N.D. Fleming: Christchurch, New Zealand, 2001; ISBN 9780473079567. [Google Scholar]
  67. Jolliffe, I.T.; Cadima, J. Principal Component Analysis, 2nd ed.; Springer: New York, NY, USA, 2002. [Google Scholar]
  68. Jolliffe, I.T.; Cadima, J. Principal component analysis: A review and recent developments. Philos. Trans. R. Soc. A 2016, 374, 20150202. [Google Scholar] [CrossRef]
  69. Baladrón, J.; Curbelo, J.; Sánchez-Lasheras, F.; Romeo-Ladrero, J.M.; Villacampa, T.; Fernández-Somoano, A. Examination of the MIR exam. An approach to the structural validity through the classical test theory. FEM J. Med. Educ. Found. 2016, 19, 217–226. [Google Scholar]
  70. Crocker, L.; Algina, J. Introduction to Classical and Modern Test Theory; CBS College Publishing: New York, NY, USA, 1986. [Google Scholar]
  71. Backhoff, E.; Larrazolo, N.; Rosas, M. Difficulty level and discrimination power of the Basic Skills and Knowledge Examination (EXHCOBA). Redie Electron. J. Educ. Res. 2000, 2, 1–16. [Google Scholar]
  72. Schober, P.; Boer, C.; Schwarte, L.A. Correlation Coefficients: Appropriate Use and Interpretation. Anesth. Analg. 2018, 126, 1763–1768. [Google Scholar] [CrossRef] [PubMed]
  73. García Cué, J.L.; Santizo Rincón, J.A.; Alonso García, C.M. Uso de las TIC de acuerdo a los estilos de aprendizaje de docentes y discentes. Rev. Iberoam. Educ. 2009, 48, 1–14. [Google Scholar] [CrossRef]
  74. Chistyakov, A.A.; Zhdanov, S.P.; Avdeeva, E.L.; Dyadichenko, E.A.; Kunitsyna, M.L.; Yagudina, R.I. Exploring the characteristics and effectiveness of project-based learning for science and STEAM education. Eurasia J. Math. Sci. Technol. Educ. 2023, 19, em2256. [Google Scholar] [CrossRef]
  75. Kokotsaki, D.; Menzies, V.; Wiggins, A. Project-based learning: A review of the literature. Improv. Sch. 2016, 19, 267–277. [Google Scholar] [CrossRef]
  76. Capraro, R.M.; Capraro, M.M.; Morgan, J.R. STEM Project-Based Learning: An Integrated Science, Technology, Engineering, and Mathematics (STEM) Approach; Sense: Rotterdam, The Netherlands, 2013; ISBN 978-94-6209-143-6. [Google Scholar]
  77. Battaglia, O.R.; Di Paola, B.; Persano Adorno, D.; Pizzolato, N.; Fazio, C. Evaluating the effectiveness of modelling-oriented workshops for engineering undergraduates in the field of thermally activated phenomena. Res. Sci. Educ. 2019, 49, 1395–1413. [Google Scholar] [CrossRef]
  78. Pizzolato, N.; Fazio, C.; Mineo, R.M.S.; Adorno, D.P. Open-inquiry driven overcoming of epistemological difficulties in engineering undergraduates: A case study in the context of thermal science. Phys. Rev. Spec. Top. Phys. Educ. Res. 2014, 10, 010107. [Google Scholar] [CrossRef]
  79. Battaglia, O.R.; Di Paola, B.; Fazio, C.; Pizzolato, N.; Adorno, D.P. A quantitative analysis of university student reasoning lines in the field of thermally activated phenomena. J. Phys. Conf. Ser. 2018, 1076, 012019. [Google Scholar] [CrossRef]
  80. Adorno, D.P.; Pizzolato, N.; Fazio, C. Long term stability of learning outcomes in undergraduates after an open-inquiry instruction on thermal science. Phys. Rev. Phys. Educ. Res. 2018, 14, 010108. [Google Scholar] [CrossRef]
Figure 1. Histogram with the ages (top) and the number of years at university (bottom) for initial test 1 (blue bars on the left) and final test 2 (orange bars on the right).
Education 14 00401 g001
Figure 2. The university entrance mark as a function of the number of correct answers in the initial test 1 (blue circles) and in the final test 2 (orange triangles).
Education 14 00401 g002
Figure 3. Comparison of the ease index (EI) given by Equation (1) for the answers to all the items of test 1 and test 2.
Education 14 00401 g003
Figure 4. Values of ease index given by Equation (1) for test 1 (blue bars) and test 2 (orange bars).
Education 14 00401 g004
Figure 5. Histograms with the qualitative tendencies of the students’ learning styles as prescribed by Table 4.
Education 14 00401 g005
Figure 6. Histograms with the qualitative tendencies of the students’ learning styles as prescribed by Table 4. (Top): Students that do not present preconception 1 of Table 1 related to a “misunderstanding between the concepts speed and acceleration”. (Bottom): Students who present this preconception.
Education 14 00401 g006
Figure 7. Same as Figure 6 for the preconception 12 of Table 1 related to the third law of Newton.
Education 14 00401 g007
Figure 8. Same as Figure 7 for the preconception 6 of Table 1 related to the necessity of force to have motion.
Education 14 00401 g008
Figure 9. Same as Figure 7 for the preconception 26 of Table 1 related to the influence of changes in the moment of inertia on angular velocity.
Education 14 00401 g009
Table 1. Classification of the preconceptions analyzed, and the corresponding erroneous questionnaire options that indicate their existence.
PreconceptionDescriptionIncorrect Answers Associated with Erroneous Preconceptions
I. Kinematics
1Misunderstanding of the concepts of velocity and acceleration4(a), 4(b), 4(d), 5(d), 6(a), 12(a), 12(b), 12(c)
II. Inertia
2Inertia due to a hit20(d), 13(b), 13(c)
3Loss or increment of initial inertia14(a), 16(a), 16(d)
4Energy dissipation17(c), 20(b)
III. Newton’s second law
5Only active bodies exert forces9(d), 11(d), 13(a)
6Motion only takes place under the presence of a force20(a)
7The absence of motion implies the absence of forces5(a), 9(d)
8Velocity is proportional to the force applied15(a), 19(a)
9Nonzero acceleration implies the existence of a variable force10(b)
10Force induces acceleration up to a maximum value10(a), 15(d), 19(c)
11A force acts until it is consumed15(c)
IV. Newton’s third law (action/reaction)
12The larger the mass, the larger the force applied.8(a), 8(c)
V. Superposition principle
13The largest force determines the movement11(a), 5(b)
14Motion is determined by a combination of forces14(c)
15The last force applied determines the motion14(b), 16(c)
VI. Active forces
16Obstacles do not exert forces9(a), 8(b)
VII. Resistive forces
17The mass of the self bodies makes them stop20(a), 20(b)
18Motion occurs when the force acting is greater than the resistance18(b), 18(d), 19(b)
19Resistance opposes force and inertia19(b)
VIII. gravitational forces
20Air pressure enhances the action of gravity9(c), 10(d), 11(d)
21Heavier objects fall down faster than lighter ones21(b), 21(d)
22Gravity increases as bodies fall10(b)
23There’s no gravity in space7(a), 7(c)
IX. Uncertainty
24Lack of knowledge when expressing the result of a measurement accompanied by its uncertainty1(a), 1(b), 1(d), 2(a), 2(b), 2(d), 3(a), 3(b), 3(d)
X. Center of mass
25Unclear understanding of the center of mass24(a), 24(b), 24(d)
XI. Rotational motion
26A change in the moment of inertia does not affect the angular velocity of the rotating object22(a), 22(b), 22(d)
27Unclear understanding between angular and linear velocity23(a), 23(b), 23(d)
Table 2. Concepts studied along with the respective correct answers to the test.
ConceptsCorrect Options
I. Kinematics
Uniformly accelerated rectilinear motion4(c)
Distinction between velocity and acceleration12(d)
Parabolic motion means constant acceleration14(d)
Constant acceleration implies change in velocity15(b), 4(c)
II. Superposition principle
Null resultant force implies rectilinear motion16(b)
Null resultant force implies constant velocity modulus17(a), 18(c), 11(b)
III. Newton’s second law
Constant forces imply constant accelerations14(d), 15(b)
IV. Newton’s third law
Newton’s third law for impulsive forces8(d)
V. Active forces
Forces between solids in contact11(b), 6(c), 9(b), 19(d)
Frictional force20(c), 18(c)
VI. Resistive forces
Air resistance13(d)
VII. Gravitational forces
Force of gravity9(b), 13(d), 5(c), 6(c), 7(b), 10(c), 11(b)
Weight is independent acceleration21(a)
VIII. Uncertainty
Correctly express the result of a measurement. Precision in measurements.1(c), 2(c), 3(c)
IX. Mass center
Center-of-mass concept24(c)
X. Rotational movement
Angular and linear velocity23(c)
Inertia moment22(c)
Table 3. The degree of difficulty of an item as a function of the value of the ease index (EI) according to the ref. [69].
EIDegree of Difficulty
0 to 0.30Too difficult (discard)
0.31 to 0.50Difficult
0.51 to 0.70Moderate
0.71 to 0.90Easy
0.91 to 1Too easy (discard)
Table 4. Qualitative tendency (very low, low, moderate, high, and very high) toward the different learning styles as a function of the number of points obtained in the Honey–Alonso questionnaire. Source: ref. [36].
Learning StyleVery LowLowModerateHighVery High
Activist0–67–89–1213–1415–20
Reflector0–1011–1314–1718–1920
Theorist0–67–910–1314–1516–20
Pragmatist0–89–1011–1314–1516–20
Table 5. Values of the ease index (EI) (1), the discrimination index (DI) (2), the difficulty index (Idiff) (3), and the Pearson product–moment correlation (P) for each item and its mean value for the whole (bottom) initial test 1 (left) and test 2 (right) carried out at the end of the quarter. ∆% indicates the difference between the number of correct answers between test 2 and test 1, expressed as a percentage. Asterisks (*) highlight the items which are considered the most reliable ones, as they satisfy 0.3 < EI < 0.7, DI > 0.3, 0.3 < Idiff < 0.7, and P > 0.3.
Test 1Test 2
Item % EIDIIdiffPEIDIIdiffP
131.50.40 *0.42 *0.60 *0.44 *0.710.370.29 *0.32 *
2−2.00.050.090.950.520.03−0.050.97−0.05
315.50.58−0.140.420.090.740.110.260.27
42.10.160.140.840.090.180.160.820.21
50.30.02−0.050.98−0.090.030.050.970.13
621.80.260.230.740.080.470.110.530.28
7−0.80.140.090.860.290.130.260.870.51
86.30.280.090.720.330.340.260.66 *0.39 *
921.00.40 *0.33 *0.60 *0.36 *0.610.160.39 *0.30 *
10−4.10.490.230.51 *0.30 *0.450.050.550.29
11−3.70.120.050.88−0.070.080.050.920.06
129.40.120.140.880.190.210.210.790.06
13−0.20.190.090.810.190.180.160.820.06
1436.70.190.090.810.190.550.160.450.02
158.30.230.280.770.280.320.210.68 *0.38 *
163.90.090.090.910.310.130.160.870.43
173.20.44 *0.42 *0.56 *0.40 *0.47 *0.32 *0.53 *0.47 *
1812.10.120.140.880.070.24−0.050.76−0.08
192.90.020.050.980.090.050.110.950.36
20−8.60.35 *0.42 *0.65 *0.49 *0.260.530.740.48
2115.60.190.000.810.400.340.050.660.15
2215.90.210.050.790.100.37 *0.42 *0.63 *0.37 *
2325.60.35 *0.42 *0.65 *0.56 *0.610.050.390.28
2420.00.120.140.880.410.320.110.68 *0.36 *
Mean value9.700.230.160.770.250.330.160.670.25
Table 6. Contents involved in the tests and items where they appear, along with the total and percentage of correct answers and their ease index, EI, for the initial test 1 and the final test 2, and the Hake factor, h.
Test 1Test 2
ContentsRelated ItemsNo.%EINo.%EIh
Kinematics4.12, 14.153017.40.174831.60.320.17
Newton’s first law11, 13, 14, 15, 16, 17, 18, 207421.50.228528.00.280.08
Second law of Newton5, 9, 10, 11, 14, 15, 19, 207822.70.238929.30.290.09
Newton’s third law81227.90.281334.20.340.09
Superposition principle5, 11, 14, 16, 182310.70.113920.50.210.11
Types of forces5, 6, 7, 9, 10, 11, 13,18,19, 20, 219820.70.2110825.80.260.06
Expression of a measure1, 2, 34434.10.345649.10.490.23
Mass center24511.60.121231.60.320.23
Rotatory motion22, 232427.90.283748.70.490.29
Disclaimer/Publisher’s Note: The statements, opinions and data contained in all publications are solely those of the individual author(s) and contributor(s) and not of MDPI and/or the editor(s). MDPI and/or the editor(s) disclaim responsibility for any injury to people or property resulting from any ideas, methods, instructions or products referred to in the content.

