Abstract
As the digital age permeates higher education, the cybersecurity awareness of university students has emerged as a pressing concern. This study examines the behavioral factors influencing students’ cybersecurity practices, developing a robust, empirically validated survey. Our research applies a comprehensive framework employing both exploratory and confirmatory factor analyses (EFA; CFA) to affirm the survey’s ability to capture the intricate dimensions of students’ cybersecurity awareness. A structural equation model (SEM) has been developed to delineate and scrutinize five key dimensions of cybersecurity behaviors within the student body. Post-validation, we utilized this model to conduct a thorough comparative analysis of cybersecurity behaviors among members of the varied student demographic that participated in the survey. The investigation included an examination of behavior across genders, age groups, academic disciplines, and cultural backgrounds, shedding light on the diverse cybersecurity behaviors that define the modern student experience. Our research ultimately strives to contribute to the enhancement of digital security in educational environments, aligning student online practices with robust security measures and nurturing a cybersecurity-aware culture in academia.
1. Introduction
In the dynamic digital environment of modern higher education, understanding cybersecurity awareness among university students is increasingly critical. The expansion of online educational platforms and digital tools emphasizes the need for strong cybersecurity measures for students, who face growing vulnerabilities to cyber threats given their substantial online interactions.
This study investigates the behavioral factors related to cybersecurity within this vital group by employing a rigorously developed and statistically verified survey. It implements a detailed methodological framework that incorporates both exploratory and confirmatory factor analyses (EFA and CFA) to validate the recommended survey’s capacity to accurately reflect the complex dimensions of cybersecurity awareness among university students.
In our research, the tools of structural equation modeling (SEM) were used to discern and examine the essential aspects of cybersecurity practices among the student population. Confirmatory factor analysis, as part of structural equation modeling, is applied to test those hypotheses that the relationships among variables exist as specified by the proposed model.
After validating the model, we embarked on an exhaustive analysis that leveraged this framework to compare and contrast cybersecurity behaviors across diverse student demographics that participated in the survey. We assessed variations and commonalities along gender lines, delved into behavioral tendencies across age categories—namely, students under 25, those aged 25 to 40, and those above 40—and considered how different academic fields, specifically science and technology versus social sciences and humanities, might shape cybersecurity conduct. Furthermore, we investigated how language and cultural backgrounds—contrasting English-speaking international students with Hungarian students—affect cybersecurity practices. These kinds of comparative analyses are crucial for unraveling the complex tapestry of cybersecurity behavior patterns prevalent among the student populace.
Through this study, we aim to contribute to the creation of safer digital spaces that support the educational aspirations and online activities of university students, thereby enhancing the overall security posture of educational institutions in the digital age.
2. Literature Review
Information security hinges on safeguarding confidentiality, integrity, and availability, known as the C-I-A triangle [1], with non-repudiation and authenticity also critical [2,3,4]. Cybersecurity revolves around the interplay of users, systems, and usability, and addressing the significant risks posed by user non-compliance is crucial [5,6,7,8,9,10]. Effective information security awareness (ISA), which encompasses an understanding of security protocols and personal responsibilities [1], is vital for organizational safety [11,12,13]. Strengthening ISA involves not just assessing awareness levels but also evaluating the impact of security initiatives to reduce user errors and bolster security practices [14,15].
Reference [16] identified three critical components of information security awareness (ISA): “Perception”, “Protection”, and “Behavior”. Currently, ISA assessment primarily relies on the knowledge-attitude-behavior (KAB) model, utilizing methods like questionnaires, interviews, and behavior tests, among others [17]. However, the knowledge aspect of these models faces validation challenges, highlighting the need for clearer knowledge definitions [18] and resulting in lengthier assessment tools due to their multidimensional nature.
Reference [19] called for greater methodological precision in ISA measurement scales, identifying nine dimensions and 34 sub-dimensions critical to ISA but underrepresented in research. Among these, password management was most assessed, while mobile device security and incident reporting were less emphasized. Research also focuses on mitigating identity theft risks among youth, a group particularly vulnerable to cyber threats, underscoring the importance of effective cybersecurity awareness education for this demographic [10,20].
Reference [21] explored information security awareness (ISA), finding it deeply rooted in ‘cultural’ perceptions and individual ‘conscience’ rather than mere ‘knowledge’. This view of ISA as an ingrained habit underscores its significant impact on daily activities. Yet, aspects like security processes, training, asset protection, prevention, and awareness of vulnerabilities were less unanimously recognized, with only a small fraction linking ISA directly to business operations. This highlights the crucial need for organizations to integrate security awareness with business goals to enhance management and employee engagement in preventing security incidents.
Reference [22] introduced a methodical tool for ISA assessment, emphasizing the development of a question bank, manager consultations for importance weightings, practical data integration, and tool automation.
The imperative to accurately assess ISA is clear, advocating for the use of detailed, reliable, and context-aware tools. Surveys globally indicate varied levels of ISA among young people and university students, pointing out specific areas for improvement. References [22,23,24,25] reported on ISA levels within Middle Eastern, Californian, Indian, and Nigerian educational contexts, respectively, each identifying unique challenges like password management and the application of security principles, underscoring the global necessity for enhanced cybersecurity education.
Reference [15] found that students in both Hungary and Vietnam lack sufficient material knowledge in information security, pointing to a universal educational need. Similarly, reference [26] identified South African students as being at risk for cyberattacks due to cognitive dissonance among key factors. In Turkey, reference [27] reported a lack of awareness among students regarding information security and computer usage, increasing their vulnerability to online threats.
Reference [28] proposed a comprehensive cyber-awareness strategy, including attitude and behavior assessments, self-diagnosis questionnaires, and educational plans, successfully applied in a junior high school setting.
Parsons et al.’s Human Aspects of Information Security Questionnaire (HAIS-Q) [29] investigated Australian employees’ policy knowledge, attitudes, and computer use behaviors. Their study showed that understanding policies significantly influences attitudes more than behaviors.
References [30,31] investigated some specific aspects of university students’ cyber security awareness using basic statistical technics in their analyses.
Our study builds upon Erol et al.’s establishment [32] of the “Personal Cyber Security Provision Scale” (PCSPS), aimed at gauging cybersecurity behaviors through a framework of five factors and 25 items. While this scale has found utility in a range of studies, such as those by references [9,28,33,34,35,36,37,38], its applicability within the academic sphere is limited, partly due to the method of participant selection via social media, which yielded a sample diverse yet not specifically representative of university student populations. Moreover, the statistical validation measures employed for the PCSPS hover near the threshold of acceptability, further complicating the direct application of their findings to the higher education context. This emphasizes the need for meticulous methodological and statistical rigor when adapting such tools for understanding cybersecurity awareness among university students.
The factors of this “Personal Cyber Security Provision Scale” (PCSPS) and the behavioral patterns attributable to the factors will be compared with the factors obtained from our own analysis (Section 5).
3. Circumstances of the Survey, Data
In this research, we assessed university students’ online behavior concerning cybersecurity. The set of questions that served as a starting point to select those that are relevant for the given purpose and effectively measure the level of cybersecurity awareness among university students consisted of the following 25 questions in the form of statements.
- I make sure all my internet passwords are the same. (R)
- I reply to authentication messages (requests such as username, password, etc.) received by e-mail. (R)
- I communicate with people I don’t know using a webcam. (R)
- I share my personal information (Identity no, Date of birth, GSM no, etc.) on the internet, when necessary. (R)
- I open email attachments from people who I do not know. (R)
- I share my personal information on social networks. (R)
- I declare my location on the internet. (R)
- I shop by clicking the ads on social networks. (R)
- I set easy to remember passwords. (R)
- I respect and respond to e-mails (requests such as card numbers, passwords, etc.) from sites such as banks, online shopping sites, etc. (R)
- I ignore online money and credit requests.
- I do not accept friendship requests from people I do not know on social networks.
- I do not subscribe to websites that I do not trust.
- I do not download files from websites that I do not trust.
- I check connection security and certificates on web pages.
- I update the software that I use.
- I have antivirus software on my computer.
- I avoid using weak passwords.
- I change web browser security settings.
- I conduct internet banking transactions using my personal computer.
- I shop online using my personal computer.
- I pay attention not to store my personal information on computers other than my personal computer.
- I delete web browser history.
- I log out of my accounts such as social media, e-mail when I finish my work.
- I change the passwords that I use on the internet.
In the following, when we refer to each question, we will use the notation Q1, …, Q25.
The statements could be answered on a 5-point Likert scale: (1) never, (2) rarely, (3) sometimes, (4) often, (5) always. The first ten were reversed statements (R); accordingly, the Likert scores for these were reversed during the analysis. The remaining fifteen statements were straight.
In addition, the questionnaire included three demographic questions regarding the respondent’s gender, age, and field of study.
The studied population consisted of university students from several Hungarian Universities: University of Dunaújváros, Budapest Business School, Ludovika University of Public Service, and Óbuda University. Filling out the questionnaire was voluntary. Both full-time and part-time students filled out the questionnaire. We received 638 valid responses. Answers came from students representing many disciplines of study, for example, natural sciences, human sciences, public service, IT, engineering, pedagogy, sports sciences, medical and health sciences, and social sciences. While analyzing the relationship between the mentioned disciplines and cybersecurity awareness, in some cases, it seemed appropriate to group similar fields of study into two broad disciplinary groups: 519 students were in science and technology, and 119 in social sciences and humanities.
We received answers in Hungarian and English, of which Hungarian totaled 565 and English 73. English-speaking students study in Hungary either with the help of Erasmus or other scholarship programs or are self-financed. The nationalities of the respondents were diverse: Chinese, Turkish, Portuguese, etc. Of the respondents, 272 were women, and 366 were men. Even though we examined university students, we did not only reach the 18–25 age group with the questionnaire. Since the respondents included correspondence learners and postgraduate students, the oldest respondent was 60 years old. There were 255 respondents under 25 years old, 230 between 25 and 40, and 146 over 40.
We used Google Forms to collect data and IBM SPSS Statistics V29, IBM SPSS AMOS V29 and Minitab V22 applications for data analysis.
4. Data Analysis. Assessing Construct Validity and Reliability
4.1. Exploratory Factor Analysis
Exploratory Factor Analysis (EFA) is a statistical technique used to uncover the underlying structure of a relatively large set of variables. EFA is a critical tool in the scale development process, as it helps in identifying the number of contributing latent factors and in understanding how observed variables relate to these factors (factors sometimes will be called components, constructs, or dimensions). It is particularly useful when the research does not presuppose an underlying structure or when a theoretical structure is not well-defined. In the context of assessing cybersecurity behaviors among university students, EFA was employed to explore potential dimensions within the data, allowing for the emergence of factor structures that can provide insights into the patterns of students’ online security practices. This method not only facilitates the identification of coherent clusters of behaviors but also aids in refining the questionnaire by determining the items that best represent each factor.
The EFA via principal component analysis (PCA) revealed a five-factor (five-component) structure that underpins the cybersecurity behaviors of university students. (Table 1). These five components with eigenvalues greater than one explain a substantial portion of the variance in the response data, with the first component accounting for 25.237%, the second 10.894%, and so forth, cumulating to a total of 60.922% of the variance explained by these factors.

Table 1.
Total Variance Explained.
In examining the Pattern Matrix in Table 2, we find the factor loadings following a Promax rotation with Kaiser Normalization. A factor loading is a coefficient that represents the correlation between an observed variable and a latent factor, indicating the extent to which the variable contributes to or is associated with that factor. Promax is an oblique rotation technique that allows for the factors to correlate. Such correlation is consistent with the notion that behaviors in cybersecurity are not independent but interrelated.
Table 2.
Pattern Matrix.
Questions that did not load sufficiently on any factor (factor loading < 0.4) [39,40] and were therefore excluded from the factor structure included Q1, Q2, Q3, Q5, Q7, Q8, Q11, Q12, Q17, and Q22. Their exclusion suggests that these behavioral items either do not correlate strongly with the defined dimensions of cybersecurity awareness or may overlap with other survey items, reducing their usefulness in the final questionnaire. This refinement results in a more robust and focused measure that can effectively assess the specific domains of cybersecurity awareness behavior pertinent to university students.
4.1.1. Factor 1: Proactive Protection Behaviors
The first factor captures the actions users take to actively protect their systems and data. Items Q15 (checking connection security and certificates on web pages) and Q16 (updating the software in use) are indicative of this proactive cybersecurity behavior.
4.1.2. Factor 2: Personal Information Protection
This factor is characterized by a tendency to share personal information in various online settings, evident in the items Q4 (sharing personal information on the internet when necessary), Q6 (sharing personal information on social networks), Q9 (setting easy--to-remember passwords), and Q10 (respecting and responding to emails from banks and online shopping sites).
4.1.3. Factor 3: Secure Online Habits
This factor represents the habitual practices that contribute to maintaining one’s online security, as reflected by Q23 (deleting web browser history), Q24 (logging out of accounts like social media and email), and Q25 (changing passwords used on the internet).
4.1.4. Factor 4: Financial Cybersecurity Awareness
This factor pertains to secure practices in managing financial transactions online. It is distinctly characterized by Q20 (conducting internet banking transactions using a personal computer) and Q21 (shopping online using a personal computer), pointing to an awareness of the risks involved in online financial activities.
4.1.5. Factor 5: Cautious Online Engagement
High loadings for Q13 (not subscribing to untrusted websites) and Q14 (not downloading files from untrusted websites) define this factor, which relates to cautious behavior in online interactions, demonstrating vigilance in web navigation and interactions.
In this exploratory analysis, Cronbach’s alpha for the overall reliability of the questionnaire with these 15 remaining questions was 0.780, which is good. However, the alpha values calculated separately for each factor varied (0.680; 0.595; 0.673; 0.813; 0.573). The low values for the second and fifth factors are of particular concern, as they suggest that these factors do not necessarily measure a single coherent construct.
The chosen 15 questions that were retained from the original 25 are associated with the use of Promax rotation in the EFA. This oblique rotation method permits correlations among the identified factors. The Component Correlation Matrix, presented in Table 3, clarifies the interconnections between these components, highlighting the importance of these relationships in grasping the complex dimensions of cybersecurity awareness.
Table 3.
Component Correlation Matrix.
The presence of correlations between factors—such as the moderate correlation of 0.457 between Components 1 and 3—implies that the cybersecurity behaviors measured by these components are distinct yet related. It validates the need for an oblique rotation, as the factors are not orthogonal (independent) but have a degree of overlap, which is realistic in behavioral research where constructs often interplay. For example, the way students share personal information (Factor 2) could be related to their habits in managing online presence (Factor 3). This interdependence of the factors underlines the need to use structural equation modeling and Confirmatory Factor Analysis, with their additional tools, to fine-tune and finalize the factor structure proposed by EFA.
4.2. Confirmatory Factor Analysis
CFA will enable us to test the validity of the factor structure derived from EFA, with the same allowances for inter-factor correlations as indicated by the Promax rotation. Importantly, CFA has many more tools to find the best fitting model. It also allows for the modeling of correlations between error terms associated with observed variables. By incorporating these correlations into the model, we can achieve a more nuanced understanding of the data structure and potentially improve the model’s fit. This feature of CFA is vital for constructing a measurement model that reflects the complex reality of the constructs being assessed, providing a clearer and more accurate representation of the underlying framework.
4.2.1. The Path Diagram
In the realm of structural equation modeling, a path diagram serves as a graphical representation, elucidating the hypothesized relationships among observed and latent variables. Latent variables are depicted through circles or ovals, whereas observed variables, those that are measurable, are represented by squares or rectangles. In our survey-based study, observed variables refer to the responses to survey questions.
The diagram’s arrows denote the directional influence between variables, with one-way arrows suggesting a hypothesized causal relationship from one variable to another, and two-way arrows signifying correlations. Path coefficients, placed alongside these arrows, quantify the relationship’s strength and direction, akin to regression coefficients, indicating the expected change in the dependent variable per unit change in the independent variable, all else being constant. Error terms, marked with circles and labeled “e”, account for unexplained variance in the observed variables, highlighting the model’s imperfections. Additionally, correlations among exogenous variables (those not affected by other variables within the model) are represented by curved two-way arrows. Through these elements, a path diagram provides a comprehensive overview of the theoretical underpinnings proposed to explain the relationships observed within the data, serving as a crucial interpretative tool in SEM analysis.
In Figure 1, the path diagram presents the final version of the structural equation model following a comprehensive selection process that tried to identify the best hypothesized model. It is interesting to note that Q9 (regarding the use of easy-to-remember passwords) and Q19 (changing web browser security settings) showed lower associations with their intended factors and were excluded. This observation suggests that the related underlying factors may be more effectively measured by the other, more-focused questions.
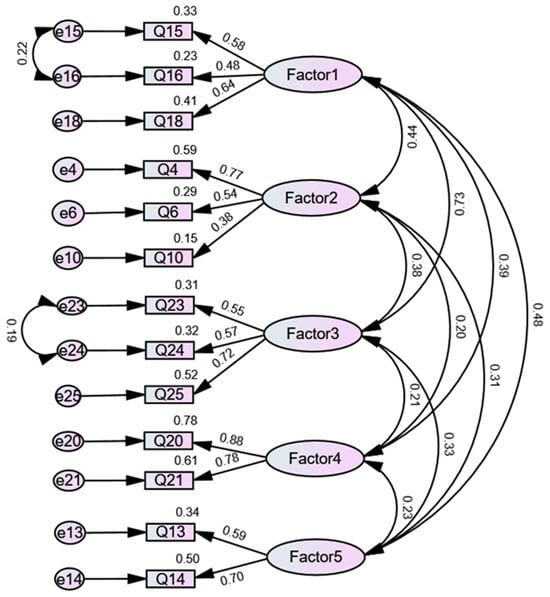
Figure 1.
The Path Diagram.
In the provided diagram, error terms of some items within the same factor are correlated. This is represented by curved arrows connecting the error terms. These correlations between error terms imply that there are unique variances shared between these items that the latent factors do not account for. Such correlations might indicate the presence of method effects or item-specific variance due to similarities in question wording or response style.
4.2.2. Model Fit
The model fit analysis presented excellent results. With a Chi-square value of 67.791 at 53 degrees of freedom and a significance level of 0.083, our model surpassed the threshold for acceptable fit, evidenced by a CMIN/DF ratio of 1.279, well within the commonly accepted 1–3 range. This suggests a good fit between our hypothesized model and the observed data.
Further corroborating the model’s excellent fit, the Root Mean Square Error of Approximation (RMSEA) was notably low at 0.021, with a confidence interval ranging from 0.000 to 0.034, and a Probability of Close Fit (PCLOSE) of 1.000. Such RMSEA values are well below the generally accepted upper limit of 0.05, indicative of a well-fitting model. Additionally, both the Goodness of Fit Index (GFI) and the Comparative Fit Index (CFI) showcased the model’s robustness with high scores of 0.984 and 0.991, respectively. These indices exceed the commonly accepted benchmarks for good fit, typically above 0.95, highlighting the model’s capacity to accurately represent the constructs of cybersecurity awareness. The Parsimonious Goodness of Fit Index (PGFI), at 0.573, further supports the model’s efficiency, aligning with accepted standards for adequacy that suggest a model’s effective use of degrees of freedom in explaining the variance observed. Together, these measures emphatically reinforced the model’s comprehensive efficacy in capturing the complex dimensions of cybersecurity awareness.
Moreover, the Adjusted Goodness of Fit Index (AGFI), at 0.972 and the Tucker–Lewis Index (TLI), also known as the Non-Normed Fit Index (NNFI), at 0.986, further affirmed the model’s robustness. These values surpassed the usually accepted thresholds for an excellent model fit, with AGFI values ideally exceeding 0.9 and TLI/NNFI values above 0.95 being indicative of a good fit. The relatively low Normed Fit Index (NFI) and the Relative Fit Index (RFI), standing at 0.959 and 0.940, respectively, although slightly lower than AGFI and TLI, still reflected a favorable fit. These figures remained well within the acceptable range for indicating a sound model fit to the observed data, typically regarded as values above 0.9.
Due to some non-normality of responses inherent in Likert-scale data, the model parameters were rigorously verified through bootstrapping. This technique, which resamples the dataset to estimate the distribution of statistical estimates, provided a robust means to validate the model.
This comprehensive fit assessment underscored the structural integrity of our SEM in analyzing cybersecurity practices, demonstrating its potential as a valuable tool for understanding and enhancing cybersecurity awareness in academic settings.
4.2.3. Model Fit across Cultural and Demographic Groups
The sample of respondent students encompassed a diverse array of population segments. While the model showed an excellent fit to this composite mix, drawing conclusions for specific segments necessitated a separate verification process. It is crucial to ensure that the model’s structural validity extends to each individual layer, allowing for accurate and meaningful interpretations within distinct population subsets.
A multi-group CFA was performed using the sample of university students, divided into four distinct analyses:
- Gender: Female vs. male.
- Age Group: Individuals under 25 years old, those between 25 and 40, and those over 40.
- Academic Discipline: Students within science and technology fields versus those studying social sciences and humanities.
- Language and Cultural Background: English-speaking foreign students versus Hungarian students.
The structural equation model showcased excellent fit across groups differentiated by gender, academic disciplines, and language, albeit with nuanced differences. For gender, the model demonstrated a compelling fit, indicated by a CMIN/DF of 1.273 and a high CFI of 0.976, suggesting its robust applicability across male and female groups. In the academic disciplines analysis, a slightly higher CMIN/DF of 1.356 still maintained a strong fit with a CFI of 0.968, affirming its consistency across various fields of study. Language group analysis further confirmed the model’s effectiveness, with a CMIN/DF of 1.154 and an impressive CFI of 0.986, highlighting its adaptability to linguistic diversities.
However, the multi-group analysis unveiled a notable distinction in model applicability across age groups, particularly underscoring the model’s limitations when applied to individuals over 40 years of age. This discrepancy was evidenced by significant deviations in key fit indices for this age group, suggesting that the underlying theoretical constructs and their relationships as captured by the model do not hold as strongly for this demographic. In contrast, for the younger segments—those under 25 and those between 25 and 40—the model demonstrated excellent fit, characterized by strong Comparative Fit Index (CFI) values near 0.980 and Root Mean Square Error of Approximation (RMSEA) values well below the 0.05 threshold, indicating a close fit with the observed data.
This divergent model performance suggests that the experiences, perceptions, or behaviors related to the model’s focus area may fundamentally differ in the over-40 age group, pointing to the possibility of age-related contextual factors not accounted for in the current model. This discrepancy highlights the necessity for further research tailored specifically to this older demographic to identify which distinct model or set of constructs may better capture the nuances of their experiences. The need for a distinct model for those over age 40 emphasizes the importance of considering age-specific influences, which may include generational differences in technology use, privacy concerns, or risk perceptions, requiring a dedicated investigation to adequately model these factors.
Reflecting on the insights garnered from this age group analysis, we refined our structural equation modeling approach by recalibrating the model parameters to exclude observations from individuals over 40 years of age. The refined, re-tuned final model was optimized for the younger cohorts—those under age 25 and those between ages 25 and 40. Plans to extend this research to develop and validate a separate model specifically for those over age 40 are in place, acknowledging the distinct experiences and perspectives that may influence cybersecurity behaviors in older cohorts.
This strategic adjustment resulted in a model that exhibits excellent fit indices, confirming its robustness and the validity of the underlying theoretical constructs for the included age groups. Specifically, for the unconstrained model, a Comparative Fit Index (CFI) of 0.986, alongside a Root Mean Square Error of Approximation (RMSEA) of 0.018 and a CMIN/DF of 1.154, underscored the model’s strong alignment with the younger demographic’s data.
This re-tuned model served as our final framework for further analysis, representing a deliberate shift towards a more focused examination of cybersecurity awareness and behaviors among university students under age 40.
4.3. Final SEM Model: Corrected Loadings and Correlations
As a result of the analyses, the following factors and their associated questionnaire items in Table 4 were identified as those that can adequately measure the cybersecurity awareness of university students using the model presented in the path diagram of Figure 1.
Table 4.
The Finalized Factors and the Corresponding Items.
In Table 5, we present the factor loadings of the finalized model, which detail the strength and direction of the relationships between observed variables and their underlying latent factors. This table provides a comprehensive overview of how each variable contributes to the conceptual constructs within our refined SEM framework.
Table 5.
The Finalized Factors and the Standardized Regression Coefficients.
Table 6 summarizes the correlation coefficients of the finalized model, offering insights into the interrelations among the latent factors themselves. These coefficients are crucial for understanding the dynamics and interactions that underpin the model’s structure, revealing the degree to which factors are interdependent or distinct within the context of our study.
Table 6.
Interrelations among the Latent Factors.
4.4. Comparisons
4.4.1. Factor Scores
Factor scores are numerical values that represent an individual’s position in terms of the latent variables identified in a dataset through factor analysis. They are useful for comparing how different groups or individuals score on these underlying dimensions. Comparing the distribution of factor scores across factors is reasonable and informative, as it can illustrate the relative emphasis or neglect of certain behaviors within a population. In the context of cybersecurity behaviors among university students, analyzing the distribution of factor scores can reveal which cybersecurity practices are more prevalent or lacking across the student body, thereby identifying focal points for educational interventions or policy development.
To compute the factor scores for a specific individual based on the weights provided (Table 7), a systematic methodology involving weighted summation is employed. This procedure transforms observed variable responses into quantifiable measures of latent constructs, as delineated by the factor weights. Specifically, for each factor, the individual’s response to a given item (e.g., responses to Q4, Q6, Q10, …, Q25) is multiplied by the corresponding factor weight. The sum of these products yields the individual’s factor score, encapsulating their alignment with the underlying latent construct.
Table 7.
Factor scores for a Specific Individual.
For illustrative purposes, consider the calculation of an individual’s score on Factor1. This is achieved by multiplying the individual’s response to each item (Q4 through Q25) by the respective factor weight for Factor1 (0.044 for Q4, 0.029 for Q6, etc.) and summing the resultant products:
Factor1 score = (Response to Q4 × 0.044) + (Response to Q6 × 0.029) + … + (Response to Q25 × 0.138).
This computation is iteratively applied for each factor, thereby deriving scores across Factor1 through Factor5 using their respective weights. Through this methodological approach, individual responses are seamlessly translated into scores reflective of the latent constructs, facilitating nuanced analysis within the structural equation modeling framework.
4.4.2. Comparing Mean and Median Factor Scores
The summary statistics in Table 8 and the boxplot in Figure 2 provide a comparative analysis of factor scores across the five key areas of cybersecurity behaviors. Factor 2, which reflects Proactive Protection Behaviors, and Factor 4, indicating Financial Cybersecurity Awareness, had the highest mean scores of 4.02669 and 4.03058, respectively, suggesting that students demonstrated a higher level of engagement in both proactive cybersecurity measures and protective financial online behaviors. The medians for these factors, at 4.13073 and 4.35917, further underscore this point, showing that the central tendency of student scores was skewed towards higher engagement in these areas.
Table 8.
Summary Statistics.
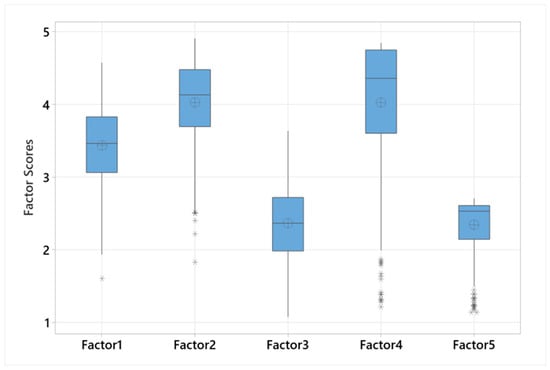
Figure 2.
Boxplot of Factor Scores.
On the other hand, Factor 3 and Factor 5, corresponding to Secure Online Habits and Cautious Online Engagement, had the lowest mean scores of 2.36602 and 2.34421, respectively, indicating a lower level of engagement. Their respective medians reinforced this observation, aligning closely with their means.
Factor 1, associated with Personal Information Protection, sat in the mid-range with a mean of 3.43656, indicating a moderate level of protection among students. The median of 3.46329 was consistent with the mean, suggesting a balanced approach to sharing personal information online.
The standard deviation values provide additional context: Factor 4 showed the most significant variability in scores (0.901874), pointing to differing levels of financial cybersecurity awareness among students, while Factor 5 had the least variability (0.372016), suggesting more consistent behavior in cautious online engagement.
In essence, the statistics revealed that students are more vigilant about proactive protection and financial security online, yet there seems to be room for improvement in habitual online security practices and consistent caution in their online interactions.
In what follows, a detailed analysis of the scores on each factor by Gender, Age Group, Academic Discipline and Language and Cultural Background was conducted to identify statistically significant differences between group means.
4.4.3. Gender Comparison of Factor Scores
The interval plot in Figure 3 illustrates the differences between male and female mean scores across the five cybersecurity factors, with non-overlapping intervals suggesting significant gender differences and overlapping intervals indicating non-significant differences. The confidence level was 95%.
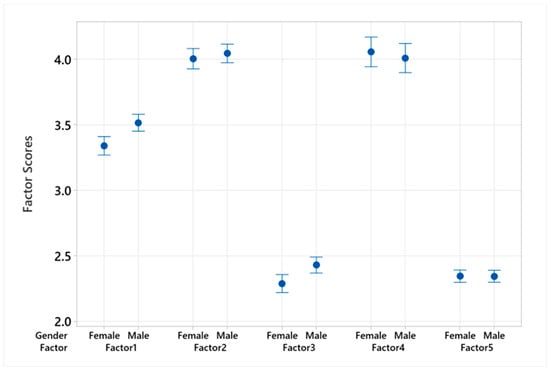
Figure 3.
Interval Plot of Factor Scores by Gender Across Different Cybersecurity Factors.
For Factor 1 (Proactive Protection Behaviors) and Factor 3 (Secure Online Habits), we found significant differences between genders. Females exhibited lower mean scores in Proactive Protection Behaviors, with a mean of 3.340 compared to males at 3.516, resulting in a t-value of −3.64 (p < 0.001). This indicated that male students might be engaging more frequently in behaviors such as updating software and checking security certificates. Similarly, in Secure Online Habits, female students scored lower (Mean = 2.288) than male students (Mean = 2.430), with a t-value of −3.04 (p = 0.002), suggesting a divergence in behaviors like deleting browser history and managing passwords.
Conversely, Factors 2 (Personal Information Protection), 4 (Financial Cybersecurity Awareness), and 5 (Cautious Online Engagement) showed no statistically significant differences between genders. The slight differences in means for Factor 2 (females: 4.004, males: 4.045; t-value = −0.76, p = 0.449), Factor 4 (females: 4.057, males: 4.009; t-value = 0.59, p = 0.556), and Factor 5 (females: 2.345, males: 2.344; t-value = 0.02, p = 0.987) were not sufficient to suggest gender-specific trends. This implied a generally uniform approach to managing personal information, engaging with financial cybersecurity, and exercising caution in online environments.
In summary, while significant gender differences were evident in proactive protection and secure habits, suggesting a need for gender-targeted cybersecurity interventions, the negligible differences in personal information management, financial awareness, and cautious engagement indicated these are areas of cybersecurity behavior where both genders perform similarly. This analysis underscores the complexity of cybersecurity behaviors and the importance of considering gender as a potential factor in cybersecurity education and policy development [7,41,42,43,44,45,46,47].
4.4.4. Age Group Comparison of Factor Scores
In examining the disparities in cybersecurity factor scores between different age groups, our analysis revealed a discernible pattern across the spectrum of behaviors related to cybersecurity awareness. See in Figure 4.
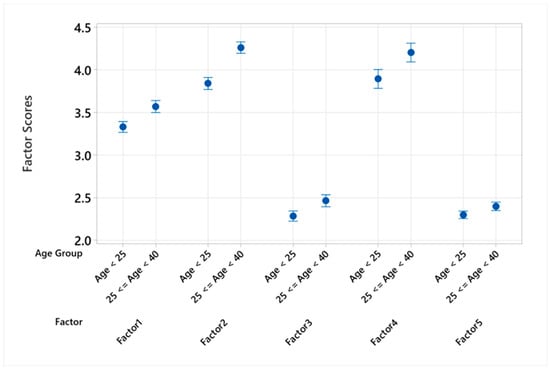
Figure 4.
Interval Plot of Factor Scores by Age Group Across Different Cybersecurity Factors.
Significantly, older students within the 25 ≤ Age < 40 age group exhibited higher mean scores across all factors when compared to their younger counterparts aged below 25. This divergence was particularly pronounced in Factor 2 (Personal Information Protection), where the older cohort’s mean score surpassed that of the younger group by 0.4201, a difference that is statistically significant (t-value = 8.54, p < 0.001). Similarly, in Factor 4 (Financial Cybersecurity Awareness), a notable gap of 0.3092 between the means further underscored the heightened vigilance among the older students (t-value = 3.91, p < 0.001).
The analysis extended to Factor 1 (Proactive Protection Behaviors) and Factor 3 (Secure Online Habits), where again, the older age group demonstrated superior engagement, reflected through mean differences of 0.2389 (t-value = 4.97, p < 0.001) and 0.1795 (t-value = 3.86, p < 0.001), respectively. Even in Factor 5 (Cautious Online Engagement), though the difference was smaller (0.0994), it remained significant (t-value = 2.98, p = 0.003), suggesting a consistent trend across all examined factors.
These results collectively illustrate the impact of age on cybersecurity awareness and behaviors. Older students exhibited a more pronounced commitment to protective online behaviors, personal information security, and financial cybersecurity vigilance. This heightened awareness and engagement among students aged 25 to 40 compared to those under 25 highlights the necessity of age-tailored cybersecurity education and interventions to bridge the awareness gap effectively [48,49,50,51,52].
4.4.5. Academic Discipline Comparison of Factor Scores
For Factors 1 (Proactive Protection Behaviors), 2 (Personal Information Protection), and 3 (Secure Online Habits), statistically significant differences emerged, highlighting disciplinary influences on cybersecurity behaviors. See in Figure 5.

Figure 5.
Interval Plot of Factor Scores by Academic Discipline Across Different Cybersecurity Factors.
Students within the Natural Sciences and Technical Fields exhibited higher mean scores in Proactive Protection Behaviors (Mean = 3.461) compared to their peers in Social Sciences and Humanities (Mean = 3.331), with a difference of 0.1302 and a significance level (p-value) of 0.026. This trend continued in Personal Information Protection, where the former group scored higher (Mean = 4.063) than the latter (Mean = 3.867), with a p-value of 0.007, and in Secure Online Habits, with students in Natural Sciences and Technical Fields again showing a higher mean (Mean = 2.396) compared to those in Social Sciences and Humanities (Mean = 2.238), and a p-value of 0.006.
Conversely, Factor 4 (Financial Cybersecurity Awareness) and Factor 5 (Cautious Online Engagement) did not demonstrate significant disciplinary differences. The mean scores for Financial Cybersecurity Awareness were virtually identical across disciplines (Natural Sciences and Technical Fields Mean = 4.029 vs. Social Sciences and Humanities Mean = 4.038, p-value = 0.927), as were those for Cautious Online Engagement, though a slight non-significant trend towards higher scores in Natural Sciences and Technical Fields (Mean = 2.358) compared to Social Sciences and Humanities (Mean = 2.283) was observed, with a p-value of 0.096.
This analysis suggests that while students from Natural Sciences and Technical Fields tend to exhibit more proactive and protective cybersecurity behaviors than their counterparts in Social Sciences and Humanities, the distinctions become less pronounced when considering financial cybersecurity awareness and cautious online engagement.
4.4.6. Language and Cultural Background Comparison of Factor Scores
English-speaking students exhibited lower mean scores across all examined factors compared to Hungarian speakers. See in Figure 6.
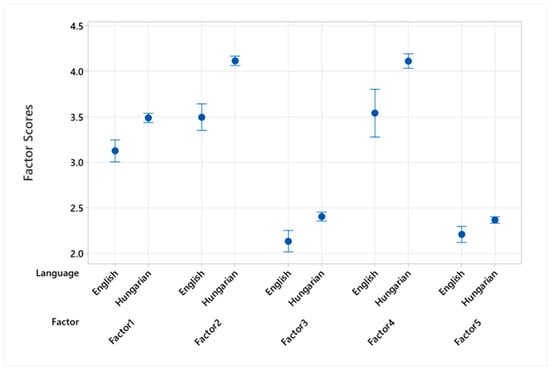
Figure 6.
Interval Plot of Factor Scores by Language and Cultural Background Across Different Cybersecurity Factors.
For Factor 1 (Proactive Protection Behaviors), the mean score for English speakers was significantly lower (Mean = 3.126) than that for Hungarian speakers (Mean = 3.488), with a difference of −0.3624 and a p-value < 0.001. This trend continued in Factor 2 (Personal Information Protection), where English speakers’ mean score (Mean = 3.496) fell below that of Hungarian speakers (Mean = 4.115), with a pronounced difference of −0.6185 and a p-value < 0.001. Similarly, in Factor 3 (Secure Online Habits), English speakers had a lower mean score (Mean = 2.134) compared to Hungarian speakers (Mean = 2.405), with a difference of −0.2703 and a p-value < 0.001. Factor 4 (Financial Cybersecurity Awareness) also demonstrated a significant disparity, with English speakers scoring lower (Mean = 3.54) than Hungarian speakers (Mean = 4.112), with a difference of −0.572 and a p-value < 0.001.
These findings indicated a consistent pattern where Hungarian-speaking students display higher cybersecurity factor scores than their English-speaking peers, suggesting that language and possibly cultural factors play a substantial role in shaping cybersecurity behaviors and awareness [53]. This discrepancy underscores the necessity for language-specific cybersecurity education and interventions to address the gaps identified, ensuring that all students, regardless of their primary language, have equal access to effective cybersecurity knowledge and practices.
4.4.7. Summary of Demographic Comparisons
Our comprehensive analysis, encompassing a series of t-tests across various demographics, offers an intricate view of cybersecurity behaviors among university students, delineated by gender, age, academic discipline, and language. The findings unravel the multifaceted nature of cybersecurity awareness and practices, emphasizing the influence of demographic factors.
In the realm of gender, the investigation uncovered that males tend to engage more actively in Proactive Protection Behaviors and exhibit more Secure Online Habits than their female counterparts. This gender disparity signals a potential area for targeted educational programs aimed at elevating cybersecurity awareness among female students. Conversely, the analysis did not reveal significant gender-based differences in Personal Information Protection, Financial Cybersecurity Awareness, or Cautious Online Engagement, suggesting a level playing field in these aspects of cybersecurity behavior.
Age proved to be a significant determinant of cybersecurity awareness, with older students (aged 25 to 40) consistently scoring higher across all factors compared to the younger cohort (below 25). This maturity effect suggests that cybersecurity awareness and the adoption of protective behaviors may naturally increase with age, highlighting the need for age-specific interventions to boost cybersecurity awareness among younger students.
The academic discipline also emerged as a critical factor, with students from Natural Sciences and Technical Fields demonstrating higher engagement in key cybersecurity behaviors than their peers in Social Sciences and Humanities. This distinction underscores the necessity for interdisciplinary approaches in cybersecurity education, ensuring that all students, regardless of their field of study, acquire essential knowledge and skills to navigate the cyber landscape safely.
Language and cultural background further influence cybersecurity behaviors, as Hungarian-speaking students exhibited significantly higher factor scores across the board compared to English-speaking students. This linguistic divide points to the broader implications of cultural differences in shaping cybersecurity attitudes and practices, advocating for the development of culturally and linguistically adapted cybersecurity education materials.
Collectively, these findings articulate the complexity of cybersecurity behaviors influenced by demographic characteristics. They beckon a nuanced approach to cybersecurity education and policymaking, tailored to address the diverse needs and vulnerabilities of the student population, thereby fostering a more cyber-aware and resilient society.
5. Comparison of the Current and the Original PCSPS Scale Factors
The excellent model fit results were due to both the refined statistical model and the more-specific questions related to each behavioral pattern. The details of the model have been outlined above, and now we will detail how this model narrowed the range of questions to focus on the most critical aspects of cybersecurity behaviors.
5.1. Factor 1: Proactive Protection Behaviors
In the current scale, the factor “Proactive Protection Behaviors” includes items Q15, Q16, and Q18. This factor focuses on proactive measures to enhance cybersecurity, specifically checking connection security, updating software, and avoiding weak passwords. In the original PCSPS scale, the factor “Taking Precautions” included the items Q15, Q16, Q17, Q18, and Q19. This factor covered a wider range of behaviors aimed at maintaining cybersecurity, such as updating software, using antivirus software, checking connection security, avoiding weak passwords, and changing web browser security settings. The current scale’s “Proactive Protection Behaviors” factor is more streamlined. This reduction focuses the current factor on the most essential proactive security measures, making it more concise and specific.
5.2. Factor 2: Personal Information Protection
The factor “Personal Information Protection” includes items Q4, Q6, and Q10. This factor specifically focuses on the handling and protection of personal information. The items reflect behaviors concerning sharing personal information on the internet and social networks and responding to emails requesting sensitive information. In the original PCSPS scale, the factor “Protecting Personal Privacy” included items Q1, Q2, Q3, Q4, Q5, Q6, Q7, Q8, Q9, and Q10. This factor covered a wide range of behaviors related to personal privacy, such as shopping through advertisements on social networks, opening email attachments from unknown senders, responding to phishing emails, sharing personal information online, setting easy-to-remember passwords, and making location announcements on the internet. The reduction in the number of risky behaviors makes the current factor more focused on the direct management of personal information and responses to phishing attempts.
5.3. Factor 3: Secure Online Habits
The factor “Secure Online Habits” includes items Q23, Q24, and Q25. This factor emphasizes habitual practices that ensure ongoing security, including deleting browser history, logging out of accounts, and changing passwords. In the original PCSPS scale, the factor “Leaving No Trace” included the items Q22, Q23, Q24, and Q25. The current scale’s “Secure Online Habits” factor is slightly more focused, containing three items compared to the four items in the original “Leaving No Trace” factor. This reduction makes the current factor more concise and focused on the most critical secure online habits.
5.4. Factor 4: Financial Cybersecurity Awareness
Both, the current scale factor “Financial Cybersecurity Awareness” and the PCSPS scale factor “Protecting Payment Information” include the same items, Q20 and Q21. This factor emphasizes awareness and secure practices in conducting financial transactions online, ensuring that these activities are performed using a personal computer.
5.5. Factor 5: Cautious Online Engagement
The factor “Cautious Online Engagement” includes items Q13 and Q14. This factor specifically addresses cautious behaviors in online engagement, including not subscribing to untrusted websites and not downloading files from untrusted sources. In the original PCSPS scale, the factor “Avoiding the Untrustworthy” included items Q11, Q12, Q13, and Q14. Both factors emphasize cautious behaviors to avoid security risks associated with untrustworthy sources. The reduction in items makes the current factor more focused and concise, specifically targeting the most critical cautious online behaviors.
6. Conclusions
In concluding, our research provides a nuanced understanding of cybersecurity awareness and behaviors among university students, highlighting significant demographic variations and underscoring the importance of tailored cybersecurity education and policy interventions. By employing a rigorous methodological approach, including both exploratory and confirmatory factor analyses within the structural equation modeling framework, we have elucidated the complex dimensions of cybersecurity awareness that pervade the student demographic.
The findings of our comparative analysis across gender, age groups, academic disciplines, and language and cultural backgrounds reveal critical insights. Specifically, the significant differences in cybersecurity behaviors between genders in certain factors, the pronounced cybersecurity awareness among older students, the disciplinary influences on cybersecurity behaviors, and the notable disparities between Hungarian-speaking and English-speaking students, collectively emphasize the multifaceted nature of cybersecurity awareness within the university student population.
These results not only contribute to the academic discourse on cybersecurity awareness but also have practical implications for educational institutions, policymakers, and cybersecurity educators.
This validated Personal Cyber Security Awareness Scale for Students (can be named as PCSASS) can serve as a diagnostic tool for educational institutions to assess and enhance the cybersecurity awareness of their students. By identifying the specific areas where students lack awareness or engage in risky behaviors, universities can tailor their cybersecurity education programs to address these gaps effectively. For instance, institutions can implement targeted workshops, training sessions, and online modules that focus on the identified weak areas, such as proactive protection behaviors and secure online habits. Additionally, regular assessments using our scale can help institutions monitor the progress of their cybersecurity initiatives and make data-driven decisions to continuously improve their cybersecurity posture.
For students, the implications of enhanced cybersecurity awareness are manifold. With better awareness and habits, students can protect their personal information and academic data from cyber threats, which is crucial in an era where online learning and digital interactions are pervasive. Improved cybersecurity practices can prevent incidents such as phishing attacks, data breaches, and identity theft, which can disrupt their academic progress and personal lives. Furthermore, as students become more proficient in managing their cybersecurity, they can carry these essential skills into their professional lives, contributing to a safer and more secure digital environment in their future workplaces.
The findings underscore the necessity of developing and implementing cybersecurity education programs that are not only comprehensive but also considerate of the diverse needs and backgrounds of the student body. Such programs should aim to bridge the existing gaps in cybersecurity awareness and practices, particularly among those groups identified as having lower levels of awareness or engagement in proactive cybersecurity behaviors.
Furthermore, our research highlights the need for future studies to explore the underlying reasons for the observed differences, including cultural, psychological, and behavioral factors that may influence cybersecurity awareness and practices. Additionally, the limitation of our model’s applicability to individuals over 40 years of age points to an area ripe for further exploration, suggesting that distinct models or approaches may be necessary to effectively capture the cybersecurity awareness and behaviors of this demographic.
The study’s reliance on self-reported data introduces potential biases, such as social desirability bias, where respondents may overstate positive behaviors and underreport risky ones. This limitation is inherent in survey-based research and can affect the accuracy of the reported cybersecurity behaviors.
Another limitation is the cultural and linguistic homogeneity of the sample, predominantly consisting of Hungarian students and English-speaking students in Hungary. This restricts the applicability of the findings to more diverse cultural contexts where cybersecurity practices and awareness levels may vary widely.
Finally, the study’s cross-sectional design provides a snapshot of cybersecurity behaviors at a single point in time, limiting the ability to draw conclusions about causal relationships or changes in behavior over time. Future longitudinal studies are necessary to understand the dynamics of cybersecurity awareness and behavior changes more comprehensively.
These limitations highlight areas for future research, including expanding the demographic range, incorporating more diverse cultural contexts, and employing longitudinal designs to better capture the complexities of cybersecurity awareness and behaviors across different populations.
In essence, this study advances our understanding of cybersecurity awareness among university students, providing a foundation for the development of more effective, inclusive, and adaptive cybersecurity education initiatives. It invites continued research and dialogue on how best to equip students with the knowledge and skills necessary to navigate the increasingly complex and risk-laden digital landscape of the 21st century.
Author Contributions
L.B. (Bognár László): Conceptualization, methodology, software, validation, formal analysis, investigation, data curation, writing—original draft preparation, writing—review and editing, visualization, supervision, project administration. L.B. (Bottyán László): Resources. All authors have read and agreed to the published version of the manuscript.
Funding
No funding was received to assist with the preparation of this manuscript.
Institutional Review Board Statement
At our university, while there is no dedicated ethics committee, we adhere to rigorous internal guidelines that ensure the anonymity and voluntariness of all participant involvement.
Informed Consent Statement
Prior to participation, all individuals were informed about the study’s aims and the anonymous and voluntary nature of the survey through an initial statement in the questionnaire. This statement also made clear that by participating, they consent to the anonymized use of their data solely for statistical analysis. We have ensured that it is technically impossible to identify any participant from the data collected, maintaining the strictest levels of confidentiality and data protection.
Data Availability Statement
Data available through the link: https://drive.google.com/drive/folders/1gM9CdhTqRk_V_OC7nl0bG-ksW1TvqxNl?usp=sharing, accessed on 23 May 2024.
Conflicts of Interest
The authors have no competing interests to declare that are relevant to the content of this article.
References
- Information Systems Audit and Control Association. ISACA Interactive Glossary & Term Translations; ISACA: Schaumburg, IL, USA, 2023; Available online: https://www.isaca.org/resources/glossary (accessed on 23 May 2024).
- Moallem, A. Cyber Security Awareness Among College Students. Adv. Intell. Syst. Comput. 2018, 9, 79–87. [Google Scholar] [CrossRef]
- Senthilkumar, K.; Easwaramoorthy, S. A survey on cyber security awareness among college students in tamil nadu. IOP Conf. Ser. Mater. Sci. Eng. 2017, 263, 4. [Google Scholar] [CrossRef]
- NIST. Glossary|CSRC. 2020. Available online: https://www.nist.gov/ (accessed on 23 May 2024).
- Pew Research Center. Technology Policy Issues: Online Privacy and Security. 2019. Available online: https://www.pewresearch.org/topic/internet-technology/technology-policy-issues/online-privacy-security/ (accessed on 23 May 2024).
- Pew Research Center. Phishing Scams and Other Online Trickery: How People Protect Themselves. 2019. Available online: https://www.pewresearch.org/short-reads/2022/08/30/more-so-than-adults-u-s-teens-value-people-feeling-safe-online-over-being-able-to-speak-freely/ (accessed on 23 May 2024).
- Pew Research Center. Mobile Technology and Home Broadband 2021. Available online: https://www.pewresearch.org/internet/2021/06/03/mobile-technology-and-home-broadband-2021 (accessed on 23 May 2024).
- Pew Research Center. Misinformation and Competing Views of Reality Abounded Throughout 2020. Available online: https://www.pewresearch.org/journalism/2021/02/22/misinformation-and-competing-views-of-reality-abounded-throughout-2020/ (accessed on 23 May 2024).
- Willem, J.; Sijtsma, K.; Scheele, F. Measuring cyber secure behavior of elementary and high school students in the Netherlands. Comput. Educ. 2022, 186, 104536. [Google Scholar] [CrossRef]
- Rahim Hamid, S.; Laiha, M.; Shamshirband, S.; Furnell, S. A systematic review of approaches to assessing cybersecurity awareness. Kybernetes 2015, 44, 606–622. [Google Scholar] [CrossRef]
- Assenza, G.; Chittaro, A.; Carla, M.; Mastrapasqua, M.; Setola, R. A Review of Methods for Evaluating Security Awareness Initiatives. Eur. J. Secur. Res. 2020, 5, 259–287. [Google Scholar] [CrossRef]
- Brown, A.; Smith, A.N. Privacy and the Internet of Things (IoT): A systematic review. Inf. Syst. Front. 2017, 19, 491–507. [Google Scholar]
- Siponen, M.; Siponen, M. A conceptual foundation for organizational information security awareness. Inf. Manag. Comput. Secur. 2000, 8, 31–41. [Google Scholar] [CrossRef]
- Brenner, L.; Smith, A. Teens, Social Media & Privacy: How Teens Manage Their Online Reputations. 2013. Available online: https://www.pewresearch.org/internet/2013/05/21/teens-social-media-and-privacy/ (accessed on 23 May 2024).
- Mai, P.T.; Tick, A. Cyber Security Awareness and Behavior of Youth in Smartphone Usage: A Comparative Study between University Students in Hungary and Vietnam. Acta Polytech. Hung. 2021, 18, 67–89. [Google Scholar] [CrossRef]
- Hänsch, N.; Benenson, Z. Specifying IT security awareness. In Proceedings of the 2014 25th International Workshop on Database and Expert Systems Applications, Munich, Germany, 1–5 September 2014; Available online: https://api.semanticscholar.org/CorpusID:6452120 (accessed on 23 May 2024).
- Fertig, T.; Schütz, A. About the Measuring of Information Security Awareness: A Systematic Literature Review. 2020. Available online: https://scholarspace.manoa.hawaii.edu/items/bc46ac13-2f4b-4d70-add9-ce10527f7015 (accessed on 23 May 2024).
- Baranowski, T.; Cullen, K.W.; Nicklas, T.; Thompson, D.; Baranowski, J. Are Current Health Behavioral Change Models Helpful in Guiding Prevention of Weight Gain Efforts? Obes. Res. 2003, 11, 23S43S. [Google Scholar] [CrossRef]
- Rohan, R.; Pal, D.; Hautamäki, J.; Funilkul, S.; Chutimaskul, W.; Thapliyal, H. A systematic literature review of cybersecurity scales assessing information security awareness. Heliyon 2023, 9, e14234. [Google Scholar] [CrossRef]
- Corradini, I.; Nardelli, E. Developing Digital Awareness at School: A Fundamental Step for Cybersecurity Education. In Advances in Human Factors in Cybersecurity; Corradini, I., Nardelli, E., Ahram, T., Eds.; Springer International Publishing: New York, NY, USA, 2020; pp. 102–110. [Google Scholar]
- De Maggio, M.C.; Mastrapasqua, M.; Tesei, M.; Chittaro, A.; Setola, R. How to improve the security awareness in complex organizations. Eur. J. Secur. Res. 2019, 4, 33–49. [Google Scholar] [CrossRef]
- Kruger, H.A.; Kearney, W.D. A prototype for assessing information security awareness. Comput. Secur. 2006, 25, 289–296. [Google Scholar] [CrossRef]
- Al-Janabi, S.; Al-Shourbaji, I. A Study of Cyber Security Awareness in Educational Environment in the Middle East. J. Inf. Knowl. Manag. 2016, 15, 1650007. [Google Scholar] [CrossRef]
- McAfee. Cybersecurity Resources and Guides. 2020. Available online: https://www.mcafee.com/en-us/resources/cybersecurity-reports-and-guides.html (accessed on 23 May 2024).
- Rahman, T.; Rohan, R.; Pal, D.; Kanthamanon, P. Human factors in cybersecurity: A scoping review. In Proceedings of the IAIT2021: The 12th International Conference on Advances in Information Technology, Bangkok, Thailand, 29 June–1 July 2021. [Google Scholar] [CrossRef]
- Chandarman, R.; Van Niekerk, B. Students’ Cybersecurity Awareness at a Private Tertiary Educational Institution. Afr. J. Inf. Commun. 2017, 20, 133–155. [Google Scholar] [CrossRef]
- Yılmaz, R.; Karaoğlan Yılmaz, F.G.; Öztürk, H.T.; Karademir, T. Examining Secondary School Students’ Safe Computer and Internet Usage Awareness: An Example from Bartın Province (Lise Öğrencilerinin Güvenli Bilgisayar ve İnternet Kullanım Farkındalıklarının İncelenmesi: Bartın İli Örneği). J. Educ. Instr. 2017, 7, 83–114. [Google Scholar] [CrossRef]
- Antunes, M.; Silva, C.; Marques, F. An integrated cybernetic awareness strategy to assess cybersecurity attitudes and behaviors in school context. Appl. Sci. 2021, 11, 11269. [Google Scholar] [CrossRef]
- Parsons, K.; McCormac, A.; Butavicius, M.; Pattinson, M.; Jerram, C. Determining Employee Awareness Using the Human Aspects of Information Security Questionnaire (HAISQ). Comput. Secur. 2014, 42, 165–176. [Google Scholar] [CrossRef]
- Pósa, T.; Grossklags, J. Work Experience as a Factor in Cyber-Security Risk Awareness: A Survey Study with University Students. J. Cybersecur. Priv. 2022, 2, 490–515. [Google Scholar] [CrossRef]
- Alqahtani, M.A. Factors Affecting Cybersecurity Awareness among University Students. Appl. Sci. 2022, 12, 2589. [Google Scholar] [CrossRef]
- Erol, O.; Şahin, Y.; Yılmaz, E.; Haseski, H. Personal Cyber Security Provision Scale development study Kişisel Siber Güvenliği Sağlama Ölçeği geliştirme çalışması. Int. J. Hum. Sci. 2015, 12, 75. [Google Scholar] [CrossRef]
- Duman, F.K. Determining Cyber SecurityRelated Behaviors of Internet Users: Example of the Faculty of Sport Sciences Students. Eur. J. Educ. 2022, 5, 112–128. [Google Scholar] [CrossRef]
- Haseski, H.İ. Cyber Security Skills of Pre-Service Teachers as a Factor in Computer-Assisted Education. Int. J. Res. Educ. Sci. 2020, 6, 484. [Google Scholar] [CrossRef]
- Karaci, A.; Akyüz, H.İ.; Bilgici, G. Investigation of cyber security behaviors of university students. Kastamonu Eğitim Derg. 2017, 25, 6. [Google Scholar] [CrossRef]
- Garba, A.; Sirat, M.B.; Hajar, S.; Dauda, I.B. Cyber Security Awareness Among University Students: A Case Study. Sci. Proc. Ser. 2020, 2, 82–86. [Google Scholar] [CrossRef]
- NortonLifeLock. NortonLifeLock Cybersecurity Insights Report. 2019. Available online: https://www.nortonlifelock.com/us/en/newsroom/press-kits/2019-norton-lifelock-cyber-safety-insights-report/ (accessed on 23 May 2024).
- Pahnila, S.; Siponen, M.; Mahmood, M. Which Factors Explain Employees’ Adherence to Information Security Policies? An Empirical Study. In Proceedings of the Pacific Asia Conference on Information Systems, PACIS 2007, Auckland, New Zealand, 4–6 July 2007; p. 73. [Google Scholar]
- Floyd, F.J.; Widaman, K.F. Factor analysis in the development and refinement of clinical assessment instruments. Psychol. Assess. 1995, 7, 286–299. [Google Scholar] [CrossRef]
- Ford, J.K.; MacCallum, R.C.; Tait, M. The application of exploratory factor analysis in applied psychology: A critical review and analysis. Pers. Psychol. 1986, 39, 291–314. [Google Scholar] [CrossRef]
- Accenture. Accenture Named a Leader in the Gartner Magic Quadrant for IT Services for Communications Service Providers Worldwide for Eleventh Consecutive Year; Accenture: Dublin, Ireland, 2019. [Google Scholar]
- Available online: https://newsroom.accenture.com/news/2022/accenture-named-a-leader-in-the-gartner-magic-quadrant-it-services-for-communications-service-providers-worldwide-for-eleventh-consecutive-year (accessed on 23 May 2024).
- Center for Internet Security. Risk-Based Security for a Changing Landscape. 2021. Available online: https://www.mdpi.com/2076-0760/9/11/208/pdf (accessed on 23 May 2024).
- Fischer, A.H. Gender and Emotion: Social Psychological Perspectives; Cambridge University Press: Cambridge, UK, 2000. [Google Scholar]
- García-Crespo, Á.; García, F.; Therón, R.; García, J. Gender and Internet security: A study of Internet security habits and awareness of female and male users. Comput. Hum. Behav. 2019, 95, 86–96. [Google Scholar]
- National Cyber Security Alliance. Stay Safe. 2019. Available online: https://staysafeonline.org/ (accessed on 23 May 2024).
- Smith, A.N.; Doe, J. Online privacy practices of internet users: Gender and Internet of Things (IoT). In Proceedings of the International Conference on Information Systems (ICIS 2018), San Francisco, CA, USA, 13–16 December 2018. [Google Scholar]
- Anderson, M.; Perrin, A. Tech Adoption Climbs among Older Adults; Pew Research Center: Washington, DC, USA, 2018; Available online: https://www.pewresearch.org/internet/2017/05/17/tech-adoption-climbs-among-older-adults/ (accessed on 23 May 2024).
- Kezer, M.; Sevi, B.; Cemalcilar, Z.; Baruh, L. Age differences in privacy attitudes, literacy and privacy management on Facebook. Cyberpsychology J. Psychosoc. Res. Cyberspace 2016, 10, 2. [Google Scholar] [CrossRef]
- Orji, R.O. Effect of academic discipline on technology acceptance. In Proceedings of the 2010 International Conference on Education and Management Technology, Cairo, Egypt, 2–4 November 2010; pp. 617–621. [Google Scholar] [CrossRef]
- Perrin, A. Mobile Security Fears and Behaviors. 2017. Available online: https://www.pewresearch.org/internet/fact-sheet/mobile/ (accessed on 23 May 2024).
- Smith, A.; Doe, J.; Johnson, M. Digital privacy practices among older adults: The role of technology experience, age, and awareness. J. Aging Technol. 2019, 3, 112–129. [Google Scholar]
- Martirosyan, N.M.; Hwang, E.; Wanjohi, R. Impact of English proficiency on academic performance of international students. J. Int. Stud. 2015, 5, 60–71. [Google Scholar] [CrossRef]
Disclaimer/Publisher’s Note: The statements, opinions and data contained in all publications are solely those of the individual author(s) and contributor(s) and not of MDPI and/or the editor(s). MDPI and/or the editor(s) disclaim responsibility for any injury to people or property resulting from any ideas, methods, instructions or products referred to in the content. |
© 2024 by the authors. Licensee MDPI, Basel, Switzerland. This article is an open access article distributed under the terms and conditions of the Creative Commons Attribution (CC BY) license (https://creativecommons.org/licenses/by/4.0/).