Abstract
Teacher care in the university setting is crucial for the academic, emotional, and social development of students, encompassing moral virtues such as compassion and professional competence. The students’ perception of teacher care directly relates to their well-being and active participation in learning. Despite the recognized importance of teacher care, there is a lack of adequate instruments to measure it, especially in specific cultural and educational contexts like Peru. The aim of this research is to develop and assess the psychometric properties of a scale measuring student perception of teacher care in the Peruvian university context, to provide a valid and reliable tool for future research and educational practices. An instrumental study was conducted with 910 university students aged between 18 and 50 years (M = 20.2, SD = 3.45). The Student Perception of Teacher Care Scale (SPTCS) was used, divided into five dimensions (Compassion, Competence, Confidentiality, Trust, and Awareness). Exploratory (EFA) and confirmatory (CFA) factor analyses were conducted to evaluate the scale’s internal structure, along with reliability analyses and measurement invariance across genders. The EFA identified a four-factor structure reflecting the dimensions of Confidentiality and Trust, Competence, Awareness, and Compassion. The CFA confirmed this structure with good fit indices for four-factor models, which was then adjusted to a five-factor model, one of which is a second-order factor (χ2 = 720.727, df = 369, CFI = 0.951, TLI = 0.946, RMSEA = 0.046, and SRMR = 0.032). Internal reliability was high (α and ω > 0.9 for all factors). Measurement invariance was established across genders, allowing for valid comparisons between men and women. It is concluded that the Student Perception of Teacher Care Scale proves to be a valid and reliable instrument for measuring teacher care in the Peruvian university context. The results emphasize the multidimensionality of teacher care and its significance for the educational environment and student experience. This study contributes to educational research and teaching practice, offering a means to assess and improve caring relationships in higher education.
1. Introduction
The concept of teacher care within the university context is a critical dimension in promoting students’ well-being and their academic, emotional, and social development. Taking on a role of care means adopting a stance of protection and pursuing students’ well-being [1,2], translating into a profound moral action that denotes a high sense of responsibility [3]. This responsibility is based on essential moral virtues such as compassion, competence, confidentiality, trust, and awareness, which are indispensable for establishing an effective caring relationship [4]. This approach goes beyond mere temporary or circumstantial assistance, highlighting the importance of care as a significant social act within the educational sphere, where the teacher becomes a fundamental pillar in meeting students’ needs and fostering their learning [5,6]. In this regard, education offers a unique perspective, emphasizing a deep connection of the student with their educational circle, which further underscores the relevance of care in the educational process [7,8,9,10].
Students’ perception of teacher care is defined through their direct experience with the ethical virtues displayed by their teachers, such as compassion and professional competence, significantly influencing their educational experience and willingness to actively participate in learning [11,12,13]. Moreover, inclusivity, support, and awareness stand out as crucial components of teacher care in online learning environments, underlining the concept’s three-dimensionality [14]. Teacher care is an essential pillar for academic success, creating a conducive learning environment that goes beyond knowledge transmission, and promoting a space where students feel valued, understood, and supported. This care dimension manifests through empathetic and accessible pedagogical practices, directly contributing to academic satisfaction, student retention, and academic performance [15,16,17,18]. In this sense, the perception of a high level of care and support from teachers correlates positively with improvements in various aspects of students’ academic lives, emphasizing the importance of a caring and supportive learning environment for enhancing retention in higher education [18,19,20]. The theory of care in education holds that it manifests through a care ethic, prioritizing interpersonal relationships and emotional connections between teachers and students, essential for effective learning and an environment where students feel valued and respected [21].
Teacher care in the university context is configured as a multifaceted practice reflecting a deep commitment to the comprehensive development of students [22,23,24]. Qualitative research has been instrumental in unraveling the dimensions of this care, identifying behaviors and attitudes that students perceive as indicative of their teachers’ commitment to their academic and personal well-being. According to Teven and Gorham [25], there are five key categories encapsulating teachers’ behavioral expressions of care: the demonstration of concern for students’ performance and grades, teachers’ concern for their own classroom performance, active interaction with students through questions and comments, the effort to build positive interpersonal relationships, and the use of non-verbal immediacy behaviors. Students especially value their teachers’ availability and accessibility, their genuine interest in individual well-being, clarity, and relevance in content presentation, and support for success in assessments. Additionally, in a study with university biology students, Straits [26] distinguishes two fundamental orientations of teacher care: learning-centered and student-centered, highlighting the importance of personally knowing the students, promoting interaction through questions, and offering varied learning resources as key indicators that enhance motivation and learning. This pedagogical approach is based on essential ethical virtues for quality care practice, among which compassion, competence, confidentiality, trust, and awareness stand out [4]. Compassion, understood as deep empathy and the active desire to alleviate others’ suffering, forms the basis of this care model, complemented by the teacher’s professional competence, ethical management of personal information, building a mutual trust relationship, and a critical awareness of one’s care practice. Furthermore, the care ethic presents as an integral perspective in teacher training, proposing practices that emphasize attention, responsibility, and competence. These practices are not only applied to the educational context but also to students’ personal lives, especially for those who perform caregiver roles outside the academic sphere [27,28,29].
The practical application of a pedagogy of care involves the teacher’s availability and responsiveness to the academic and emotional needs of students, promoting collaborative learning and effective communication [30]. The significance of this approach is reflected in its positive impact on students’ motivation, their willingness to actively engage in learning, and the strengthening of their academic commitment [31,32,33,34]. However, establishing effective caring relationships requires reciprocal interaction, avoiding paternalism, and respecting student autonomy. This approach calls for a practice of “respectful care” that promotes independence and self-learning, considering the unique experiences and learning styles of each student [12,31,35].
In the United States, tools have been developed to assess the care teachers provide to their students, highlighting different approaches and methodologies. A qualitative and quantitative study revealed 12 specific caring behaviors practiced by online nursing educators, as reported by their students. However, this study did not explore the psychometric properties of the Likert-format survey or the 12 identified behaviors [36]. Subsequently, a mixed-methods study in the same country led to the development of a unidimensional scale aimed at measuring university teachers’ self-assessment of the caring behaviors they demonstrate towards their students [37]. Meanwhile, in China, a scale was created to assess teachers’ caring behavior in online university teaching from the student’s perspective, proving to be an instrument with robust psychometric properties and a three-dimensional structure that encompasses inclusion, support, and awareness [14]. The perception of teacher care opens new avenues in research on the significance of teacher care and its perception by students in the academic context. In this regard, there is a need for an instrument to measure teacher care in the Peruvian context, stemming from the country’s unique cultural, social, and educational characteristics, which directly influence the perception and practice of care by teachers and its reception by students. Therefore, this study focuses on developing and evaluating the psychometric properties of a scale for measuring student perception of teacher care.
2. Materials and Methods
2.1. Design
This is an instrumental study, because it analyzes the measurement properties of an inventory made up of a set of items [38].
2.2. Participants
The participants were 910 Peruvian university students, selected using a non-probabilistic convenience sample, between 18 and 50 years old (M = 20.2, SD = 3.45); of which 494 (54.3%) were women, and in terms of professional career, 153 (16.8%) were in psychology, among other characteristics presented in Table 1.

Table 1.
Characteristics of the sample.
2.3. Ethical Aspects
To carry out this study, the processes indicated in the Declaration of Helsinki were followed, in addition to obtaining the approval of the university’s ethics committee (Reference 2023-CEUPeU-038). Subsequently, a meeting was held with the academic coordinators of the professional schools explaining the nature of the research to administer the forms to the students. Then the link and an informative video were sent to the WhatsApp groups of each classroom in coordination with the classroom tutors, then, with the informed consent of each of the participants, the data were collected.
2.4. Measures
The Student Perception of Teacher Care Scale (SPTCS) (see original EPECD in Spanish (Supplementary Table S1), SPTCS in English (Supplementary Table S2)) is an instrument developed in this study to measure students’ perceptions of the care they receive from teachers, using a Likert scale of 1 to 5, where 1 = strongly disagree, 2 = disagree, 3 = not agree, 4 = agree, 5 = strongly agree. The scale was initially made up of 52 items grouped into 5 factors, called ethical constructs of caregiving, according to the support theory [4]: Compassion (items 1 to 10), Competence (items 11 to 22), Confidentiality (items 23 to 31), Trust (items 32 to 42), and Awareness (items 43 to 52).
2.5. Data Analysis
For statistical analysis, the free software R version 4.3.1 [39] was used through the R Studio interface version 2023.06.1 + 524. To perform exploratory factor analysis (EFA) and confirmatory factor analysis (CFA), the sample was randomly divided into two groups: 456 for the EFA and 454 for the CFA.
Prior to initiating the EFA, the corresponding assumptions were verified. The assumption of univariate normality was verified through the values of skewness between −2 and +2; however, the values of kurtosis between −3 and +3 were slightly non-normal but considered adequate for performing EFA [40], as well as the adequacy of the sample, through the Kaiser–Meyer–Olkin coefficient (KMO). High KMO values indicate that the sample is suitable for EFA. In addition, Barlett’s sphericity test was used, which tests the null hypothesis that the analyzed variables are not correlated in the sample or, in other words, that the correlation matrix is identity (the intercorrelations between the variables are zero) [41]. Before performing the EFA, the assumption of univariate normality was also verified by means of the indices of skewness and kurtosis, in addition to the assumption of multivariate normality with the Mardia test [42].
Exploratory factor analysis (EFA) was performed using the minimum residuals extraction method with promax rotation, considering factor loads greater than 0.40 as a criterion of belonging to a factor, and the number of factors was determined through parallel analysis [43,44]. Subsequently, using the lavaan library in the RStudio interface, confirmatory factor analysis (CFA) was performed using the MLR estimator, which is suitable for numerical variables and is robust to deviations from normality [45]. For the evaluation of the adjustment models, the following indicators were considered: the chi-square test (χ2), the confirmatory fit index (CFI), the Tucker–Lewis index (TLI), the mean square error of approximation (RMSEA), and the mean square residuals index (MRS), considering that the values of CFI and TLI >0.90 indicate an acceptable fit and >0.95 indicate a good fit [46]. For RMSEA and SRMR, values below 0.05 indicate a good fit, and below 0.8 are considered acceptable [47,48].
The reliability of the latent model was calculated with the coefficients α Cronbach’s and McDonald’s ω [49] of the psych statistical package [50], in addition to the H-index of which magnitudes > 0.70 are considered adequate [51]. Factor loads (λ) with values greater than 0.40 were considered adequate. The internal convergent validity was estimated using the extracted mean variance (AVE), of which values above 0.50 indicated a good fit, while the internal discriminant validity was assumed to the extent that the AVE of each latent variable was greater than the square of the correlation between them [52].
Statistical analysis to calculate invariance was performed using the hemp library [53]. With the total sample (n = 910), factorial invariance was evaluated according to sex (male vs. female), evaluating the most restricted CFAs [54]. The first level, configurational invariance (M1), evaluates the reference model; the second level, metric invariance (M2), evaluates the equality of factor load; the third level, scalar invariance (M3), evaluates the equality of factorial load and intersection; and the fourth level, scalar invariance (M4), assesses the equality of factor loads, intersections, and residuals. As χ2 (Δχ2) is sensitive to sample size, we used the absolute difference value CFI (ΔCFI) and the RMSEA approximation mean square error (ΔRMSEA) where values < 0.01 indicate that the factor structure is invariant between the compared groups [55].
3. Results
3.1. Preliminary Analysis
Descriptive statistics of the 52 items for the two samples were analyzed: 456 for the EFA and 454 for the CFA (Table 2). For each item, the mean, standard deviation, skewness (g1), and kurtosis (g2) were calculated. The values of the skewness index between −1 and +1 were considered normal and the values of kurtosis between −3 and +3 were considered slightly non-normal. Regarding multivariate normality, a non-significant value was obtained in the Mardia test (p < 0.01), considering that the assumption of univariate and multivariate normality required for the CFA is not properly met, so it was considered appropriate to use the robust method of extraction of MLR factors [56].
Table 2.
Descriptive statistics of the items.
3.2. Preliminary Evidence of Validity of the Internal Structure
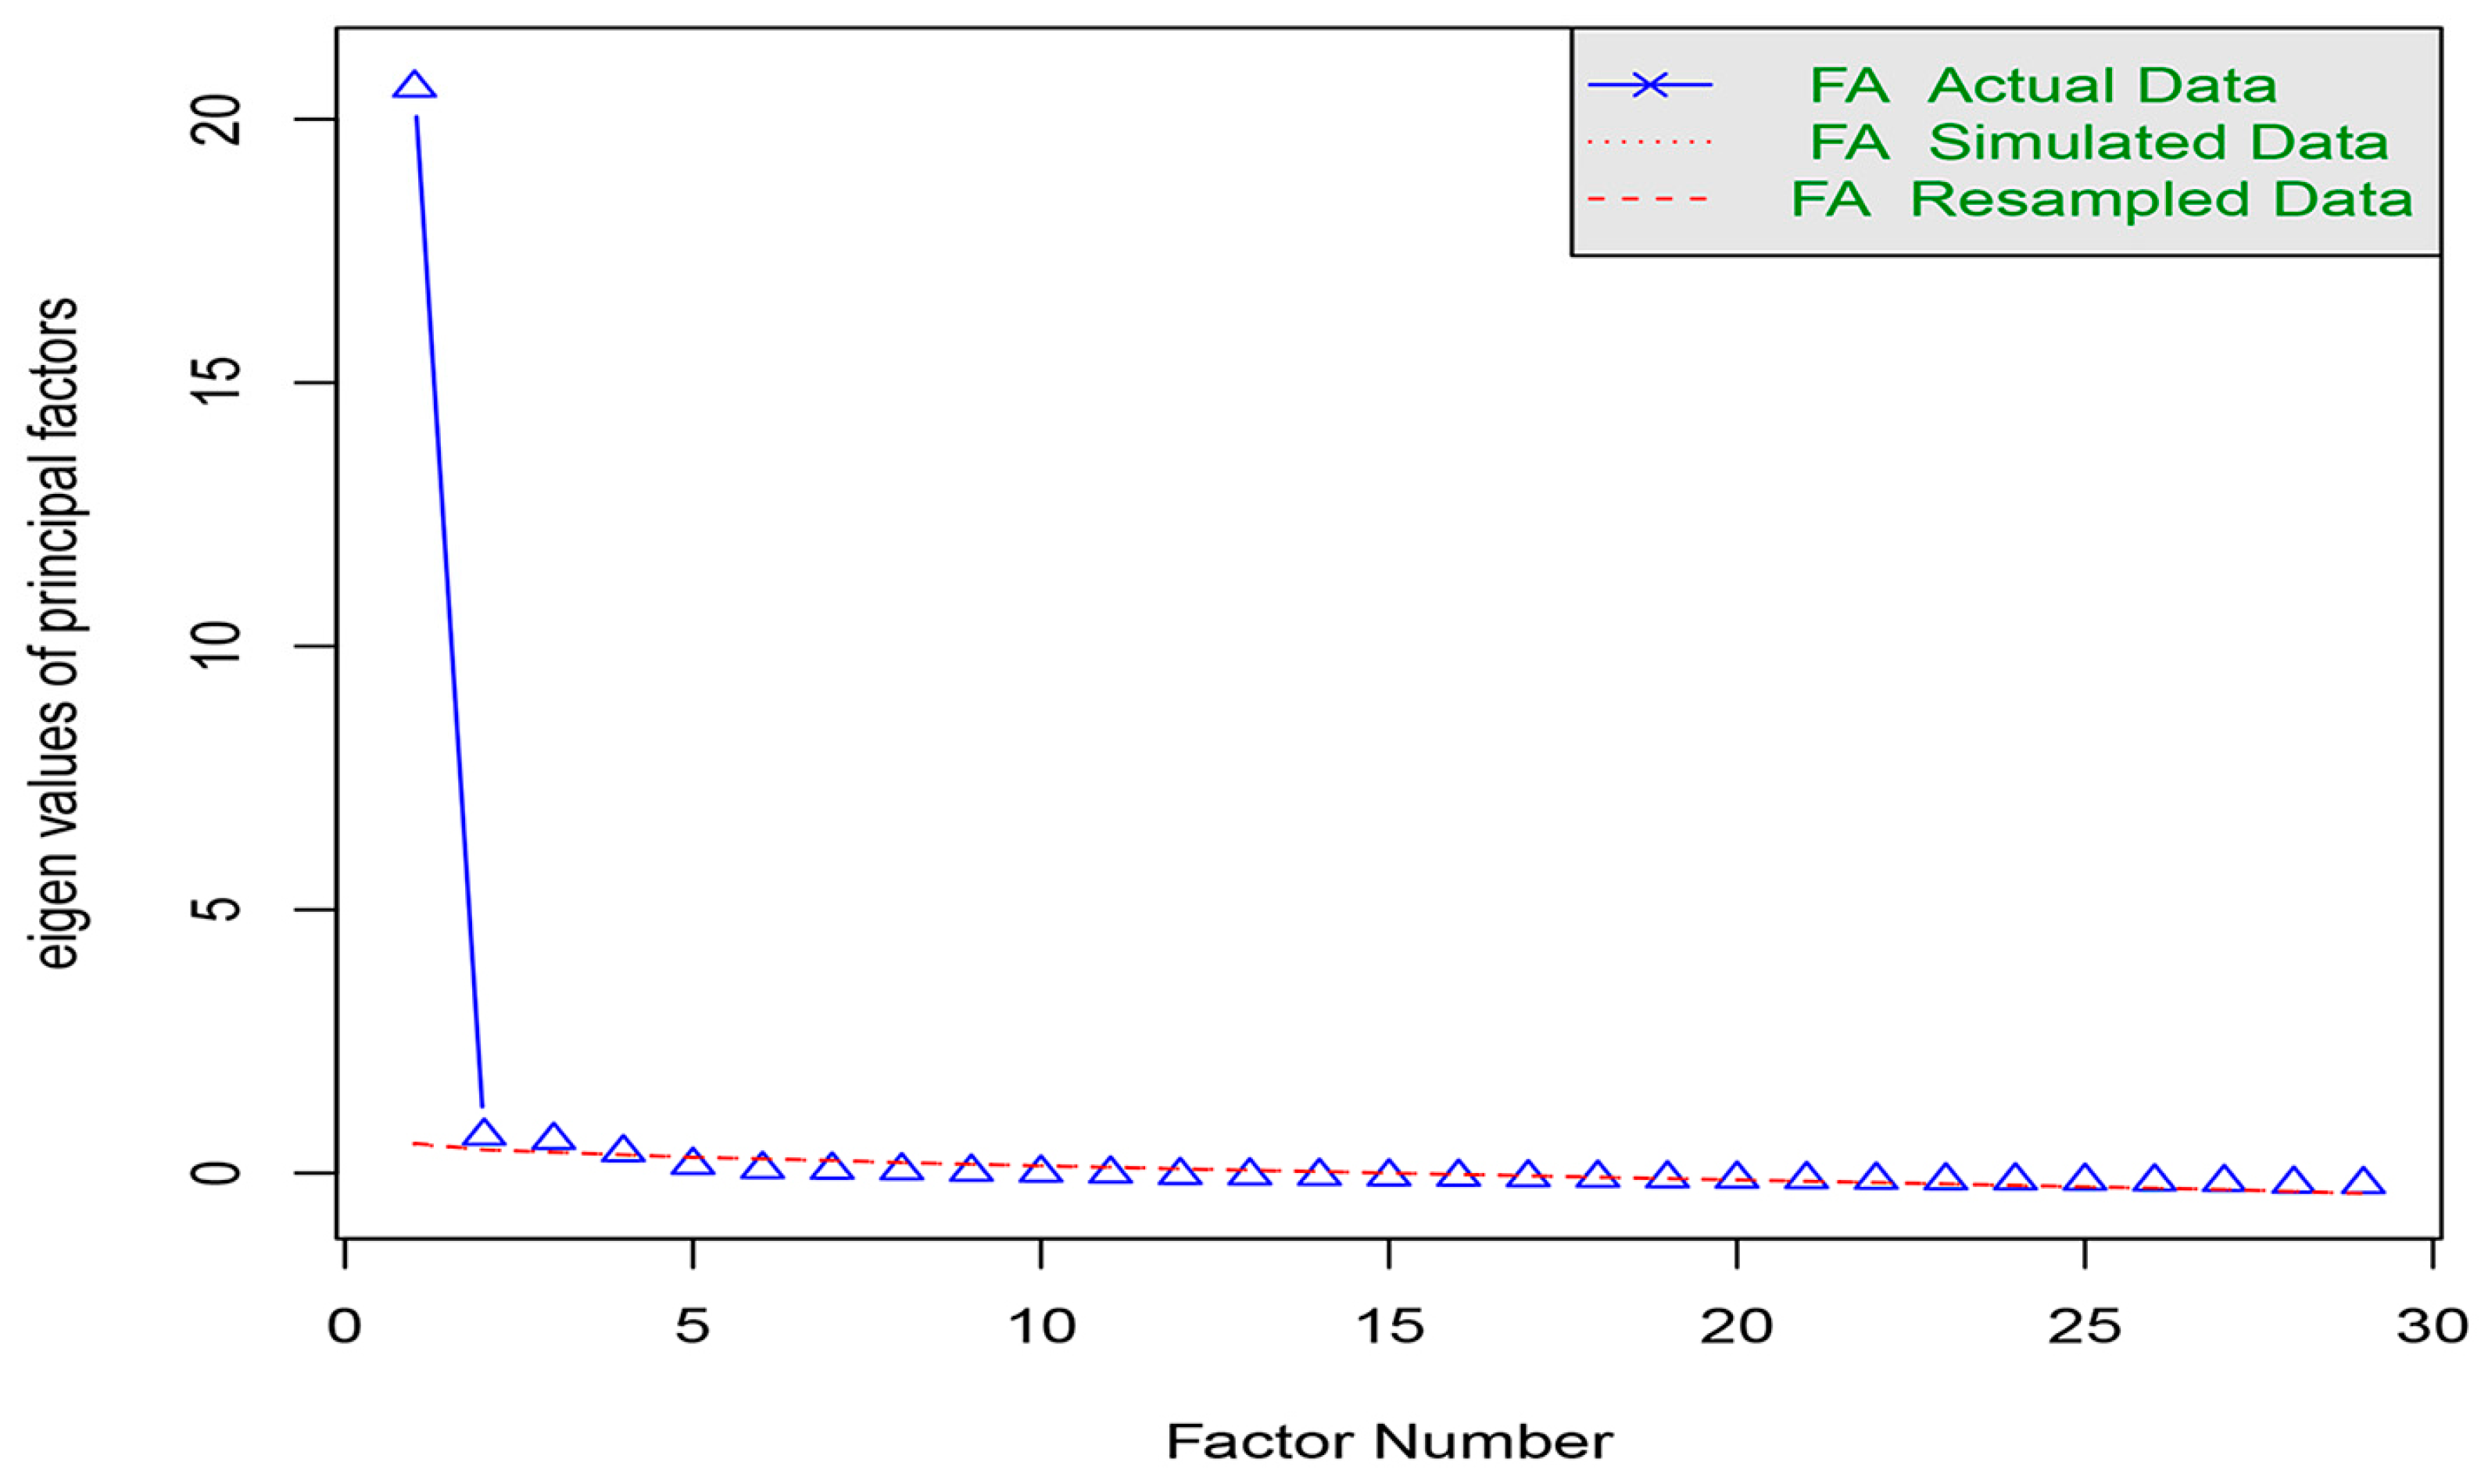
The sample for EFA (n = 456) showed suitability for EFA through the Kaiser–Meyer–Olkin index (KMO = 0.982) and a significant Bartlett sphericity index (p < 0.001). The EFA was carried out using the method of extraction of minimum residues and promax rotation, retaining only those items with a factorial load greater than or equal to 0.4 and that did not present factorial complexity that could make interpretation difficult. Finally, 29 items were obtained that, when subjected to parallel analysis and the corresponding sedimentation graph (Figure 1), suggested the existence of four factors.
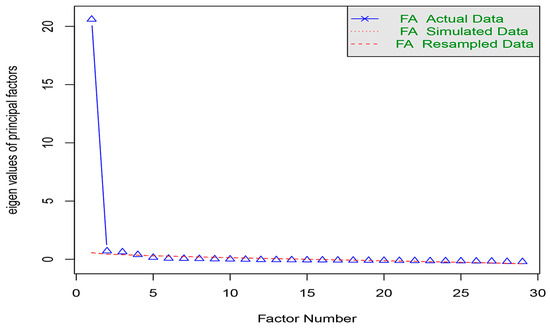
Figure 1.
Parallel analysis scree plot.
3.3. Internal Structure Validity and Reliability
The four factors which emerged from the exploratory factor analysis were called: F1, Confidentiality and Confidence (which resulted from the union of two dimensions of the initial proposal), F2, Competence, F3, Conscience, and F4, Compassion (Table 3). This first model (A) of four correlated factors was analyzed through confirmatory factor analysis. The values of mean variance extracted (AVE) from model A indicated a good fit with values greater than 0.70, while with respect to discriminant validity, only the AVE of factor 3 and factor 4 was higher than the value of the variance shared between both factors, which would be evidence of discriminant validity only between these factors (Table 4). Therefore, two other factor models were evaluated: a second model (B) of four first-order factors and a second-order factor and a third model (C) of four factors, of which factor 1 (Confidentiality and Trust) was second-order, bringing together the latent variables of Confidentiality and Trust, following the original theoretical proposal (Table 4). For the three models proposed, CFI and TLI indices >0.9 were obtained, as well as RMSEA and SRMR < 0.05, which are considered excellent, with model C (Figure 2) presenting the best adjustment indices. Regarding internal consistency (Table 4), an adequate level of reliability was obtained for all factors based on the A model of CFA that emerged from the EFA (α; ꞷ and H > 0.9) (Table 3). Additionally, based on model C, the reliability for the two first-order factors Confidentiality (α = 0.941; ꞷ = 0.943) and Confidence (α = 0.909; ꞷ = 0.909) was obtained.
Table 3.
Factorial distribution of items.
Table 4.
Fit indices of the three models evaluated.
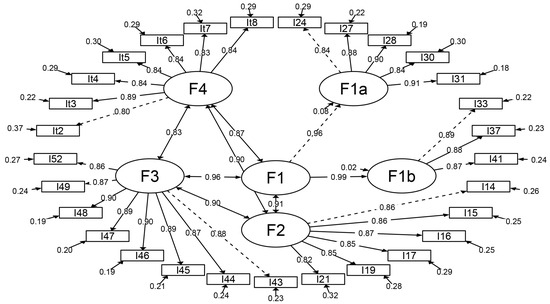
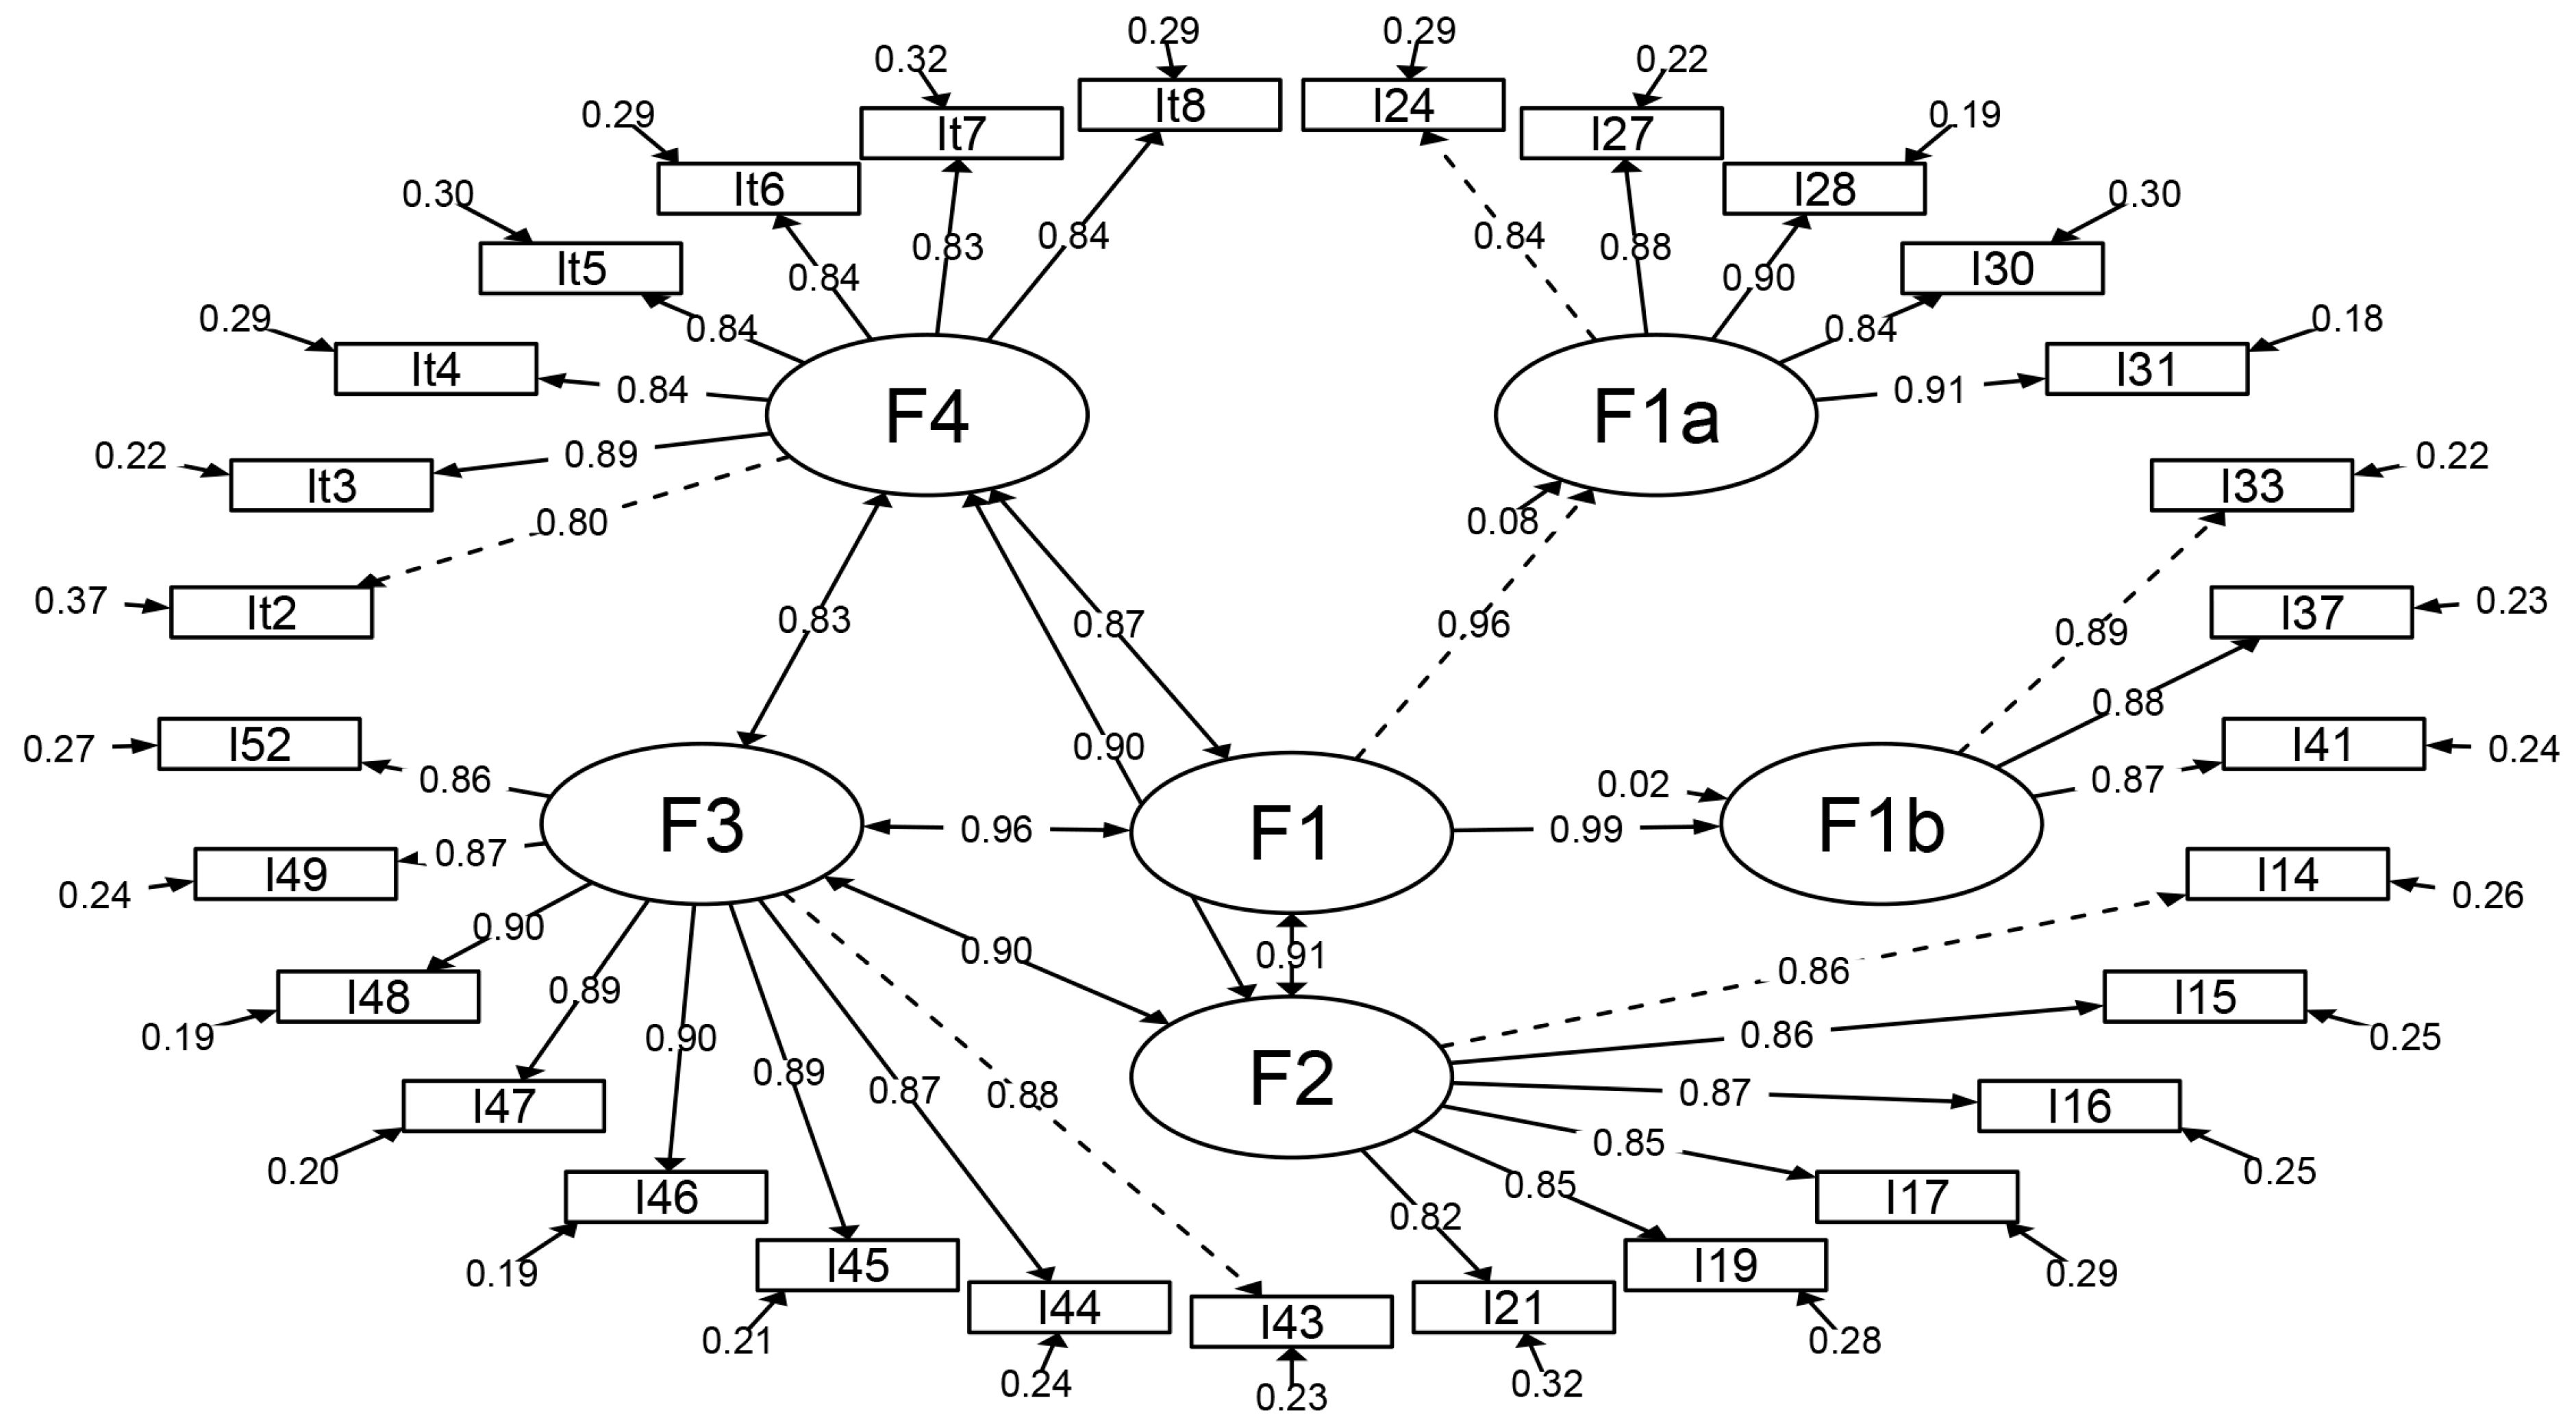
Figure 2.
Path diagram of the accepted model: F1a = Confidentiality, F1b = Confidence, F1 = Confidentiality and Confidence, F2 = Competence, F3 = Conscience, F4 = Compassion.
3.4. Measurement Invariance between Males and Females
Factorial invariance between males and females was evaluated with data from 910 participants. Table 5 shows evidence of strict invariance according to the criteria ΔCFI and ΔRMSEA. When adding the equal-mean constraint, the model fit did not worsen significantly, suggesting that latent means are similar for both sexes. Therefore, the configural, metric, scalar, and strict models meet the expected criteria and confirm the factorial invariance of the SPTCS, which allows the comparison between males and females, with respect to the latent variables of the SPTCS.
Table 5.
Measurement invariance between males and females.
4. Discussion
Teacher care in the university context is crucial for the comprehensive well-being and development of students, emphasizing values such as compassion, competence, and trust. This concept goes beyond academic assistance, being considered a moral act that positively impacts students’ educational experience, motivation, and performance. Research has highlighted the importance of empathetic pedagogical practices and the establishment of meaningful relationships between teachers and students. This study proposes the design and evaluation of a scale for measuring student perception of teacher care, aiming to contribute to the understanding and improvement of this critical aspect in university education.
Exploratory factor analysis (EFA) indicates a convergence in the significance assigned to the dimensions of teacher care and its positive impact on the educational environment and on students’ satisfaction and academic performance [15,16,17,18,19,20]. However, four critical factors (Confidentiality and Trust, Competence, Awareness, and Compassion) were identified through EFA. The merging of confidentiality and trust factors suggests an intrinsic interrelation between teachers’ ability to manage sensitive information and their skill in inspiring trust in their students. This may indicate the complexity of teacher care, showing that empathetic and ethical practices do not operate in silos but as an interconnected web of competencies that enhance the educational experience for students.
The confirmatory factor analysis (CFA) supports the structure proposed in the exploratory factor analysis (EFA), showing adequate fit indices for the four-factor model (model A) as well as the second model (model B). However, a third model (model C) was structured, establishing the dimensions of Confidentiality and Trust as second-order factors based on the interdependence of trust and confidentiality in developing a safe and supportive educational environment, as demonstrated by previous studies [15,16]. The fit indices for this model (Model C) were more robust, showing an excellent fit and empirically reaffirming the theory of a five-factor structure of teacher care (Torralba, 2000). Thus, in educational settings, confidentiality not only fulfills an ethical function but also strengthens students’ trust in the teacher, feeling protected and valued, which is essential for fostering a conducive learning environment [18]. These factors, including Compassion, Competence, Awareness, Confidentiality, and Trust, reflect a broadening of content compared to previously developed scales such as the unidimensional scale by Garza and Van Overschelde [37] and the three-dimensional scale by Zhao et al. [14].
The reliability of the different dimensions of the EPECD was assessed using Cronbach’s Alpha and McDonald’s omega coefficients, which revealed high internal consistency, with values above 0.70. This result underscores the EPECD as a highly reliable instrument for measuring student perception of teacher care [57].
Convergent and discriminant validity were evaluated using a four-factor model derived from exploratory factor analysis (EFA). Convergent validity proved adequate, measured by the average variance extracted (AVE > 0.5) [58], indicating that the items faithfully reflect their corresponding factors. Regarding discriminant validity, the criterion (AVE > φ2) of Fornell and Larcker [59] was met only for the shared variance between factors 3 and 4. This result suggests a possible lack of empirical differentiation between these factors, or that they might be part of a higher-order construct. In response, a second-order model was explored, which, although it presented adequate fit indices, did not surpass the original separate factors model. Therefore, a third model was evaluated, resulting in the best configuration of fit indices. This adjusted model divided factor 1 into two first-order factors, thus forming the five factors originally proposed [4].
A factorial invariance analysis was conducted to compare male and female groups, showing that the items evaluate the latent variables equivalently in both sexes [60]. This finding significantly contributes to future research aiming to compare scores between males and females, establishing a solid basis for reliable comparative analyses across genders.
4.1. Implications
It is considered that the Student Perception of Teacher Care Scale (SPTCS) is an appropriate tool for educators and professionals linked to university education, to measure the perception that students have about the care that their teachers exercise towards them. This information can be useful to identify strong and weak areas of the care that teachers exercise over their students, and to make administrative decisions that allow for the improvement or maintenance of specific aspects of the perception of care that students have on the part of their teachers, which would result in the improvement of enthusiasm and academic commitment, as well as in emotional aspects of the student, which would also lead to their academic and professional success.
4.2. Limitations
Among the limitations of this study, it should be considered that it was carried out with university students from a single educational institution in the department of San Martín, in Peru, so it is suggested to continue this study by increasing the sample with the participation of a greater number of universities from different regions of the country, also including the use of other instruments whose relationship with the variable has been demonstrated in other studies in such a way that the validity of the instrument in relation to other constructs can be determined. Also, by having a larger sample number, it is possible to obtain greater evidence of internal discriminant validity. It is also proposed that the psychometric properties of the proposed instrument be analyzed in other countries and, in addition, that other instruments be developed or validated to measure the care that teachers exercise towards their students, from different theoretical perspectives and also from the perspective of the teacher and the student, separately.
5. Conclusions
Teacher care in the university context sheds light on a fundamental aspect of the educational process that extends beyond knowledge transmission. Through the development and psychometric evaluation of the Student Perception of Teacher Care Scale (SPTCS), five critical dimensions were identified: Compassion, Competence, Awareness, Confidentiality, and Trust. These findings not only corroborate existing theory but also expand our understanding of how these dimensions interact with each other to create an educational environment in which students feel valued, understood, and supported. The validation of the SPTCS represents a significant contribution to the field of education, providing a valid and reliable tool for measuring student perception of teacher care. Furthermore, the demonstration of factorial invariance across genders strengthens the applicability of the SPTCS, allowing for valid comparisons between men and women in future studies.
Supplementary Materials
The following supporting information can be downloaded at: https://www.mdpi.com/article/10.3390/educsci14060605/s1, Table S1: Escala de percepción estudiantil del cuidado docente (EPECD-Spanish), Table S2: Student Perception Teacher Care Scale (SPTCS-English).
Author Contributions
Conceptualization R.D.D.-V., S.A.S.A., A.F.C.B., J.L.P.-B., R.I.E.-I. and D.F.C.-A.; methodology, D.F.C.-A.; software, D.F.C.-A.; validation, R.D.D.-V., S.A.S.A., A.F.C.B., J.L.P.-B., R.I.E.-I. and D.F.C.-A.; formal analysis, D.F.C.-A.; investigation, R.D.D.-V., S.A.S.A., A.F.C.B., J.L.P.-B. and R.I.E.-I.; resources, R.D.D.-V.; data curation, D.F.C.-A.; writing—original draft preparation, R.D.D.-V., S.A.S.A., A.F.C.B., J.L.P.-B., R.I.E.-I. and D.F.C.-A.; writing—review and editing, D.F.C.-A.; visualization, J.L.P.-B. and D.F.C.-A.; supervision, D.F.C.-A.; project administration, R.D.D.-V., S.A.S.A., A.F.C.B. and D.F.C.-A. All authors have read and agreed to the published version of the manuscript.
Funding
This research received no external funding.
Institutional Review Board Statement
The study was conducted in accordance with the Declaration of Helsinki, and approved by the Ethics Committee of Peruvian Union University (protocol code 2023-CEUPeU-038).
Informed Consent Statement
Informed consent was obtained from all subjects involved in the study.
Data Availability Statement
The data can be requested from the author by correspondence.
Conflicts of Interest
The authors declare no conflict of interest.
References
- Fry, T.S. Ética En La Práctica de Enfermería: Una Guía Para La Toma de Decisiones; Manual Moderno: Mexico, Mexico, 1994. [Google Scholar]
- Huamán-Tapia, E.; Almanza-Cabe, R.B.; Sairitupa-Sanchez, L.Z.; Morales-García, S.B.; Rivera-Lozada, O.; Flores-Paredes, A.; Morales-García, W.C. Critical Thinking, Generalized Anxiety in Satisfaction with Studies: The Mediating Role of Academic Self-Efficacy in Medical Students. Behav. Sci. 2023, 13, 665. [Google Scholar] [CrossRef] [PubMed]
- Tronto, J.; Kohlen, H. ¿Puede Ser Codificada La Ética Del Cuidado? In El Futuro del Cuidado. Comprensión de la Ética del Cuidado y Práctica Enfermera; Ediciones San Juan de Dios: Barcelona, España, 2018; pp. 20–32. [Google Scholar]
- Torralba, F. Constructos Éticos Del Cuidar. Enfermería Intensiv. 2000, 11, 136–141. [Google Scholar]
- Dandicourt, C. El Cuidado de Enfermería Con Enfoque En La Comunidad. Rev. Cuba. Med. Gen. Integral 2018, 34, 52–62. [Google Scholar]
- Ibarra, G. Ética Docente y Del Cuidado En La Educación. RICSH Rev. Iberoam. Cienc. Soc. Y Humanísticas 2021, 10, 284–306. [Google Scholar] [CrossRef]
- Schmidt, P. Enseñando, Tomando En Cuenta El “Giro Afectivo”: Conectando La Teoría Con La Práctica. Rev. Educ. Adventista 2022, 84, 4–11. [Google Scholar] [CrossRef]
- Caballero-Cantu, J.J.; Chavez-Ramirez, E.D.; Lopez-Almeida, M.E.; Inciso-Mendo, E.S.; Méndez Vergaray, J. Autonomous Learning in Higher Education. Systematic Review. Salud Cienc. Y Tecnol. 2023, 3, 1–19. [Google Scholar] [CrossRef]
- Tello-Castro, W.; Morales-García, W.C.; Turpo-Chaparro, J.E.; Huancahuire-Vega, S.; Mamani, P.G.R. Predictors of Sleepiness, Satisfaction with Studies, and Emotional Exhaustion in Students with High Intellectual Abilities during the Pandemic COVID-19. Electron. J. Res. Educ. Psychol. 2022, 20, 43–68. [Google Scholar] [CrossRef]
- Alvarado-Acosta, A.; Fernández-Saavedra, J.; Meneses-Claudio, B. Transformation and Digital Challenges in Peru during the COVID-19 Pandemic, in the Educational Sector between 2020 and 2023: Systematic Review. Data Metadata 2024, 3, 1–14. [Google Scholar] [CrossRef]
- VandenBos, G.R.; American Psychological Association (Eds.) APA Dictionary of Psychology, 2nd ed.; American Psychological Association: Washington, DC, USA, 2015. [Google Scholar]
- Tang, A.L.L.; Walker-Gleaves, C. Hong Kong University Teachers’ Conceptions and Articulation of Teacher Care: Towards Building a Model of Caring Pedagogy. High Educ. 2022, 83, 503–526. [Google Scholar] [CrossRef]
- Wang, Y.; Derakhshan, A. Teacher Confirmation and Caring in Chinese and Iranian Students’ Willingness to Attend EFL Classes. Porta Linguarum 2023, 2023, 165–192. [Google Scholar] [CrossRef]
- Zhao, J.; Zhang, L.; Yao, X. Developing and Validating a Scale for University Teacher’s Caring Behavior in Online Teaching. Educ. Sci. 2023, 13, 300. [Google Scholar] [CrossRef]
- Noddings, N. Caring: A Feminine Approach to Ethics and Moral Education; University of California Press: Berkeley, CA, USA, 1986. [Google Scholar]
- Goldstein, L.S.; Lake, V.E. “Love, Love, and More Love for Children”: Exploring Preservice Teachers’ Understandings of Caring. Teach. Teach. Educ. 2000, 16, 861–872. [Google Scholar] [CrossRef]
- Lynch, M.; Cicchetti, D. Maltreated Children’s Reports of Relatedness to Their Teachers. New Dir. Child Adolesc. Dev. 1992, 1992, 81–107. [Google Scholar] [CrossRef] [PubMed]
- Cornelius-White, J. Learner-Centered Teacher-Student Relationships Are Effective: A Meta-Analysis. Rev. Educ. Res. 2007, 77, 113–143. [Google Scholar] [CrossRef]
- Leon, R.A.; Byrd, J.N. Student Success in College: Creating Conditions That Matter. J. Int. Stud. 2012, 2, 194–195. [Google Scholar] [CrossRef]
- Schwartz, S.; Tinto, V. Leaving College: Rethinking the Causes and Cures of Student Attrition. Academe 1987, 73, 46. [Google Scholar] [CrossRef]
- Noddings, N. Caring: A Relational Approach to Ethics and Moral Education, 2nd ed.; University of California Press: Los Angeles, CA, USA, 2013. [Google Scholar]
- Andrade-Girón, D.C.; Marín-Rodriguez, W.J.; Zúñiga-Rojas, M.; Susanibar-Ramirez, E.T.; Calvo-Rivera, I.P. Quality Management System for Higher Education: A Systematic Review. Data Metadata 2023, 2, 100. [Google Scholar] [CrossRef]
- Soto, I.B.R.; Marín-Rodriguez, W.J.; Baldeos-Ardían, L.A.; Líoo-Jordán, F.d.M.; Villanueva-Cadenas, D.I.; Soledispa-Cañarte, B.J.; Soledispa-Cañarte, P.A. Teacher Training, Work, Profession in the Pandemic and Post-Pandemic Context. Salud Cienc. Y Tecnol. 2023, 3, 338. [Google Scholar] [CrossRef]
- Casquete-Tamayo, E.J.; Delgado Mendoza, H. Effects of the Pandemic on Education, Training, Teaching Work and Student Learning. Salud Cienc. Y Tecnol. 2023, 3, 332. [Google Scholar] [CrossRef]
- Teven, J.J.; Gorham, J. A Qualitative Analysis of Low-Inference Student Perceptions of Teacher Caring and Non-Caring Behaviors within the College Classroom. Int. J. Phytoremediation 1998, 15, 288–298. [Google Scholar] [CrossRef]
- Straits, W. “She’s Teaching Me”: Teaching with Care in a Large Lecture Course. Coll. Teach. 2007, 55, 170–175. [Google Scholar] [CrossRef]
- Grande, V.; Lennerfors, T.T.; Peters, A.K.; von Hausswolff, K. The Virtuous, the Caring, and the Free: Ethical Theory to Understand the Ethics of the Teacher as a Role Model in Engineering Education. Eur. J. Eng. Educ. 2024, 49, 1–21. [Google Scholar] [CrossRef]
- Armstrong-Carter, E.; Panter, A.T.; Hutson, B.; Olson, E.A. A University-Wide Survey of Caregiving Students in the US: Individual Differences and Associations with Emotional and Academic Adjustment. Humanit. Soc. Sci. Commun. 2022, 9, 1–10. [Google Scholar] [CrossRef]
- Solorzano-Aparicio, M.L.; Zapata-Silva, I.M.; Meneses-La-Riva, M.E.; Morales-García, W.C.; Da Costa Poland, A.; Cabanillas-Chavez, M.T. Nursing Teaching-Learning Process in Virtual Environments-Perspective of Teachers and Students. Acad. J. Interdiscip. Stud. 2024, 13, 24. [Google Scholar] [CrossRef]
- Carranza Esteban, R.F.; Mamani-Benito, O.; Morales-García, W.C.; Caycho-Rodríguez, T.; Ruiz Mamani, P.G. Academic Self-Efficacy, Self-Esteem, Satisfaction with Studies, and Virtual Media Use as Depression and Emotional Exhaustion Predictors among College Students during COVID-19. Heliyon 2022, 8, e11085. [Google Scholar] [CrossRef] [PubMed]
- Barrow, M. Caring In Teaching: A Complicated Relationship. J. Eff. Teach. 2015, 15, 45–59. [Google Scholar]
- Sun, Y. The Effect of Teacher Caring Behavior and Teacher Praise on Students’ Engagement in EFL Classrooms. Front. Psychol. 2021, 12, 746871. [Google Scholar] [CrossRef] [PubMed]
- Liu, Q.; Du, X.; Lu, H. Teacher Support and Learning Engagement of EFL Learners: The Mediating Role of Self-Efficacy and Achievement Goal Orientation. Curr. Psychol. 2023, 42, 746871. [Google Scholar] [CrossRef]
- Song, L.; Luo, R.; Zhan, Q. Toward the Role of Teacher Caring and Teacher-Student Rapport in Predicting English as a Foreign Language Learners’ Willingness to Communicate in Second Language. Front. Psychol. 2022, 13, 874522. [Google Scholar] [CrossRef]
- Thurman, S.L. Applying Principles of Respectful Caregiving to Teaching in Higher Education. Sch. Teach Learn. Psychol. 2023. [Google Scholar] [CrossRef]
- Sitzman, K. Student-Preferred Caring Behaviors for Online Nursing Education. Nurs. Educ. Perspect. 2010, 31, 171–178. [Google Scholar] [PubMed]
- Garza, R.; Van Overschelde, J.P. Instrument Development: Faculty Caring Survey. Tex. Forum Teach. Educ. 2018, 8, 72–85. [Google Scholar]
- Ato, M.; López, J.J.; Benavente, A. A Classification System for Research Designs in Psychology. An. Psicol. 2013, 29, 1038–1059. [Google Scholar] [CrossRef]
- R Core Team. A Language and Environment for Statistical Computing, R, Version 4.3.2; R Core Team: Vienna, Austria, 2019.
- Ferrando, P.J.; Lorenzo-Seva, U. El Análisis Factorial Exploratorio de Los Ítems: Algunas Consideraciones Adicionales. An. De Psicol. 2014, 30, 1170–1175. [Google Scholar] [CrossRef]
- Kaiser, H.F. An Index of Factorial Simplicity. Psychometrika 1974, 39, 31–36. [Google Scholar] [CrossRef]
- Lewis, N.D. 100 Statistical Tests in R: What to Choose, How to Easily Calculate, with over 300 Illustrations and Examples; Heather Hills Press: Romeo, MI, USA, 2013; ISBN 1484052994/9781484052990. [Google Scholar]
- Lloret-Segura, S.; Ferreres-Traver, A.; Hernández-Baeza, A.; Tomás-Marco, I. Exploratory Item Factor Analysis: A Practical Guide Revised and Updated. An. Psicol. 2014, 30, 1151–1169. [Google Scholar] [CrossRef]
- Nunnally, J.C.; Bernstein, I.H. Psychometric Theory, 3rd ed.; McGraw-Hill Education: Blue Ridge Summit, PA, USA, 2010. [Google Scholar]
- Muthen, L.; Muthen, B. Mplus Statistical Analysis with Latent Variables. User’s Guide, 8th ed.; Muthen & Muthen Editorial: Los Angeles, CA, USA, 2017. [Google Scholar]
- Schumacker, R.E.; Lomax, R.G. A Beginner’s Guide to Structural Equation Modeling, 4th ed.; Taylor & Francis: New York, NY, USA, 2016. [Google Scholar]
- Bandalos, D.L.; Finney, S.J. Factor Analysis: Exploratory and Confirmatory. In Reviewer’s Guide to Quantitative Methods in the Social Sciences; Hancock, G.R., Stapleton, L.M., Mueller, R.O., Eds.; Routledge: New York, NY, USA, 2019; pp. 1–376. [Google Scholar]
- Kline, R.B. Principles and Practice of Structural Equation Modeling; Cuarta, Ed.; Guilford Press: New York, NY, USA, 2016. [Google Scholar]
- McDonald, R.P. Test Theory: A United Treatment; Lawrence Erlbaum: Mahwah, NJ, USA, 1999. [Google Scholar]
- Revelle, W. How To: Use the Psych Package for Factor Analysis and Data Reduction; Northwestern University: Evanston, IL, USA, 2022. [Google Scholar]
- Hancock, G.R.; Mueller, R.O. Structural Equation Modeling: A Second Course; Information Age Publishing Inc.: Charlotte, NC, USA, 2013. [Google Scholar]
- Hair, J.F.; Black, W.C.; Babin, B.J.; Anderson, R.E. Multivariate Data Analysis, 8th ed.; Cengage Learning: Hampshire, UK, 2019. [Google Scholar]
- Desjardins, C.D.; Bulut, O. Handbook of Educational Measurement and Psychometric Using R; Taylor and Francis Group: Boca Raton, FL, USA, 2018. [Google Scholar]
- Chen, F.F. Sensitivity of Goodness of Fit Indexes to Lack of Measurement Invariance. Struct. Equ. Model. 2007, 14, 464–504. [Google Scholar] [CrossRef]
- Cheung, G.W.; Rensvold, R.B. Evaluating Goodness-of-Fit Indexes for Testing Measurement Invariance. Struct. Equ. Model. 2009, 9, 233–255. [Google Scholar] [CrossRef]
- Finney, S.J.; DiStefano, C. Nonnormal and Categorial Data in Structural Equation Modeling. In Structural Equation Modeling: A Second Course; Information Age Publishing Inc.: Charlotte, NC, USA, 2013. [Google Scholar]
- Raykov, T.; Hancock, G.R. Examining Change in Maximal Reliability for Multiple-Component Measuring Instruments. Br. J. Math. Stat. Psychol. 2005, 58, 65–82. [Google Scholar] [CrossRef]
- Fornell, C.; Bookstein, F.L. Two Structural Equation Models: LISREL and PLS Applied to Consumer Exit-Voice Theory. J. Mark. Res. 1982, 19, 440. [Google Scholar] [CrossRef]
- Fornell, C.; Larcker, D.F. Evaluating Structural Equation Models with Unobservable Variables and Measurement Error. J. Mark. Res. 1981, 18, 39. [Google Scholar] [CrossRef]
- Brown, T.A. Confirmatory Factor Analysis for Applied Research, 2nd ed.; Guilford Press: New York, NY, USA, 2015. [Google Scholar]
Disclaimer/Publisher’s Note: The statements, opinions and data contained in all publications are solely those of the individual author(s) and contributor(s) and not of MDPI and/or the editor(s). MDPI and/or the editor(s) disclaim responsibility for any injury to people or property resulting from any ideas, methods, instructions or products referred to in the content. |
© 2024 by the authors. Licensee MDPI, Basel, Switzerland. This article is an open access article distributed under the terms and conditions of the Creative Commons Attribution (CC BY) license (https://creativecommons.org/licenses/by/4.0/).