Article

AI Eye-Tracking Technology: A New Era in Managing Cognitive Loads for Online Learners

by
Hedda Martina Šola
1,2,*,
Fayyaz Hussain Qureshi
3 and
Sarwar Khawaja
3
1
Oxford Centre for Applied Research and Entrepreneurship (OxCARE), Oxford Business College, 65 George Street, Oxford OX1 2BQ, UK
2
Institute for Neuromarketing & Intellectual Property, Jurja Ves III spur no 4, 10000 Zagreb, Croatia
3
Oxford Business College, 65 George Street, Oxford OX1 2BQ, UK
*
Author to whom correspondence should be addressed.
Educ. Sci. 2024, 14(9), 933; https://doi.org/10.3390/educsci14090933
Submission received: 29 May 2024 / Revised: 16 August 2024 / Accepted: 22 August 2024 / Published: 25 August 2024

Abstract

:
Eye-tracking technology has emerged as a valuable tool for evaluating cognitive load in online learning environments. This study investigates the potential of AI-driven consumer behaviour prediction eye-tracking technology to improve the learning experience by monitoring students’ attention and delivering real-time feedback. In our study, we analysed two online lecture videos used in higher education from two institutions: Oxford Business College and Utrecht University. We conducted this analysis to assess cognitive demands in PowerPoint presentations, as this directly affects the effectiveness of knowledge dissemination and the learning process. We utilised a neuromarketing-research consumer behaviour eye-tracking AI prediction software called ‘Predict’, which employs an algorithm constructed on the largest neuroscience database (comprising previous studies conducted on live participants n = 180,000 with EEG and eye-tracking data). The analysis for this study was carried out using the programming language R, followed by a series of t-tests for each video and Pearson’s correlation tests to examine the relationship between ocus and cognitive demand. The findings suggest that AI-powered eye-tracking systems have the potential to transform online learning by providing educators with valuable insights into students’ cognitive processes and enabling them to optimise instructional materials for improved learning outcomes.

1. Introduction

Eye-tracking technology records and assesses cognitive and metacognitive processes during learning. This technology facilitates the incorporation of diverse learning materials and is utilised in recording data for dynamic and static parameters. Fixations, a static metric, represent the student’s focus on the teacher during instruction. When the cognitive load is high, fixations are reduced [1]. Eye-tracking technology enables students to visualise various aspects of a learning project within multimedia environments. By examining these records, educators can identify students’ cognitive load when completing tasks. AI enhances eye-tracking technology in online learning by leveraging advanced machine learning and computer vision techniques to improve accuracy, accessibility, and adaptability. Recent developments in deep learning have enabled eye tracking using standard webcams, significantly reducing the need for expensive hardware. This advancement allows for more accessible and scalable eye-tracking solutions, crucial for remote learning environments. For instance, appearance-based deep learning models have been shown to achieve high gaze and blink detection accuracy, with a gaze accuracy of 2.4° and precision of 0.47°, outperforming previous online studies and narrowing the gap between laboratory and online performance [2].
Moreover, AI models such as convolutional neural networks (CNNs) have been effectively used to interpret biometric data, including eye tracking and EEG, to assess cognitive states in online learning environments. These models can provide insights into student engagement and cognitive activity, which are critical for enhancing educational outcomes. The CNN model, in particular, demonstrated superior performance in interpreting complex data patterns, achieving an area under the curve value of 0.98, indicating its potential for creating more interactive and personalised learning experiences [3]. Additionally, AI techniques like recursive least-squares estimation (LSE) aid in online learning visual tracking by improving model adaptation and reducing overfitting risks. This approach allows for efficient memory retention and fast adaptation, essential for maintaining high discrimination power in dynamic online learning settings [4,5]. Cognitive load refers to the mental resources learners must devote to working memory. The information stored in working memory is limited. Hence, the perception of cognitive load depends on the cognitive effort and type of task that each learner is required to complete [6]. Cognitive load is contingent upon understanding the task, its complexity, and the time students need to resolve it [1]. In this context, the prior knowledge of a student is crucial. When an instructor identifies the task with the highest cognitive load, it becomes easier to reinforce understanding. Once this knowledge gap is addressed, there is the potential to achieve improved learning outcomes. Cognitive load is based on the premise that working memory cannot process multiple tasks.
As per Sáiz-Manzanares [1], the capacity of working memory is diminished when it is burdened with several activities. This highlights the significance of instructional policymakers designing educational materials that minimise cognitive load, as outlined by [7,8]. Moreover, Liu et al. [8] expounded on the use of eye tracking in optimising knowledge for students and educators. Online learning relies on multimedia images to overcome the limitations of inadequate equipment. In this regard, task-relevant graphics enhance learning, while inappropriate ones hinder the construction of mental models. These images and graphics demonstrate the importance of visualisation in education as it promotes student understanding, creativity, and cognitive psychology.
Eye tracking is employed to measure cognitive load in online education. It is also utilised in different visualisation domains, such as evaluation, visual systems, display items, and gaze-associated graph visualisation. Eye movement is a crucial visual processing measure. Numerous researchers have explained the procedures for comprehending eye tracking and its operation [7]. Typically, eye tracking involves acquiring eye movement data, selecting an evaluation technique, choosing indicators, and analysing the data. Two critical aspects of eye movement are saccades and fixations. A saccade refers to the eye’s movement between fixations, while a fixation is the eye’s initial position. Eye-tracking technologies are applicable within online environments to provide procedure signals, particularly for complex visual tasks. The emphasis is on comprehending a student’s focus of concentration by assessing visual behaviour, and it is an educational tool for improving task learning and performance.
Eye tracking is a valuable method for assessing students’ cognitive abilities, which Jamil et al. [9] referred to as achieving automated attention. Jamil et al. [9] also highlighted the connection between attention, gaze direction, visual fixation, and eye movements. For instance, it is possible to gauge cognitive involvement by observing a student’s focus and the teacher’s direction. The greater the concentration, the more engaged the student is. In a study by Jamil et al. [9], eye tracking was used to monitor students’ focus while completing tasks on a computer. The results demonstrated that students who successfully solved tasks concentrated mainly on diagrams related to the task.
Pouta et al. [10] used eye tracking to assess teacher eye movements and student–teacher interaction in an arithmetic class. The study’s findings revealed that an experienced teacher will have more intense eye movements and look more into the students’ eyes. Similarly, Haataja et al. [3] evaluated the relationship between instructor behaviour and direct eye gaze. The authors utilised eye-tracking movements in a simulation within the learning environment. The results showed that students’ and teachers’ gaze behaviour is related to an instructor’s interpersonal behaviour. Both researchers have adopted eye tracking to investigate student–teacher interactions in natural classroom environments.

Eye-Tracking Case Studies: Examples in Education

Eye tracking in education has been demonstrated to enhance cognitive load through various case studies. Galovicova and Kremenova conducted the first study at Kennesaw University in the United States. This study utilised eye-tracking technology to monitor student attention and understand the connection between focus, gaze patterns, and student attention in class.
The study participants were natural science lecture students, and the sample comprised eight female individuals aged 20. The professor used PowerPoint presentations, allowing students to print the presentation earlier or download it electronically. The team recorded inattention or increased attention among the students at regular intervals. The research revealed that the student-testers were active in all formats during teaching, whether looking at the board, images, or speakers. However, they were inactive when looking at their mobile phones, walls, or classmates.
A noteworthy finding from this case study was that students spent minimal time focusing on the educator despite other factors. The students read the PowerPoint images during the lecture and even looked at their notes. Nevertheless, they followed the professor whenever he drew something on the board or inserted humour or analogy that referred to something unique drawn on the board. In this study, new images captured all students’ attention, and the information on the slide attracted their interest. The team assessed the events surrounding student focus in the first ten minutes of the class. The results showed the non-linearity of attention and revealed that many factors affected the students’ focus. In this case study, the teachers used PowerPoint presentations and allowed students to print these presentations earlier. The students used the presentation as study material, saving money and time. This case example highlighted the need to eliminate distractions, increase student attention, and enhance education. Additionally, Dass et al. explored the relationship between eye movements and academic performance, finding significant differences in saccade latency between high and low performers. This suggests that eye tracking can be a valuable tool for assessing student engagement and performance, potentially leading to more personalised learning interventions [11].
Eye-tracking studies with PowerPoint learning can be used to identify cognitive load and improve learner engagement, as evidenced by multiple research findings. Eye-tracking technology provides valuable insights into cognitive load by analysing gaze patterns and ocular parameters, which can indicate the mental effort required during learning tasks. For instance, Sáiz Manzanares et al. demonstrated that eye tracking could identify clusters related to cognitive load in relevant and non-relevant areas of interest, suggesting its utility in understanding and potentially reducing cognitive load in educational settings [12]. Moreover, eye tracking can enhance learner engagement by providing data on how students interact with learning materials. Jaiswal et al. found that eye tracking could measure engagement levels through indicators such as fixation duration and pupil dilation during experiential learning tasks. The study highlighted that students showed higher engagement with video components, suggesting that eye tracking can inform the design of more engaging learning experiences [13]. Eye-tracking studies offer a promising approach to understanding and improving cognitive load and learner engagement in educational settings, including PowerPoint learning, by providing detailed insights into how students interact with and process learning materials [11,12,13,14,15].
The second instance of eye-tracking research in educational settings aims to create attention-aware systems (AASs). These AASs identify users’ attention states and transform human–computer interactions (HCIs) to make them more immersive, effective, and intuitive. A student’s focus of attention is precious in HCI applications, including intelligent spaces and computing environments where users’ intentions and goals are constantly monitored [16]. AASs’ benefits include providing instruction to different learners, evaluating student performance, offering feedback when developing curricula, and adding value to computer-aided teaching methods.
An AAS helps increase a student’s level of attention. An AAS operates on various principles, often based on human actions, and considers multiple cues, such as sound sources, eye gaze directions, and physiological signal measures, including eye gaze. An AAS uses machine learning models and is built on the most prominent brainwave signals to identify students’ attention spans, providing the potential for prompt alerts to show deficits in attention levels to online tutors. Based on this case study, it was clear that AAS remains an effective tool aiding online tutors in evaluating students’ attention levels and improving online learning performances.
In another significant case study, Chen and Wang [17] created an attention monitoring and alarm mechanism (AMAM) that used brainwave signals to enhance learning performance. The AMAM monitors an individual learner’s attention state and helps online instructors maintain student attention. The study demonstrated that the AMAM effectively promoted sustained learner attention and learning performance. Furthermore, a meta-analysis of EEG monitoring, which shares conceptual similarities with the AMAM’s attention monitoring, found a moderately positive effect on online learning achievement, particularly in immersive and interactive learning environments [18].
Another notable example was the attention-based video lecture review mechanism (AVLRM), which utilised eye tracking to produce video segments reviewed according to a student’s attentional status. The case study results revealed that the AVLRM system, which employs brainwave signal detection technology, effectively pinpoints video segments that are essential for adequate review. The case examples highlighted that the attention model concentrates on multimedia meetings and recording analysis. Overall, the AMAM’s effectiveness in promoting sustained attention is linked to its ability to focus learners on relevant information and maintain engagement, critical factors in enhancing learning performance. The integration of attention mechanisms across different modalities and contexts underscores its potential as a powerful tool in educational settings [17,18,19,20].

2. Materials and Methods

In this study, we analysed the relationship between focus and cognitive demand (CD) for two online video lectures: one from Utrecht University, which was 2 min and 25 s in duration, and the other from Oxford Business College (OBC), which was 2 min and 24 s in duration. Eye tracking in video online learning is a burgeoning area of research that seeks to enhance understanding of learners’ attentional engagement and cognitive states. Eye-tracking technology, mainly through inter-subject correlation (ISC) of eye movements, has shown promise in predicting attentional states in online video learning environments. This method can assess attention at a finer level beyond simple dichotomies, such as attending versus distracted states, and is effective regardless of learners’ different learning styles [21].
Testing cognitive demands in PowerPoint presentations in higher education is essential because doing so directly impacts the effectiveness of knowledge dissemination and the learning process. Cognitive load theory suggests that presentations with high cognitive load can impede learning by overloading working memory, leading to decreased retention and understanding [22,23]. For instance, a study on online mathematics textbooks revealed that a significant portion of tasks were rated as high in cognitive demand, yet this did not correlate with improved learner performance, suggesting a need for more nuanced task design and assessment methods that consider learners’ perspectives [24].
To ensure the validity of our research, we sought out a suitable video from an open repository that met several criteria: (1) the video had to be created by a university professor who was visible in the recording, (2) the video had to be published by the university in an open academic repository with a CC 4.0 license for academic, scientific, and research purposes, (3) the video had to be less than 3 min in length, (4) the video had to be created for college students, (5) the video had to contain engaging content to hold the viewer’s attention, (6) the video could not be more than six years old, and (7) the video had to be filmed in high resolution to meet the requirements of our research. We identified the video from Utrecht University and used it in our study while filming another video at Oxford Business College that met the same criteria, enabling us to compare the two videos for our research. We utilised Predict, a neuromarketing eye-tracking AI prediction software (version 1.0), to evaluate the user experience in online learning. This algorithm, developed in collaboration with Stanford University, incorporates consumer psychology theory, neuroscience tools, and insights. Predict is built on one of the world’s largest consumer neuroscience databases, encompassing 100 billion+ consumer-behaviour data points (n = 180,000) from eye tracking (Eye Tracker: Tobii X2-30, Tobii Pro AB, Danderyd, Sweden). The number of complete databases confirms the model’s relevance, explaining how the models are built, which are highly predictive, and how the company will continue to expand their models. Predict’s model database includes eye-tracking, EEG, and implicit-response data. So far, the algorithm has only been built on the eye-tracking recordings. The eye-tracking recordings, taken globally in 15 different consumer contexts (n = 180,000), trained an encoder–decoder architecture (ConvNext as a pre-trained encoder). The database expands monthly, is yearly upgraded with 50,000+ participants, and is extended in various consumer contexts as the AI learns from each research study. The provider has secured a predicate accuracy rate of 97–99% for attention, the highest in the industry, due to the software’s collaboration with Stanford University [25]. Measuring focus and cognitive demand in online learning is essential for creating adaptive, personalised, and effective educational experiences. It enables educators to understand better and support learners’ cognitive processes, ultimately leading to improved engagement and learning outcomes [24,26,27,28,29]. Appendix A and Appendix B provide an example of the partial Predict report. It is worth noting that the software was developed using real responses and the Eye Tracker Tobii X2-30. The model training details are as follows: encoded–decoder architecture, ConVNext as a pre-trained encoder, with the predicted model trained over 30 different models and built on the largest neuromarketing database of high-quality eye-tracking data from almost 20,000 participants. This database is updated annually with additional participants. The software provider has secured a predicate accuracy rate of 95% for attention, the highest in the industry [25,30]. Our primary objective was to investigate the relationship between Focus (an index of focused attention) and CD (a quantitative measure of the amount of information to be processed), as we aimed to comprehend how these variables interact differently for different video lectures. Integrating cognitive load measurements into learning management systems (LMSs) can support asynchronous e-learning by providing insights into learners’ cognitive processes. This can help educators design more effective instructional sequences and manage cognitive load, enhancing learning outcomes [29]. Various analytical frameworks, such as Bloom’s Taxonomy and the Community of Inquiry, further support the development of pedagogically relevant measures that can offer valuable insights into cognitive activity distinct from typical interaction measures [28].
To achieve this, we compared the results and patterns of two video lectures. We utilised the Focus score in the Predict software, version 1.0, derived from the heat map and based on “attention dispersion,” a measure of how a viewer’s visual attention is distributed across different content elements. The Focus score identifies areas where viewers’ eyes are likely to be concentrated, indicating heightened focus or scattered focus across the content, suggesting a more dispersed or distracted attention. This software is grounded in a unique floating window operation that spans a 2 s time frame, ensuring precise, human-like attention behaviour predictions. By constantly analysing the shifting visual landscape of a video, this software can highlight those moments and elements most likely to seize a viewer’s gaze. This technique effectively captures the nuanced lags in human attention, ensuring a robust alignment of the model’s predictions with actual human eye movement patterns in video contexts (the related data can be found in Appendix A and Appendix B). Integrating eye tracking with additional technologies and methodologies provides a robust framework for understanding and enhancing attentional engagement in video online learning. This multi-faceted approach not only improves the accuracy of attention assessment but also supports the development of more effective educational tools and interfaces [2,21,31,32].
We intended to utilise these insights to identify how diverse elements in a video lecture can predict cognitive loads. Multiple studies have evidenced that multimedia elements in video lectures can predict higher cognitive loads among learners. The research by Gu et al. highlights that the onscreen presence of an instructor, whether human or animated, can enhance learning outcomes by increasing neural synchronisation and engagement in socio-emotional processing and working memory. However, this also introduces additional processing demands, suggesting a trade-off between cognitive benefits and attentional distraction [33]. This indicates that while multimedia elements can enhance learning, they may also increase cognitive load due to the need for attentional control. Asaadi et al. further support this by demonstrating that poorly designed multimedia can impose significant cognitive loads, affecting attention and semantic processing. Their EEG study showed that cognitive load could be predicted and measured, with higher loads correlating with decreased attention and delayed processing [34]. Thus, designing a lecture can benefit from the contribution of neuromarketing research to identify relevant approaches, which cannot be generalised as they may prove to be a function of the respective subject and audience. The balance between engaging content and cognitive demands is crucial for effective multimedia learning [35,36].
By assessing cognitive demands, educators can design slides that facilitate learning by reducing unnecessary cognitive load and aligning with principles from cognitive psychology [23]. Interestingly, while PowerPoint is a prevalent tool in academic settings, studies have shown that the visual features of presentations are often not optimised, with many slides being poorly designed and contributing to cognitive overload [23,37]. Furthermore, the use of visuals in PowerPoint presentations has been found to be predominantly scriptural, indicating a potential underutilisation of visuals that could aid in reducing cognitive load and enhancing communication [37,38].
To predict CD, the software relies on mathematical foundations that guarantee that the CD scores exhibit reliability across diverse scenarios, accurately reflecting the cognitive demand of processing visuals. The software has been constructed upon industry-specific benchmarks for cognitive demand. It has evaluated scores based on the type of images, including vertical ones such as a website, print ads, and banners, and horizontal images. This functionality makes the software highly worthy of use in various forms of neuromarketing research [25]. The analysis for this study was conducted using the programming language R v. 2023.06.0+421. Initially, we assessed the general scores for Focus and Cognitive Demand (CD) for both videos. We compared them to the Attention Video Recall and Logo Memorability (AVRLM) indexed ranges, a component of our neuromarketing prediction software algorithm. We also utilised these benchmarks to evaluate each other. The Focus score detects areas of the content where the audience’s attention is likely to be concentrated, indicating heightened focus or focus being scattered, suggesting a more dispersed or distracted attention. This software relies on a novel floating window operation that lasts for 2 s, allowing for precise and human-like attention behaviour predictions. The software identifies those moments and elements most likely to capture a viewer’s gaze by continuously examining the video’s visually changing landscape. This method effectively captures the intricate lags in human attention, ensuring that the model’s predictions align accurately with human eye movement patterns in video contexts. As per the tool, scores ranging from 0 to 24 indicate low Focus, indicating that numerous elements are competing for attention. In contrast, scores ranging from 75 to 100 indicate high Focus, suggesting that a single or few narrow areas attract the most attention and are more likely to be noticed. To predict CD, the software depends on mathematical principles that ensure the scores exhibit dependability in various situations, precisely reflecting the cognitive demand in processing visuals. The software has been developed using industry-specific criteria for cognitive demand. It assesses scores based on various images, such as vertical images like websites, print ads, and banners, as well as horizontal photographs.
Similarly, scores ranging from 0 to 24 for CD suggest that the information is too easy to process, potentially reducing viewing time. Conversely, scores ranging from 75 to 100 indicate high complexity in the information, potentially overwhelming the viewers.
Following the data cleansing process, which focused solely on the Focus and CD scores, we divided the datasets for both videos into high- and low-Focus-score frames and high- and low-CD-score frames, using the mean scores as the threshold for these divisions. We subsequently mapped these points to the timestamps in the video to gain insights into the underlying reasons for the observed patterns of scores. This was followed by conducting a series of t-tests for each video, with the first objective being to determine whether there was a statistically significant difference between the CD scores for the high- and low-Focus frames, and the second objective being to assess whether there was a statistically significant difference between the Focus scores for the high- and low-CD frames. Finally, we conducted Pearson’s correlation tests to examine the relationship between Focus and CD for each of the videos, both overall and for each condition (high- and low-Focus frames and high- and low-CD frames).

3. Results

The results of the video lecture at Utrecht University demonstrated a low level of Focus (mean = 23.803, SD = 17.42) and a moderate level of Cognitive Demand (CD) (mean = 68.82, SD = 17.75), with scores ranging from 3.29 to 91.44 and 20.86 to 94.69, respectively. Conversely, the video lecture at OBC revealed a moderate level of Focus (mean = 43.17, SD = 3.98) and a high level of CD (mean = 83.3, SD = 0.451), with scores ranging from 30.88 to 53.91 and 80.73 to 83.81, respectively. The mean, standard deviation, and range of Focus and CD for each condition of both video lectures are presented in Table 1.

3.1. Utrecht University Video Lecture Insights

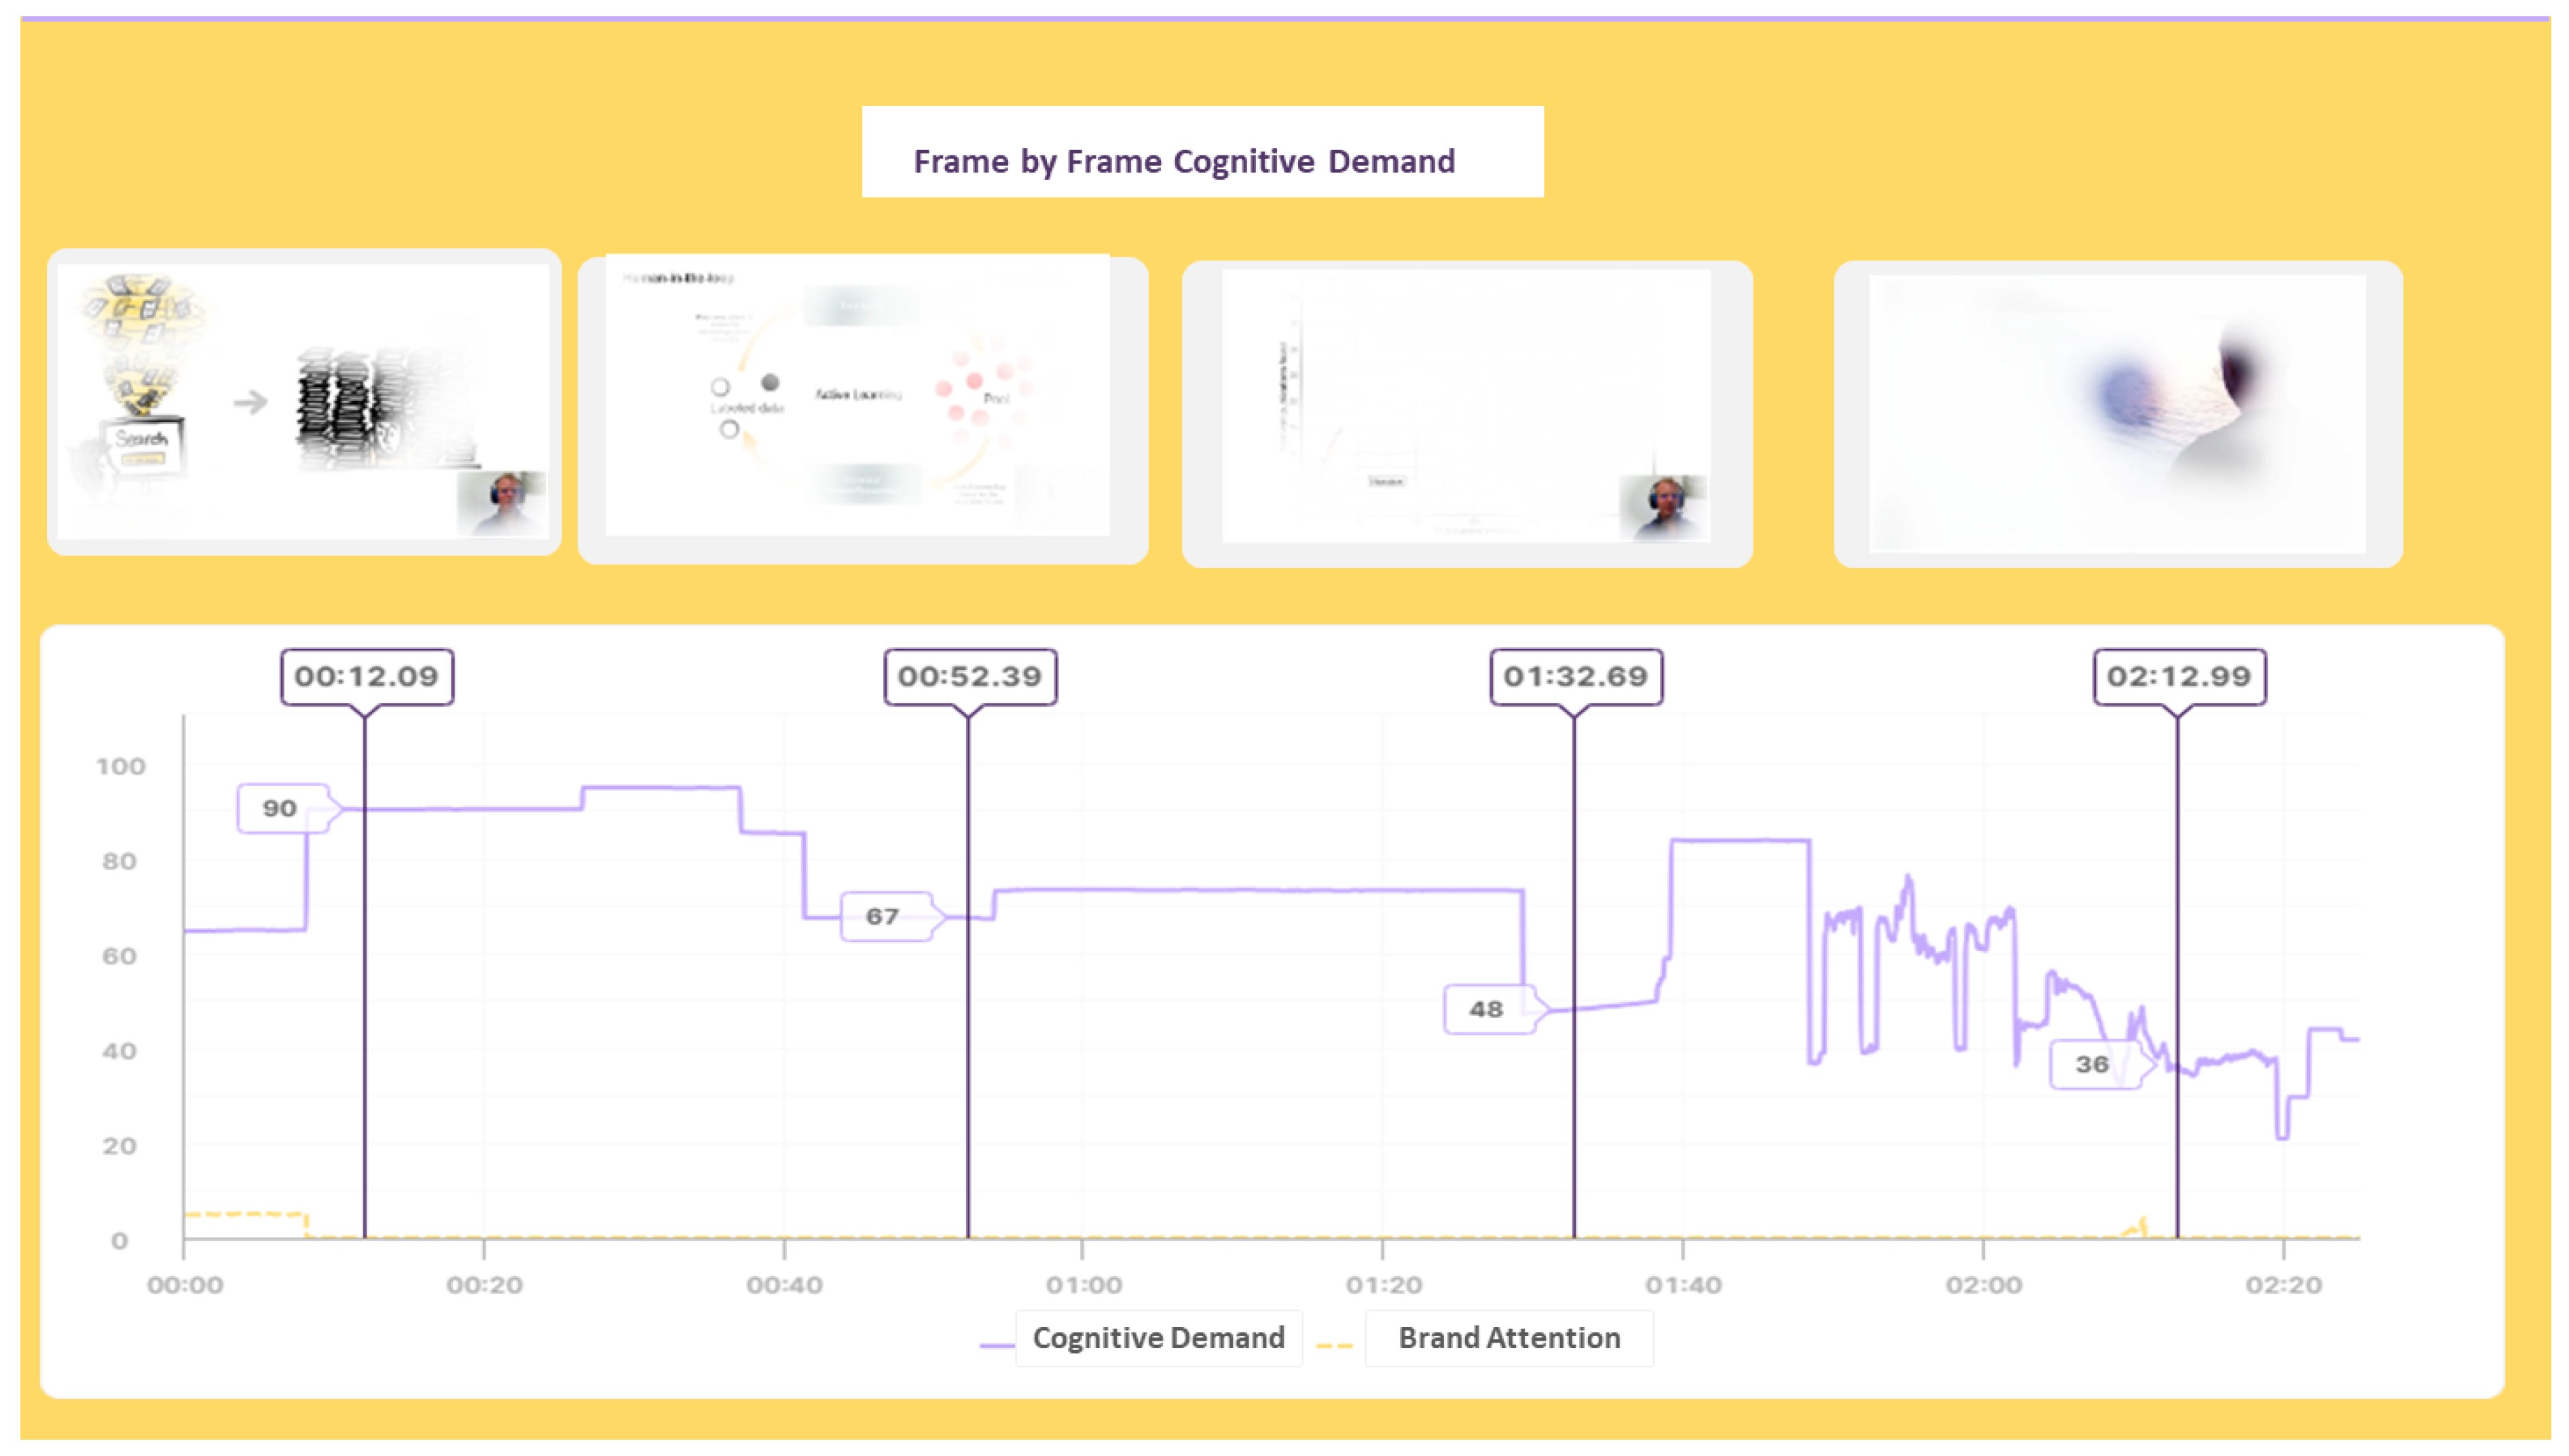
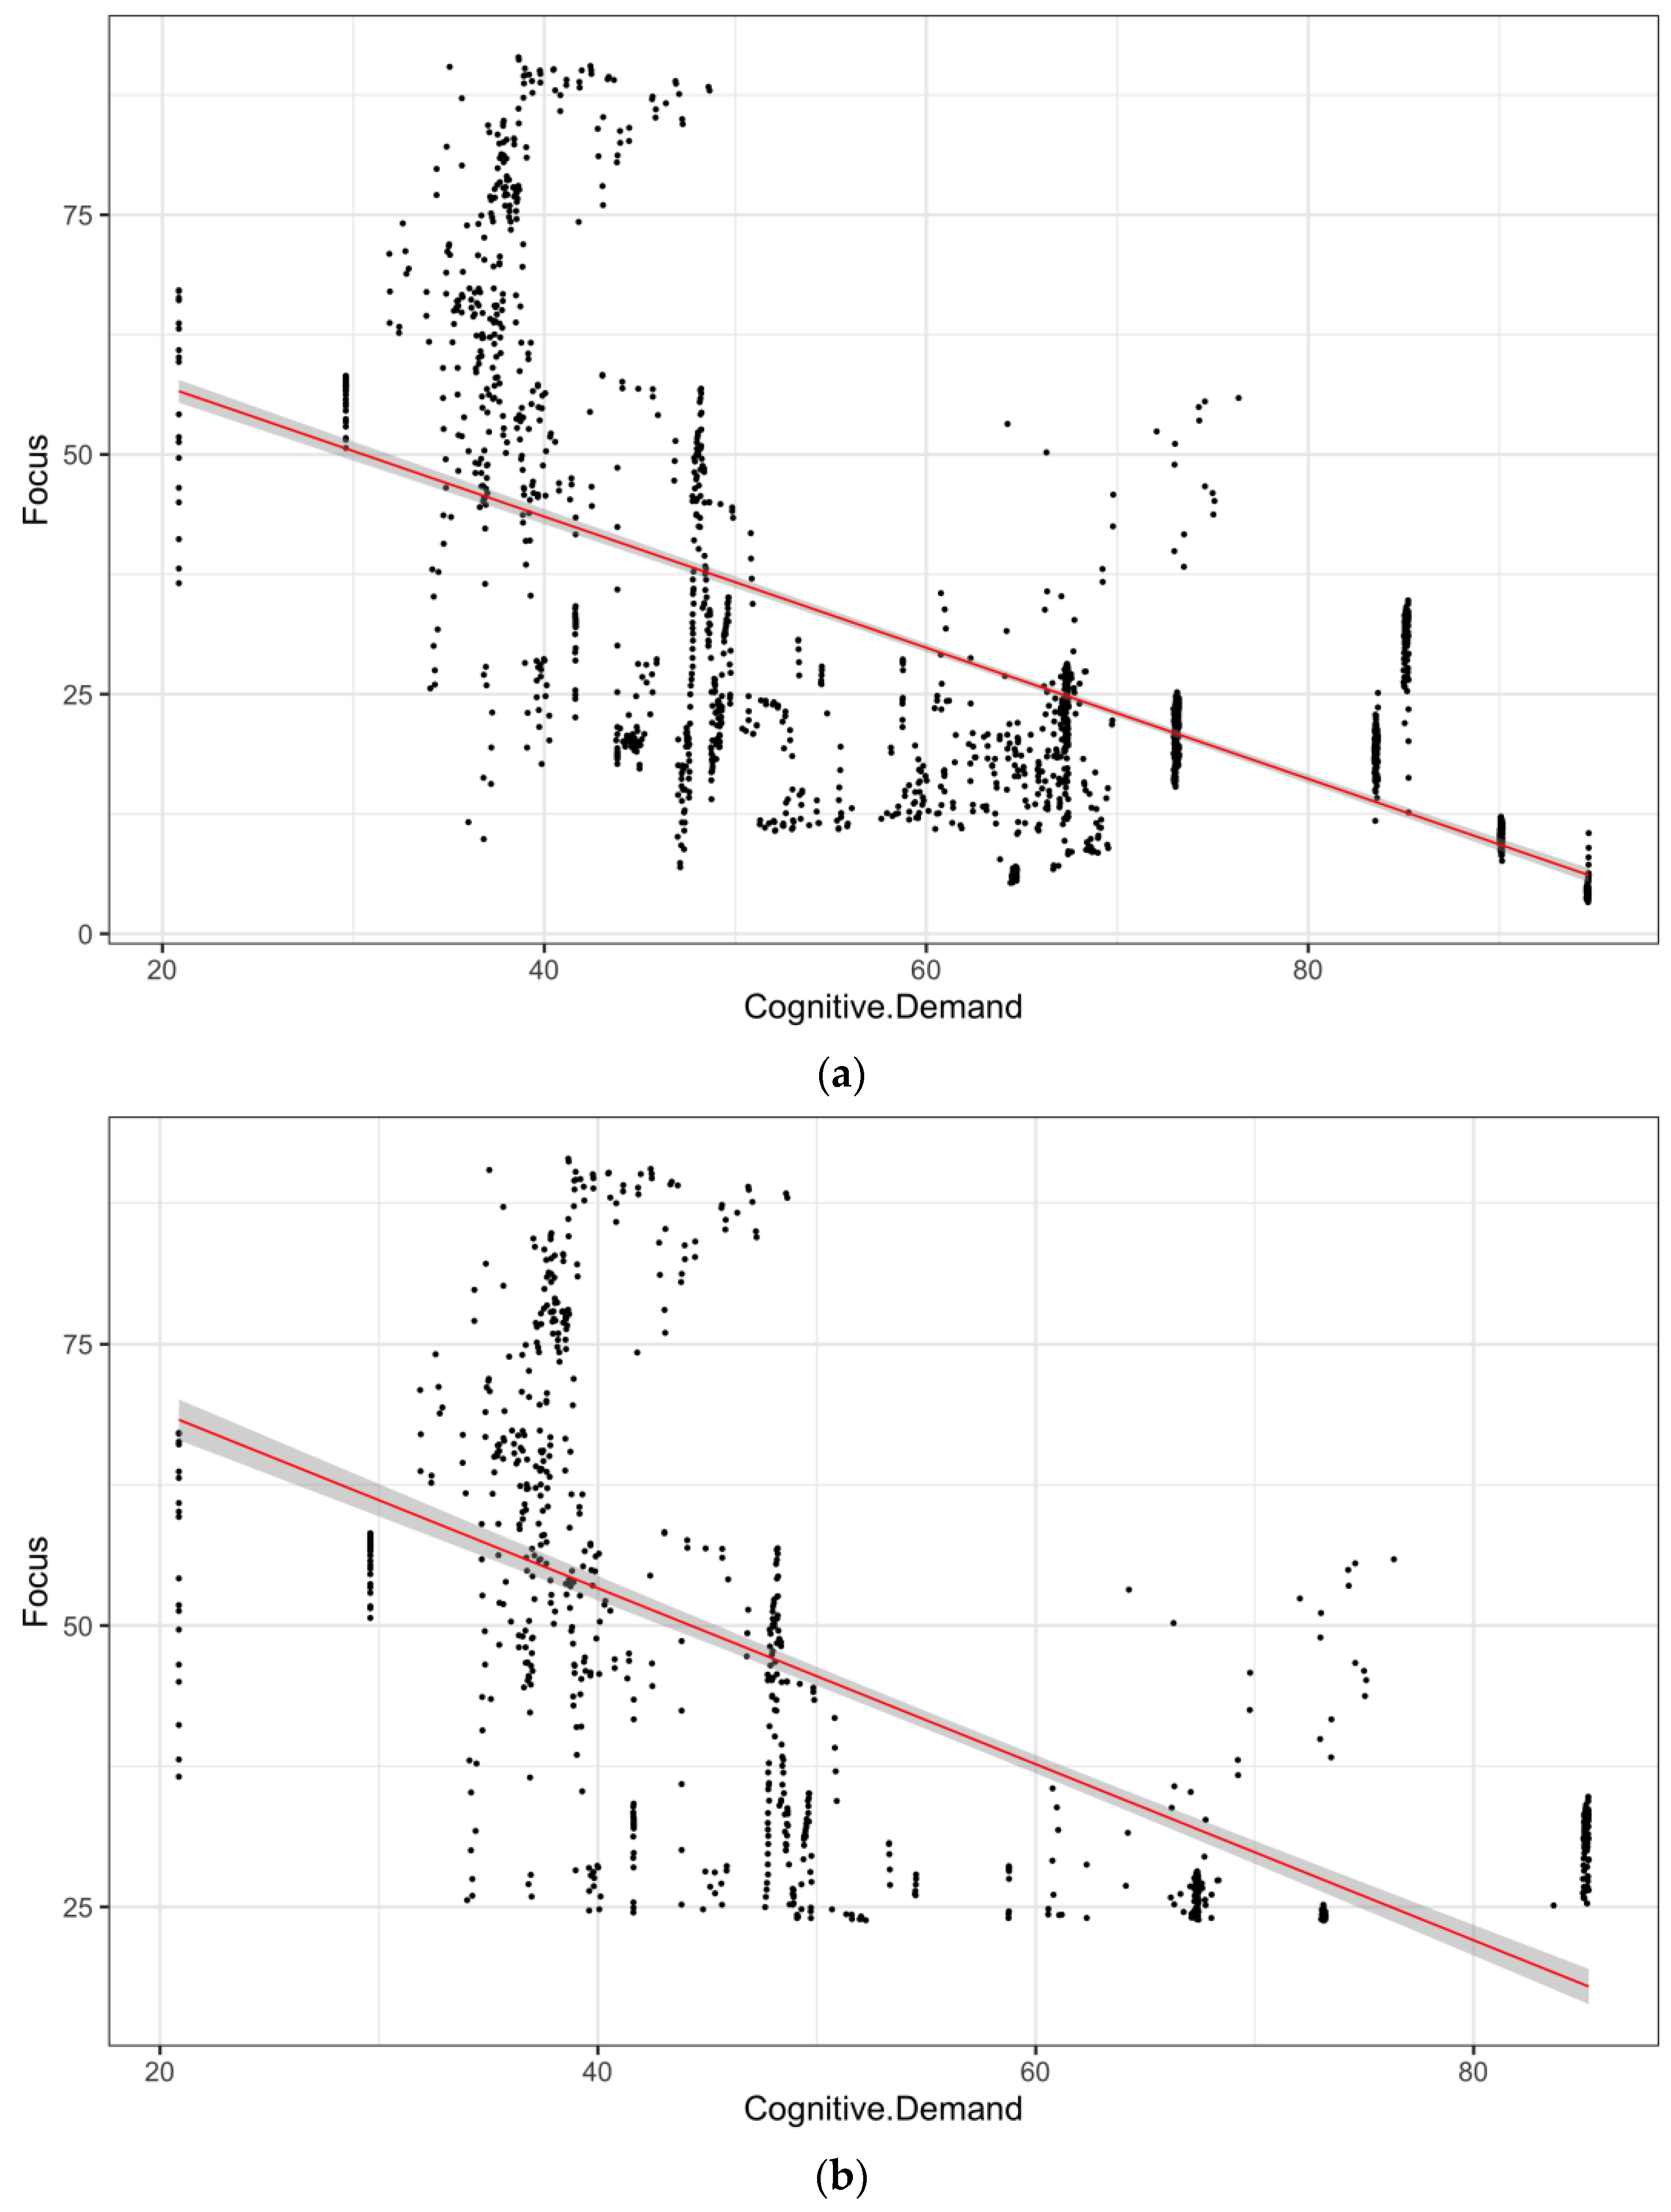
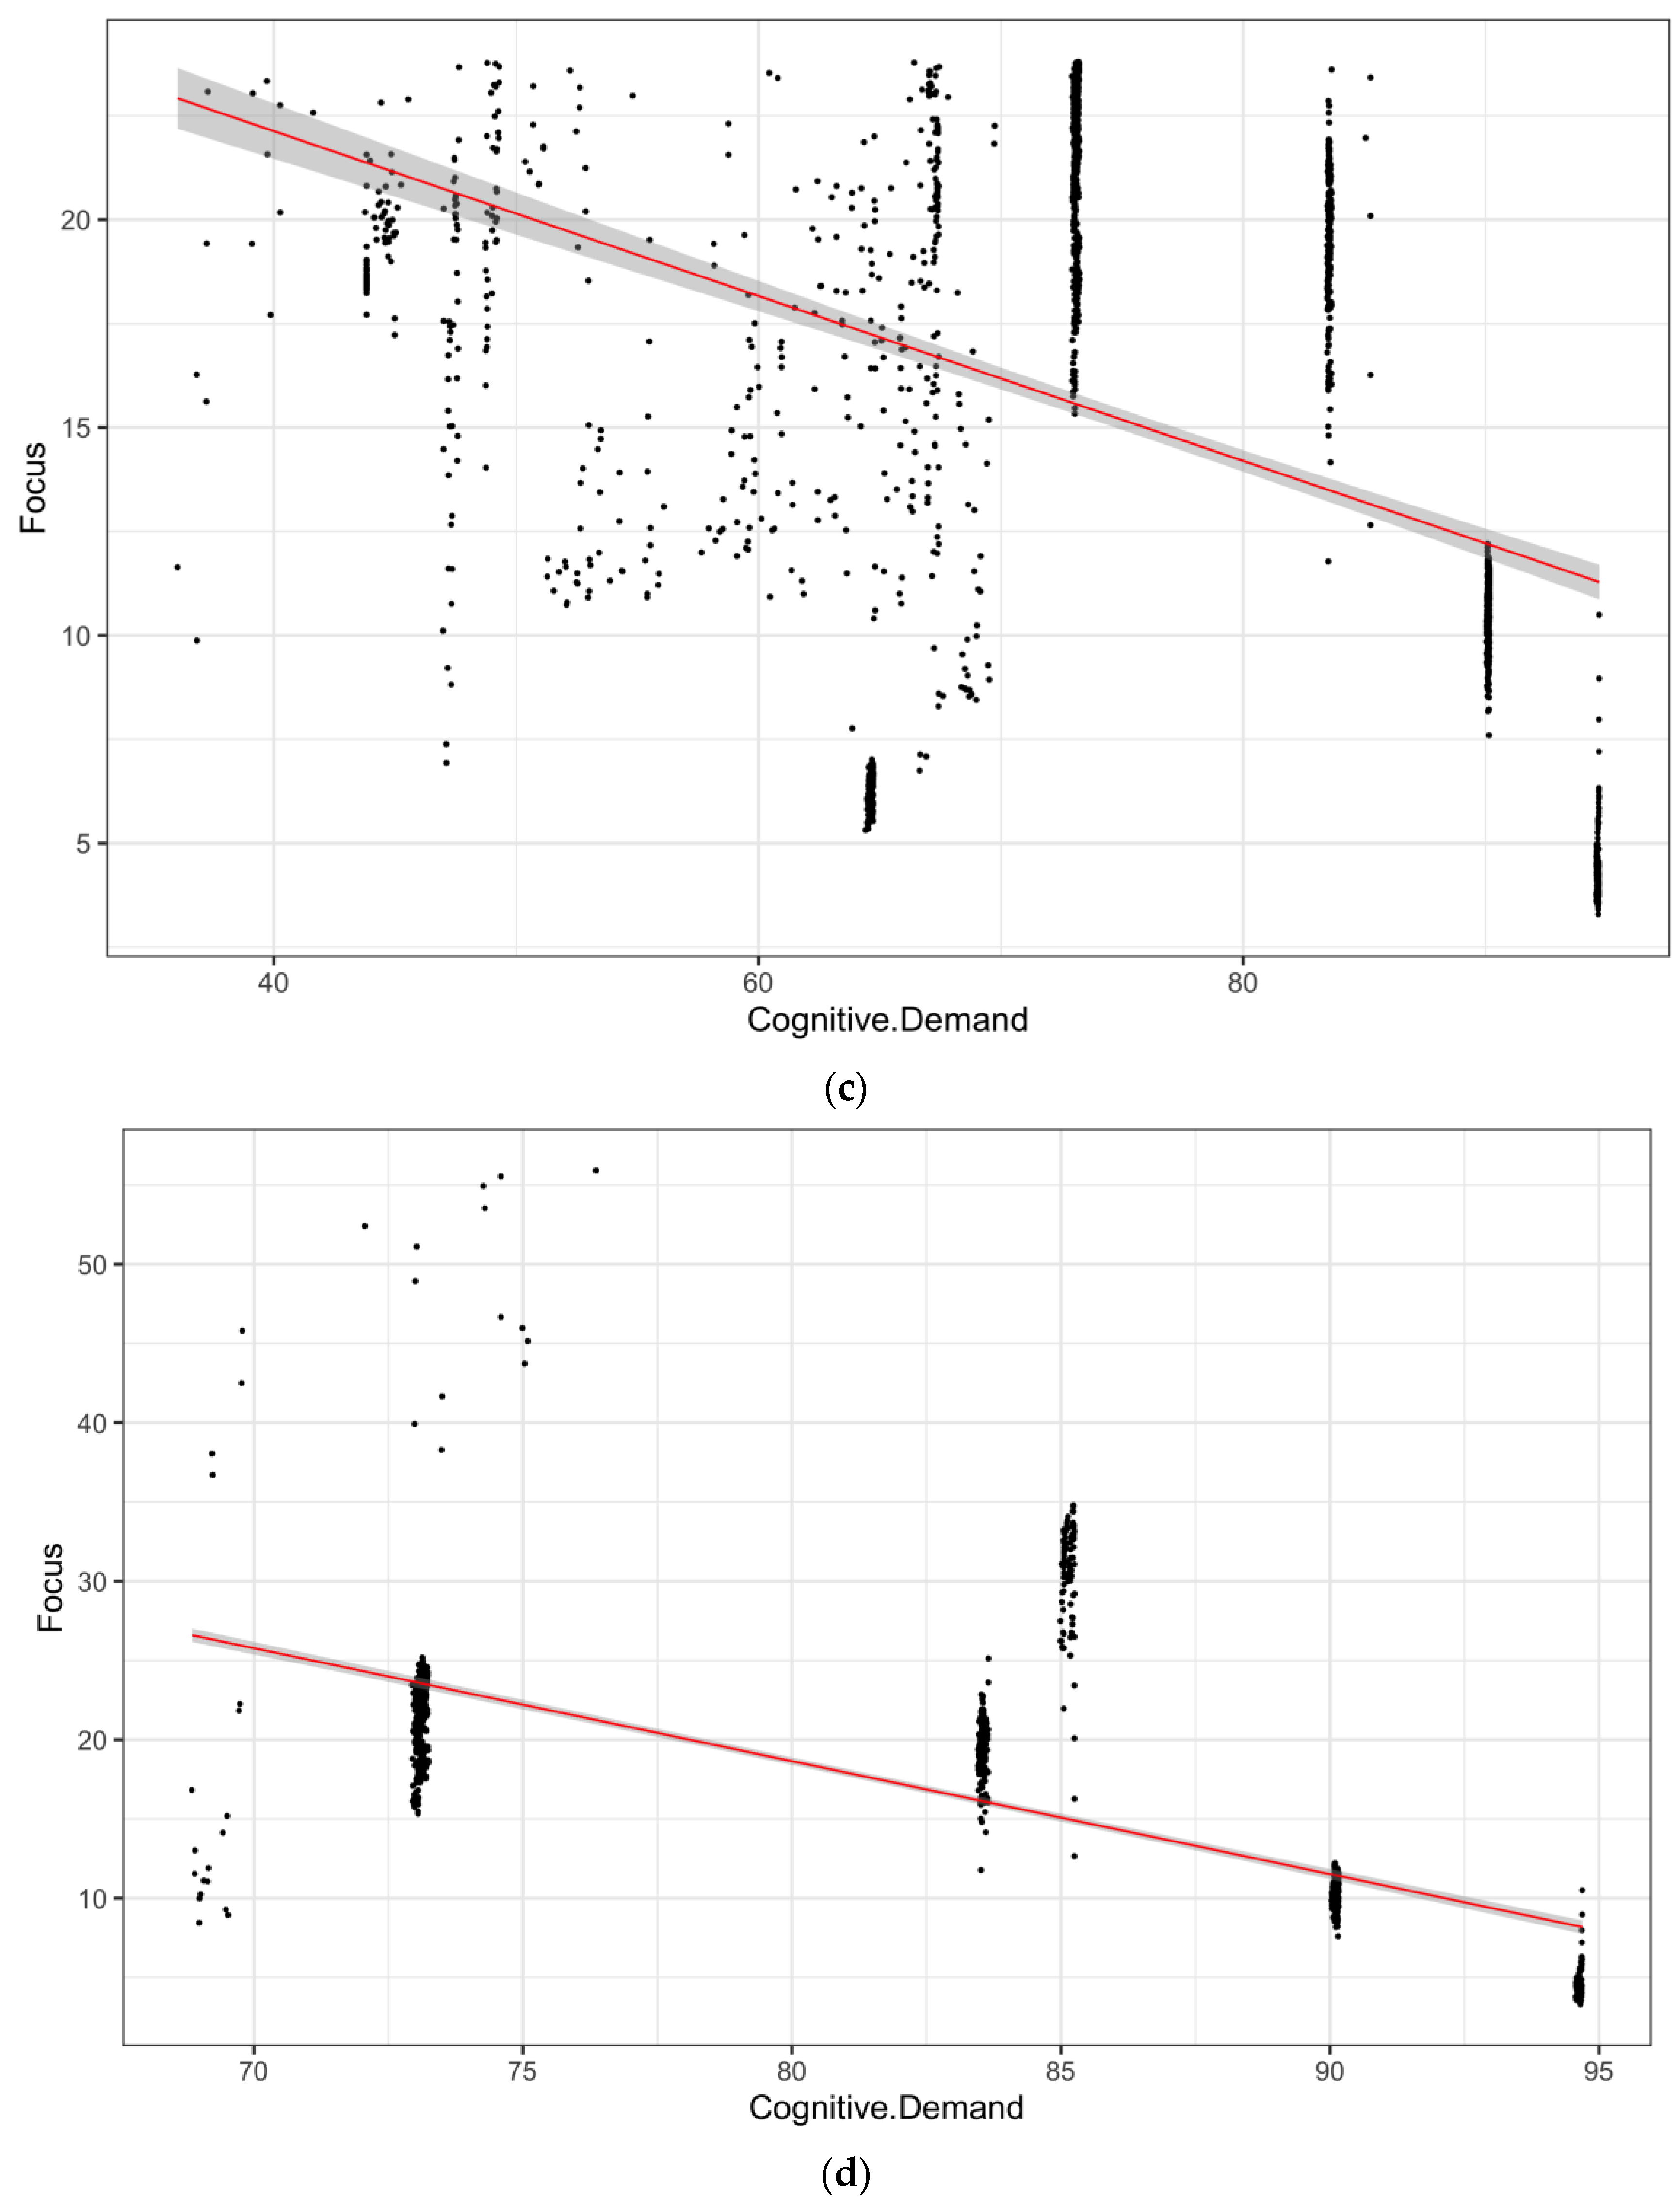
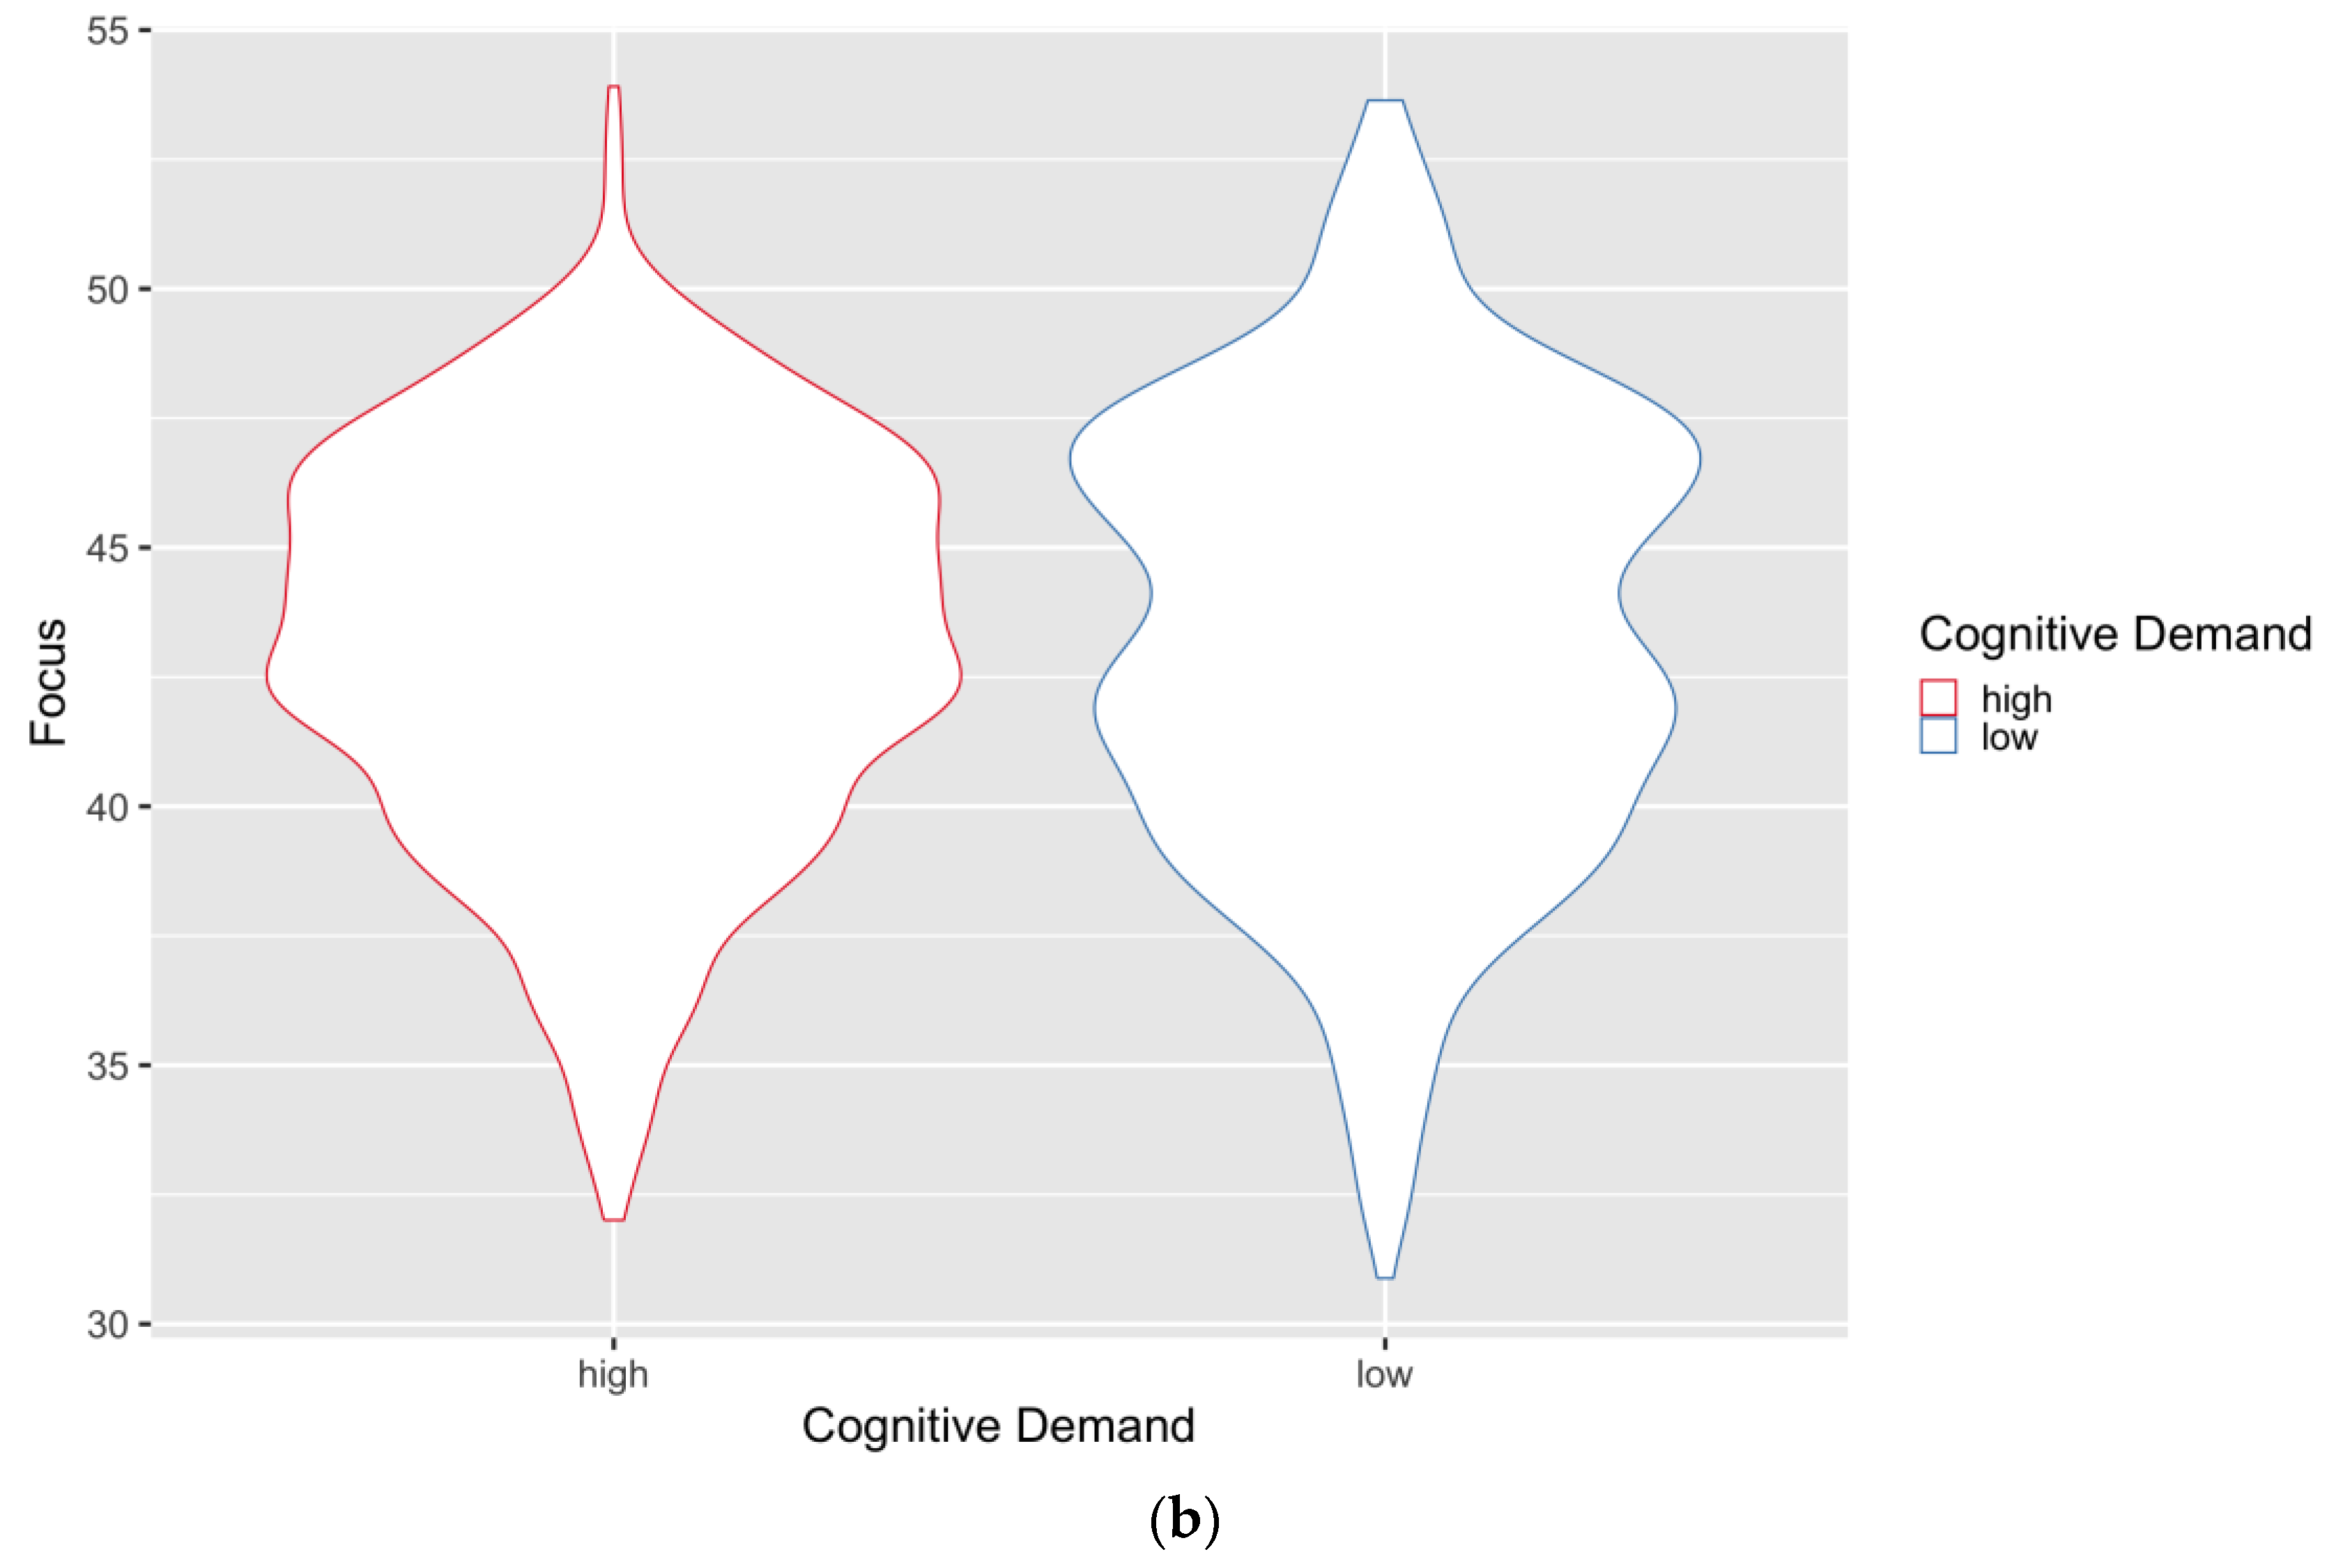
In the opening segment of Utrecht University’s video, we observed a low Focus score for the first 37 s. Given that this section primarily concerned the introduction of the topic, a low Focus was appropriate, as it helped to maintain the audience’s interest throughout the lecture. This is reflected in the high zone of the dataset, where viewers were only starting to become familiar with the subject matter. As the lecture moved on to propose a solution, the Focus score shifted to the high zone, indicating that the audience was now fully engaged in understanding the solution. Moreover, ref. [39] suggests that emotional engagement is related to student cohesiveness and inversely related to teacher support, implying that a high level of focus might result from effective engagement strategies rather than a sign of disengagement. Another noteworthy observation was an increase in the CD when an additional edge was added to the web chart being presented on screen, indicating that the complexity of the subject matter was increasing and requiring more cognitive processing, which may have overwhelmed some viewers. Guo and Chen [40] demonstrate that visual complexity and task difficulty significantly influence cognitive efficiency, suggesting that increasing complexity, such as adding an edge to a web chart, could increase cognitive demand. Similarly, Gwizdka indicates that cognitive load is related to tasks’ objective and subjective difficulty, which could be extrapolated to adding complexity to visual tasks [41]. The video featured intermittent but short dips (2–7 s) in Focus. The most significant of these dips occurred during a graph presentation, suggesting that an event may have taken place that confused the audience. Additionally, Rekik et al. [42] indicate that the visualisation format can mediate the impact of content complexity on cognitive load and learning outcomes, which could be relevant to the presentation of web charts. In keeping with the low Focus, the data indicate that the Cognitive Demand (CD) was elevated when the graph was presented, which suggests a lack of clarity for interpretation. For the moments when some frames displayed high and others low Focus, the observation indicates that a more significant number of frames pointed towards high Focus compared to low Focus, indicating an optimisation of attention throughout those moments. Similarly, most other segments fell within the low-CD category. For the seconds that exhibited a mix of high and low CD scores, more frames demonstrated a low CD score, again indicating a positive optimisation. The results of the t-tests revealed statistically significant differences in both CD scores between the high- and low-Focus groups (t = −33.312, df = 2005.9, p < 0.001) and Focus scores between the high- and low-CD groups (t = −24.317, df = 1942.9, p-value < 0.001) (see Figure 1a,b). The relationship between complexity and cognitive load is nuanced and may be influenced by factors such as task difficulty, visualisation format, and individual differences among learners [40,41,42].
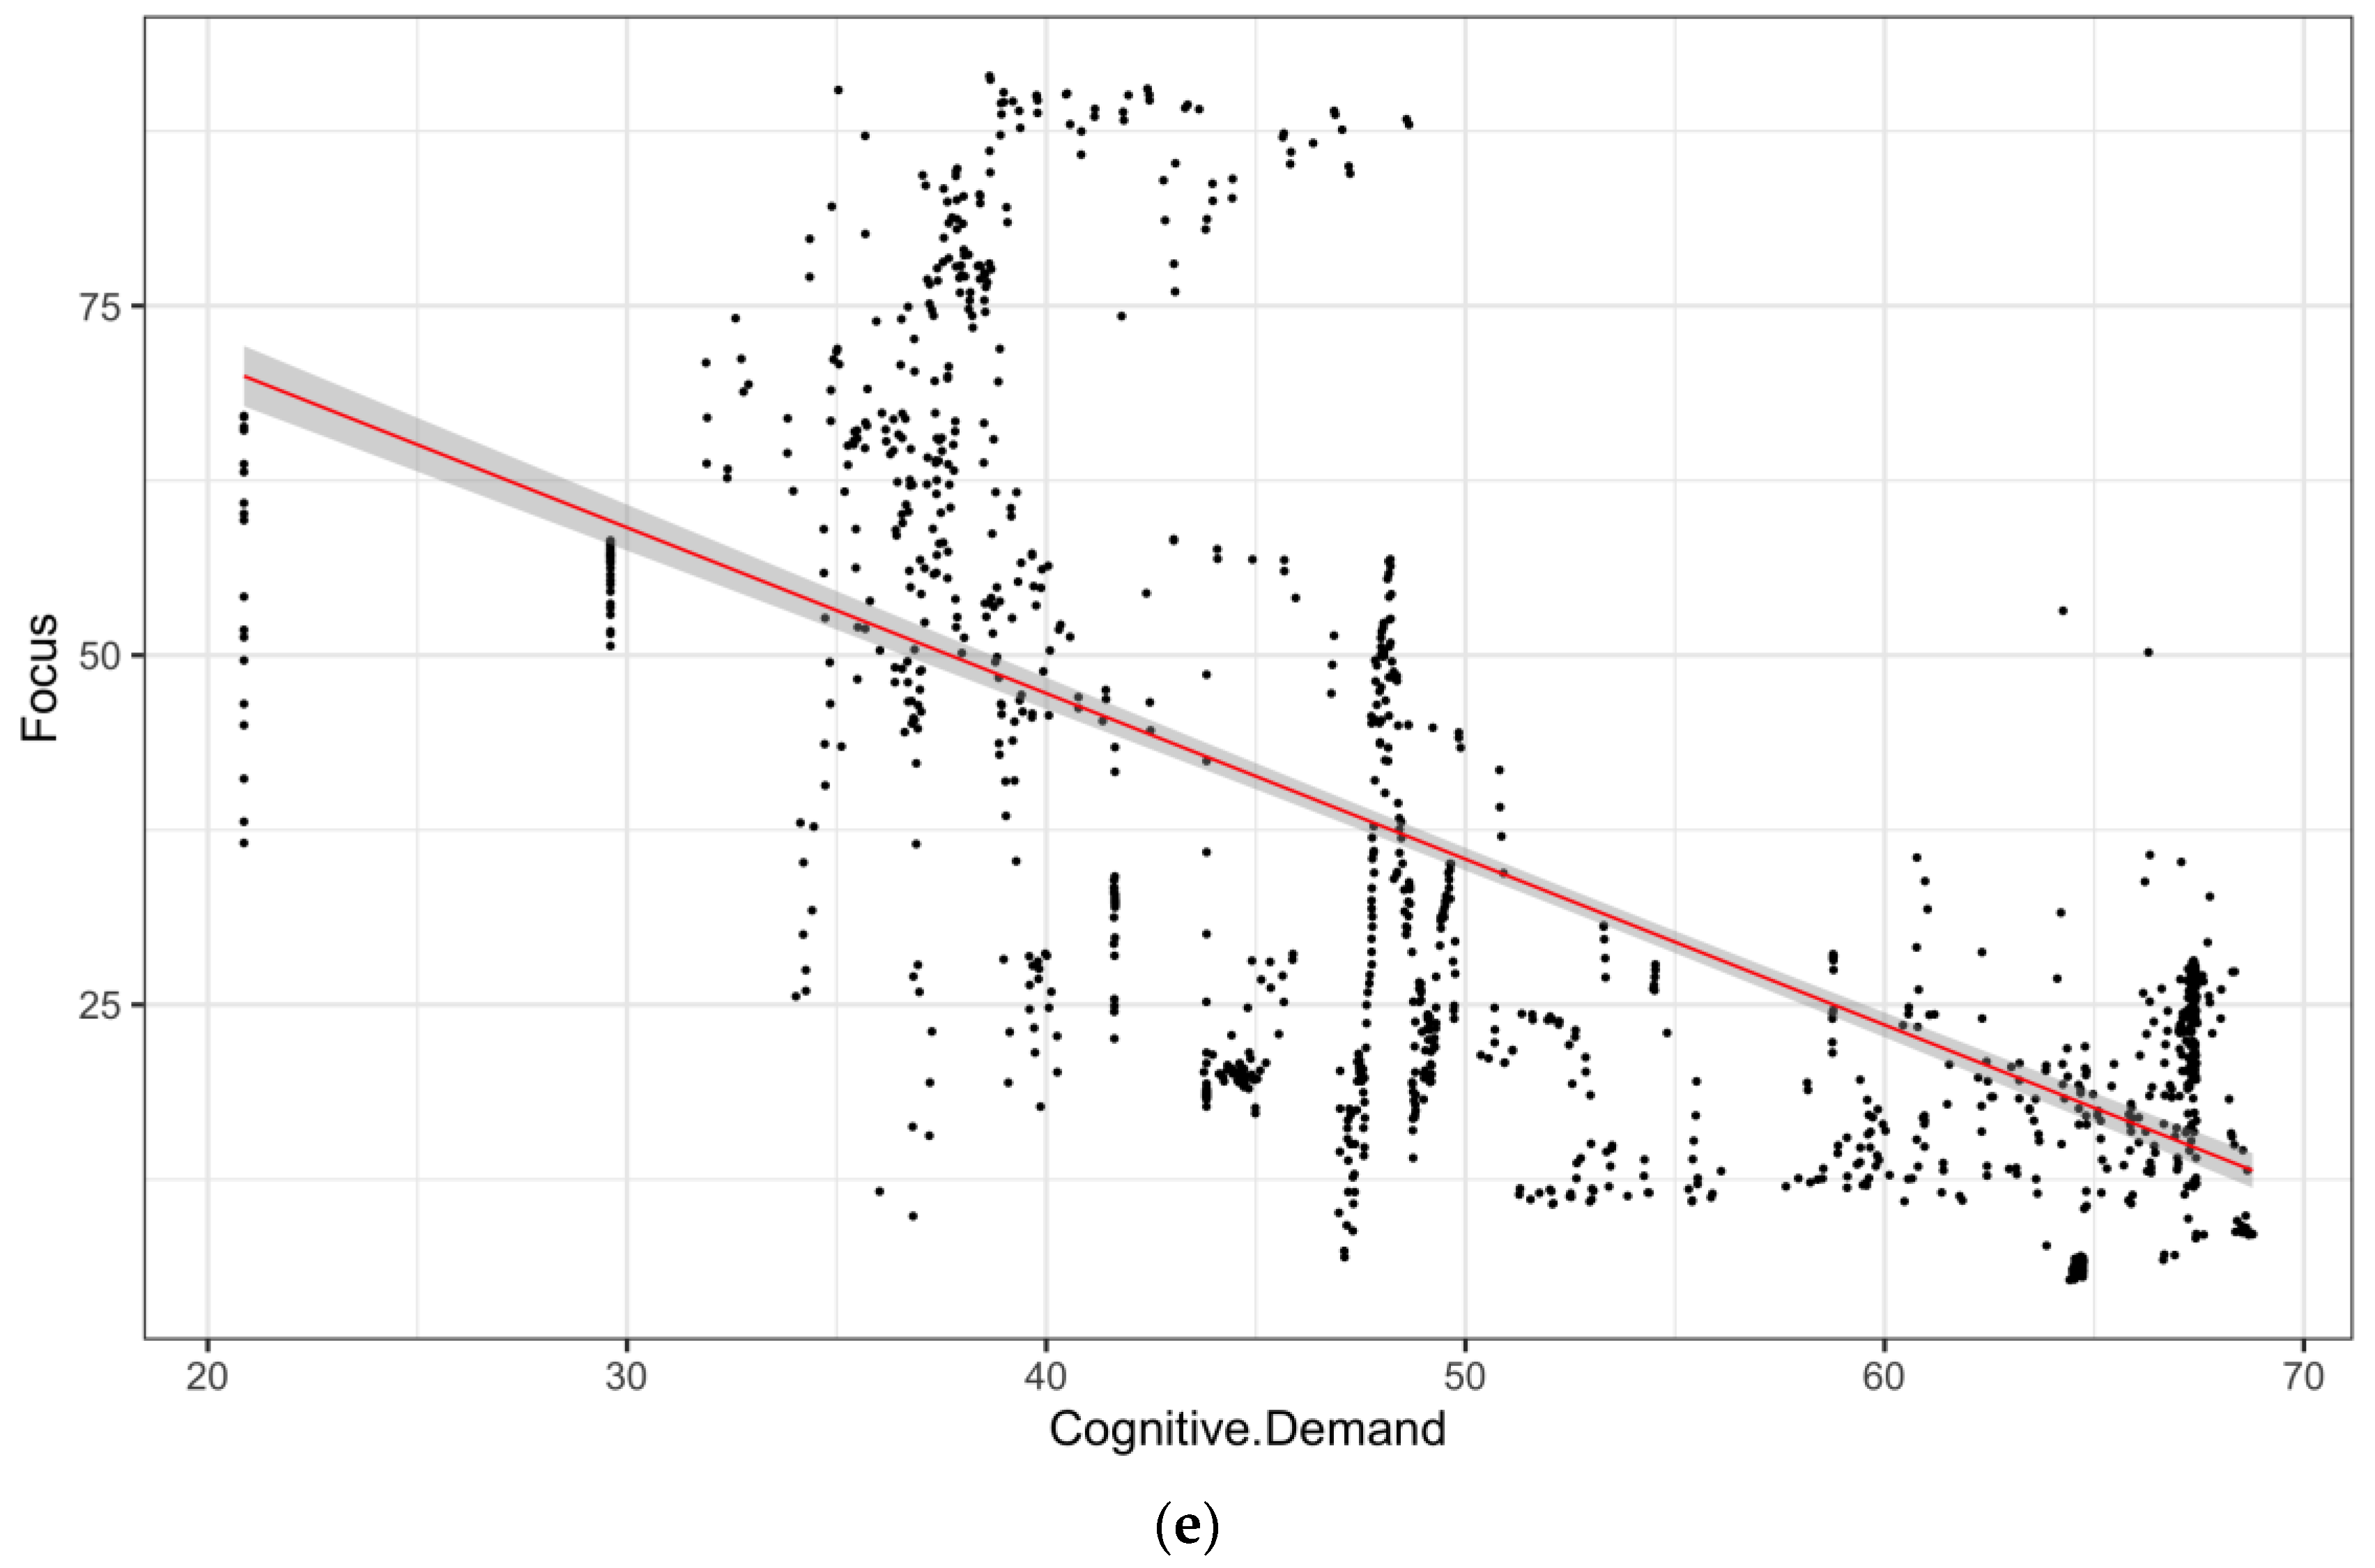
The results of all correlation tests, both overall and for each individual condition, demonstrated solid and significant negative correlations (p < 0.001) between Focus and CD. For instance, Linnell and Caparos [43] suggest that cognitive and perceptual loads interact to focus spatial attention, indicating that the relationship between cognitive demand and focus is not simply inversely correlated but may depend on the context and type of load. Similarly, Liu et al. [44] found that different types of mental workload (perceptual vs. cognitive) have opposite effects on fixation-related parameters, which could be interpreted as focus measures, further complicating the relationship. The correlation scores can be found in Table 2, and visual representations of the linear relationships between Focus and CD for all conditions are provided in Figure 2a–e.

3.2. OBC Video Lecture Insights

The engagement levels of students during online lectures can vary significantly, with some students experiencing high focus while others may struggle with low focus. The studies reviewed provide insights into factors influencing student engagement and strategies that may enhance focus during online learning. Anand, Gupta, and He et al. highlight the challenges of online learning and the importance of adapting teaching strategies and providing learner support services to improve engagement and academic performance [45,46]. Nanda, Alqudah, and Khasawneh demonstrate that personalised learning recommendations, such as those from an ALBERT-based recommender system and virtual reality field trips, can enhance student engagement and learning outcomes [47,48]. James et al. and More et al. suggest that gamification and interactive webinars can significantly improve student engagement and retention, offering alternative methods to maintain high focus during online lectures [49,50]. The video lecture presented by OBC revealed numerous instances of both high and low Focus scores throughout the time span.
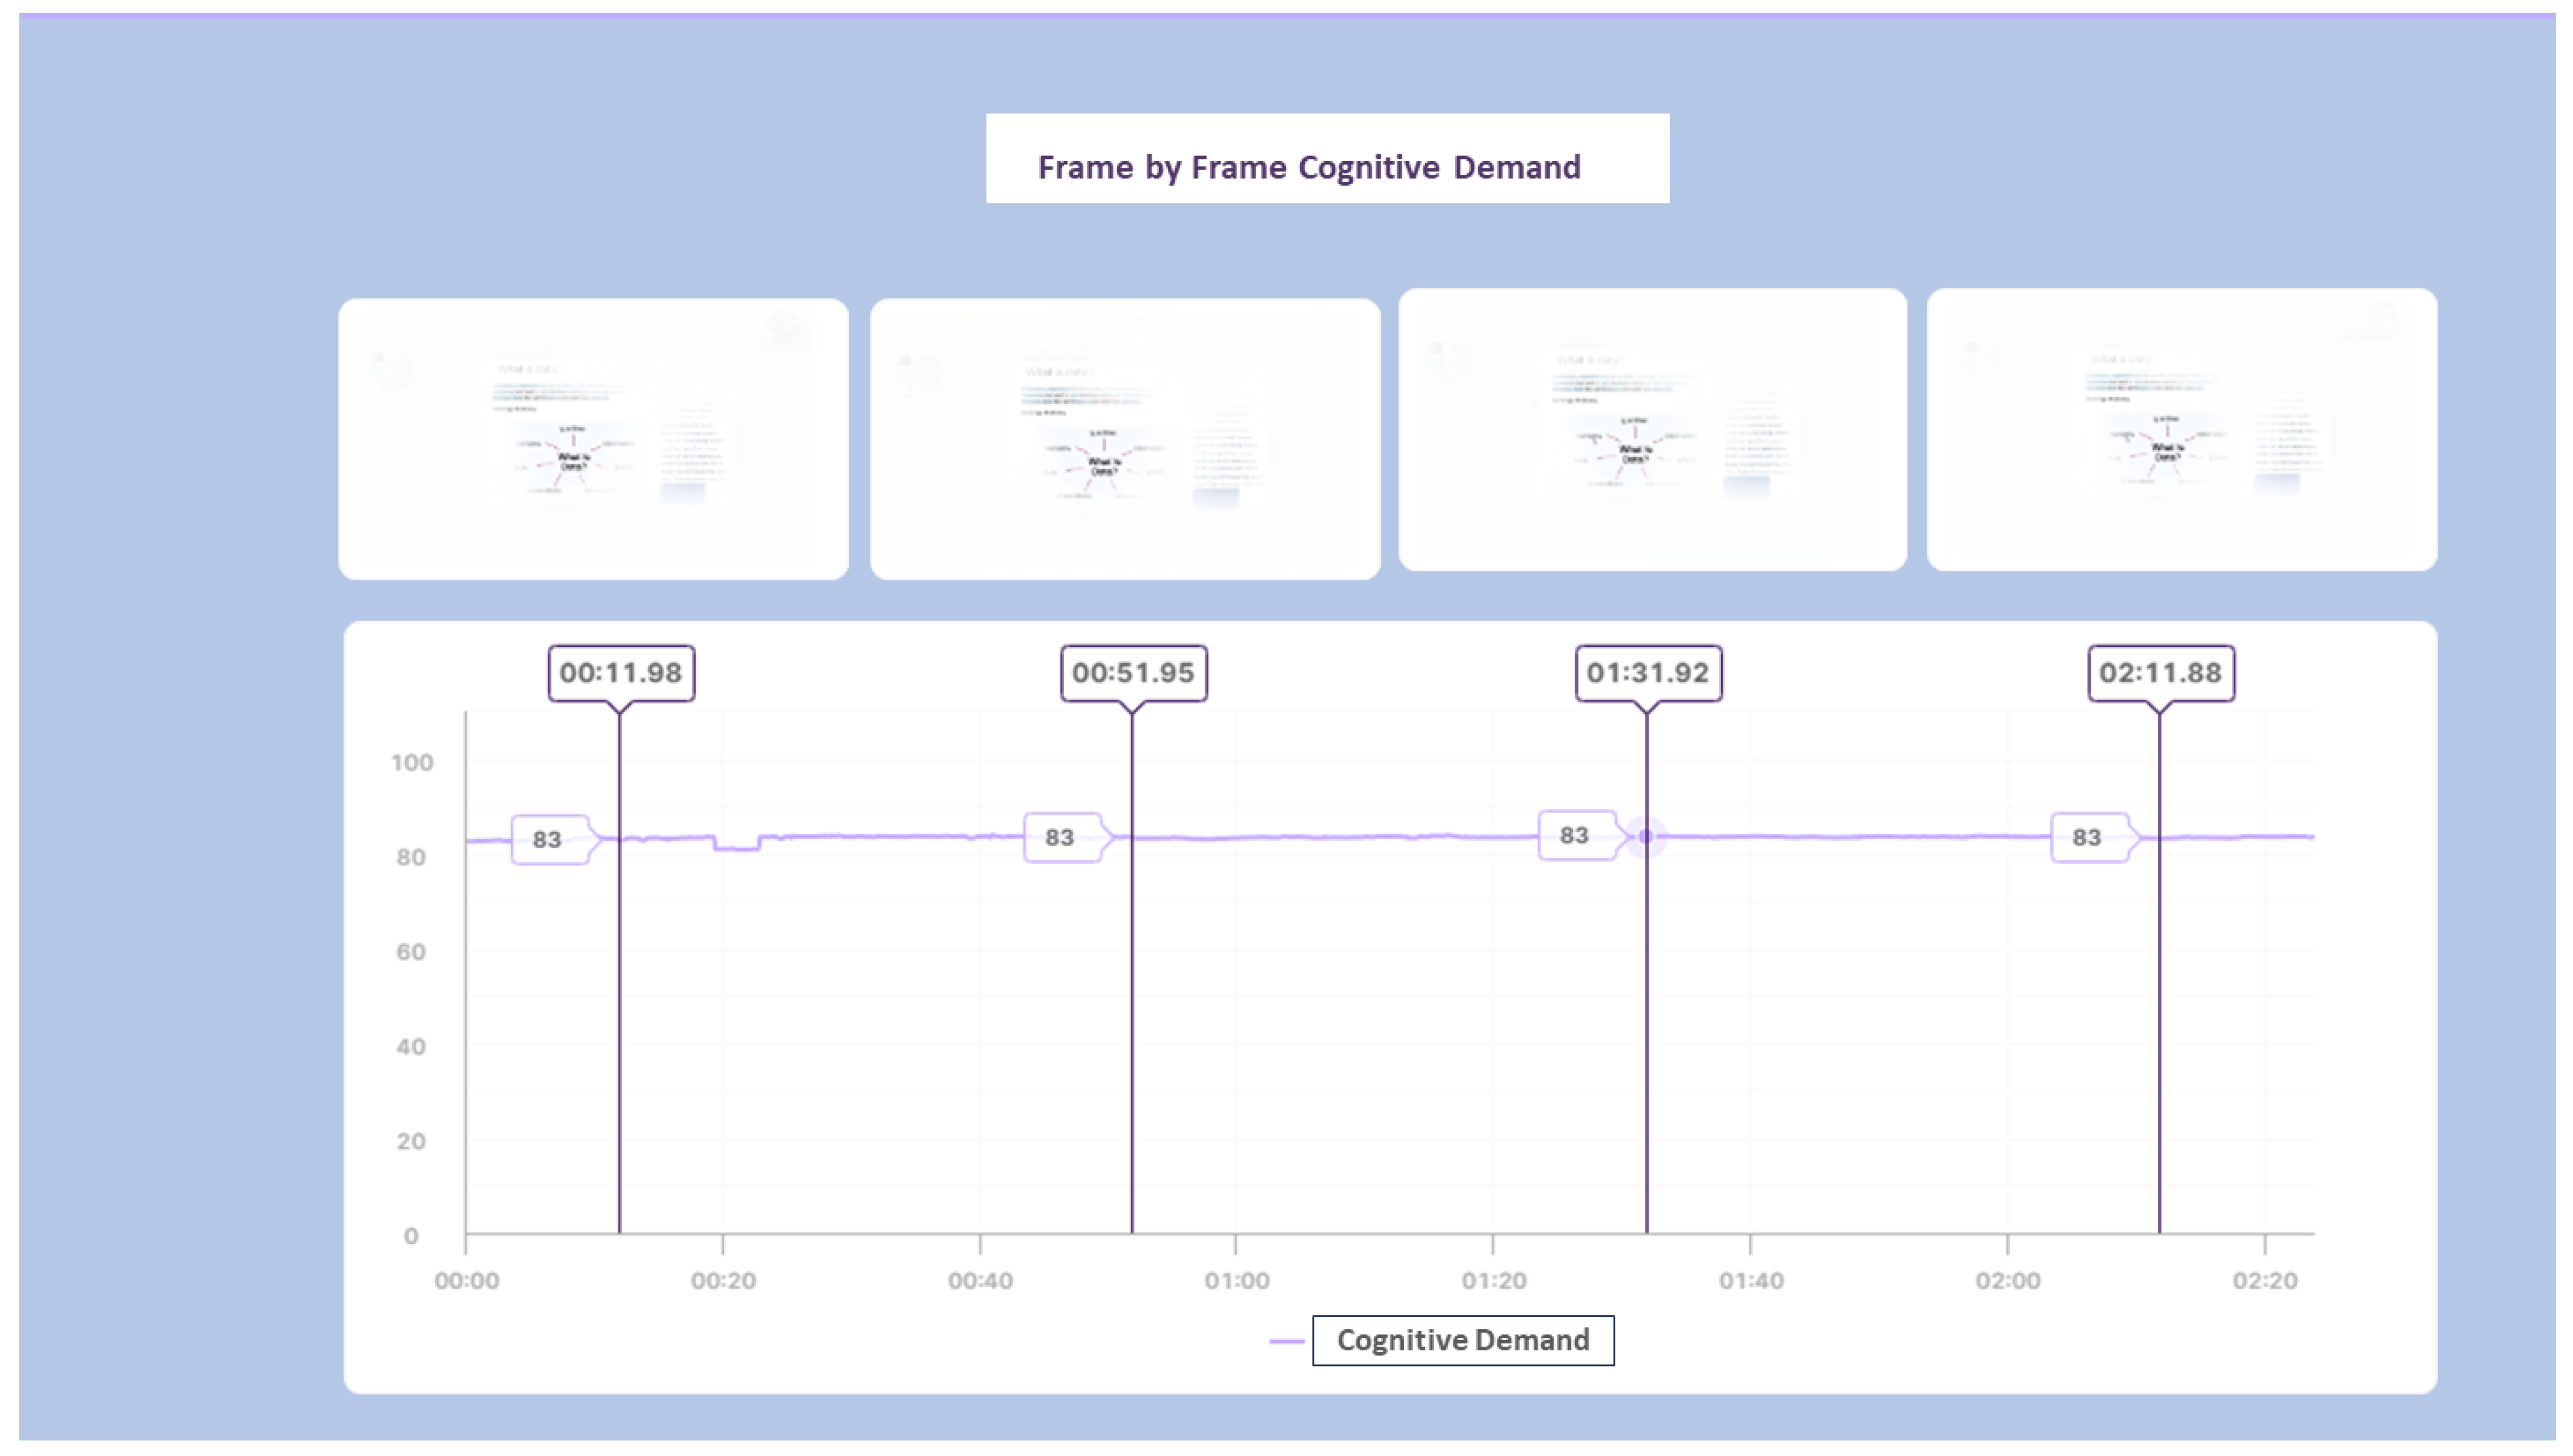
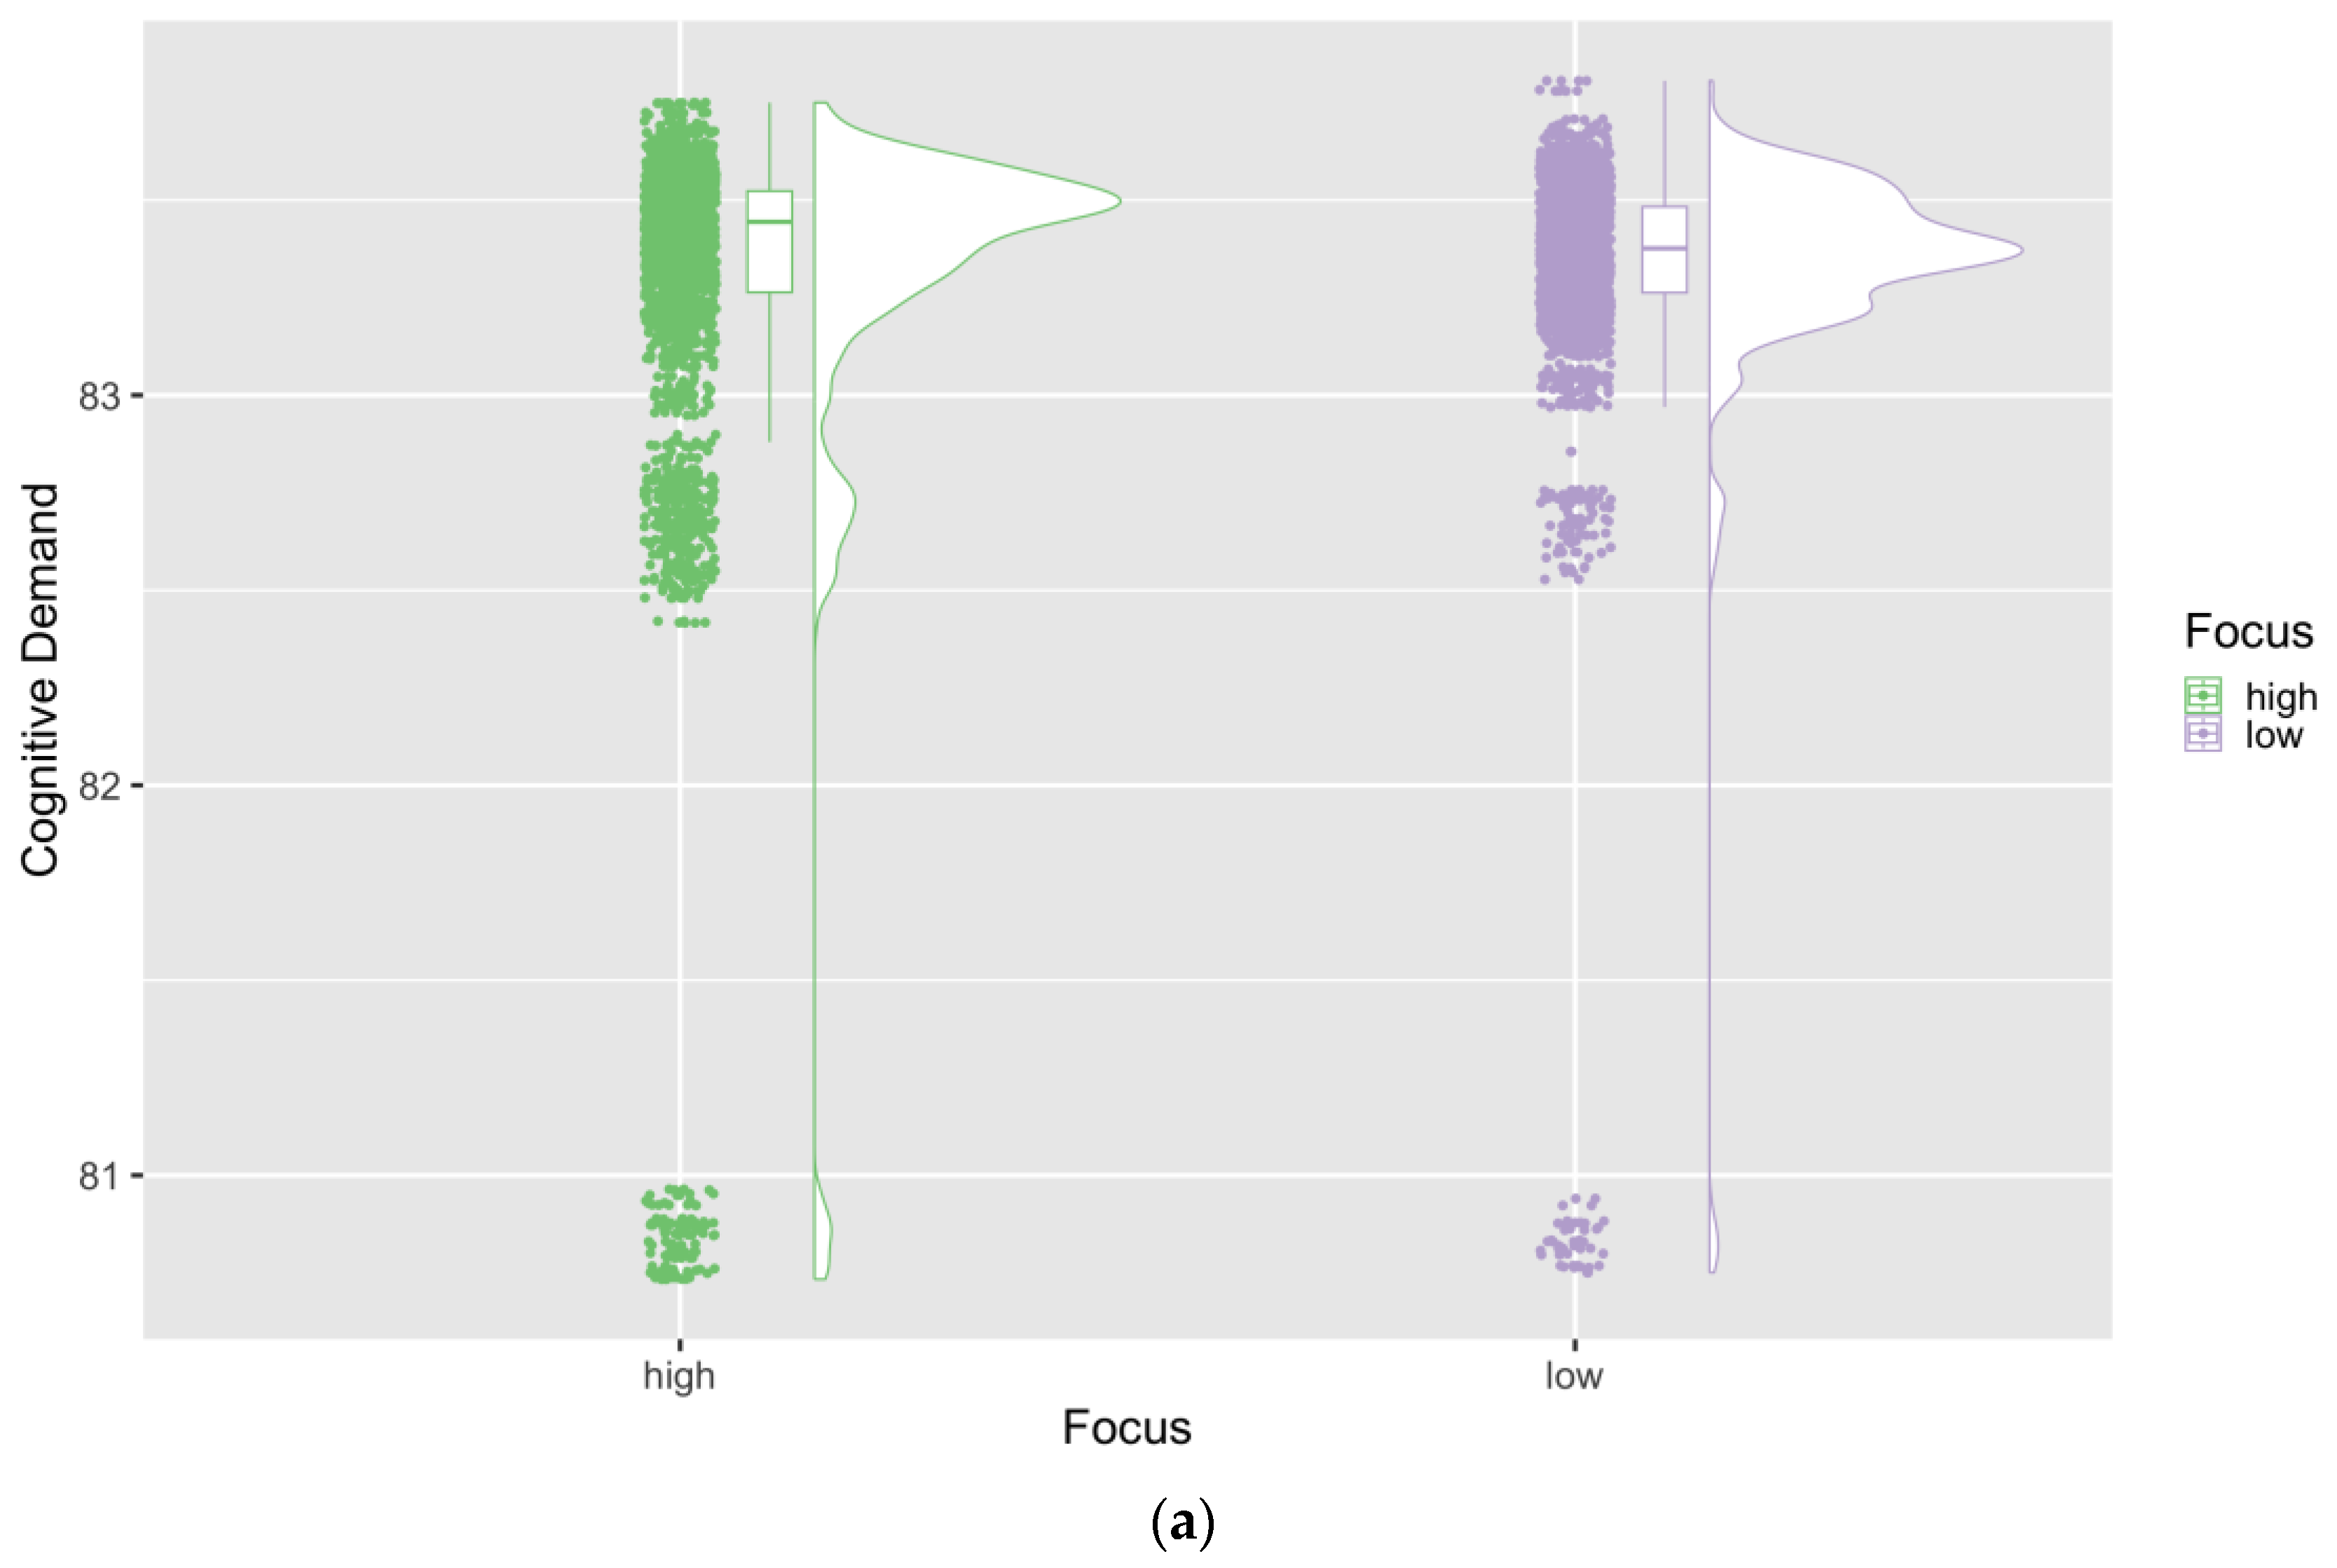
However, for the majority of the frames within these time periods, the Focus score was observed to be high. During the initial seconds of the lecture, when the concept was being explained with some fillers in the speech, the Focus score occasionally shifted to the low zone, suggesting minor segments of potential boredom due to the elaboration component of the information and some breaks in the lecture’s fluency. Boredom is recognised in educational settings as an achievement emotion that can negatively impact student engagement and academic performance. Studies have shown that boredom is associated with lower levels of academic motivation and engagement, which can lead to adverse academic outcomes [51,52]. Moreover, boredom can indicate low student engagement, characterised by passivity and lack of interest in learning activities [53]. Interestingly, the Focus score began to recover as the lecture became more fluent, but it did not intermittently shift again when the information was too elaborated. Additionally, students may not accurately perceive their teachers’ boredom, yet the perception of teacher boredom can still reduce students’ learning motivation through increased student boredom [52]. This suggests that not only the actual boredom of teachers but also students’ perceptions of it are relevant to student engagement. As for the CD, it remained low for the majority of the introductory segment of the lecture (17 s). Afterwards, it fluctuated consistently between high and low CD, indicating a lack of consistency in the level of processing throughout the video lecture. Chen and Wu suggest that different video lecture types can affect cognitive load, with the voice-over type inducing a higher cognitive load than lecture capture and picture-in-picture types [54]. This implies that the style of video lecture presentation may influence the level of cognitive demand experienced by learners. However, for the majority of the overlapping seconds between high and low CD, most frames were observed to fall under high CD. It is worth noting that despite the division of CD into high and low, given the small range, a very high mean, and a very low SD of CD in the video lecture data, the CD across the entire video would qualify as high in more absolute terms. The results of the t-tests indicated a statistically significant difference in CD scores between the high- and low-Focus groups (t = −4.0862, df = 3016, p < 0.001) but no significant difference in Focus scores between the high- and low-CD groups (t = −1.3236, df = 1671, p = 0.19) (see Figure 3a,b).
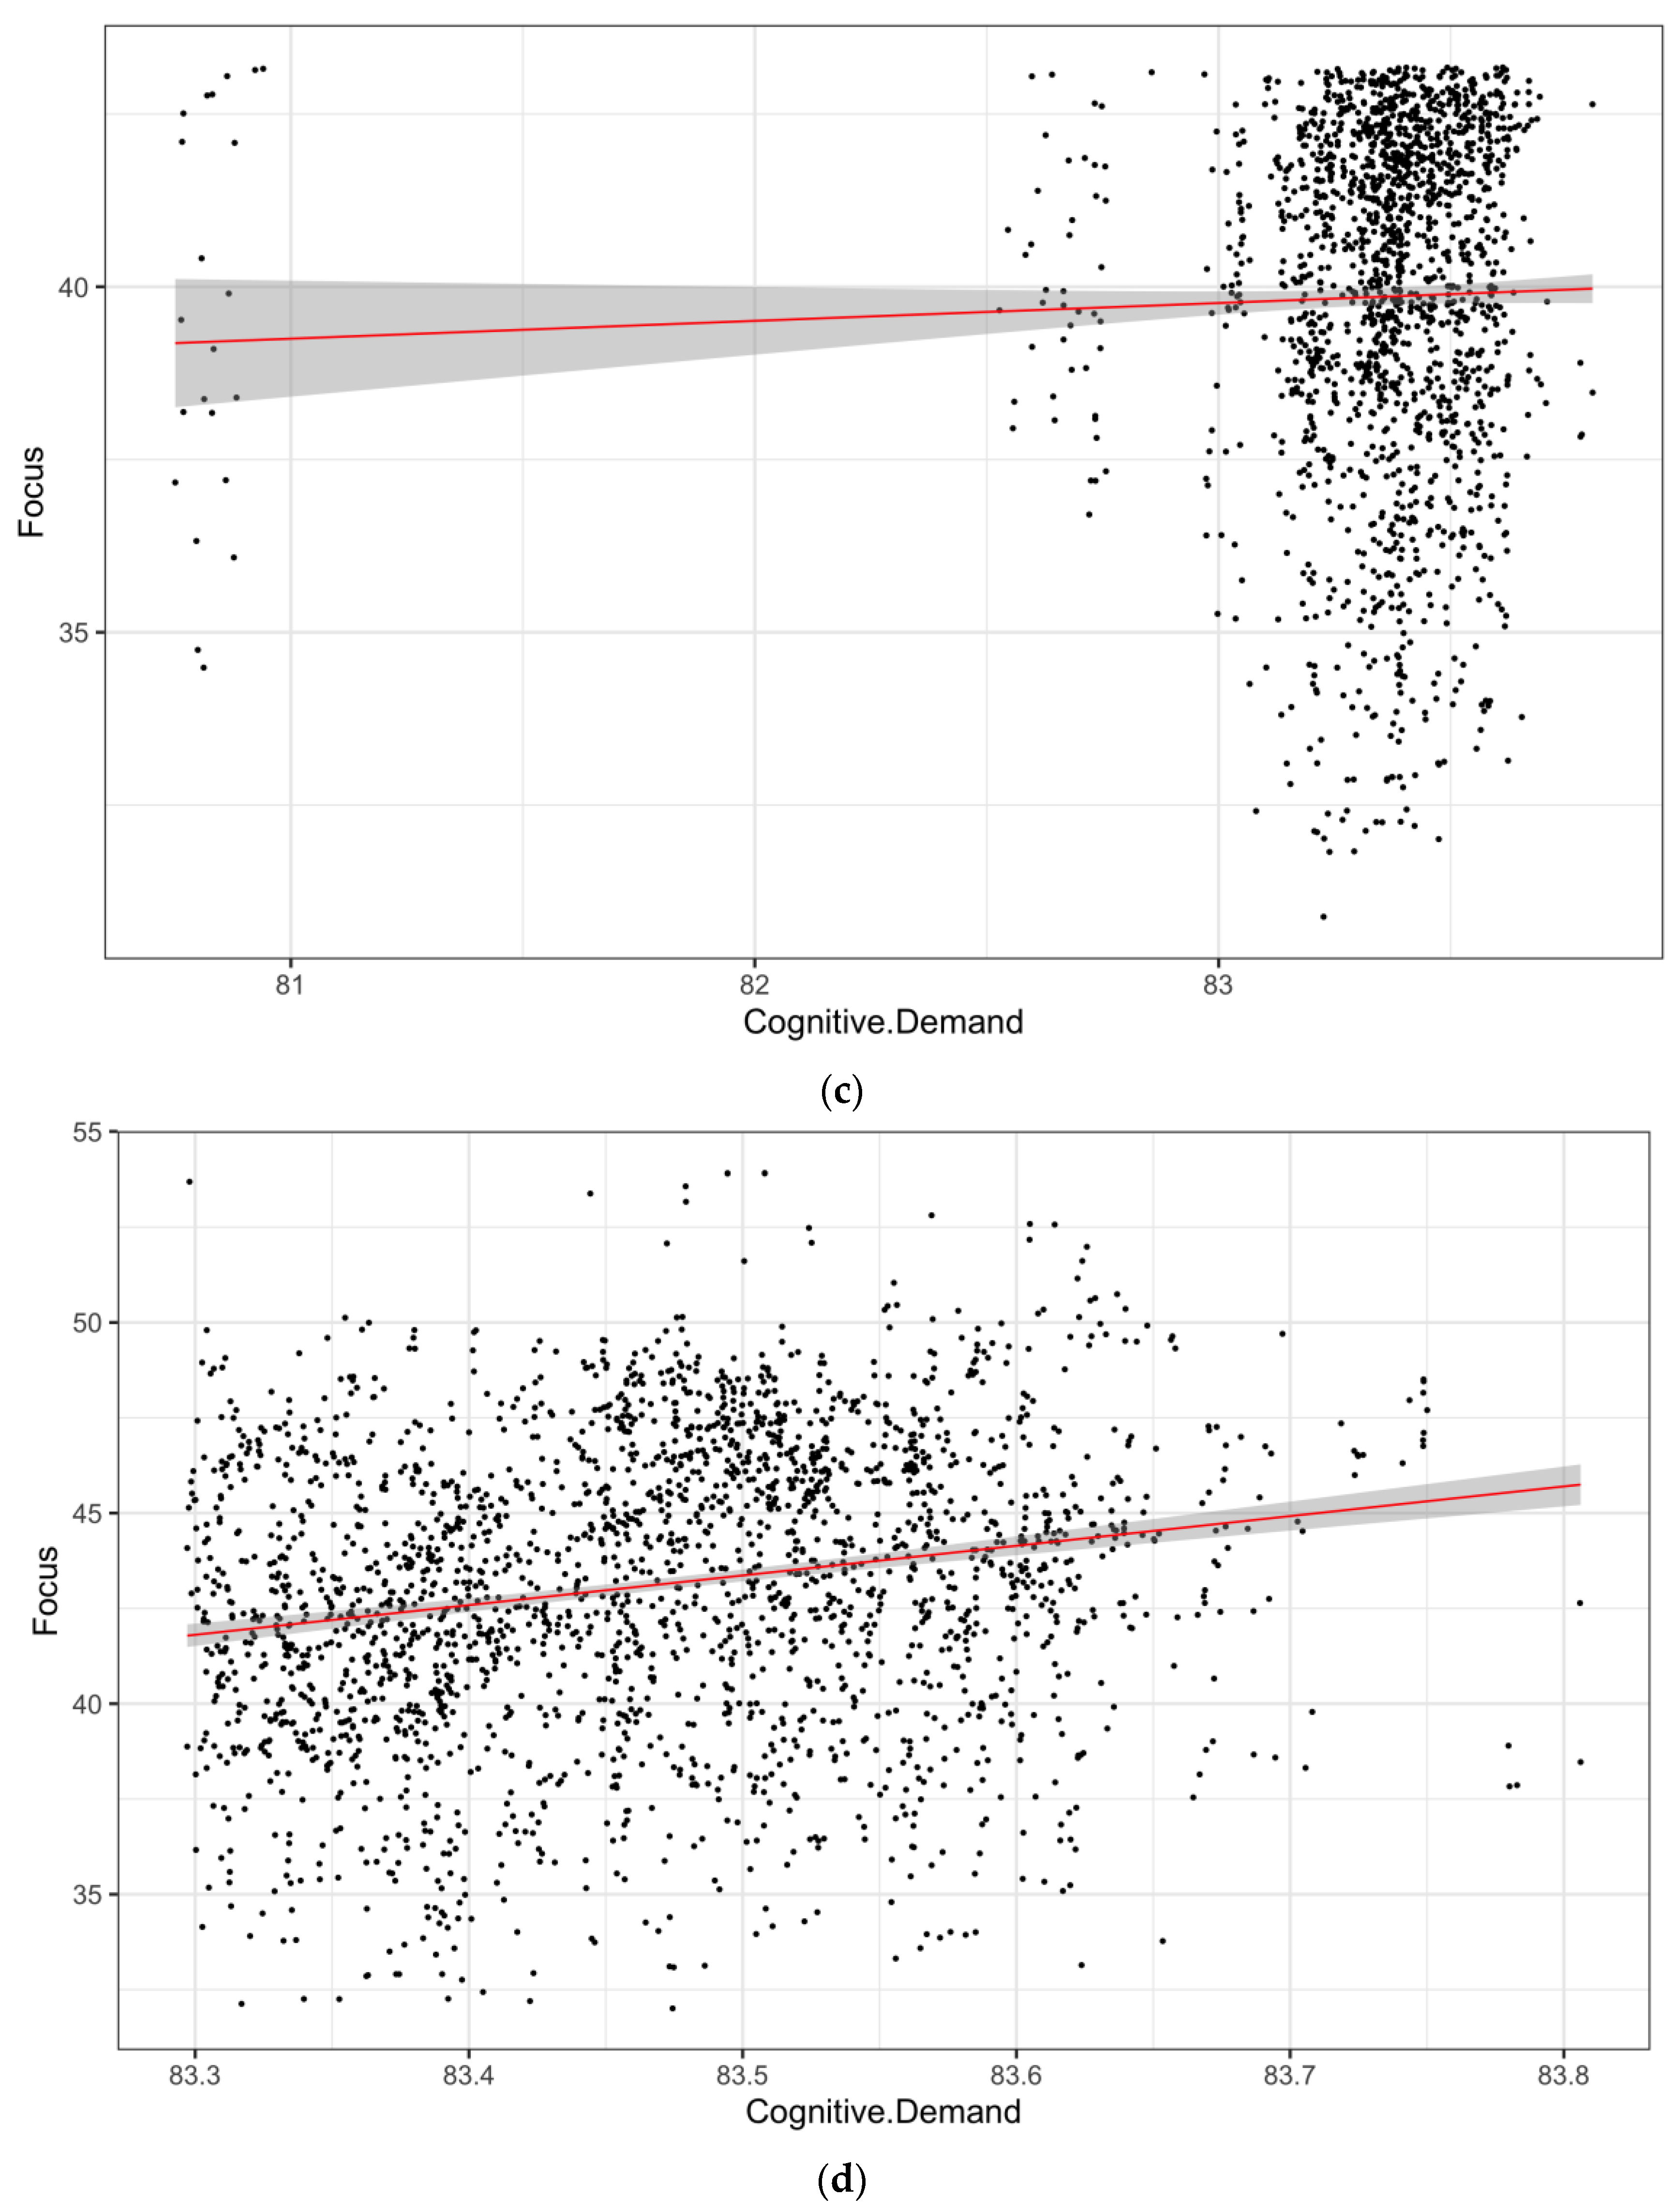
The correlation test results indicated notable but very weak negative associations for the overall situation and high Focus and low CD, a weak significant positive association for high CD, and a negligible positive association for low Focus (p = 0.16). The correlation scores for all conditions are presented in Table 3, and the linear relationships between Focus and CD for each condition can be observed in Figure 4a–e.
While the video lecture produced by Utrecht University exhibited a moderate degree of overall Focus and a low level of overall Cognitive Demand, the extent to which these metrics varied across frames was relatively high, indicating a considerable degree of inconsistency throughout the video. In contrast, the video lecture produced by OBC showed a low level of Focus and a high level of Cognitive Demand, with minimal ranges and low standard deviations, indicating greater consistency for these metrics across the video. When viewed as benchmarks for one another, it becomes evident that the metrics can differ significantly based on factors such as the subject matter, content, design of the lecture, and the lecturer’s delivery style. The scores achieved for Utrecht University’s video appeared to be influenced by the visual elements displayed on the screen, such as graphs. In contrast, the scores for OBC’s video were primarily influenced by the lecturer’s delivery style, such as the elaboration of examples. This observation is not limited to the qualitative aspect of mapping the scores of individual frames to the events in the video but also applies to the quantitative aspect of the relationship between Focus and Cognitive Demand. In the case of Utrecht University’s video, the overall pattern was as expected, with high levels of Focus accompanied by low levels of Cognitive Demand and vice versa. This pattern was consistent for both high and low levels of Cognitive Demand. This was demonstrated by the significant negative correlations observed across all conditions and the t-tests, which revealed significant differences reinforcing the negative relationship between Focus and Cognitive Demand. On the other hand, this relationship was more intricate for OBC. Given the OBC video’s CD being high with a minimal range, Focus exhibited no disparity across the CD high and low groups; however, while CD scores varied significantly across the high- and low-Focus groups, the variation in the means was marginal. Notably, the correlations varied considerably from those of Utrecht University’s video lecture, with the overall correlation between Focus and CD being significant but very weakly negative, with this pattern being followed by high Focus and low CD. This suggested that techniques that encourage more Focus and less CD in combination might help attain optimal attention during an online lecture of a similar format. The “1 min break” technique, which involves intentional breaks with trivia questions, has been shown to help students maintain or regain focus during lectures, regardless of whether they are online or in-person. This approach is well-received by students and can be easily implemented across various teaching formats, suggesting its potential effectiveness in online settings [55]. Moreover, classifying attention using EEG data highlights the importance of understanding attention dynamics in multimedia lectures. A study found that specific EEG features, particularly in the delta and theta bands, indicate attention levels, suggesting monitoring and adapting to these signals could enhance focus during online lectures [56]. To achieve optimal attention during online lectures, educators should consider employing synchronous teaching methods that allow for real-time engagement and immediate clarification of concepts, as these have been shown to reduce cognitive load [57]. Additionally, incorporating cognitive learning strategies that minimise extraneous load and facilitate information processing can enhance focus [58,59,60]. It is also beneficial to identify and optimise the cognitive load of specific online learning tasks [61]. These approaches collectively contribute to a more focused and less cognitively demanding online learning experience. Moreover, given the fluctuating high and low CD throughout some segments of the video and the high CD group demonstrating a weak positive correlation between CD and Focus, it may be inferred that, if balanced, as can be observed in the low range of CD for OBC’s video lecture, CD’s consistency might motivate viewers to invest their focus more efficiently if the variation in the CD is limited. The format of online lectures also plays a crucial role in maintaining attention. Live composite video lectures, which integrate the instructor’s image with content in real-time, have been found to enhance attention, positive emotion, and social presence compared to other formats like voiceover and picture-in-picture. This suggests that the live composite format could more effectively sustain attention by providing a richer, more engaging learning experience [62]. Additionally, attention-based automatic editing of lecture videos, which tailors content based on individual attention patterns, has shown promise in reducing cognitive load and enhancing the learning experience. This method aligns with the need for personalised learning experiences that cater to individual attention spans, potentially leading to more effective learning outcomes [63].

4. Discussion

Although using neuromarketing consumer behaviour prediction software has several advantages, such as the efficient use of time and resources without compromising accuracy due to its large training dataset of 180,000 participants, some limitations must be acknowledged. Firstly, since these consumer behaviour prediction tools are still in their early stages of development, they only recognise AOIs related to brand-related features, which depends on the algorithm setup. The Predict software taps into a continuously updated, state-of-the-art object detection model by leveraging the power of convolutional neural networks and advanced deep learning techniques through multi-layer perceptrons. Integrating convolutional neural networks (CNNs) and advanced deep learning techniques, such as multi-layer perceptrons, is pivotal in developing AI detection models across various domains. CNNs are renowned for their ability to recognise local features, share weights, and employ pooling mechanisms, making them highly effective for image detection tasks [64]. This ensures the platform can detect intricate patterns and recognise various brands and objects, even in visually complex environments. This capability is underpinned by extensive training on datasets comprising tens of thousands of distinct logos and object instances. However, this may not be relevant for educational media such as video lectures, which can result in the missing of essential metrics such as attention investment on specific AOIs of relevance due to the inability of the software to e select the elements in the video for which we want to measure particular attention. Eye-tracking measures, such as gaze time, provide valuable insights into cognitive and emotional processes, yet they have limitations in fully capturing metrics like emotional arousal and cognitive load. These limitations arise from the complexity of human emotions and cognition, which often require multimodal approaches for comprehensive assessment. Research has shown that eye-tracking metrics, including saccades, fixations, and pupil diameter, can correlate with emotional states and cognitive workload. For instance, Bekler et al. demonstrated significant correlations between eye-tracking metrics and emotional states in virtual reality environments, suggesting that variations in eye feature patterns can indicate emotional arousal [65]. The Time Spent metric, which uses a refined attention-tracking algorithm to model the temporal element of attention, can be understood through recent advancements in attention mechanisms within tracking algorithms. The integration of attention mechanisms into tracking algorithms has been shown to significantly enhance the performance of object-tracking systems by focusing on crucial features and improving adaptability in dynamic environments [66,67,68,69].
The algorithm of Start/End Attention factors in the focus duration, capturing moment-to-moment fluctuations in consumer gaze across the AOIs during a 5 s exposure window. The score derived from the cumulative time spent on each attention-orienting item allows for an evaluation of the endurance of individual elements. However, it is essential to note that capturing attention within a brief 5 s exposure may be challenging for software algorithms. Consequently, while this approach is practical for gauging overall attention, it is insufficient for examining specific attention diversions. To address this limitation, monitoring attention in shorter intervals is necessary. Attention has been identified as a crucial cognitive component, highlighting its significance for effective learning [70,71]. Attention is closely linked to working memory capacity and information processing speed, fundamental cognitive characteristics of intelligence. Therefore, it is essential to evaluate attention in detail, particularly when analysing online educational videos. While acknowledging these limitations, it is critical to note that they also present opportunities for advancements in AI eye-tracking neuromarketing consumer behaviour prediction tools. These tools can expand the incorporation of various attention-orienting items and may be examined with increased robustness through measures such as pupillometry. Future developments should focus on incorporating metrics derived from pupillometry to provide more comprehensive insights into the effectiveness of cognitive processes. Accurate assessments of attention can offer valuable insights into the effectiveness and potential of cognitive processes, as attention is a crucial component of learning, intelligence, and information retrieval. Therefore, it is essential to explore the inclusion of content outlines and examples during the delivery of online lectures, as well as the use of more comprehensible visual elements, to enhance the effectiveness of online educational materials [70,71,72].

5. Conclusions

This groundbreaking study utilised neuromarketing research with AI eye tracking consumer behaviour software to examine and predict student cognitive demand and focus during online lectures in an academic setting. Two videos, one from each of two different universities (Utrecht University and Oxford Business College), were used in the research, and their duration, video settings, and teacher lecture format were all considered. This study’s findings emphasise the importance of measuring the content of videos before they are broadcast to determine how well students will receive them in terms of whether they will be perceived as overwhelming, dull, or interesting. Several factors can inform this assessment, including content complexity, information density, and audience engagement metrics. Firstly, content complexity plays a significant role in how videos are perceived. According to Zhang et al., content complexity can be estimated by analysing the energy of prediction residuals, which reflects how predictable or complex a video is. Videos with higher complexity may increase cognitive load, potentially overwhelming students if not appropriately managed [73]. Additionally, the concept of information density is critical. Dokic et al. highlight that high information density in educational videos can lead to information overload, which can overwhelm students and hinder learning. Their model for measuring information density, using background subtraction algorithms, provides a method to predict potential overload and adjust content accordingly [74]. This aligns with the Limited Capacity Model of Motivated Mediated Message Processing, which suggests that excessive information can exceed viewers’ processing capacity, leading to disengagement [74]. By incorporating consumer eye-tracking prediction models into their teaching practices, universities and colleges can help their students better comprehend the material and enable professors and lecturers to produce more engaging videos that do not cognitively overload students with unnecessary information. As a result, students will be able to focus more effectively on the critical aspects of the lecture and be more motivated to learn. This method can help identify content that resonates with audiences, potentially indicating what students might find interesting or engaging [75].
Our study aimed to investigate the relationship between Focus and Cognitive Demand (CD) for two online video lectures, one from Utrecht University and the other from Oxford Business College. Evaluating cognitive demands in PowerPoint presentations in higher education is crucial because it directly affects the dissemination of knowledge and the learning process. By using the latest neuromarketing technological eye-tracking AI consumer prediction software with the largest neuromarketing database (100+ bn consumer behaviour data point and 180,000 participants), we enhanced the use of advanced programming models such as R, Pearson correlations, and t-tests in all our analyses. Our findings revealed a high correlation between Focus scores and CD in online lectures, influenced by content, design elements such as web charts and graphs, and the delivery style. For the Utrecht University lecture, it was suggested that the content flow and slide structure should be designed to avoid overloading the viewer’s cognitive capacity, allowing them to maintain focus and understand the topic effectively. On the other hand, the OBC video lecture analysis revealed that the delivery style can make the relationship between Focus scores and CD more intricate. Unlike the Utrecht University lecture, the OBC video lecture did not follow the typical pattern of a negative relationship between Focus and CD, suggesting that if a consistent level of CD is maintained in the moderate range, a higher level of Focus can be promoted. This finding has significant implications for how educators design and deliver lectures, as it challenges the prevailing belief that a negative relationship between focus and cognitive demand is necessary for effective learning. Huang et al. indicate that certain learning styles may increase cognitive load, potentially affecting learning outcomes negatively [76]. This suggests that for some individuals, increased focus on learning tasks not aligned with their learning style may lead to higher cognitive demand, which could be detrimental to learning effectiveness. Feldon et al. also discuss the interaction between cognitive load and motivational beliefs, suggesting that cognitive load can be seen as a motivational cost, which might imply that excessive cognitive demand could negatively impact motivation and focus [76,77] Our study also highlights the importance of employing AI consumer behaviour prediction eye-tracking software in higher education to place more emphasis on the learning performance of their students. The use of machine learning algorithms for predicting student performance is highlighted, suggesting a potential role for AI in understanding and improving learning outcomes [78,79]. However, ethical considerations and a comprehensive knowledge of these technologies remain essential for their successful implementation [3].

Author Contributions

Author Contributions: H.M.Š.: conceptualisation, methodology, writing—original draft, formal analysis, and supervision. F.H.Q.: resources, writing the original draft, and funding acquisition. S.K.: writing, reviewing, editing, and funding instruction. All authors contributed to the article’s finalisation, review, and approval of the submitted version. All authors have read and agreed to the published version of the manuscript.

Funding

It was supported by the Institute for Neuromarketing & Intellectual Property, Zagreb, Croatia (research activities included designing and conducting research utilising neuromarketing software and analysing the data) and the Oxford Business College (paying the article processing charges for this publication).

Institutional Review Board Statement

Not applicable.

Informed Consent Statement

The online filmed video received approval from the OBC lecture. However, no consent statements were required for the other video (Utrecht University) [80], as it was published under a Creative Commons license.

Data Availability Statement

The data supporting this study’s findings are available in Figshare at DOI 10.6084/m9.figshare.26764129 (accessed 24 August 2024). These data were published under a CC BY 4.0 Deed Attribution 4.0 International license.

Acknowledgments

We thank Shubhangi Butta from the Institute for Neuromarketing & Intellectual Property for her valuable contribution to R coding and analysis assistance for this article.

Conflicts of Interest

The authors declare that the research was conducted without any commercial or financial relationships that could be construed as potential conflicts of interest.

Abbreviations

OBCOxford Business College
AASAttention-Aware Systems
HCIHuman–Computer Interactions
AMAMAttention Monitoring and Alarm Mechanism
AVRLMAttention-Based Video Lecture Review Mechanism
CDCognitive Demand
AOIArea of Interest

Appendix A. Neuromarketing Results for Utrecht University
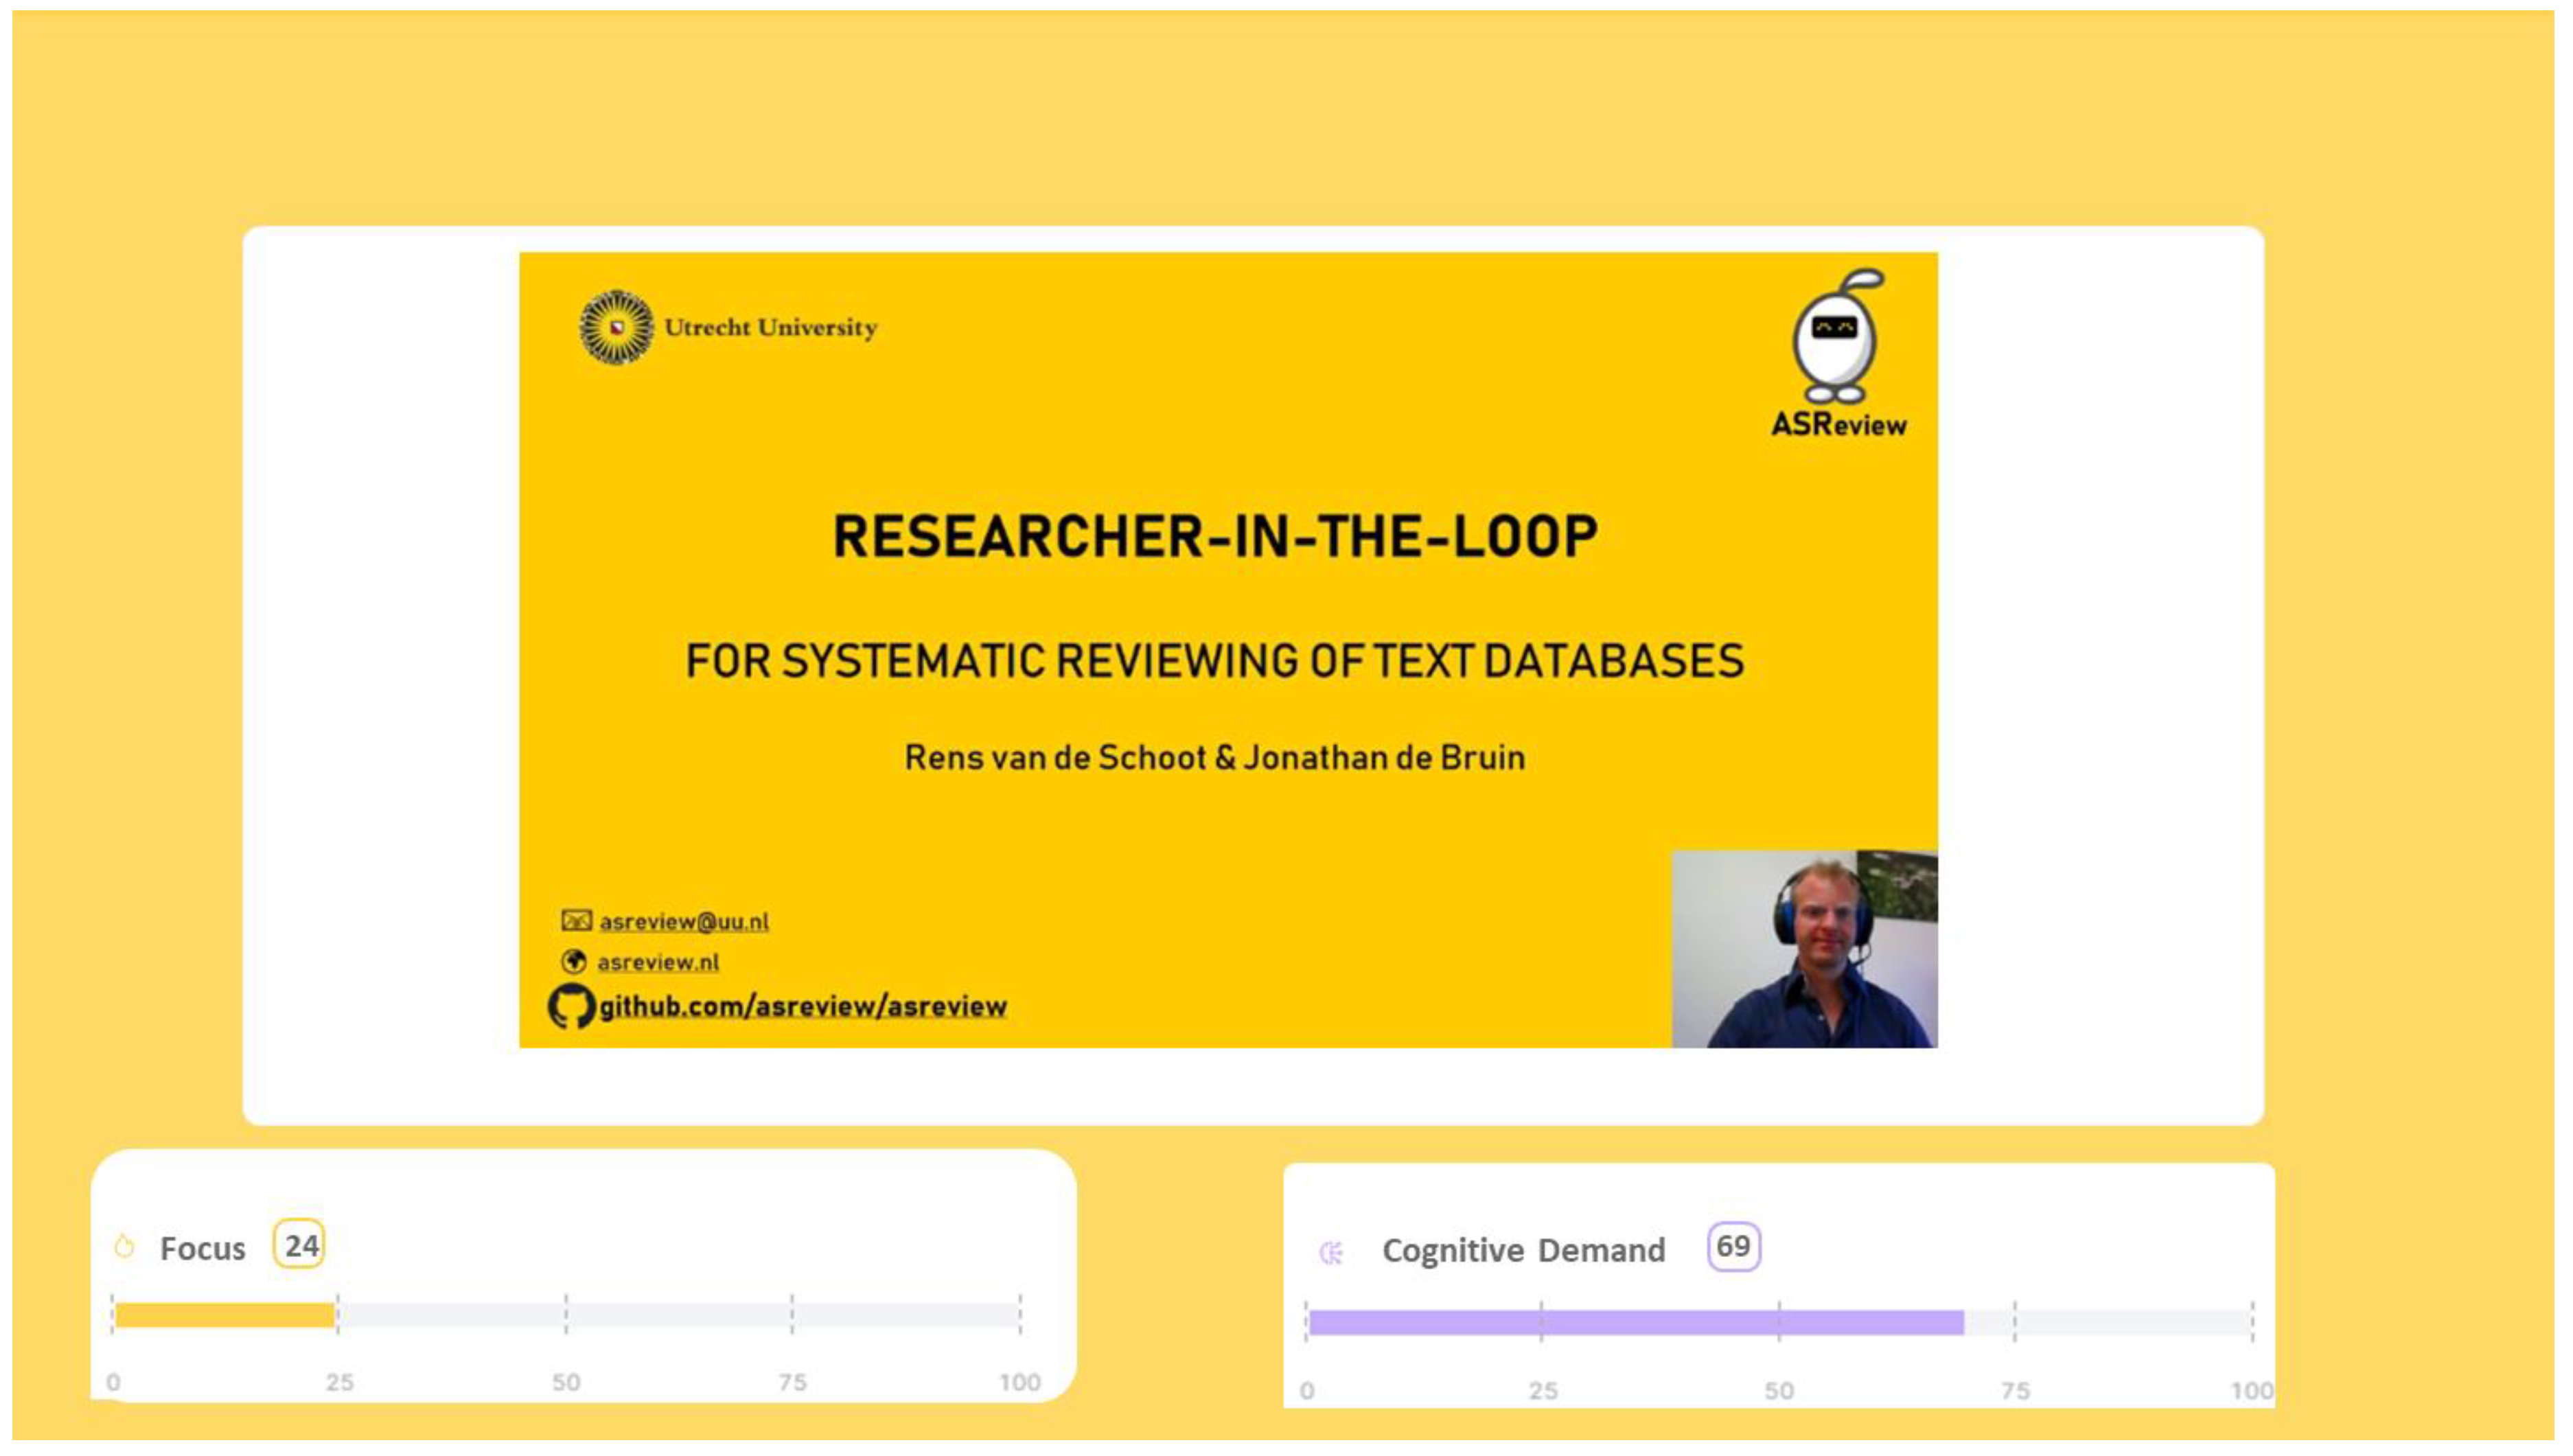
Figure A1. The findings of neuromarketing research on the Utrecht video were analyzed in terms of measuring levels of focus and cognitive effort expended.
Education 14 00933 g0a1
Figure A2. The video in Utrecht was captured utilizing an AI-based eye tracker, with the aim of assessing the focus and brand attention. The heat map generated illustrates the areas that garnered the greatest attention, while the attention itself was evaluated on a frame-by-frame basis throughout the entire video.
Education 14 00933 g0a2
Figure A3. The Utrecht video’s cognitive demand was assessed utilizing an AI eye tracker, which captured the frame-by-frame cognitive demand throughout the entire video. Although the brand attention was recorded accurately, the fog map unequivocally reveals the areas that are not discernible to the human eye when recording the cognitive demand frame by frame.
Education 14 00933 g0a3

Appendix B. Neuromarketing Results for Oxford Business College
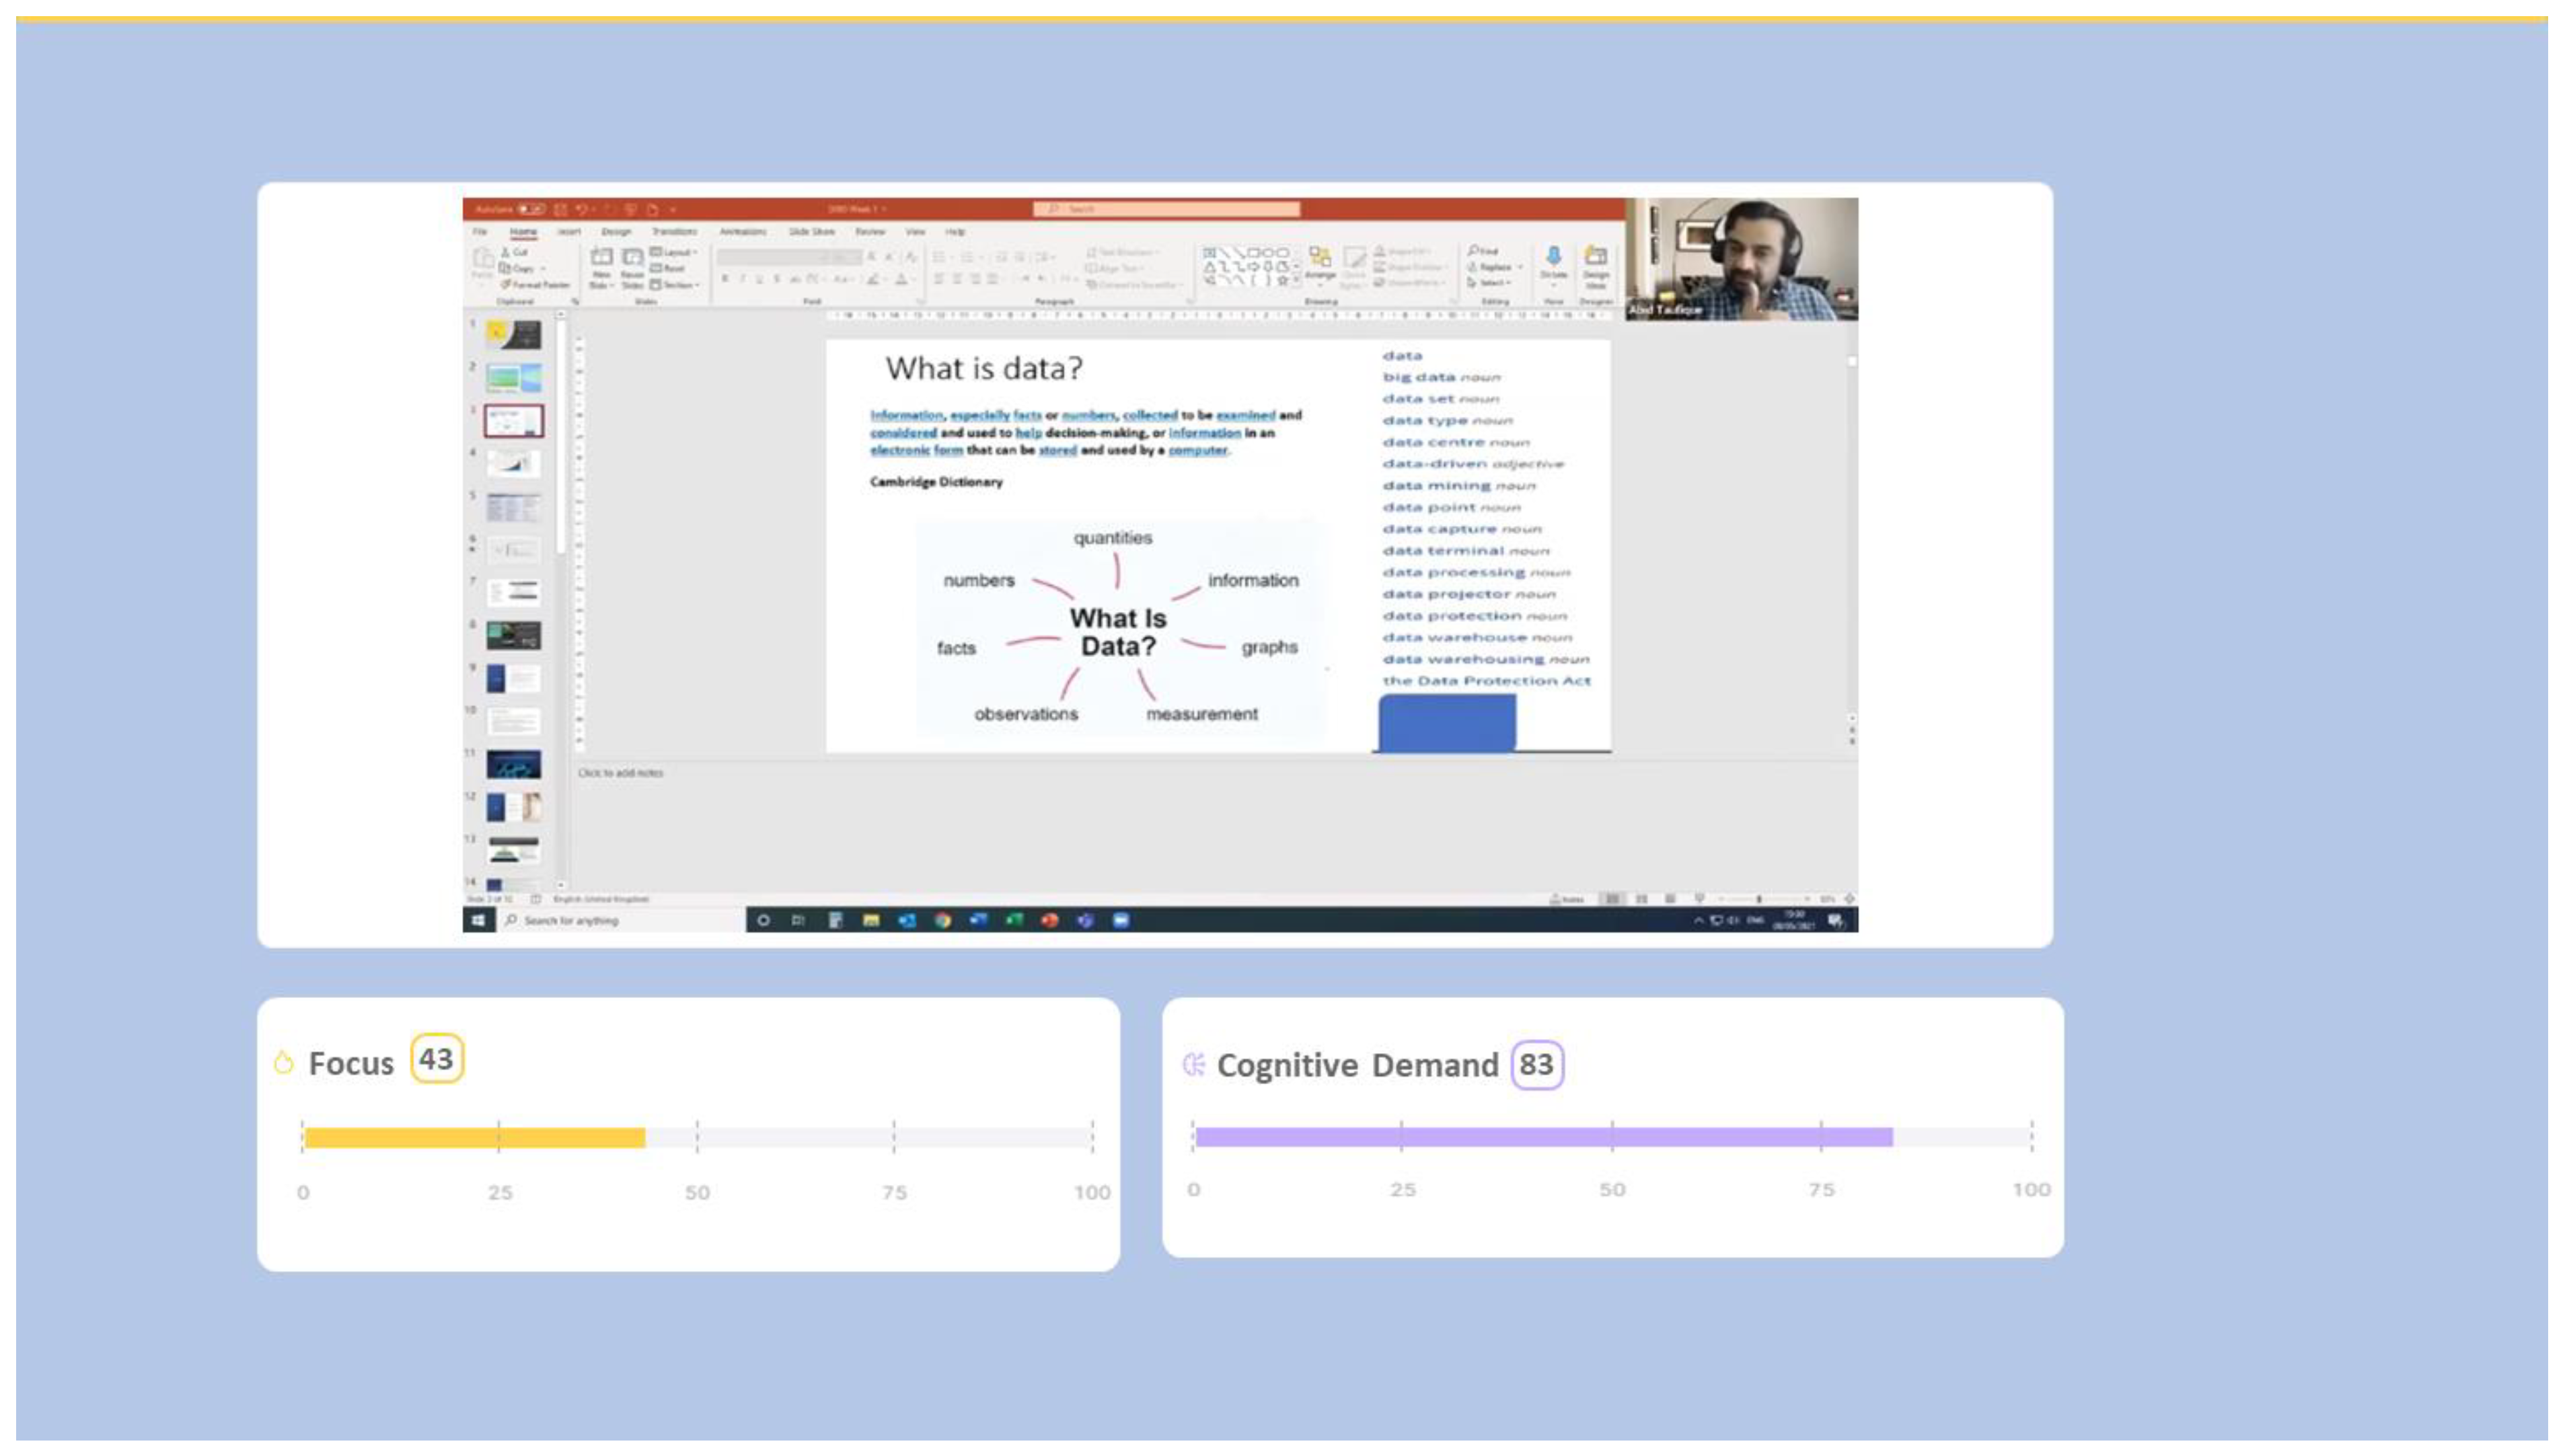
Figure A4. The analysis of neuromarketing research on the OBC video was conducted to evaluate the levels of focus and cognitive exertion that were present for the entire video.
Education 14 00933 g0a4
Figure A5. The OBC video was captured through the implementation of an AI eye tracker, which meticulously measured the focus by examining each frame in detail. The heat map that was generated illustrates the areas that garnered the highest degree of attention..
Education 14 00933 g0a5
Figure A6. The level of cognitive demand was assessed through the use of an AI eye tracker in the OBC video, by quantifying the cognitive demand on a frame-by-frame basis. The fog map represents the areas that are not visible to the human eye during the process of recording the cognitive demand on a frame-by-frame basis.
Education 14 00933 g0a6

References

  1. Sáiz-Manzanares, M.C.; González-Díez, I.; Varela Vázquez, C. Eye-Tracking Technology Applied to the Teaching of University Students in Health Sciences. In Lecture Notes in Networks and Systems, Proceedings of the International Joint Conference 16th International Conference on Computational Intelligence in Security for Information Systems (CISIS 2023) 14th International Conference on EUropean Transnational Education (ICEUTE 2023), Salamanca, Spain, 5–7 September 2023; Bringas, P.G., Ed.; Spinger: Cham, Switzerland, 2023; pp. 261–271. [Google Scholar] [CrossRef]
  2. Saxena, S.; Fink, L.K.; Lange, E.B. Deep learning models for webcam eye tracking in online experiments. Behav. Res. Methods 2023, 56, 3487–3503. [Google Scholar] [CrossRef] [PubMed]
  3. Jamil, N.; Belkacem, A.N. Advancing Real-Time Remote Learning: A Novel Paradigm for Cognitive Enhancement Using EEG and Eye-Tracking Analytics. IEEE Access 2024, 12, 93116–93132. [Google Scholar] [CrossRef]
  4. Gao, J.; Hu, W.; Lu, Y. Recursive Least-Squares Estimator-Aided Online Learning for Visual Tracking. In Proceedings of the 2020 IEEE/CVF Conference on Computer Vision and Pattern Recognition (CVPR), Seattle, WA, USA, 13–19 June 2020; IEEE: New York, NY, USA, 2020; pp. 7384–7393. [Google Scholar] [CrossRef]
  5. Naelufah, D.R.; Dalika, F.N.; Hazawa, I.; Zulfa, S. Students’ Perception of Oral Presentation Assignment Using PowerPoint in English Education Students. Edukatif J. Ilmu Pendidik. 2023, 5, 2623–2632. [Google Scholar] [CrossRef]
  6. Orru, G.; Longo, L. The Evolution of Cognitive Load Theory and the Measurement of Its Intrinsic, Extraneous and Germane Loads: A Review. In Communications in Computer and Information Science, Proceedings of the Human Mental Workload: Models and Applications. H-WORKLOAD 2018, Amsterdam, The Netherlands, 20–21 September 2018; Spinger: Cham, Switzerland, 2019; pp. 23–48. [Google Scholar] [CrossRef]
  7. Bernard, L.; Raina, S.; Taylor, B.; Kaza, S. Minimizing Cognitive Load in Cyber Learning Materials—An Eye Tracking Study. In Proceedings of the ACM Symposium on Eye Tracking Research and Applications, Stuttgart, Germany, 25–27 May 2021; ACM: New York, NY, USA, 2021; pp. 1–6. [Google Scholar] [CrossRef]
  8. Liu, C.; Liu, L.; Tan, Z. Choosing optimal means of knowledge visualisation based on eye tracking for online education. Educ. Inf. Technol. 2023, 28, 15845–15872. [Google Scholar] [CrossRef]
  9. Jamil, N.; Belkacem, A.N.; Lakas, A. On enhancing students’ cognitive abilities in online learning using brain activity and eye movements. Educ. Inf. Technol. 2023, 28, 4363–4397. [Google Scholar] [CrossRef] [PubMed]
  10. Pouta, M.; Lehtinen, E.; Palonen, T. Student Teachers’ and Experienced Teachers’ Professional Vision of Students’ Understanding of the Rational Number Concept. Educ. Psychol. Rev. 2021, 33, 109–128. [Google Scholar] [CrossRef]
  11. Dass, S.; Ramananda, H.S.; Savio, A.A. Eye-Tracking in Education: Analysing the relationship between Student’s performance and Videonystagmography Report. In Proceedings of the 2023 International Conference on New Frontiers in Communication, Automation, Management and Security (ICCAMS), Bangalore, India, 27–28 October 2023; IEEE: New York City, NY, USA, 2023; pp. 1–6. [Google Scholar] [CrossRef]
  12. Sáiz-Manzanares, M.C.; Marticorena-Sánchez, R.; Martín Antón, L.J.; González-Díez, I.; Carbonero Martín, M.Á. Using Eye Tracking Technology to Analyse Cognitive Load in Multichannel Activities in University Students. Int. J. Hum. Comput. Interact. 2024, 40, 3263–3281. [Google Scholar] [CrossRef]
  13. Jaiswal, A.; Venkatesh, J.; Nanda, G. Understanding Student Engagement during an Experiential Learning Task Using Eye Tracking: A Case Study. In Proceedings of the 2023 IEEE Frontiers in Education Conference (FIE), College Station, TX, USA, 18–21 October 2023; IEEE: New York City, NY, USA, 2023; pp. 1–7. [Google Scholar] [CrossRef]
  14. Vriend, S.A.; Vidyapu, S.; Rama, A.; Chen, K.-T.; Weiskopf, D. Which Experimental Design is Better Suited for VQA Tasks?: Eye Tracking Study on Cognitive Load, Performance, and Gaze Allocations. In Proceedings of the 2024 Symposium on Eye Tracking Research and Applications, Glasgow, UK, 4–7 June 2024; ACM: New York, NY, USA, 2024; pp. 1–7. [Google Scholar] [CrossRef]
  15. Cazes, M.; Noël, A.; Jamet, E. Cognitive effects of humorous drawings on learning: An eye-tracking study. Appl. Cogn. Psychol. 2024, 38, 1. [Google Scholar] [CrossRef]
  16. Chen, C.-M.; Wang, J.-Y.; Lin, Y.-C. A visual interactive reading system based on eye tracking technology to improve digital reading performance. Electron. Libr. 2019, 37, 680–702. [Google Scholar] [CrossRef]
  17. Chen, C.-M.; Wang, J.-Y. Effects of online synchronous instruction with an attention monitoring and alarm mechanism on sustained attention and learning performance. Interact. Learn. Environ. 2018, 26, 427–443. [Google Scholar] [CrossRef]
  18. Liu, E.; Zhao, J. Meta-analysis of the effectiveness of electroencephalogram monitoring of sustained attention for improving online learning achievement. Soc. Behav. Personal. Int. J. 2022, 50, 1–11. [Google Scholar] [CrossRef]
  19. Ye, X.; He, Z.; Heng, W.; Li, Y. Toward understanding the effectiveness of attention mechanism. AIP Adv. 2023, 13, 3. [Google Scholar] [CrossRef]
  20. Pan, H.; He, S.; Zhang, K.; Qu, B.; Chen, C.; Shi, K. AMAM: An Attention-based Multimodal Alignment Model for Medical Visual Question Answering. Knowl. Based Syst. 2022, 255, 109763. [Google Scholar] [CrossRef]
  21. Su, C.; Liu, X.; Gan, X.; Zeng, H. Using Synchronized Eye Movements to Predict Attention in Online Video Learning. Educ. Sci. 2024, 14, 548. [Google Scholar] [CrossRef]
  22. Hogg, N. Measuring Cognitive Load. In Handbook of Research on Electronic Surveys and Measurements; IGI Global: Hershey, PA, USA, 2007; pp. 188–194. [Google Scholar] [CrossRef]
  23. Paul, J.W.; Seniuk Cicek, J. The Cognitive Science of Powerpoint. In Proceedings of the Canadian Engineering Education Association (CEEA-ACEG), Charlottetown, PEI, Canada, 20–23 June 2021. [Google Scholar] [CrossRef]
  24. Ekol, G.; Mlotshwa, S. Investigating the cognitive demand levels in probability and counting principles learning tasks from an online mathematics textbook. Pythagoras 2022, 43, 1. [Google Scholar] [CrossRef]
  25. Neurons. Predict Tech Paper. Neurons, Inc.: Taastrup, Denmark, 2024. [Google Scholar]
  26. Zhou, Y.; Xu, T.; Cai, Y.; Wu, X.; Dong, B. Monitoring Cognitive Workload in Online Videos Learning Through an EEG-Based Brain-Computer Interface. In Learning and Collaboration Technologies. Novel Learning Ecosystems, Proceedings of the Conference: International Conference on Learning and Collaboration Technologies, Vancouver, Canada, 9–14 July 2017; Spinger: Cham, Switzerland, 2017; pp. 64–73. [Google Scholar] [CrossRef]
  27. Drzyzga, G.; Harder, T.; Janneck, M. Cognitive Effort in Interaction with Software Systems for Self-regulation—An Eye-Tracking Study. In Engineering Psychology and Cognitive Ergonomics, Proceedings of the 20th International Conference, EPCE 2023, Held as Part of the 25th HCI International Conference, HCII 2023, Copenhagen, Denmark, 23–28 July 2023; Spinger: Cham, Switzerland, 2023; pp. 37–52. [Google Scholar] [CrossRef]
  28. O’Riordan, T.; Millard, D.E.; Schulz, J. How should we measure online learning activity? Res. Learn. Technol. 2016, 24, 30088. [Google Scholar] [CrossRef]
  29. Yen, C.-H. Exploring the Choices for an Effective Method for Cognitive Load Measurement in Asynchronous Interactions of E-Learning. In Cognitive Load Measurement and Application; Routledge: New York, NY, USA, 2017; pp. 183–198. [Google Scholar] [CrossRef]
  30. Neurons. Predict Datasheet; Neurons, Inc.: Taastrup, Denmark, 2024. [Google Scholar]
  31. Chandran, P.; Huang, Y.; Munsell, J.; Howatt, B.; Wallace, B.; Wilson, L.; D’Mello, S.; Hoai, M.; Rebello, N.S.; Loschky, L.C. Characterizing Learners’ Complex Attentional States During Online Multimedia Learning Using Eye-tracking, Egocentric Camera, Webcam, and Retrospective recalls. In Proceedings of the 2024 Symposium on Eye Tracking Research and Applications, Glasgow, UK, 4–7 June 2024; ACM: New York, NY, USA, 2024; pp. 1–7. [Google Scholar] [CrossRef]
  32. Dostálová, N.; Plch, L. A Scoping Review of Webcam Eye Tracking in Learning and Education. Stud. Paedagog. 2024, 28, 113–131. [Google Scholar] [CrossRef]
  33. Gu, C.; Peng, Y.; Nastase, S.A.; Mayer, R.E.; Li, P. Onscreen presence of instructors in video lectures affects learners’ neural synchrony and visual attention during multimedia learning. Proc. Natl. Acad. Sci. USA 2024, 121, 12. [Google Scholar] [CrossRef]
  34. Asaadi, A.H.; Amiri, S.H.; Bosaghzadeh, A.; Ebrahimpour, R. Effects and prediction of cognitive load on encoding model of brain response to auditory and linguistic stimuli in educational multimedia. Sci. Rep. 2024, 14, 9133. [Google Scholar] [CrossRef]
  35. She, L.; Wang, Z.; Tao, X.; Lai, L. The Impact of Color Cues on the Learning Performance in Video Lectures. Behav. Sci. 2024, 14, 560. [Google Scholar] [CrossRef]
  36. Li, W.; Kim, B.K. Different Effects of Video Types and Knowledge Types on Cognitive Load in Lecture Video Learning. Educ. Res. Inst. 2023, 21, 133–160. [Google Scholar] [CrossRef]
  37. Kmalvand, A. Visual Communication in PowerPoint Presentations in Applied Linguistics. TechTrends 2015, 59, 41–45. [Google Scholar] [CrossRef]
  38. Azizifar, A.; Kmalvand, A.; Ghorbanzade, N. An Investigation into Visual language in PowerPoint Presentations in Applied Linguistics. Eur. J. Engl. Lang. Linguist. Res. 2024, 5, 16–28. Available online: https://www.eajournals.org/wp-content/uploads/An-Investigation-into-Visual-Language-in-Powerpoint-Presentations-in-Applied-Linguistics.pdf (accessed on 28 May 2024).
  39. Han, J.; Geng, X.; Wang, Q. Sustainable Development of University EFL Learners’ Engagement, Satisfaction, and Self-Efficacy in Online Learning Environments: Chinese Experiences. Sustainability 2021, 13, 11655. [Google Scholar] [CrossRef]
  40. Guo, Q.; Chen, Y. The Effects of Visual Complexity and Task Difficulty on the Comprehensive Cognitive Efficiency of Cluster Separation Tasks. Behav. Sci. 2023, 13, 827. [Google Scholar] [CrossRef]
  41. Gwizdka, J. Assessing Cognitive Load on Web Search Tasks. Ergon. Open J. 2009, 2, 114–123. [Google Scholar] [CrossRef]
  42. Rekik, G.; Khacharem, A.; Belkhir, Y.; Bali, N.; Jarraya, M. The effect of visualization format and content complexity on the acquisition of tactical actions in basketball. Learn. Motiv. 2019, 65, 10–19. [Google Scholar] [CrossRef]
  43. Linnell, K.J.; Caparos, S. Perceptual and cognitive load interact to control the spatial focus of attention. J. Exp. Psychol. Hum. Percept. Perform. 2011, 37, 1643–1648. [Google Scholar] [CrossRef]
  44. Liu, J.-C.; Li, K.-A.; Yeh, S.-L.; Chien, S.-Y. Assessing Perceptual Load and Cognitive Load by Fixation-Related Information of Eye Movements. Sensors 2022, 22, 1187. [Google Scholar] [CrossRef]
  45. Anand, R.; Gupta, N. Impact of Online Learning on Student Engagement and Academic Performance. Prax. Int. J. Soc. Sci. Lit. 2023, 6, 29–40. [Google Scholar] [CrossRef]
  46. He, H.; Zheng, Q.; Di, D.; Dong, B. How Learner Support Services Affect Student Engagement in Online Learning Environments. IEEE Access 2019, 7, 49961–49973. [Google Scholar] [CrossRef]
  47. Nanda, E.I.; Sowmya, M.R.; Khatua, L.; Teja, P.R.; Deshmukh, P. ALBERT-Based Personalized Educational Recommender System: Enhancing Students’ Learning Outcomes in Online Learning. Int. J. Recent Innov. Trends Comput. Commun. 2023, 11, 2190–2201. [Google Scholar] [CrossRef]
  48. Alqudah, H.; Khasawneh, M.A.S. Exploring the Impact of Virtual Reality Field Trips on Student Engagement and Learning Outcomes. Migr. Lett. 2023, 20, 1205–1216. [Google Scholar] [CrossRef]
  49. James, W.; Oates, G.; Schonfeldt, N. Improving retention while enhancing student engagement and learning outcomes using gamified mobile technology. Account. Educ. 2024, 1–21. [Google Scholar] [CrossRef]
  50. More, S.K.; Patil, Y.M.; Kumbhar, P.D. Improving Student Performance through Interactive Webinars. J. Eng. Educ. Transform. 2024, 37, 339–342. [Google Scholar] [CrossRef]
  51. Sharp, J.G.; Hemmings, B.; Kay, R.; Atkin, C. Academic boredom, approaches to learning and the final-year degree outcomes of undergraduate students. J. Furth. High. Educ. 2018, 42, 1055–1077. [Google Scholar] [CrossRef]
  52. Tam, K.Y.; Poon, C.Y.; Hui, V.K.; Wong, C.Y.; Kwong, V.W.; Yuen, G.W.; Chan, C.S. Boredom begets boredom: An experience sampling study on the impact of teacher boredom on student boredom and motivation. Br. J. Educ. Psychol. 2020, 90, 124–137. [Google Scholar] [CrossRef]
  53. Fitriyani, E.; Gusripanto, E. Teacher support and student engagement: Correlation study on students of SMPN 4 Rengat Barat. J. Psychol. Instr. 2021, 5, 26–32. [Google Scholar] [CrossRef]
  54. Chen, C.-M.; Wu, C.-H. Effects of different video lecture types on sustained attention, emotion, cognitive load, and learning performance. Comput. Educ. 2015, 80, 108–121. [Google Scholar] [CrossRef]
  55. Hanif, A.; Galvez-Peralta, M. The design of a ‘1-minute break’ to help with students’ attention during lectures in a Pharm.D. programme. Pharm. Educ. 2023, 23, 648–655. [Google Scholar] [CrossRef]
  56. Lee, H.; Kim, Y.; Park, C. Classification of human attention to multimedia lecture. In Proceedings of the 2018 International Conference on Information Networking (ICOIN), Chiang Mai, Thailand, 10–12 January 2018; IEEE: New York, NY, USA; pp. 914–916. [Google Scholar] [CrossRef]
  57. Hung, C.-T.; Wu, S.-E.; Chen, Y.-H.; Soong, C.-Y.; Chiang, C.; Wang, W. The evaluation of synchronous and asynchronous online learning: Student experience, learning outcomes, and cognitive load. BMC Med. Educ. 2024, 24, 326. [Google Scholar] [CrossRef] [PubMed]
  58. Costley, J. Using cognitive strategies overcomes cognitive load in online learning environments. Interact. Technol. Smart Educ. 2020, 17, 215–228. [Google Scholar] [CrossRef]
  59. Putri, I.I.; Ferazona, S. Analisis Usaha Mental (Um) Mahasiswa Sebagai Gambaran Extranous Cognitive Load (Ecl) Dalam Kegiatan Perkuliahan Pendidikan Biologi. Perspekt. Pendidik. Dan Kegur. 2019, 10, 67–72. [Google Scholar] [CrossRef]
  60. Yeo, S. The Application of Cognitive Teaching and Learning Strategies to Instruction in Medical Education. Korean Med. Educ. Rev. 2024, 26 (Suppl. 1), S1–S12. [Google Scholar] [CrossRef]
  61. Kun, B.; Yan, W.; Han, D. Exploring Interactive Design Strategies of Online Learning Platform Based on Cognitive Load Theory. Hum. Factors Syst. Interact. 2023, 84, 9–17. [Google Scholar] [CrossRef]
  62. Rosenthal, S.; Walker, Z. Experiencing Live Composite Video Lectures: Comparisons with Traditional Lectures and Common Video Lecture Methods. Int. J. Scholarsh. Teach. Learn. 2020, 14, 1. [Google Scholar] [CrossRef]
  63. Hwang, E.; Lee, J. Attention-based automatic editing of virtual lectures for reduced production labor and effective learning experience. Int. J. Hum. Comput. Stud. 2024, 181, 103161. [Google Scholar] [CrossRef]
  64. Suma, M.D. AI Generated Image Detection Using Neural Networks. Int. J. Sci. Res. Manag. 2024, 8, 1–11. [Google Scholar] [CrossRef]
  65. Bekler, M.; Yilmaz, M.; Ilgın, H.E. Assessing Feature Importance in Eye-Tracking Data within Virtual Reality Using Explainable Artificial Intelligence Techniques. Appl. Sci. 2024, 14, 6042. [Google Scholar] [CrossRef]
  66. Lin, B.; Guo, Y.; Hou, M. Tracking Algorithm Based on Attention Mechanism and Template Update. In Proceedings of the 2024 IEEE 3rd International Conference on Electrical Engineering, Big Data and Algorithms (EEBDA), Changchun, China, 27–29 February 2024; IEEE: New York, NY, USA, 2024; pp. 57–61. [Google Scholar] [CrossRef]
  67. Xi, J.; Wang, Y.; Cai, H.; Chen, X. Refined attention Siamese network for real-time object tracking. In Proceedings of the 2021 International Conference on Optical Instruments and Technology: Optoelectronic Measurement Technology and Systems, Online, 8–10 April 2022; Zhu, J., Jiang, J., Han, S., Zeng, L., Eds.; SPIE: Bellingham, WA, USA, 2022; p. 61. [Google Scholar] [CrossRef]
  68. Chen, B.; Li, P.; Sun, C.; Wang, D.; Yang, G.; Lu, H. Multi attention module for visual tracking. Pattern Recognit. 2019, 87, 80–93. [Google Scholar] [CrossRef]
  69. Liu, D.; Ji, Y.; Ye, M.; Gan, Y.; Zhang, J. An Improved Attention-Based Spatiotemporal-Stream Model for Action Recognition in Videos. IEEE Access 2020, 8, 61462–61470. [Google Scholar] [CrossRef]
  70. Ravi, R.; Karmakar, M. Reviewing the Significance of Attention and Awareness for Developing Learner-Centric Taxonomy. J. High. Educ. Theory Pract. 2023, 23, 14. [Google Scholar] [CrossRef]
  71. Nȩcka, E. Cognitive analysis of intelligence: The significance of working memory processes. Personal. Individ. Differ. 1992, 13, 1031–1046. [Google Scholar] [CrossRef]
  72. Pinkosova, Z.; McGeown, W.J.; Moshfeghi, Y. Moderating effects of self-perceived knowledge in a relevance assessment task: An EEG study. Comput. Hum. Behav. Rep. 2023, 11, 100295. [Google Scholar] [CrossRef]
  73. Fan, Z.; Ning, L.; Kai, X.; Zhibo, C. Method and Apparatus for Video Quality Assessment Based on Content Complexity. U.S. Patent US10536703B2, 14 January 2020. [Google Scholar]
  74. Dokic, K.; Idlbek, R.; Mandusic, D. Model of information density measuring in e-learning videos. New Trends Issues Proc. Humanit. Soc. Sci. 2017, 4, 12–20. [Google Scholar] [CrossRef]
  75. Tiede, J. Part II: Measuring Media-related Educational Competencies. Medien. Z. Für Theor. Und Prax. Der Medien. 2020, 101–151. [Google Scholar] [CrossRef]
  76. Huang, C.L.; Luo, Y.F.; Yang, S.C.; Lu, C.M.; Chen, A.-S. Influence of Students’ Learning Style, Sense of Presence, and Cognitive Load on Learning Outcomes in an Immersive Virtual Reality Learning Environment. J. Educ. Comput. Res. 2020, 3, 596–615. [Google Scholar] [CrossRef]
  77. Feldon, D.F.; Callan, G.; Juth, S.; Jeong, S. Cognitive Load as Motivational Cost. Educ. Psychol. Rev. 2019, 31, 319–337. [Google Scholar] [CrossRef]
  78. Bellaj, M.; Dahmane, A.B.; Boudra, S.; Sefian, M.L. Educational Data Mining: Employing Machine Learning Techniques and Hyperparameter Optimization to Improve Students’ Academic Performance. Int. J. Online Biomed. Eng. iJOE 2024, 20, 55–74. [Google Scholar] [CrossRef]
  79. Karale, A.; Narlawar, A.; Bhujba, B.; Bharit, S. Student Performance Prediction using AI and ML. Int. J. Res. Appl. Sci. Eng. Technol. 2022, 10, 1644–1650. [Google Scholar] [CrossRef]
  80. Van de Schoot, R.; De Bruin, J. Researcher-in-the-loop for systematic reviewing of text databases. SciNLP: Natural Language Processing and Data Mining for Scientific Text. Zenodo 2020. [Google Scholar] [CrossRef]
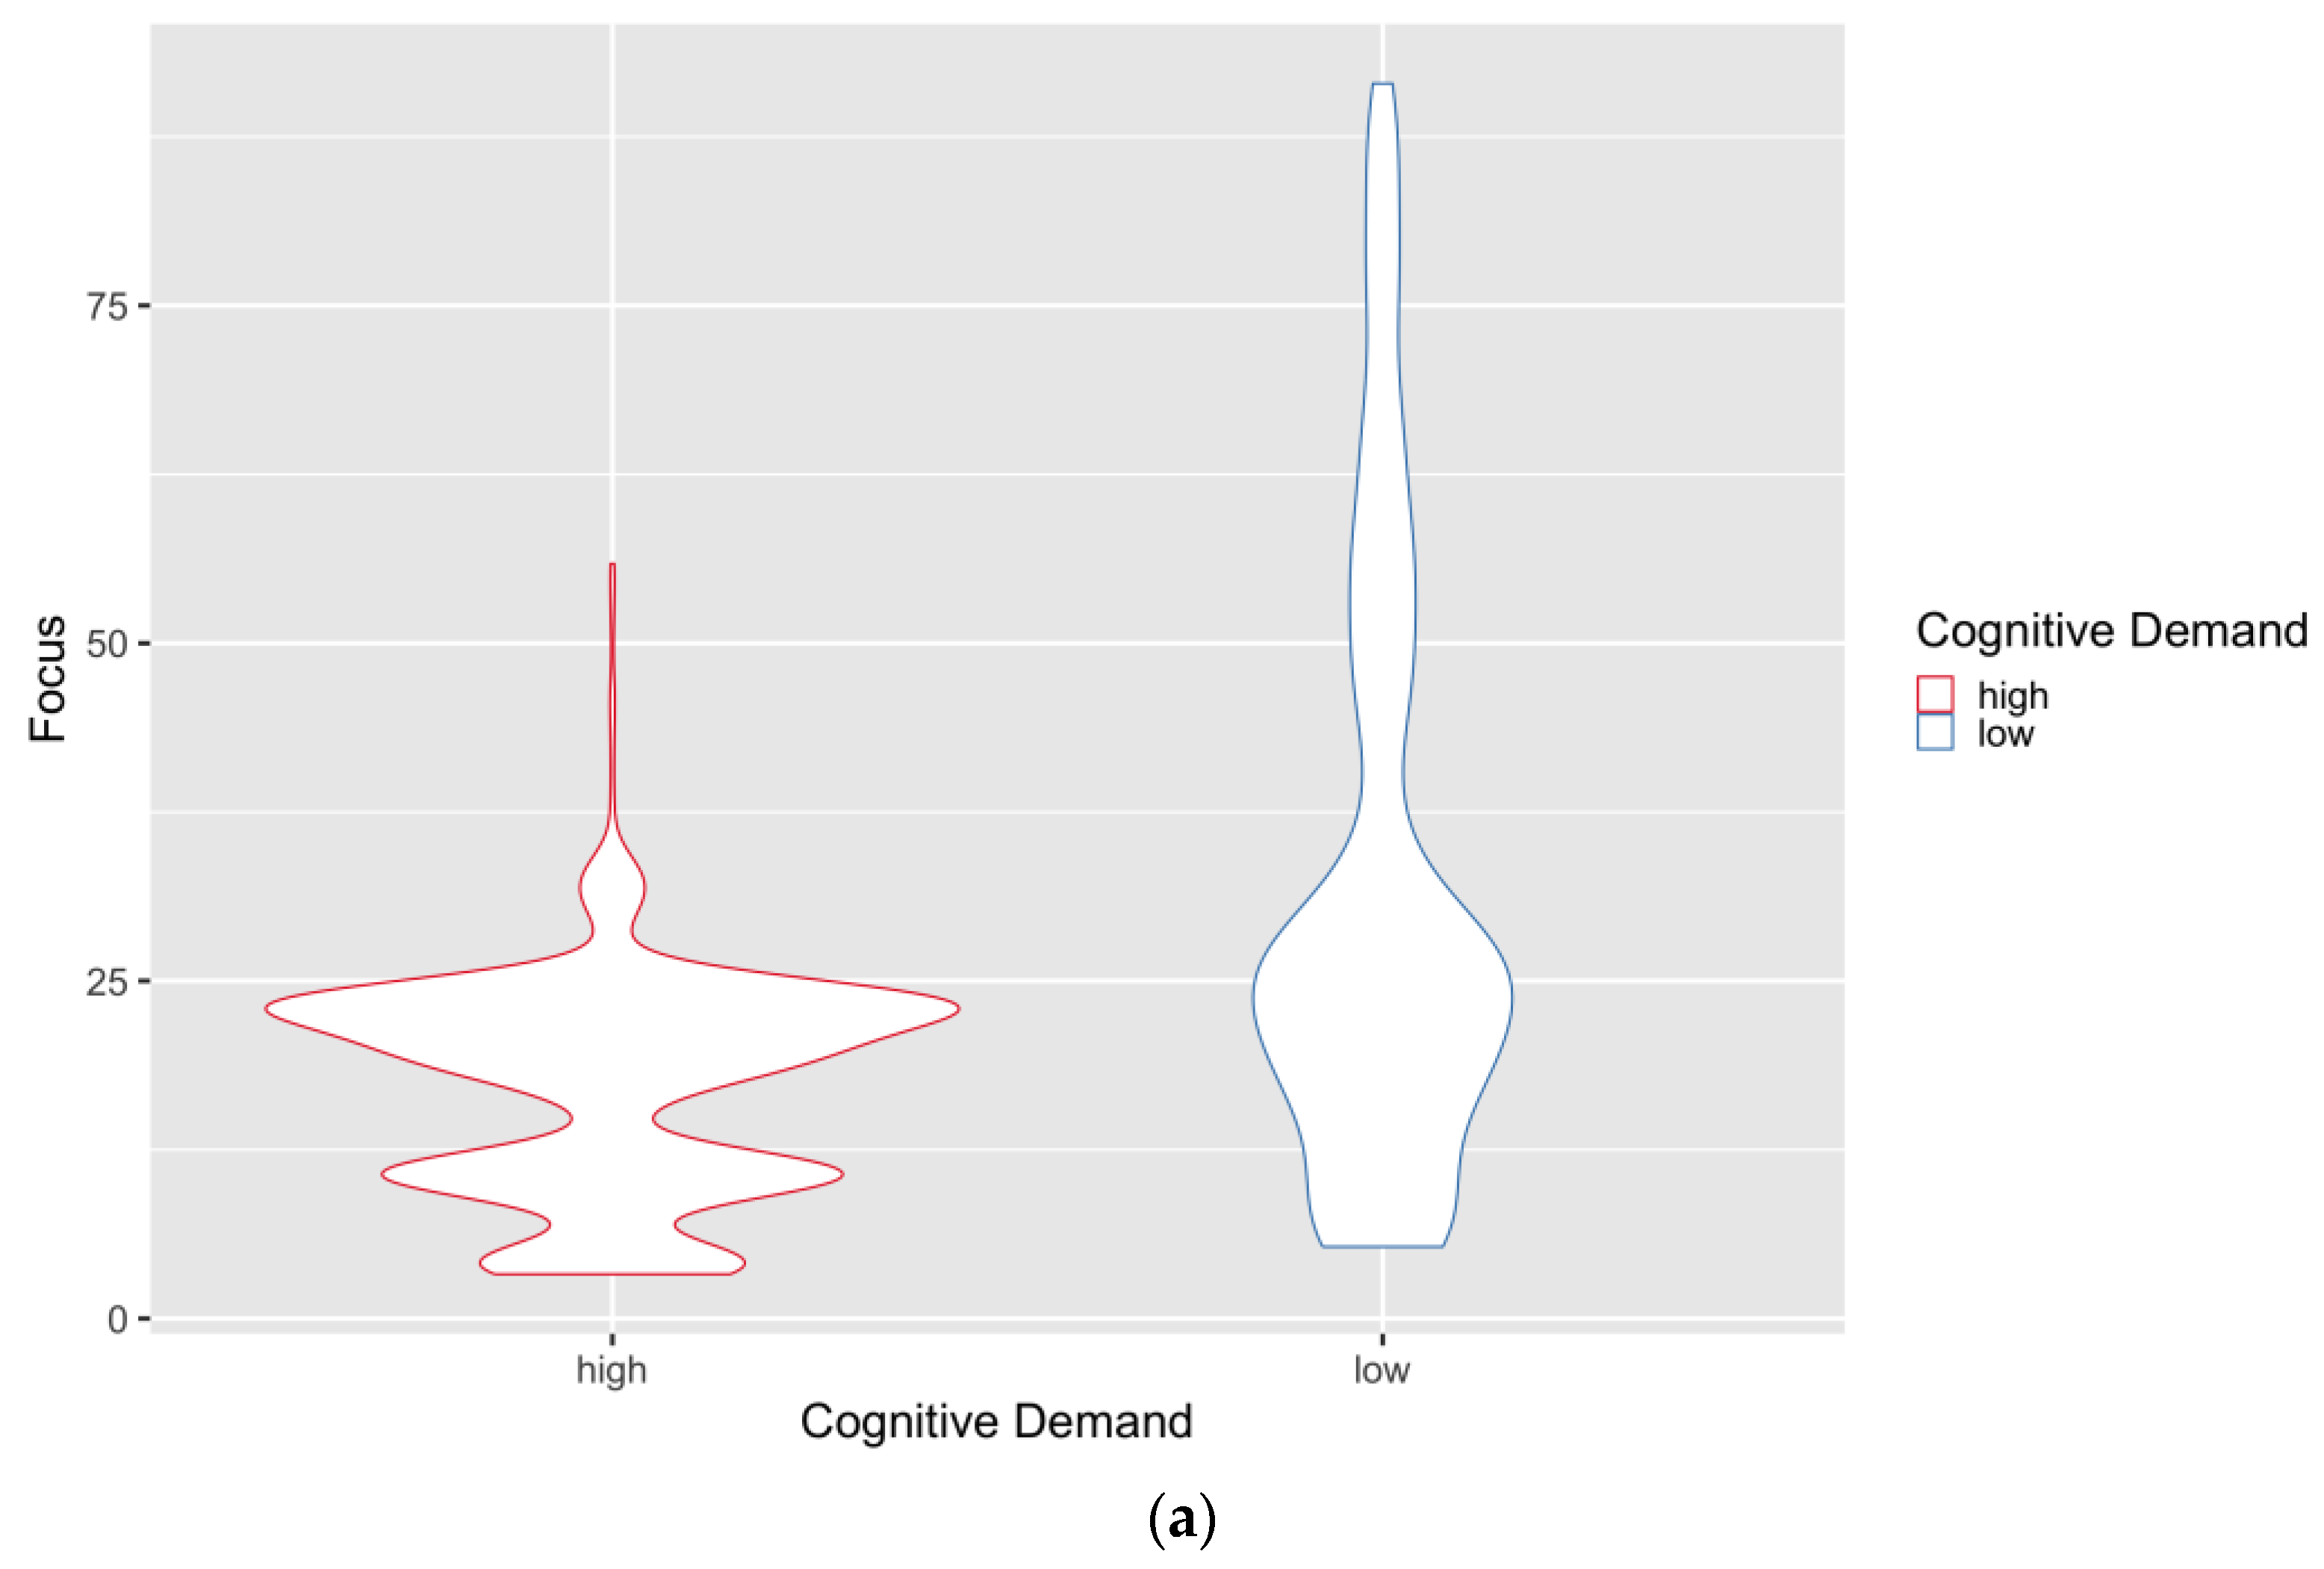
Figure 1. (a) shows the CD score difference between high- and low-Focus groups for the Utrecht University video lecture. (b) shows the focus score differences between high- and low-CD groups for the Utrecht University video lecture.
Education 14 00933 g001aEducation 14 00933 g001b
Figure 2. (a): Linear relationship between Focus and CD for the overall Utrecht University lecture video. (b): Linear relationship between Focus and CD for high Focus for the Utrecht University video lecture. (c): Linear relationship between Focus and CD for low Focus for the Utrecht University video lecture. (d): Linear relationship between Focus and CD for high CD for the Utrecht University video lecture. (e): Linear relationship between Focus and CD for low CD for the Utrecht University video lecture.
Education 14 00933 g002aEducation 14 00933 g002bEducation 14 00933 g002c
Figure 3. (a): CD score difference between high- and low-Focus groups for the OBC video lecture. (b): Focus score differences between high- and low-CD groups for the OBC video lecture.
Education 14 00933 g003aEducation 14 00933 g003b
Figure 4. (a): Linear relationship between Focus and CD for the overall video for the OBC video lecture. (b): Linear relationship between Focus and CD for high Focus for the OBC video lecture. (c): Linear relationship between Focus and CD for low Focus for the OBC video lecture. (d): Linear relationship between Focus and CD for high CD for the OBC video lecture. (e): Linear relationship between Focus and CD for low CD for the OBC video lecture.
Education 14 00933 g004aEducation 14 00933 g004bEducation 14 00933 g004c
Table 1. Focus and CD means, SDs, and ranges for each condition for both video lectures.
MetricsFocusCognitive Demand
MagazineConditionMeanSDRangeMeanSDRange
Utrecht UniversityHigh Focus40.7719.34(23.803, 91.44)56.0417.19(20.86, 85.25)
Low Focus15.126.64(3.29, 23.8)75.3714.09(36.02, 94.69)
High CD17.388.09(3.29, 55.89)81.788.64(68.85, 94.69)
Low CD31.50121.903(5.32, 91.44)53.312.67(20.86, 68.78)
OBCHigh Focus46.352.05(43.18, 53.91)83.270.53(80.73, 83.75)
Low Focus39.852.54(30.88, 43.17)83.330.34(80.75, 83.81)
High CD43.113.83(32.01, 53.91)83.470.098(83.297, 83.81)
Low CD43.324.34(30.88, 53.64)82.880.66(80.73, 83.3)
Table 2. Pearson’s correlation scores for each condition for the Utrecht University video lecture.
ConditionPearson’s Correlation Score
Overall−0.697
High Focus−0.695
Low Focus−0.421
High CD−0.761
Low CD−0.686
Table 3. Pearson’s correlation scores for each of the conditions for the OBC video lecture.
ConditionPearson’s Correlation Score
Overall−0.07
High Focus−0.07
Low Focus0.04 (not significant)
High CD0.2
Low CD−0.19
Disclaimer/Publisher’s Note: The statements, opinions and data contained in all publications are solely those of the individual author(s) and contributor(s) and not of MDPI and/or the editor(s). MDPI and/or the editor(s) disclaim responsibility for any injury to people or property resulting from any ideas, methods, instructions or products referred to in the content.