Article

Using a Modified Gower Distance Measure to Assess Supplemental Learning Supporting an Online Social Science Graduate Course

by
Jacinto De La Cruz Hernandez
1,
Kenneth John Tobin
1,*,
John C. Kilburn
2 and
Marvin Edward Bennett
1
1
Center for Earth and Environmental Studies, Texas A&M International University, Laredo, TX 78041, USA
2
Department of Social Science, Texas A&M International University, Laredo, TX 78041, USA
*
Author to whom correspondence should be addressed.
Educ. Sci. 2025, 15(3), 371; https://doi.org/10.3390/educsci15030371
Submission received: 20 January 2025 / Revised: 8 March 2025 / Accepted: 11 March 2025 / Published: 17 March 2025
(This article belongs to the Topic Advances in Online and Distance Learning)

Abstract

:
Supplemental instruction (SI) is a well-established direct academic support model. SI leaders provide unique success strategies that benefit underserved and underprepared students in difficult courses. In this study, the novel application of SI strategies at the master’s level was explored. The subject university is a Hispanic Serving Institution in the southern United States, and a social science program was examined, focusing on 309 students. Key findings include an improvement in performance on a post-course evaluation compared with the pre-course instrument. This increase was present regardless of the number of SI sessions attended. An instructor effect was also identified. One specific instructor had a letter grade lower average course grade than their peers. For this instructor, pass rate and course grade were significantly improved by SI, and the more SI sessions attended, the greater the effect. For all other instructors, SI had a small improvement on pass rate and course grade, possibly the result of grade compression associated with graduate student evaluation.

1. Introduction

Traditional tutoring provides students with one-on-one interactions such as individualized sessions geared to facilitate student success for high-risk students (Dawson et al., 2014; Feldon et al., 2010; Gasiewski et al., 2012). In contrast to the traditional tutoring models, the role of a supplemental instructor (SI) is more expansive and focuses on gateway courses that impede students’ performance within the core curriculum or a specific program (Koch, 2017). The SI model was developed at the University of Missouri-Kansas City in 1973 (Martin & Arendale, 1992) and has been determined to be a high-impact practice by the United States Department of Education. SI programs are designed to benefit all students; however, it has been documented that this practice has the greatest impact on high-risk students (Kalsbeek, 2013). SI leaders provide unique success strategies that benefit underserved and underprepared students in difficult courses (Burkholder et al., 2021). Supplemental instruction can be framed within a more holistic model of a learning team that facilitates student success. Supplemental instruction has demonstrated short- and long-term positive impacts on student success (Grillo & Leist, 2013; Martin & Arendale, 1992; Ogden et al., 2003; Ramirez, 1997).
While SI strategies have historically focused on benefitting undergraduate students in gateway courses (Dawson et al., 2014), the program at the subject Hispanic Serving Institution (HSI) uses the SI model to benefit master’s students through structured active involvement facilitation, participatory classroom structure, critical thinking, and collaborative peer learning (Doubleday & Townsend, 2018). Master’s students face different issues than traditional undergraduates with increased family and work obligations. While many graduate students may have increased motivation and benefit from their prior academic experiences compared with their undergraduate peers, some older adult learners, with long pauses in their studies, can struggle with the accelerated nature of online learning and could benefit from SI.
As defined by the US Department of Education, an HSI has a minimum of 25% Latinx students. An organization ideal in this type of institution is the concept of Servingness (Garcia et al., 2019), in which through research, practice, and policy, intentional support addresses the unique needs of its Hispanic student population. In this context, master’s programs play a vital role in closing educational disparities present in the underserved and economically disadvantaged regions that many HSIs serve. With a focus on skill building and accelerated credentialing, online graduate programs (Wlodkowski & Ginsberg, 2010) serve a critical function in this regard. The literature has shown that SI can be an effective mechanism for underrepresented minorities (URM; Bowman et al., 2023; Rath et al., 2007). This is because SI leaders match the student demographics more closely than course instructors. In this study, the percent of Hispanics among the students, supplemental instructors, and faculty was 69%, 100%, and 0%, respectively. As such, the SIs can better relate to the lived experiences of the student populations that they serve than faculty.
The fundamental issues with traditional SI assessment using course-level pass rates or course grades are that (1) this service is optional and (2) students who participate in SI may be disproportionately high-performing students, producing a bias in the evaluation. Participation of high-performing students has the potential to inflate the perceived efficacy of SI (McCarthy et al., 1997). A randomized control protocol, the gold standard for an experimental design, addresses this issue. The only such SI study that approximates this standard was implemented by Paloyo et al. (2016). In general, since SI is optional, this makes implementing a randomized control study difficult. Also, there are ethical issues with withholding SI services from students, which would be needed to form a true control group. Methods have been developed that can generate approximate treatment and control groups replicating a randomized control protocol without direct subject manipulation. Bowman et al. (2023) used propensity scoring to address the self-selection issue, but this approach is best applied to large datasets (n > 1000). Coarsened exact matching is another method that facilitates the comparison of students with similar characteristics (Guarcello et al., 2017; Ho et al., 2011; Iacus et al., 2012). However, in this study the Gower distance measure (GDM) was used. GDM is the preferred distance function when matching observations with mixed variable types, and the modified GDM allows for better control in balancing different variable types (D’Orazio, 2021). Furthermore, the GDM has outperformed other distance functions in measuring continuous variables (Dettmann et al., 2011).
GDM was deployed to examine the effect of SI on students in a master’s gateway course for an accelerated, online social science program at a regional university in the southern United States. As such, this work has great novelty as SI programs are mainly implemented at the undergraduate level. From spring 2020 to spring 2023, 309 students were enrolled in eleven sections of the gateway course, with 118 of these students attending at least one SI session. Note that this enrollment is relatively small compared to undergraduate classes where SI is more commonly deployed. As institutional practices shift to support student retention and funding becomes ever scarcer, the need to accurately evaluate SI effectiveness becomes more acute.

2. SI Program Overview

The graduate SI program at the subject HSI is funded by a United States Department of Education Title V Developing Hispanic-Serving Institutions grant. SI is a critical component within a first-year graduate success program, this grant’s centerpiece. This program serves five master’s programs including mathematics and four social science programs. These disciplines were selected because of their low first-year retention rates evident during the 2018–2019 academic year, the year before the grant was written. The first-year graduate success program was launched in the Spring 2020 semester and focused on entry first year graduate courses that impede student progress within their degree, i.e., gateway courses (Koch, 2017). To isolate discipline impact, this study focused on a gateway course to the master’s social science program, which was taught online (Table 1). To bolster student performance strategic investments were made in technology (virtual desktops, software), intellectual resources (library resources), and human capital (SI).
The graduate SI program is modeled on prior successful mentoring initiatives implemented at the subject HSI. The SIs selected have a strong academic record (>3.5 GPA) with an A grade in the courses that they provide instruction for. SIs are either advanced graduate students or alumni who completed the master’s program or a closely related program that they are assigned to as an SI. The graduate students receiving this service are not charged. Supplemental instruction is offered at times outside the normal workday (evenings, weekends) to accommodate student schedules. The use of technology (i.e., WebEx, Zoom, Microsoft Teams, etc.) further increases the availability of sessions to online students. SIs coordinate their efforts with the instructor of record and teaching assistants on a weekly basis, forming a coherent learning team. This effort provides a seamless learning experience for the students. SIs attend course sessions offered by the instructor and facilitate regular recitation meetings, as well as holding exam review sessions. SIs also have availability for individualized instruction like traditional tutors.

3. Materials and Methods

3.1. Gower Distance Matching (GDM)

To address the difficulty arising from the self-selective nature of SI attendance, we applied a pseudo-experimental design by using the modified Gower distance matching (GDM; D’Orazio, 2021). By matching students in the treatment group (those who attended SI at least once) to students in the control group (those who did not attend SI) based on their proximity in value among different covariates, we can better isolate effects of SI attendance on academic performance.
The variables used for the matching process were chosen by their support in the literature, as well as their accessibility through the institution’s student information database (Bowman et al., 2023; Guarcello et al., 2017). Three demographic variables (ethnicity, gender, and age) were used along with one academic variable (semester credit hours (SCHs) attempted) in the matching process. Ethnicity and gender were binary variables with two possible values, Hispanic or Not Hispanic and female or male, respectively. Several studies have focused on the SI’s role for underrepresented racial minorities (URMs; Bowman et al., 2023; Koch, 2017; Rath et al., 2007). Fayowski and MacMillan (2008) examined SI for a first-year calculus course and detected no significant gender differences. Age and SCHs attempted were continuous variables. Age was used as a variable by Guarcello et al. (2017). The final matching variable, SCHs attempted, provided an indication of whether a student is full- or part-time. The subject HSI does not classify students on this basis.
GDM was chosen as it is the preferred measure to match observations using mixed-type variables (D’Orazio, 2021). The distance calculation and matching between the treatment and control groups was carried out with the distance-based matching program assessment tool created by the Indiana University Institutional Analytics team, based on the MatchIt R package (Deom, 2023). The tool calculates the modified GDM between treatment observation i and control observation j for each matching variable v as follows:
G i j = v = 1 p w v d i j v v = 1 p w v
given variable weights wv, where dijv is the difference between the values of treatment observation i and control observation j on variable v. These modified GDM values, G i j , represent the similarity between each pair of members from the treatment group to the control group. The GDM values are then used to match one student from the control group to each student in the treatment group, guaranteeing that our treatment group is now more representative of the control group. This means we can better isolate the effect of the treatment, which is attending SI.
Table 2 shows that there was a significant difference (p ≤ 0.05) between the treatment and control groups for the sex and age variables indicating that our treatment group was not representative of our control group. Based on these differences, we set the variable weights in the matching tool to give sex the highest priority (weight = 10), followed by age (weight = 9), and giving ethnicity and SCHs attempted the lowest priority of the four (weight = 3) as they exhibited no significant differences.

3.2. Academic Variables Used to Gauge SI Efficacy

Four academic variables were used to evaluate the efficacy of the SI program for the online gateway social science course. These variables included the binary variables denoting whether a student completes the course or not (retention) and whether the students that complete the course received a passing grade of B or A (Pass/Fail). These are presented as rates, course retention and course pass rate, respectively. Course grade denotes the average grade students received in the gateway course. Finally, improvement denotes the proportion of students who exhibit improvement on the post-course evaluation compared with a pre-course evaluation. Mack (2007) examined how SI impacted student withdrawal, the opposite of retention, in undergraduate biology and chemistry courses. Many studies have documented how SI interventions impact pass rates and course grades (i.e., Bowman et al., 2023; Congos & Mack, 2005; Fayowski & MacMillan, 2008; Kochenour et al., 1997; Oja, 2012; Paloyo et al., 2016). Hensen and Shelley (2003), in their SI study, combined A and B grades into their own category (A/B), which in this study is the course pass rate.
To better understand a student’s level of course content comprehension, pre- and post-course evaluations were conducted with the course instructor’s cooperation. The deployment of these instruments was voluntary and they were not deployed in some sections (Table 1). The instructor designed two examinations to gauge students’ level of understanding of the course content that were administered at the beginning and end of the course. Students who demonstrated a higher score on the post-course versus pre-course evaluation were designated as having improved course material comprehension. Students missing one or both evaluation scores were omitted from the analysis for this variable. To our knowledge, this type of measure has not been deployed in other studies focusing on SI efficacy. The improvement variable presents the ratio of students that showed an improvement on these examinations.

3.3. Descriptive Statistics

Comparison between the student populations examined in this study was facilitated with basic descriptive statistics (mean and two-tailed t-test). The significance level for the two-tailed t-tests was set at p ≤ 0.05. We also used the Cohen’s d measure of effect size to determine if the SI intervention provided a worthwhile effect (Cohen, 1988). Hattie (2009) established a Cohen’s d of 0.4 as the threshold for interventions worth implementing. This means the intervention, in this case SI, improves an outcome in an impactful manner, providing a return on investment that makes SI implementation worthwhile. Mayhew et al. (2016) set worth guidelines for college impact research and indicate the following Cohen’s d values for a small (0.2 to 0.5), medium (0.5 to 0.8), and large (>0.8) effect.

4. Results

Table 3 shows the demographic data after applying GDM. This approach produces a reduced control group that mirrors the treatment group among the chosen variables. Table 4 compares the matched non-SI and SI populations based on academic output variables. Only the improvement variable showing change between pre- and post-course evaluation showed a statistically significant difference with a Cohen’s d above the worthwhile implementation threshold. Course grade has a nearly significant improvement (p = 0.058) for students who attended SI, but with a Cohen’s d indicative of a small effect.
Disaggregating data based on instructor and frequency of SI attendance yielded additional insights. As indicated in Table 1, there is a significant instructor effect in this study. Instructor A had statistically significantly lower (2.480; p = 0.0005) course grades than the instructors B to E combined (3.416; Table 1). In this context, SI had a medium effect (Cohen’s d = 0.5 to 0.8) on the course pass rate and course grades in instructor’s A sections, respectively (Figure 1). For instructors B to E together, only improvement recorded a Cohen’s d indicative of a worthwhile intervention (Table 5). Instructor A opted not to implement pre- and post-course evaluations in their sections. Course retention dropped in instructor A’s sections (Figure 1), unlike the non-significant increase recorded for the other instructors (Table 5). Note that course retention in the targeted course is high (>90%), so it is not surprising this variable had either no or small gains.
For instructor A, the impact of SI on course pass rate and course grade was amplified by the number of SI sessions attended (Figure 2). When a student attended only one SI session, there was a small effect on only the course grade, which barely exceeded the worthwhile implementation threshold. However, when students attended two or more SI sessions, a large effect on course pass rate and course grade was produced (Cohen’s d = 0.9 to 1.1). For instructors B to E combined, course retention, course grade, and improvement all exhibited non-significant, slight increases when students attended two or more SI sessions compared with students who attended only one SI session (Table 5).

5. Discussion

For all student populations, the SI intervention had a worthwhile impact. For the outlier instructor A, course pass rate and course grades showed a medium to large effect. Conversely, for all other instructors combined (B to E), the SI intervention had a medium effect on improving student knowledge as assessed by comparing pre- versus post-course evaluation results.

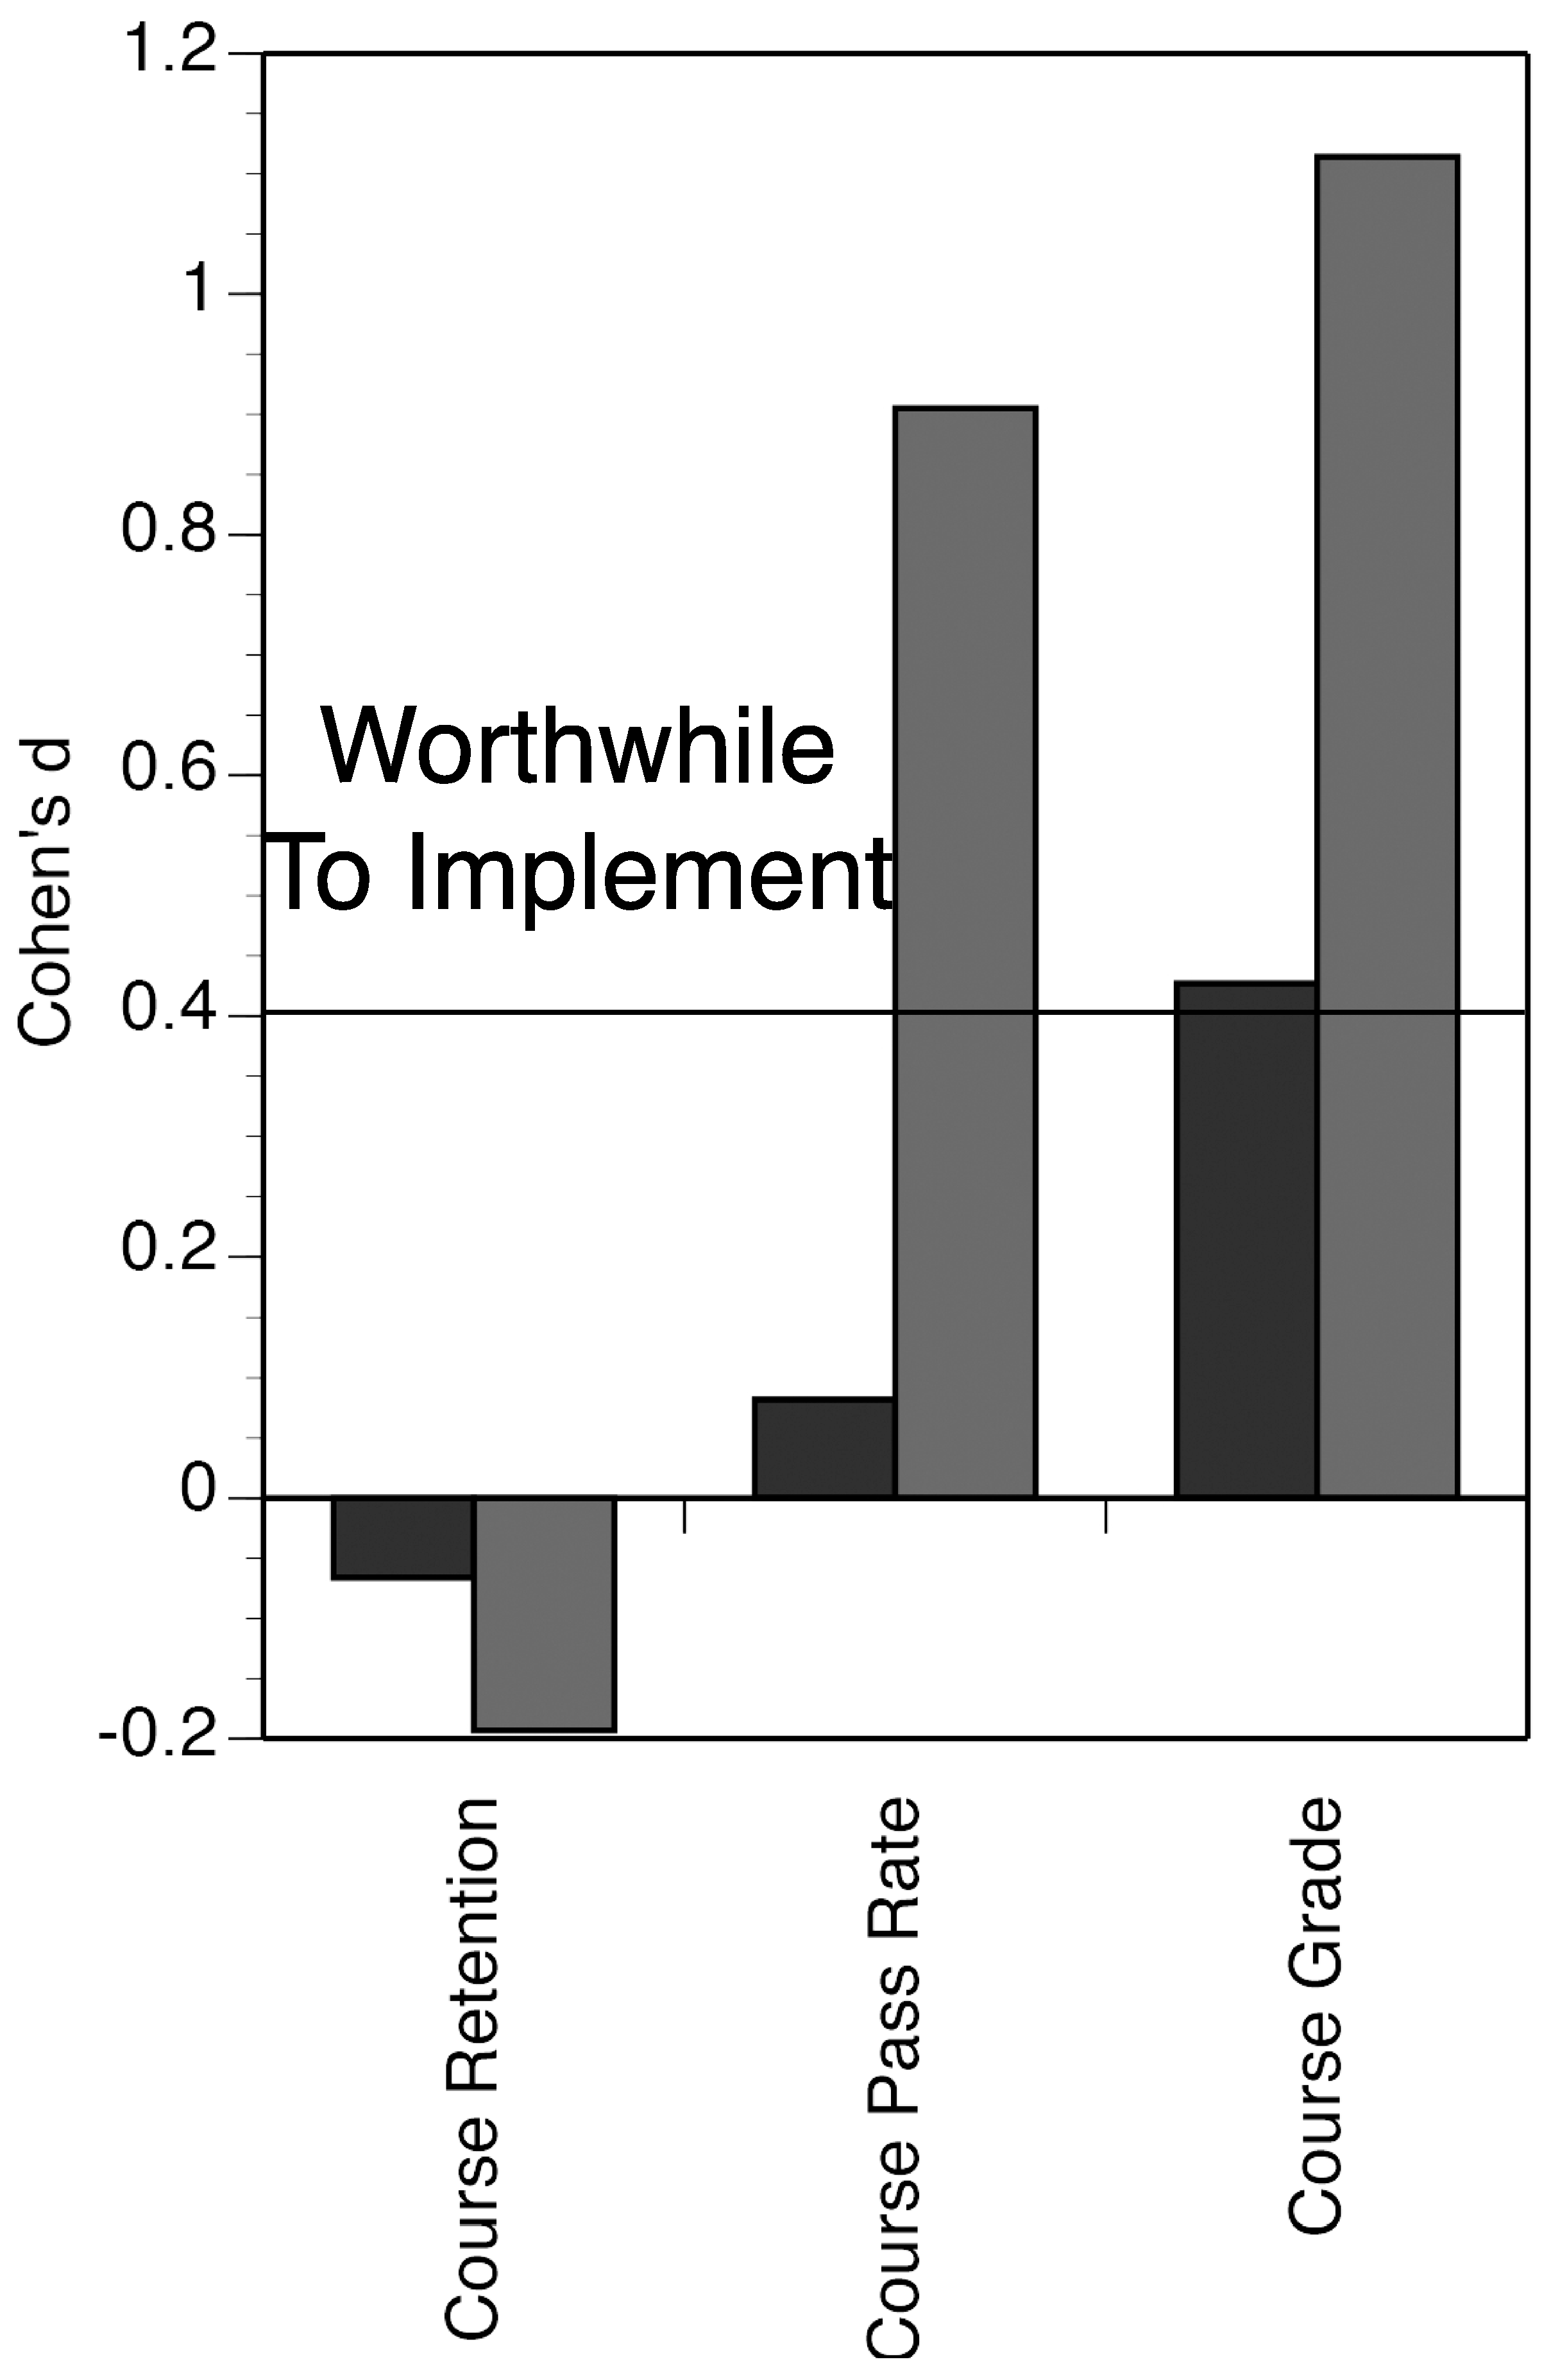
5.1. Instructor Effect on the Impact of Supplemental Instruction

An instructor effect on SI efficacy has been documented in prior works (Cheng & Walters, 2009; Congos & Mack, 2005). In this study, SI had its biggest impact on students who were at the greatest risk for failure (i.e., students in instructor A’s sections). In this population, SI markedly improved the overall course pass rate and course grades (Figure 1).
For students who were at less of a risk for failure (i.e., students in instructors B to E sections), a consistent, moderate improvement in knowledge (Cohen’s d = 0.5) was recorded for students who attended SI sessions versus those who did not (Table 5). Course retention, course pass rate, and course grade recorded non-significant increases among SI-attending students versus non-SI-attending students. The muted impact of SI on course grade is explained by graduate grade compression. All sections taught by instructors B to E had an average grade over 3.0. In addition, at the subject HSI, the final letter grade lacks pluses or minuses, further constricting graduate student evaluation. Therefore, this coarse level of evaluation limits the ability to detect improvements in grade related to SI in sections offered by instructors B to E. For most students of these instructors, the only possible grade increase is from a B to an A. Conversely, for instructor A, the overall lower GPAs provide more potential room for improvement associated with the SI intervention, i.e., students can raise their grade from a C to a B or even an A.

5.2. Effect of Frequency of Attendance on the Impact of Supplemental Instruction

Increased frequency of SI attendance has been documented to improve student outcomes (i.e., Bowman et al., 2023; Bowles et al., 2008; Cheng & Walters, 2009; Kochenour et al., 1997; Mack, 2007; Malm et al., 2018). For instructor A, course pass rate and course grade markedly increased with greater SI attendance (Figure 2). For these variables, the difference between students who attended only one SI session compared to students attending two or more sessions was statistically significant (p = 0.0071 and p = 0.0262, respectively). For instructors B to E, all variables except the course pass rate increased when students attended more SI sessions (Table 5). In summary, this study illustrated a small to large effect in improving student academic outcomes within a master’s level gateway course, making SI in this instance a worthwhile intervention.

5.3. Study Limitaions

The three-year study period formed a major limitation for this work. The lack of data also limited the strength of the pseudo-experimental model. Due to the institution’s data collection practices, some matching variables were not available, such as first-generation student status or undergraduate GPAs, which could have an influence on the perceived SI efficacy. Only five out of eleven sections included a pre- and post-course evaluation. If the improvement variable had been collected from all of the sections, more robust conclusions could have been made. It is uncertain if this study’s conclusions are generalizable to non-HSI institutions. In addition, it is unclear how well this work’s findings would translate to other disciplines beyond the social sciences or other modalities, i.e., face-to-face. Finally, instruction in the gateway course occurred in an accelerated online modality, and there is uncertainty about the applicability of these findings to face-to-face or hybrid courses.
More robust validation or refutation of this study could be obtained with a larger sample size. Thorough data collection practices are an important aspect of learning about understudied student populations and should be considered in future expanded studies. Broadening this effort to different student populations would help extend the generalizability of these findings.

6. Conclusions

Application of GDM determined the efficacy of SI supporting a master’s-level online social science gateway course. Most SI programs serve undergraduates and therefore this study’s focus is novel. Also, the examination of SI at an HSI adds another unique dimension to this work. The main conclusions are as follows:
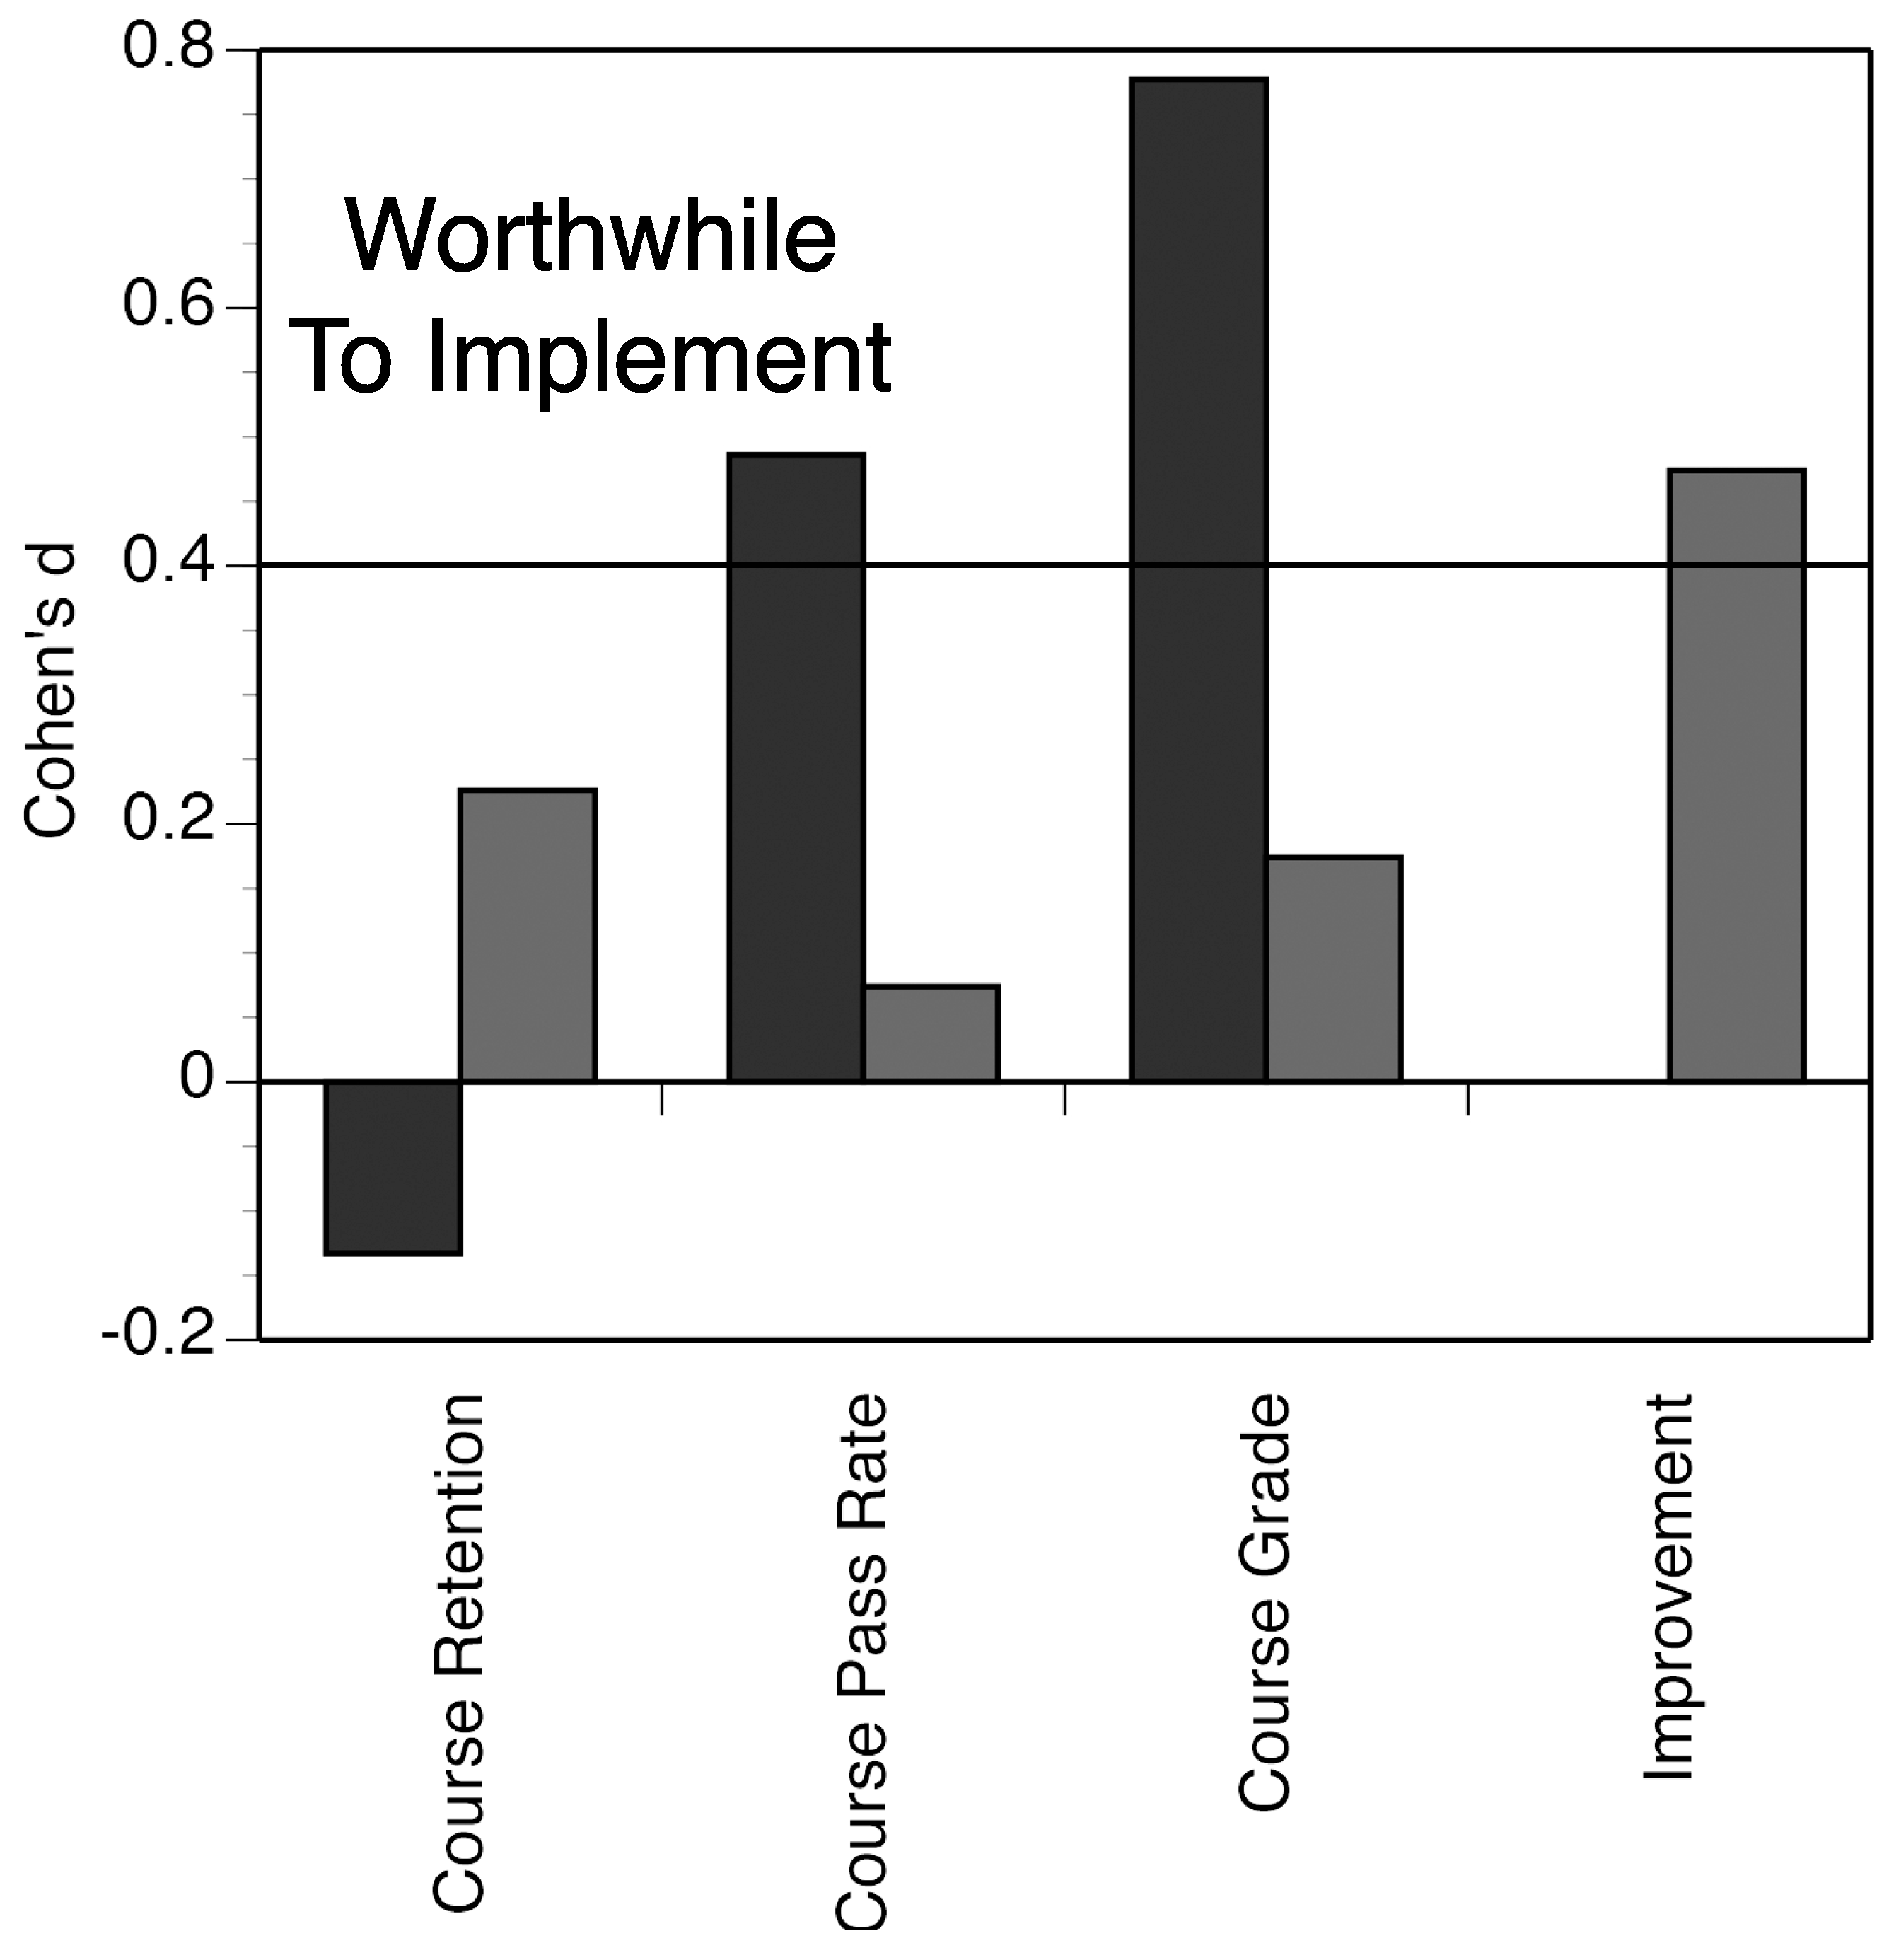
  • An improvement in post-course versus pre-course evaluation was recorded at a level exceeding the worthwhile intervention threshold. The magnitude of this effect was consistent no matter how many SI sessions were attended.
  • For an outlier instructor, the course pass rate and course grade were significantly increased by SI with a medium to large effect noted. The more SI sessions attended by students, the greater the impact on these variables.
  • For all other instructors, a non-significant increase in course retention and course grade was observed, which slightly increased with SI attendance.

Author Contributions

Conceptualization, J.D.L.C.H. and K.J.T.; methodology, J.D.L.C.H.; validation, J.D.L.C.H.; formal analysis, J.D.L.C.H.; investigation, J.D.L.C.H.; resources, K.J.T.; data curation, K.J.T.; writing—original draft preparation, K.J.T., J.D.L.C.H. and J.C.K.; writing—review and editing, M.E.B.; visualization, K.J.T.; supervision, K.J.T.; project administration, K.J.T.; funding acquisition, K.J.T. All authors have read and agreed to the published version of the manuscript.

Funding

This research was funded by the US Department of Education: P031S190304.

Institutional Review Board Statement

Not applicable.

Informed Consent Statement

Not applicable.

Data Availability Statement

The data sources used in this study were institutional records, and our university’s Institutional Review Board authorized this study on the basis of data anonymity, as student data is protected by the US FERPA law. Deidentified data that support the findings of the paper are not publicly available but can be shared by the submission team with the journal if necessary.

Acknowledgments

Tano Trevino’s support (TAMIU ARC grant) is greatly appreciated.

Conflicts of Interest

The authors declare no potential conflicts of interest with respect to the research, authorship, and/or publication of this study.

References

  1. Bowles, T. J., McCoy, A. C., & Bates, S. C. (2008). The effect of supplemental instruction on timely graduation. College Student Journal, 42, 853–859. [Google Scholar]
  2. Bowman, N. S., Preschel, S., & Martinez, D. (2023). Does Supplemental Instruction improve grades and retention? A propensity score analysis approach. The Journal of Experimental Education, 91(2), 205–229. [Google Scholar] [CrossRef]
  3. Burkholder, E., Salehi, S., & Wieman, C. E. (2021). Mixed results from a multiple regression analysis of supplemental instruction courses in introductory physics. PLoS ONE, 16(4), e0249086. [Google Scholar] [CrossRef]
  4. Cheng, D., & Walters, M. (2009). Peer-assisted learning in mathematics: An observational study of student success. Journal of Peer Learning, 2, 23–39. [Google Scholar]
  5. Cohen, J. (1988). Statistical power analysis for the behavioral sciences. Routledge. [Google Scholar]
  6. Congos, D., & Mack, A. (2005). Supplemental instruction’s impact in two freshman chemistry classes: Research, modes of operation, and anecdotes. Research & Teaching in Developmental Education, 21(2), 43–64. [Google Scholar]
  7. Dawson, P., van der Meer, J., Skalicky, J., & Cowley, K. (2014). On the effectiveness of Supplemental Instruction: A systematic review of Supplemental Instruction and Peer-Assisted Study Sessions literature between 2001 and 2010. Review of Educational Research, 84(4), 609–639. [Google Scholar] [CrossRef]
  8. Deom, G. (2023). Distance based matching program assessment tool [computer code]. Available online: https://github.com/iu-ia-research-analytics/distance-based-matching-program-assessment-tool/blob/main/Matching_Application.R (accessed on 14 November 2023).
  9. Dettmann, E., Becker, C., & Schmeißer, C. (2011). Distance functions for matching in small samples. Computational Statistics and Data Analysis, 55(5), 1942–1960. [Google Scholar] [CrossRef]
  10. D’Orazio, M. (2021). Distances with mixed type variables some modified Gower’s coefficients. arXiv, arXiv:2101.02481. [Google Scholar] [CrossRef]
  11. Doubleday, K. F., & Townsend, S. A. (2018). Supplemental Instruction as a resource for graduate student pedagogical development. Yearbook of the Association of Pacific Coast Geographers, 80, 134–156. [Google Scholar] [CrossRef]
  12. Fayowski, V., & MacMillan, P. D. (2008). An evaluation of the supplemental instruction programme in a first year calculus course. International Journal of Mathematical Education in Science and Technology, 39, 843–855. [Google Scholar] [CrossRef]
  13. Feldon, D. F., Timmerman, B. C., Stowe, K. A., & Showman, R. (2010). Translating expertise into effective instruction: The impacts of Cognitive Task Analysis (CTA) on lab report quality and student retention in the Biological Sciences. Journal of Research in Science Teaching, 47(10), 1165–1185. [Google Scholar] [CrossRef]
  14. Garcia, G. A., Núñez, A.-M., & Sansone, V. A. (2019). Toward a Multidimensional Conceptual Framework for Understanding “Servingness” in Hispanic-Serving Institutions: A Synthesis of the Research. Review of Educational Research, 89(5), 745–784. [Google Scholar] [CrossRef]
  15. Gasiewski, J. A., Eagan, M. K., Garcia, G. A., Hurtado, S., & Chang, M. J. (2012). From gatekeeping to engagement: A multicontextual, mixed method study of student academic engagement in introductory STEM courses. Research in Higher Education, 53(2), 229–261. [Google Scholar] [CrossRef]
  16. Grillo, M. C., & Leist, C. W. (2013). Academic support as a predictor of retention to graduation: New insights on the role of tutoring, learning assistance, and supplemental instruction. Journal of College Student Retention: Research, Theory & Practice, 15(3), 387–408. [Google Scholar] [CrossRef]
  17. Guarcello, M. A., Levine, R. A., Beemer, J., Frazee, J. P., Laumakis, M. A., & Schellenberg, S. A. (2017). Balancing student success: Assessing Supplemental Instruction through coarsened exact matching. Technology, Knowledge and Learning, 22, 335–352. [Google Scholar] [CrossRef]
  18. Hattie, J. (2009). Visible learning: A synthesis of 800+ meta-analyses on achievement. Routledge. [Google Scholar]
  19. Hensen, K. A., & Shelley, M. C. (2003). The impact of supplemental instruction: Results from a large, public, Midwestern university. Journal of College Student Development, 44, 250–259. [Google Scholar] [CrossRef]
  20. Ho, D. E., Imai, K., King, G., & Stuart, E. A. (2011). MatchIt: Nonparametric preprocessing for parametric causal inference. Journal of Statistical Software, 42, 8. [Google Scholar] [CrossRef]
  21. Iacus, S. M., King, G., & Porro, G. (2012). Causal inference without balance checking: Coarsened exact matching. Political Analysis, 20, 1–24. [Google Scholar] [CrossRef]
  22. Kalsbeek, D. H. (2013). Framing retention for institutional improvement: A 4 Ps framework. In D. H. Kalsbeek (Ed.), Reframing retention strategy for institutional improvement (pp. 5–14). New Directions for Higher Education, no. 161. Jossey-Bass. [Google Scholar] [CrossRef]
  23. Koch, A. K. (2017). It’s about the gateway courses: Defining and contextualizing the issue. In A. K. Koch (Ed.), Improving teaching, learning, equity, and success in gateway courses (pp. 11–17). New Directions for Higher Education, no. 180. Jossey-Bass. [Google Scholar] [CrossRef]
  24. Kochenour, E., Jolley, D., Kaup, J., Patrick, D., Roach, K., & Wenzler, L. (1997). Supplemental instruction: An effective component of student affairs programming. Journal of College Student Development, 38, 577–586. [Google Scholar]
  25. Mack, A. C. (2007). Differences in academic performance and self-regulated learning based on level of student participation in Supplemental Instruction [Doctoral Dissertation, University of Central Florida]. [Google Scholar]
  26. Malm, J., Bryngfors, L., & Fredriksson, J. (2018). Impact of Supplemental Instruction on dropout and graduation rates: An example from 5-year engineering programs. Journal of Peer Learning, 11(1), 76–88. [Google Scholar]
  27. Martin, D. C., & Arendale, D. R. (1992). Supplemental instruction: Improving first-year student success in high-risk courses [Monograph] (Monograph Series Number 7). The National Resource Center for The Freshman Year Experience, University of South Carolina. [Google Scholar]
  28. Mayhew, M. J., Rockenbach, A. N., Bowman, N. A., Seifert, T. A., Wolniak, G. C., Pascarella, E. T., & Terenzini, P. T. (2016). How college affects students (Vol. 3): 21st century evidence that higher education works. Jossey-Bass. [Google Scholar]
  29. McCarthy, A., Smuts, B., & Cosser, M. (1997). Assessing the effectiveness of supplemental instruction: A critique and a case study. Studies in Higher Education, 22, 221–231. [Google Scholar] [CrossRef]
  30. Ogden, P., Thompson, D., Russell, A., & Simons, C. (2003). Supplemental Instruction: Short and long-term impact. Journal of Developmental Education, 3(26), 2–8. [Google Scholar]
  31. Oja, M. (2012). Supplemental instruction improves grades but not persistence. College Student Journal, 46(2), 344–349. [Google Scholar]
  32. Paloyo, A., Rogan, S., & Siminski, P. (2016). The effect of supplemental instruction on academic performance: An encouragement design experiment. Economics of Education Review, 55, 57–69. [Google Scholar] [CrossRef]
  33. Ramirez, M. (1997). Supplemental Instruction: Long-term impact. Journal of Developmental Education, 1(21), 2–6. [Google Scholar]
  34. Rath, K. A., Peterfreund, A. R., Xenos, S. P., Bayliss, F., & Carnal, N. (2007). Supplemental instruction in Introductory Biology I: Enhancing the performance and retention of underrepresented minority students. CBE Life Sciences Education, 6(3), 203–216. [Google Scholar] [CrossRef]
  35. Wlodkowski, R. J., & Ginsberg, M. B. (2010). Teaching intensive and accelerated courses: Instruction that motivates learning. Jossey-Bass. [Google Scholar]
Figure 1. Cohen’s d for the difference in academic variables between SI and non-SI populations by instructor. Instructor A indicated in black and instructors B to E (combined) shown in gray. Cohen’s d = 0.4 represented by a line above which the SI intervention had a worthwhile impact.
Education 15 00371 g001
Figure 2. Cohen’s d for the difference in academic variables between SI and non-SI populations by frequency of SI attendance for instructor A. Black indicates the impact of one SI session attended and gray the effect of two or more SI sessions attended. Cohen’s d = 0.4, represented by a line above which SI intervention had a worthwhile impact.
Education 15 00371 g002
Table 1. Social science master’s gateway course supported by SI program.
SemesterStudents
Enrolled
SI
Attendants
Average Course
Grade
InstructorPre- and Post-Evaluation
Spring 20203692.438ANo
Summer 20201453.462BNo
Fall 202038142.257ANo
Spring 202133292.774ANo
Summer 202123163.136BYes
Fall 20213063.037CNo
Spring 20222563.542CNo
Summer 20222753.320DYes
Fall 20223143.379CYes
Spring 202334143.719EYes
Summer 202318103.778EYes
Table 2. Raw, unmatched social science student demographics.
Student PopulationsN% Hispanic% FemaleAverage AgeAverage SCHs Attempted
Total30968.961.830.97.86
Non-SI Students19171.256.529.97.81
SI Students11865.370.332.57.96
p-Value 0.27980.0135 *0.0214 *0.662
Note. Two-tailed t-test results on demographic variables between unmatched non-SI and SI student populations. Significance at p ≤ 0.05 indicated by a *.
Table 3. Matched social science student demographics.
Student PopulationsN% Hispanic% FemaleAverage AgeAverage SCHs Attempted
Total23664.870.331.87.96
Non-SI Students11864.470.331.17.96
SI Students11865.370.332.57.96
p-value 0.892110.26461
Note. Two-tailed t-test results on demographic variables between matched non-SI and SI student populations.
Table 4. Matched evaluation of SI program for social science students.
Academic VariablesNon-SI StudentsSI Studentsp ValueCohen’s d
Course Retention0.949 (n = 118)0.966 (n = 118)0.52020.0839
Course Pass Rate0.777 (n = 112)0.816 (n = 114)0.46900.0966
Course Grade2.946 (n = 112)3.202 (n = 114)0.05800.2542
Improvement0.489 (n = 47)0.717 (n = 46)0.0245 *0.4739
Note. Two-tailed t-test results on academic variables for matched non-SI and SI student populations. N equals the number of students considered in the respective population. Significance at p < 0.05 indicated by a *.
Table 5. Matched evaluation of SI program for students in instructors B to E sections.
Academic VariablesNumber of SI SessionsNon-SI StudentsSI Studentsp ValueCohen’s d
Course Retention10.940 (n = 84)0.955 (n = 22)0.7900.060
Course Retention2 or more0.940 (n = 84)1.000 (n = 44)--
Course Pass Rate10.937 (n = 79)1.000 (n = 21)--
Course Pass Rate2 or more0.937 (n = 79)0.932 (n = 44)0.918−0.020
Course Grade13.354 (n = 79)3.429 (n = 21)0.6030.101
Course Grade2 or more3.354 (n = 79)3.500 (n = 44)0.2640.199
Improvement10.489 (n = 47)0.714 (n = 14)0.1360.452
Improvement2 or more0.489 (n = 47)0.719 (n = 32)0.039 *0.472
Note. Two-tailed t-test results on academic variables for matched non-SI and SI student populations disaggregated by number of SI sessions attended. N equals the number of students considered in the respective population. Significance at p < 0.05 indicated by a *.
Disclaimer/Publisher’s Note: The statements, opinions and data contained in all publications are solely those of the individual author(s) and contributor(s) and not of MDPI and/or the editor(s). MDPI and/or the editor(s) disclaim responsibility for any injury to people or property resulting from any ideas, methods, instructions or products referred to in the content.

