1. Introduction
International stock markets are closely connected, along with the deep integration of the global economy and finance. Global turmoil, such financial crises and the COVID-19 pandemic, causes strong external shocks to stock markets, thereby accelerating risk spillover. Distinguishing cross-market independence from contagion effect is necessary to measure contagion across stock markets. A timeline of turmoil is divided into a stable period and a period of a crisis, and correlations in different periods are compared. If a moderate correlation exists between two stock markets during a period of stability, then the moderate correlation will experience a significant rise during a period of turmoil. This pair of cross-market correlations before and after a crisis are also referred to as a pair-wise correlation. A significant rise in pair-wise correlations among stock markets before and after a crisis is defined as a contagion. The absence of a significant rise in pair-wise cross-market correlations during a crisis period is defined as interdependence [
1]. Thus, contagion refers to a fundamental variation in cross-market connections after a significant external shock to one stock market. By contrast, cross-market independence means the occurrence of no fundamental changes in the linkages among stock markets.
Several channels allow risk spillover to transmit across stock markets. The potential contagion effects are explained by herd behavior, exposure to financial liberalization, as well as changes in macroeconomic fundamentals. The tight integration of the global economy and finance leads to the increasing shared factors between the world economy and Chinese economy, which causes the Chinese economy to be easily affected by strong external shocks. Such an effect can be reflected by the stock markets’ performance. In addition, shocks, such as trade and policy coordination, to one market probably change macroeconomic fundamentals in other markets. International trade effectively contributes to sustainable economic growth in China [
2]. In this scenario, depreciation or appreciation in domestic currency affects trade competitiveness and the value of foreign assets calculated in home currency. Additionally, the COVID-19 pandemic directly affected exports owing to contracted production capacity [
3]. All factors contributed to the changes in the macroeconomic fundamentals.
Macroeconomic fundamentals, capital market liquidity, and investor psychology can explain the co-movement of stock markets. Unexpected shock, panic, and fear caused by turmoil can change investors’ risk tolerance and trigger panic selling in response to external shocks [
2,
4]. Affected by their sentiments, investors’ decision-making behavior is not completely rational, which will eventually lead to an increase or decrease in returns on stock markets as a whole. Herd behavior caused by investors’ emotional contagion, risk aversion, and rational expectations can result in abnormal fluctuations in stock prices through the adjustment of asset portfolios and trigger the co-movement of stock markets. The liquidity shock caused by a crisis can cause correlations among asset prices to soar, thereby enabling stock markets to move in lockstep. The insufficiency of a country’s market liquidity triggered by a crisis allows financial intermediaries to liquidate assets in other countries, leading to contracted market liquidity in the countries that are financially closely associated with the country where the crisis originated and triggering large-scale capital flight in the affected countries. Investors’ sentiments of fear and uncertainty caused by the pandemic may be an effective transmission channel of the effect of stock-market returns, whereas capital flows are an effective medium for disseminating investors’ attitudes or beliefs across countries during a crisis [
5,
6].
Global crises have caused economic disruption, economic losses, and fluctuations in financial markets. Recently, the COVID-19 pandemic has threatened the market’s equilibrium. Many countries implemented partial or full lockdown as well as social-distancing measures, resulting in the disruption of economic activities [
7]. According to the World Bank’s conservative estimation of economic cost, the global economy contracted by 4.3% in 2020, a setback equivalent to that caused by the two world wars and the Great Depression [
8]. Owing to the growing fear of the social and economic impacts of the COVID-19 pandemic, financial markets have plunged [
9]. On February 24, 2020, the S&P 500 index of American stocks experienced a 3.4% plunge, the biggest one-day fall ever in the recent two years [
10]. Ali et al. (2020) showed that financial markets across the world have increasingly suffered as the COVID-19 pandemic spread from China to Europe and further into the US [
11]. De la Fuente-Mella et al. (2021) pointed out that the number of COVID-19 cases impacted domestic economies owing to the implementation of lockdown policies, which can seriously decrease consumption and stop production [
12]. Such suspended productive activities induced business losses, unemployment, pay cuts, or furloughs, thereby affecting consumer demand and confidence [
13]. Therefore, during the COVID-19 pandemic, government interventions can help reduce investors’ fears caused by COVID-19, thereby mitigating the negative impact of the COVID-19 pandemic on stocks [
14].
The novelty of our analysis is that it conducts a comparison of DCCs during the COVID-19 pandemic and 2008 global financial crisis, and our study focuses on the co-movement between developed markets and emerging markets. Compared with the correlations during the financial crisis, the linkages during the COVID-19 pandemic across markets may be larger. In addition, the dynamic increase in the pair-wise cross-market correlations proves the existence of contagion. Therefore, our analysis determines the dynamic nature of the correlations. Based on the DCC–MGARCH model, we observe that the calculated dynamic correlations and parameter estimations are unbiased despite the heteroskedasticity in the data. This study expands investigations on the effect of unexpected events and catastrophes on financial markets.
This study aims to investigate the existence of contagion effects between the stock markets of China and the United States during global-crisis periods and determine the direction of the contagion when the external catastrophic shock affects the development of the economy of the Chinese entity and changes its macroeconomic fundamentals. The research findings can provide useful suggestions to authorities on market regulations as well as to investors on risk diversification. This paper is organized as follows.
Section 2 presents the literature review, including a brief introduction of the research area.
Section 3 provides the DCC–MGARCH methodology conducted in this work, and
Section 4 introduces the data sources and sample used in this research.
Section 5,
Section 6 and
Section 7 present the main results, robustness test and conclusions.
2. Literature Review
Many studies have been conducted on the significant economic impacts of previous catastrophes and crises. Siu and Wong (2004) claimed that the SARS outbreak, as an unexpected negative shock in 2003, severely affected short-term consumer spending and services concerning tourism and air travel in the export sector in Hong Kong [
15]. The labor market in Hong Kong was weakened because of the decreased domestic consumption and tourist spending. Economic costs derived from SARS mortality have been estimated at USD 3–10 million per case, compared to the estimated national expenditures per person of USD 5600 in 2003 for cancer care, whereas China suffered losses of USD 12.3–28.4 billion with a 1% drop in GDP [
16]. Goodell (2020) showed that the COVID-19 pandemic has led to economic destruction, with a
$2.2 trillion bailout package in the US compared to the
$750 billion package for the global financial crisis [
7].
Stock markets are interdependent and have volatility-spillover effects. Morales and Andreosso-O’ Callaghan (2012) found that the US and Asian stock markets are highly interdependent, and shocks from the US stock markets strongly affect Asian markets via the underlying fundamentals that make such economies vulnerable [
17]. Syllignakis and Kouretas (2011) evaluated the variations in the conditional correlations of the weekly index returns selected from seven emerging economies in Central and Eastern Europe. They found that the US, German, and Russian stock markets and the Central and Eastern Europe (CEE) stock markets were highly interdependent, especially since 2004 when the CEE countries became part of the European Union (EU) [
18]. He et al. (2020) analyzed differences in mean returns of the domestic and foreign timeline and found bidirectional spillover effects among Asian countries and European and American countries [
4]. Jebran et al. (2017) explored the volatility-spillover effect among five emerging markets in Asia before and after the 2007 financial crisis. They found that during the financial crisis, bidirectional volatility spillover was present between stock markets because of integrated financial markets [
19].
Scholars have applied different empirical models to investigate the contagion effects across markets. Engle (2002) proposed dynamic-conditional-correlation (DCC) models, through which sensible and effective results can be obtained to explore contagion effects [
20]. Bai et al. (2020), by employing the generalized autoregressive conditional heteroskedasticity GARCH–MIDAS model, examined how the COVID-19 pandemic affects stock-market movements for the US, the UK, China, and Japan. They found that the pandemic significantly caused permanent volatility in these stock markets with the exception of China’s stock market [
21]. Claeys and Vasicek (2014) applied a VAR model to measure correlation across 16 EU sovereign bond markets, whereas Samitas et al. (2020) used a DCC model to examine pair-wise correlations among CDS, sovereign bonds, and the stock index [
22,
23]. Chiang et al. (2007) employed the DCC model to study contagion effects during phases of the Asian crisis [
24]. Rodriguez (2007) explored the financial contagion by using the switching-parameter Copulas model [
25].
3. Empirical Methodology
Engle (2002) proposed the multivariate autoregressive conditional heteroskedasticity model to estimate the DCC, which relies on the DCC decomposition of the conditional variance–covariance matrix,
[
20]. Assuming that the return series of stock markets follows normal distribution with zero mean and conditional variance–covariance matrix,
, the statistical specification of the DCC model can be written as:
where
means new innovations conditional on sets of information series,
, available up to
t − 1 time; and
is the vector of stock-market returns.
In the DCC model,
, which is the conditional variance–covariance matrix, takes the following form:
where
, the conditional correlation matrix of
, is time-dependent;
is a vector of standardized residuals; and
is a diagonal matrix of conditional standard deviations. The conditional volatility of the returns on stock index are calculated by using the univariate GARCH model with
on the diagonal
i (
i = 1, 2, 3, 4, 5, …, m).
are conditional standard deviations of m univariate GARCH models, where
, and
.
For a GARCH (
p,
q) process, DCC matrix
and covariance matrix
are specified below:
where
denotes standardized residuals, and
is the unconditional correlation matrix. Both
are non-negative scalars, and
ensures that the process is stationary.
The off-diagonal elements in matrix
are the conditional correlations between markets
i and
j, described as the following form:
On the basis of the multivariate distribution assumption, Boffelli and Urga (2016) gave different log-likelihood functions of the estimator [
26]. Under the assumption of errors following a multivariate normal distribution, the Gaussian log-likelihood function takes the form of Equation (5), whereas given that errors follow the Student’s distribution, the Student’s log-likelihood function takes the following form (6):
If the two-step estimation is chosen, then the Gaussian log-likelihood function and Student’s log-likelihood function can be decomposed into the univariate part, including mean and variance equations, as well as the dynamic correlation part. Under the assumption of estimator of , which is inefficient but consistent, being the identity matrix, the first step of estimation depends on the log-likelihood function, , where sets of parameters, , consist of the univariate GARCH parameters. The second estimation step is based on the log-likelihood function, , where sets of parameters, , comprise the time-varying correlation parameters.
4. Data Sources and Sample
To explore the contagion effect between Chinese and American stock markets, Standard & Poor’s 500 Index (S&P 500), Hang Seng Index (HKHIS), and Shanghai Composite Index (SSEC) were selected as sample data. The daily closing prices of these markets were collected from the website portal,
https://www.investing.com/ (accessed on 23 February 2022), covering the periods from 1 January 2005 to 31 November 2008 and from 1 January 2017 to 31 November 2020. Our data are only until November 31, 2020, because our analysis focuses only on short-term contagion effects. Besides, to compare the DCCs during the 2008 financial crisis with those during the COVID-19 pandemic, the window length of the data must be relatively consistent. Owing to differences in national holidays, all data were preconditioned. In addition, the event dates were defined as 4 April 2008, when the subprime crisis occurred in the US, and 20 January 2020, when the news on COVID-19 was released in China. All closing-price series were nonstationary (see
Table 1), so the closing-price series were transformed into return series of these selected stock markets, which are computed by
, where
is the closing price at time t. Instead, stock-index returns were stationary processes (see
Table 1).
5. Empirical Results
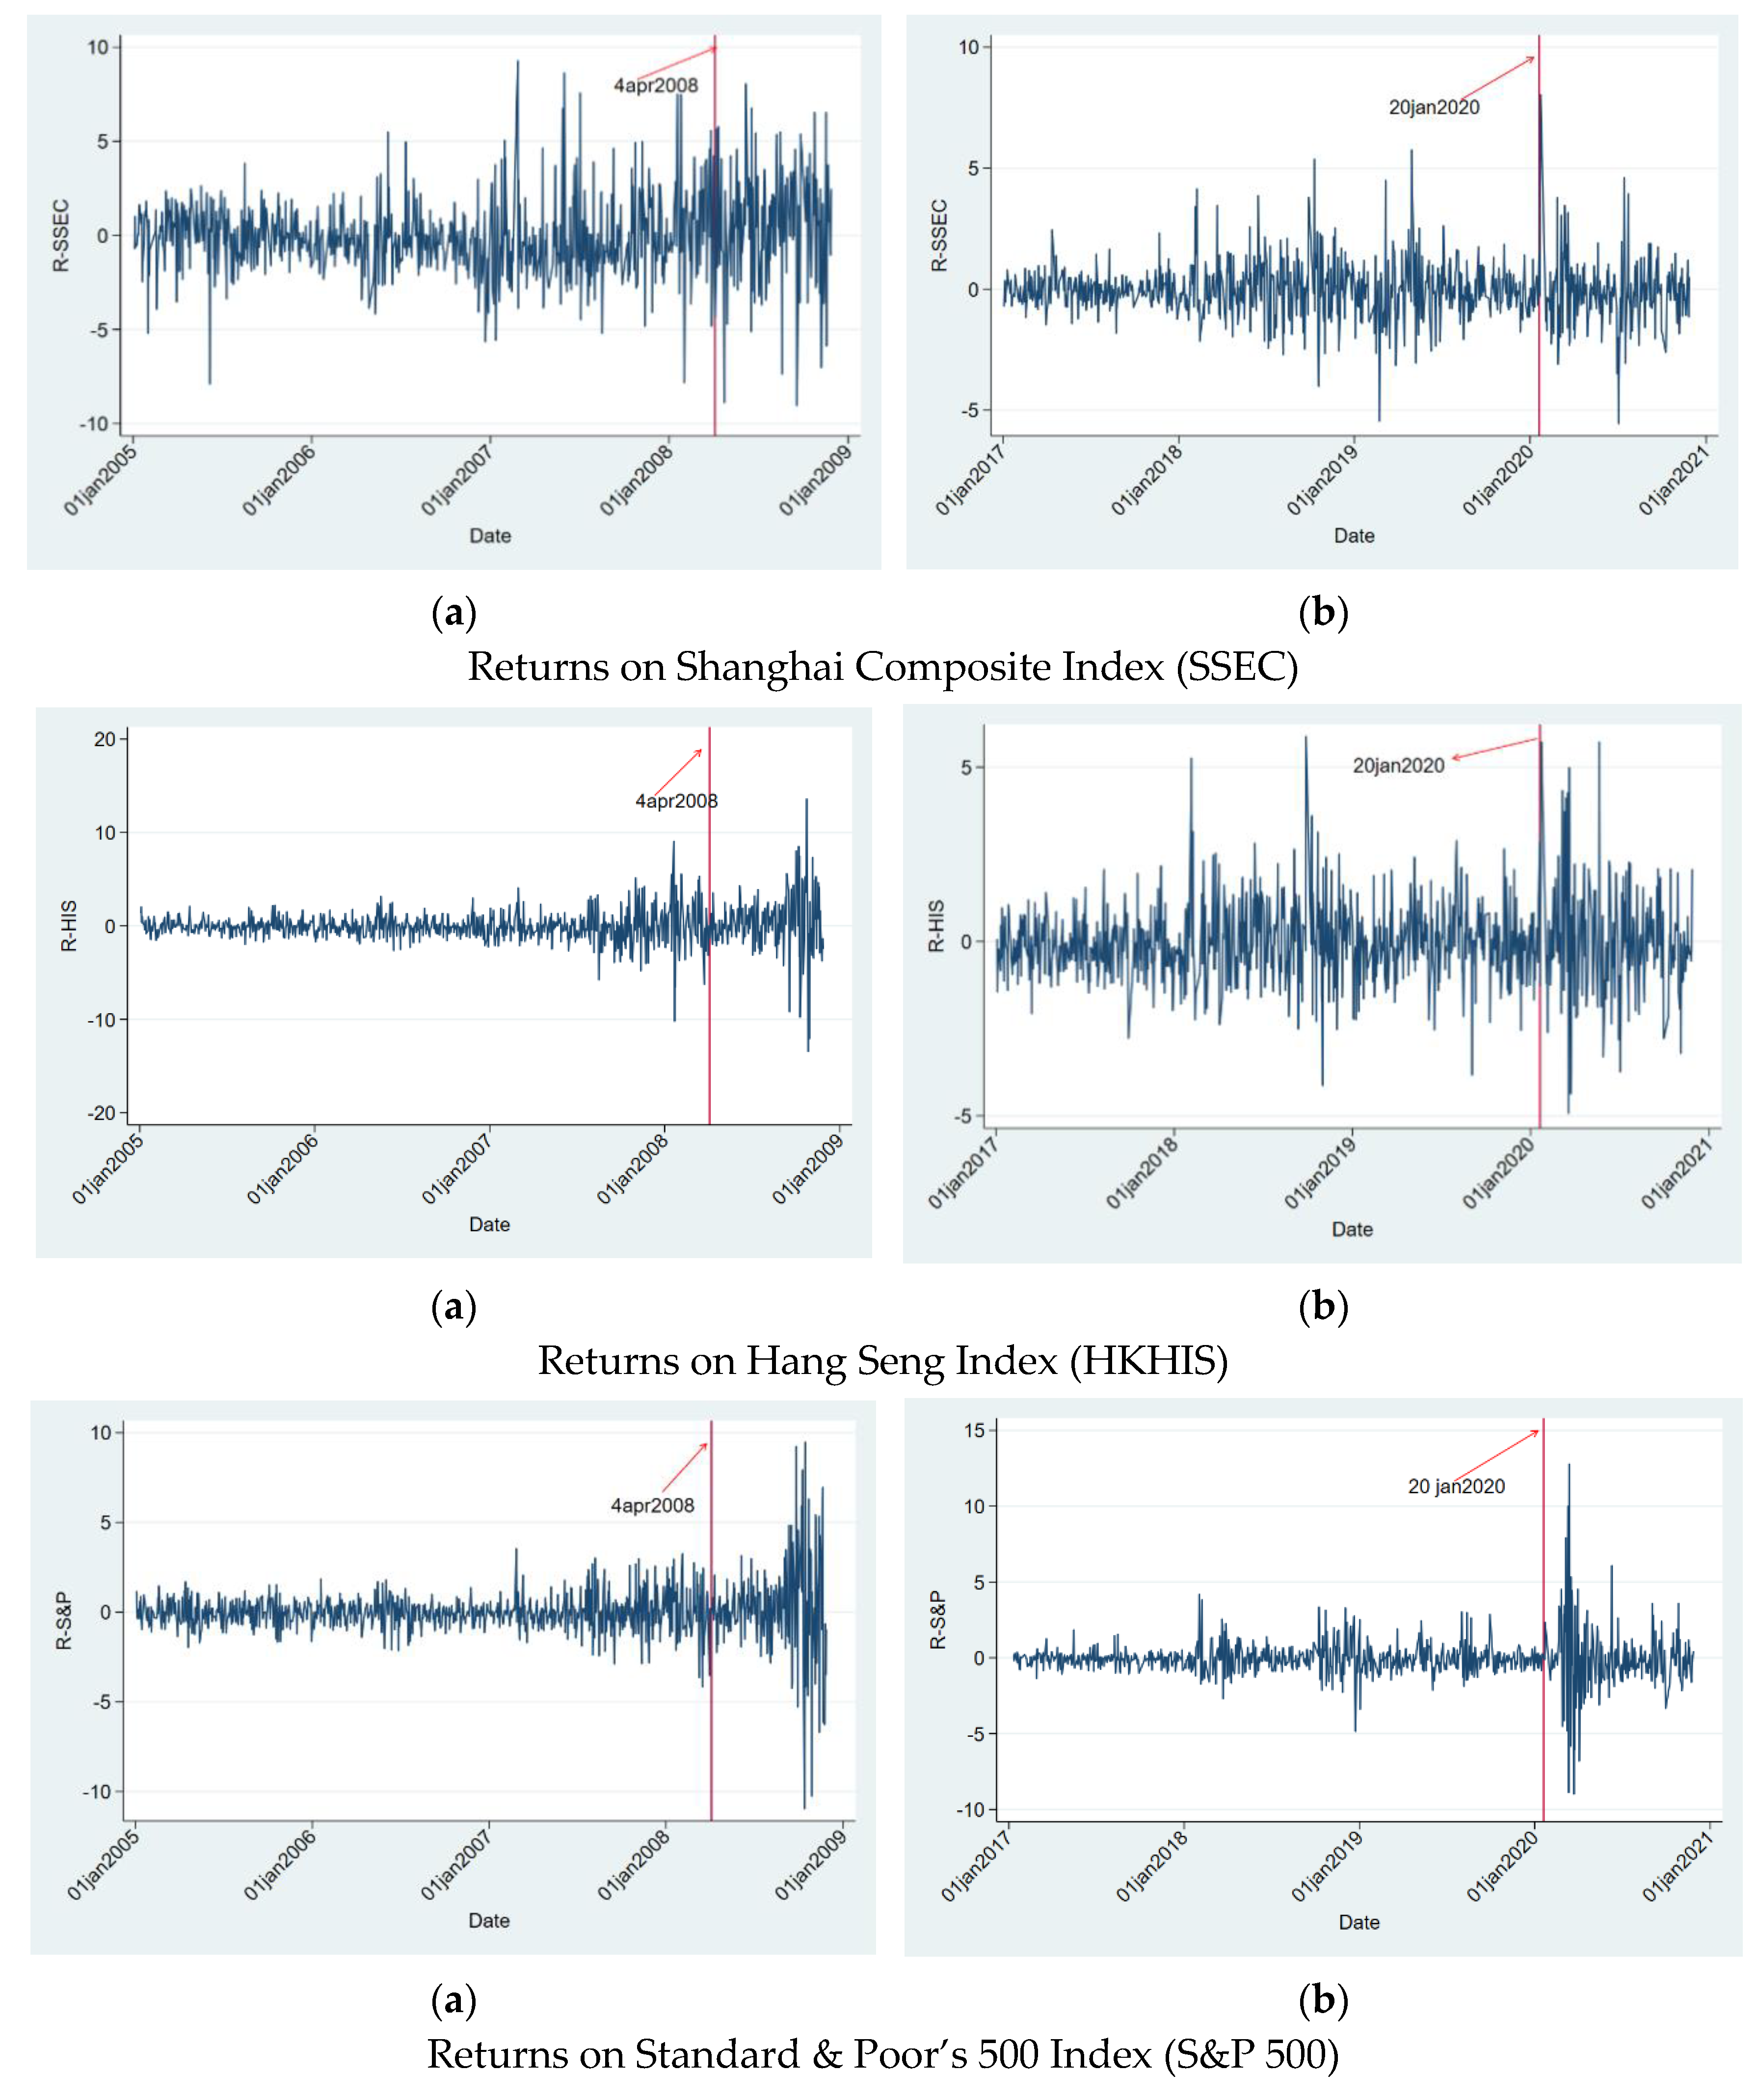
Figure 1 shows a substantial increase of volatility in the time sequences of stock returns on S&P 500, HKHIS, and SSEI indices in correspondence to the outbreak of a crisis. All return series that presented volatility clustering experienced the highest volatility during the period of crisis. For the subprime crisis in 2008, HKHIS and S&P 500 Index experienced a larger fluctuation range after the crisis than before the crisis. However, large changes were observed in SSEC for the pre-crisis and post-crisis periods. HKHIS and SSEC significantly fluctuated before and after the COVID-19 pandemic, whereas S&P 500 Index experienced more volatility in the post-pandemic period than in the pre-pandemic period. Overall, return volatility caused by financial crisis was higher than that caused by the COVID-19 pandemic.
Table 2 displays the statistically significant values of Jarque–Bera, which may be indicative of non-normal distribution. Skewness is more than zero, whereas kurtosis is more than three. The standard deviations of all return series are larger in the periods of both financial crisis and COVID-19 crisis than in the pre-crisis period; thus, return volatility is intensified by crisis events. Therefore, the descriptive statistics before and after the crisis suggest leptokurtosis, fat tail, volatility clustering, as well as non-normal distribution.
The conditional distribution of the financial time series displays characteristics of time-variation, skewness, kurtosis, volatility clustering, and fat tails. The GARCH-t model can effectively catch the volatility of return series because t distribution can accurately describe features of fat-tail distribution, whereas the GARCH model properly shows qualities of financial time series. Estimating the univariate GARCH model is the first step. The fitted GARCH (1,1)-t model is correctly specified until the absence of autoregressive conditional heteroscedasticity in standardized residuals by conducting the LM test and failing to reject its null hypothesis of no ARCH effects. In the second step, the DCC–GARCH (1,1)-t model estimates conditional volatilities and time-varying conditional correlations.
Table 3 and
Table 4 provide important information about the DCC–MGARCH (1,1)-t model. The mean, corresponding to
, and conditional variance of return series, represented by parameters
,
, and
, are obtained from the VAR model and univariate GARCH models. Except for estimates
, all estimators of
and
are statistically significant at the 1% level, confirming the time-variant variance and covariance process. Although
indicates short-run persistence,
refers to long-run persistence. Moreover, there is
for all return series to ensure the stationary process. The DCC in the DCC–GARCH (1,1)-t model reported in
Table 3 offers clues to the contagion effect of the paired financial markets.
suggest that correlations are highly persistent, showing that the covariance matrix
highly hinges on the lagged matrix
. In
Table 3 and
Table 4,
are positive and all sums of
are less than one, which means the process is strictly stationary.
The time-variant conditional correlation for all stock indexes constantly fluctuates before and after the financial crisis, but it tends to be larger during the period of crisis than the pre-crisis period (see
Figure 2). The 2008 financial crisis significantly intensified the correlation estimates between HKHIS and SSEC, rising from 0.26 before the crisis to 0.56 after the crisis (see
Table 3). These results indicate that stock markets were significantly affected by the financial crisis. Moreover,
Figure 2 shows that the conditional correlation between HKHIS and S&P 500 2 heightened after the crisis. Although the value of pre-crisis correlation is only 0.03, post-crisis correlation reaches 0.38 (see
Table 3). This result means that the shocks intensified stepwise with the worsening subprime crisis. The DCC estimates between S&P 500 and SSEC approximate to zero, as shown in
Figure 2. However, after the outbreak of the financial crisis, these estimates increase above 0.106. All DCC estimates are significant at the 1% level (see
Table 3). A statistically significant contagion effect exists between HKHIS and S&P 500 and between HKHIS and SSEC. Therefore, to some extent, the shock caused by the subprime crisis may be partly transmitted from the Hong Kong stock market to the inland stock market, thus increasing the fluctuations in the inland stock market.
Compared with the DCCs for the financial crisis, all time-varying conditional correlations for the COVID-19 pandemic are large (see
Figure 2). Although correlations between HKHIS and SSEC preserve the value of more than 0.62 during the whole period, correlations between SSEC and S&P 500 as well as correlations between HKHIS and S&P 500 rise from 0.159 and 0.307 to 0.278 and 0.499, respectively. All DCC estimates are statistically significant at the 1% level, implying that the paired correlation is strong (see
Table 4). The results in
Figure 2 and
Table 3 and
Table 4 accurately imply the existence of contagion effects across stock markets, whereas HKHIS and SSEC return indices are interdependent. Volatility caused by crisis events leads to more fluctuation in the inland stock market via the Hong Kong stock market.
Table 5 shows all the descriptive statistics of the DCCs calculated by the DCC–GARCH (1,1)-t model for the pre-periods and post-periods of the financial crisis and COVID-19 pandemic to support the changes and whole trend in the DCCs of S&P 500, HKHIS, and SSEC.
6. Robustness Test
Based on the DCC-MGRACH (1,1) model, the optimal lags are one for VAR models before shocks and directly after the shocks. The estimates are displayed as follows:
During the financial crisis:
During the COVID-19 pandemic:
All the eigenvalues are inside the unit circle. Therefore, VAR satisfies the stability condition.
Under the hypothesis of stock-market efficiency, institutional investors are more sensitive to news than individual investors because well-trained institutional investors not only have superior resources but can also benefit from economies of scale in acquiring and processing new information [
26]. Hence, institutional investors can quickly adjust their investment decisions in response to news, because their investment strategies are significantly affected by new information. For financial crisis, there is the unidirectional causality from S&P 500 return movement to SSEC return movement, whereas movement in SSEC return unidirectionally causes S&P 500 return movement for COVID-19 pandemic (see
Table 6). In conclusion, the news spreading from the US market to the Chinese market was relatively efficient in 2008, but the information released from the Chinese market held less power in 2020. Overall, the results of the Granger test from
Table 6 confirmed the findings obtained from the DCC–GARCH-t model.
7. Conclusions, Discussion, Limitations and Future Research
This paper illustrated the contagion effects of global turmoil on the performance of major stock markets. Owing to the high degree of globalization and intensively integrated value chain, investors’ pessimistic sentiment caused by strong external shocks and uncertainty in international trade and finance leads to changes in macroeconomic fundamentals. Moreover, such sentiments play important roles in the transmission of fear during global crises. The main results indicate that significant negative shocks have an adverse impact on the performance of stock-market indices. In addition, dynamic conditional correlations between returns on SSEC and S&P 500 as well as between returns on HKHIS and S&P 500 significantly increase from the pre-crisis phrase to directly after the crisis for both the financial crisis and COVID-19 pandemic, implying contagion effects across stock markets. However, a smaller increase in the DCCs between HKHIS and SSEC returns suggests they are interdependent during the period of the COVID-19 pandemic. Finally, the Granger test confirms the existence of contagion effects and their directions.
The results of the DCC–MGARCH model show the existence of contagion between the Chinese and US stock markets owing to the significant increment in the stock-market correlation after the outbreak of a destructive crisis, whereas violent fluctuations are present in the stock-market connection during a period of stability. Our analysis confirms the findings of Yin et al. (2017), who showed that the financial crisis strengthened the connections among the global stock markets, and further shows a stepwise increase in the cross-market correlations [
27]. This finding means that cross-market correlations are time varying as a disastrous crisis evolves. Nonpharmaceutical interventions and timely and effective monetary and fiscal measures can reduce correlations among stock markets over time. However, the implementation of restrictions on commercial activities and social-distancing measures mainly contributes to the forceful reaction of the US stock markets to the COVID-19 pandemic [
28].
The results imply that investors, bankers, and financial analysts may need to set up different trading strategies to avoid losses, such as hedging risk. Overreaction to the pandemic causes investors to sell stocks and reduces possible financial losses before further deterioration of returns on investments. Hence, financial-market regulators could impose limitations on short selling or repurchase their own stock shares. On the basis of our analysis of the performance of stock-market indices, government officials and bank authorities should implement measures to help different sectors survive this difficult time, including fiscal stimulus (i.e., issuing new government bonds and subsidization) and monetary policy (i.e., interest-rate cuts) [
29]. Governments should impose safety measures, including the wearing of masks in public places, social distancing, and travel-ban rules, to minimize the transmission of the virus and to reduce the number of confirmed cases. Authorities must maintain functioning healthcare systems and economies, which allow firms to run well and produce earnings with certainty.
We encountered limitations in examining the performance of the stock indices. Owing to difficulties in collecting data, we may have overlooked many factors, including investors’ preferences and stock-market experiences and firms’ specific and individual characteristics, which can affect their returns. In other words, we did not explore the transmission channels in detail. We selected the sample stock indices arbitrarily, and the empirical results may be subject to sample-data-selection bias. In addition, the test results may be affected owing to the 10-month sample data. Finally, we focused only on short-term cross-market contagion effects and conducted our analysis from the perspective of financial crisis contagion.
This study contributes to future research, as we can analyze the transmission path of stock markets from the perspective of the effect of a crisis on a country’s actual economy and offer new insights into the impact of a crisis on the co-movement of stock markets. Moreover, studies on long-term cross-market co-movement can be conducted. The causes of financial contagion effects, such as herding behavior, rational expectations, risk aversion, and investors’ sentiments, can be further explored in response to disastrous crises.


