Article

A Novel Time-Series Transformation and Machine-Learning-Based Method for NTL Fraud Detection in Utility Companies

1
Department of Computing, School of Electrical Engineering and Computer Science, National University of Sciences and Technology (NUST), Islamabad 44000, Pakistan
2
Electrical Engineering Department, Ecole de Technologie Superieure, Montreal, QC H3C 1K3, Canada
3
Industrial Engineering Department, College of Engineering, University of Hail, Ha’il 81481, Saudi Arabia
4
Department of Analytics in the Digital Era, College of Business and Economics, United Arab Emirates University, Al Ain 15551, United Arab Emirates
*
Author to whom correspondence should be addressed.
Mathematics 2022, 10(11), 1878; https://doi.org/10.3390/math10111878
Submission received: 6 April 2022 / Revised: 22 May 2022 / Accepted: 24 May 2022 / Published: 30 May 2022

Abstract

:
Several approaches have been proposed to detect any malicious manipulation caused by electricity fraudsters. Some of the significant approaches are Machine Learning algorithms and data-based methods that have shown advantages compared to the traditional methods, and they are becoming predominant in recent years. In this study, a novel method is introduced to detect the fraudulent NTL loss in the smart grids in a two-stage detection process. In the first stage, the time-series readings are enriched by adding a new set of extracted features from the detection of sudden Jump patterns in the electricity consumption and the Autoregressive Integrated moving average (ARIMA). In the second stage, the distributed random forest (DRF) generates the learned model. The proposed model is applied to the public SGCC dataset, and the approach results have reported 98% accuracy and F1-score. Such results outperform the other recently reported state-of-the-art methods for NTL detection that are applied to the same SGCC dataset.

1. Introduction

Smart grid electricity losses are classified into two types: technical losses (TL) and non-technical losses (NTL). TLs result from the transportation of energy between the power station and the consumers, and it is consumed in the lines and transformers as various types of energy, such as heat [1]. Modifying and redesigning the grid components can help reduce the TL [2].
Utility companies put considerable efforts to detect fraudsters and stop the NTL in power grids. Smart meter tampering and reading alteration are the main causes of the non-technical losses considered as the major proportion of losses in most countries [3]. NTL’s can be reduced using several techniques that give very interesting results in identifying malicious consumers. Hence, it is more profitable to reduce NTLs before reducing TLs [4]. Most researchers categorize NTLs into two categories: 1—NTLs caused by technical manipulations such as altering the meters readings in order to record false consumption levels and bypassing the meter; 2—NTLs caused by human manipulations by encouraging corrupt and dishonest practices of power company employees [3].
NTL detection methods are classified into hardware-based and non-hardware-based methods. The hardware-based methods are based on the installation of smart equipment in specific locations of the grid in order to detect fraudsters [5,6]. The nonhardware-based methods mentioned in the research are either data-based, network-based, or hybrid methods. These methods appeared with the emergence of smart equipment, which enables the collection of different data concerning the users and their habits of consumption.
The non hardware-based NTL detection methods are 1—data-based methods; 2—network-based methods; and and 3—hybrid methods [7]. Network-based methods exploit the data acquired from the network through observer meters, user smart meters, as well as sensors installed at points in the power grid previously studied and are detailed in several review papers [7,8].
Four categories of the network-based methods are mentioned in the literature: a—Load Flow Approach [9,10]: An observer meter installed in a specific location of the grid, measures the consumed energy by the customers, and the measurement is compared to the customers’ smart meter readings, enabling the detection of the fraudsters; b—State Estimation Approach [6,11]: data from smart meters are utilized to monitor the grid; c—Sensor Network Approach [12,13]: Specialized sensors are installed at specific locations in the grid; d—Hybrid Methods: Hybrid methods [14,15]: a combination of data-oriented and network-based methods for NTL detection.
Data-based methods exploit the data collected through the smart meters over a period of time and manipulate them with the help of different algorithms used in machine learning to extract relevant information on the behavior of the users. This category represents the current trend judging by the number of papers published recently. The ML methods’ advantages are higher accuracy, better efficiency, less time consumption, and less labor required [7].
Machine learning techniques are categorized into unsupervised techniques and supervised techniques.
The unsupervised NTL methods exploit customer data without being labeled beforehand. The most used unsupervised methods in the literature are clustering [16,17], regression methods such as ARIMA [18], and statistical methods [12].
On the other hand, supervised methods use labeled data (e.g., Fraud, Non-fraud). These labels can come initially with the datasets or can be extracted from the architecture of the classification model itself (Neural Networks Deep learning).
The most popular supervised methods that have been tested include: Support Vector Machines, Artificial Neural Networks, Deep Neural Networks such as CNN (Convolutional Neural Networks), Optimum Path Forest (OPF), Decision Trees (DT), and Ensemble learning techniques (AdaBoost, NGBoost, Random Forest).
Our approach proposes a solution based on a supervised learning algorithm, namely, the Random Forest for classification, preceded by a feature extraction phase-based mainly on the detection of a sudden jump in the electricity consumption, and the autoregressive integrated moving average time series statistical analysis model predicting the future consumption of a user. Therefore, the review focus will be on the recent advances made in supervised learning techniques applied to the SGCC dataset and the extraction of the features for time series that best describe the fraud phenomenon.
Several recent studies based on machine learning algorithms have shown encouraging results in terms of fraud detection accuracy and precision, but these two factors are not always the decisive factors for the evaluation of the obtained results and must be confirmed by a set of performance metrics such as the recall, F1 score AUC, etc., in order to support their applicability in a real-world smart grid. The most used method for NTL is the Support Vector Machine (SVM) [9]. SVM was applied in [19,20] with an accuracy ranging from 0.86 to 0.98. The best results of the SVM have all been obtained with a small dataset having balanced labels [21], which is not the case with our SGCC dataset. Khan et al. [22] have applied Bayesian SVM on the SGCC dataset, where SVM classifies users as “honest” and “dishonest”. The classifier’s hyper-parameters tuning and learning accuracy improvement is achieved by a Bayesian optimization algorithm to reach an accuracy of 94.1% outperforming RF, LR, and SVM. Another simple ML method (Multi-layer perceptron) using features derived from the dataset time-series statistical and spectral analysis, has been tested in [23,24], but the results obtained in terms of accuracy never exceeded 87.17%. In what follows, we will present a few recent research papers used as a reference to our method that have used supervised ML algorithms, mainly applied on the SGCC dataset, as well as their approach to the classification process including the selection of features. It has to be noted that ML ensemble methods are the most promising algorithms today, with proven results in terms of accuracy, but their performance metrics have not always been followed.
In [25], Saddam H. et al. have proposed a new supervised machine-learning-based NTL detection method (CatBoost) and applied it to the SGCC dataset. The FRESH algorithm is used to extract and select the most important features from temporal, statistical, and spectral domains. An accuracy of 93.4% and precision of 95% were reached. Compared with other supervised methods such as extreme gradient boosting, extra trees classifier, random forest, and light gradient boosting, Adaboost models all range from 81% to 91% and the random forest’s accuracy is 87%. Their use of data class balancing in the first stage has added more credibility to their results, but the average 10-fold precision and recall were 93% and 92%. In the same series of studies, Hussain S. et al., in [26], presented a natural gradient descent ensemble-boosting (NGBoost) machine-learning framework for NTLs. The most relevant statistical, temporal, and spectral domain-based features were extracted using the time-series feature-extraction library (TSFEL) and whale optimization algorithm. The NGBoost algorithm classified the consumers into “Healthy” and “Theft”. The proposed framework achieved an accuracy of 93% and recall of 91%, and it has outperformed ML algorithms such as the random forest, CAT Boost Classifier, Ada Boost classifier, Decision tree classifier, and Gradient boosting classifier. What has been concluded previously applies to this study, where the F1 score is 90% and the recall is 91%, indicating that at least 9% of the electricity fraudsters can be undetected, which cannot be tolerated in utility companies with millions of users.
Another model applied to the SGCC dataset, based on the Extra Gradient Boosting (FA-XGBoost) has been presented in [21]. The VGG-16 (Visual Geometry Group) tool [27] extracts the Features, but its overhead impact was not highlighted in the study. Despite the fact that the recall has been improved to reach 97%, reducing the number of undetected fraudsters, the precision has reached only 93%, resulting in possible mistakes in the identification of fraudsters and might oblige the utility company to conduct physical verifications with their consumers. In the same study, state-of-the-art methods such as Support Vector Machine (SVM), Convolution Neural Network (CNN), and Logistic Regression (LR) are also tested for comparative analysis. The model accuracy was 95%.
Finally, a comprehensive study was conducted in [28] on the SGCC dataset, where various ML supervised algorithms such as Decision trees, ANN, deep ANN, and Adaboost were compared. The DANN outperformed the others with an accuracy of 93.04%. The obtained results cannot be trusted because of the overall poor performance measures results. From all that has been introduced, and especially in the field of the NTL detection with the recent use of ML methods, it appears that the feature extraction and selection phase is based on features extracted manually and selected using different selection methods that create additional load on the available resources and might have a negative impact on the performance of the classification model, reducing at least one of the performance metrics. Our method is direct and requires only a prior simple calculation phase of ARIMA and finite differences in order to create a new feature set ready to be exploited by the classification algorithm. The results prove that all performance metrics are excellent and vary between 98% and 99%. This study presents a data-based method based on the application of machine learning algorithms. A recently rising research domain is NTL detection because of the confirmed advantages compared to the traditional methods [7].
The authors have applied a supervised ML method, namely, the distributed random forest (DRF) algorithm, to a feature set extracted from the SGCC dataset (China’s State Grid Corporation dataset) in two stages. In the first stage, a Sudden Jump Usage Detection method detects the sudden change in the usual consumption of a consumer based on the differences in the consumption around the moving central reading of the sliding window, and the auto-regressive integrated moving average (ARIMA) time series analysis method that predicts the future consumption of a consumer based on his past consumption patterns. The outcome of both methods is fed as features in the new feature-set along with other statistical features to the second stage, which is the distributed random-forest ML algorithm that detects whether the consumers are fraudsters or honest. Therefore, the review focus will be on the recent advances made in supervised learning techniques and the extraction of the features for time series that best describe the fraud phenomenon.
The present paper is structured as follows: In Section 2, the methodology of the proposed method is explained. In Section 3, the authors present the experimental setup and the results and conclude with a discussion of the results in Section 4. Finally, the conclusion section finalizes the paper in Section 5.

2. Method

The proposed method (Figure 1) is a two-step features extraction approach that relies on the idea that when a fraud starts, a sudden jump in the average electricity consumption of the consumer is observed. The smart meter readings jump down suddenly to a new pattern of usage that is very low compared to its previous usage (see Figure 2), and if the difference in the usage is taken from a neighboring meter, then a sudden jump in the smart meter of the neighbor is observed (see Figure 3). During this step, the dataset was preprocessed to generate a set of features of each smart meter reading that are based on studying a window of two months of data, one month before (lag) and one month after (lead) each reading. Those readings were used to generate the finite delta differences as the first set of features. Moreover, studying the behavior of the moving average of the smart meter readings using statistically optimized moving average measures such as ARIMA, holt-winters, seasonality, and the consumption trend generated the second set of features. A final machine-learning step consisted of the application of the distributed Random Forest ensemble algorithm using the generated feature-set to build a prediction model for Non- fraudulent/fraudulent consumers.

2.1. Feature Engineering

The SGCC dataset was normalized between [0,1] using the min–max normalization technique in Equation (1):
N = O m i n ( O ) m a x ( O ) m i n ( O )
where O is the original feature value, N is the normalized value, and m a x (O) and m i n (O) are the maximum and the minimum values of O, respectively.
The newly engineered feature-set was prepared using a sliding window of lead and lag features, as explained in Section 2.1.1, and statistical features in Section 2.1.2.

2.1.1. Sudden Jump Detection in the Smart Meter Usage Using the Sum of Finite Differences

To detect the fraudulent cases, the proposed method identified the sudden jump behavior by creating a dataset that contains features for each meter reading within a sliding window of 65 readings, as shown in Figure 2 and Figure 3. The created feature set contains a set of calculated features that identify the behavior of the time series around each reading, such as the mean before the point and the mean after the point, the median before and after, the variance before and after 32 readings, and the finite differences for the points before and after. The problem becomes finding the maximum sum of differences between the lead and lag points for each sliding window central point, as per the Formula (2):
S u m o f F i n i t e D i f f e r e n c e s = m a x ( i = 1 N ( L i G i ) )
where N = 1 / 2 W i n d o w s i z e , L i is the ith Lead reading, and G i is the ith Lag reading.

2.1.2. ARIMA, Holt-Winters, and Other Smart Meter Readings Feature Extraction

A set of new statistical features of the time series dataset follows the extracted features from the sudden jump in consumption. The designed features are summarized and explained in Table 1. These features are the autoregressive integrated moving average (ARIMA), Holt-winters, trend, and seasonality after transforming the smart readings to a stationary time series (constant mean and standard deviation). The autoregressive integrated moving average (ARIMA) method performs the moving average forecasting using the previous meter readings that have the strongest correlation with the current reading value to enable more accurate forecasting.
Holt-winters is an exponential smoothing method that has the feature of neglecting irrelevant readings.

2.2. Machine Learning

The proposed distributed random forest machine learning approach is applied to the SGCC dataset to achieve the classification of the consumers as fraudulent or non-fraudulent smart meter readings, and the results are compared with the results of the state-of-the-art methods.

2.2.1. Hyper-Parameters Tuning

DRF optimization learning is performed to find the best possible combination of parameter values. The accuracy, recall, and specificity of each experiment are determined and documented for each experiment. Figure 4 shows the DRF hyper-parameter optimization algorithm. The stochastic gradient descent approach is used to obtain the combination of parameters that yields the best accuracy, recall, and sensitivity score.
It is important to emphasize on the simplicity of the used optimization technique, which is based on a random hyper-parameter optimization search [29]. After deciding on the search ranges for each of the parameters listed in Table 2.

2.2.2. Distributed Random Forest

The distributed random forest (DRF) is a strong ensemble bagging machine-learning approach that optimizes the learning process. Instead of using one decision tree as a weak learner, it combines multiple decision trees for classification. Each decision tree (weak learner) is applied to a subset of the dataset. Using an attribute selection indicator, e.g., Gain or Gini index, for each feature, the individual decision tree depends on the selected random sample. In DRF, extremely randomized trees are used after computing the splits, but instead of looking for the most discriminating thresholds, thresholds for each candidate feature are selected at random, and the best of these generated thresholds is chosen as the splitting rule. This enables a reduction in the model variance at the expense of a slight increase in the bias. Each tree votes and the most popular class is taken as the final selection. The DRF model’s final prediction results from taking the average prediction of the individual trees’ learned results, using a voting algorithm for all trees’ predictions, are combined to produce a final output, which makes such bagging techniques more robust and accurate compared to other individual machine learning algorithms (see Figure 5).
The DRF creates 50% fewer trees for binomial problems than the normal random forest. In our classification method, we have used the distributed version of random forest with the hyper-parameter settings in Table 3 obtained from the optimization steps in Section 2.2.1.
The distributed random forest is tested with the default settings that initially include 50 trees, then the experiment is repeated by setting the number of trees hyper-parameter to 100. Moreover, the stopping parameters are configured to avoid over-fitting using the early stopping settings. Three hyper-parameters are set as s t o p p i n g _ m e t r i c = A U C , which will be used to measure the model performance; s c o r e _ t r e e _ i n t e r v a l = 5 , which will measure the model performance after every 5 trees; and s t o p p i n g _ r o u n d s = 3 , which means the model will break the training after completing three scoring intervals.
After completing the optimal selection of the parameters, the DRF model was trained and tested on the transformed SGCC dataset.

3. Experimental Evaluation

The two-step classification process is performed on the SGCC dataset that contains electricity smart meter readings as explained below.

3.1. Materials

This work is applied to a publicly available dataset belonging to China’s State Grid Corporation (SGCC) [1]. It contains daily SM electricity consumption data for 1035 days starting from 1 January 2014 for 42,372 customers. Out of the 42,372 records, 3615 are marked as fraudulent consumers. The attributes in the dataset are Consumer Number, Fraudulent Flag (0 meaning non-fraudulent, 1 meaning fraudulent), usage value, and reporting time (15 min interval). The sample taken for the experiment comprises 7000 records from this dataset, where 520 are marked as fraudulent consumers while 6480 are normal consumers.

3.2. Performance Measures

The measures used in this work to measure the performance of the proposed method are detailed in Table 4.

4. Results and Discussion

The newly generated dataset with the moving window of lag and lead readings, ARIMA, Holt-Winters, and time-series properties are split into two subsets. One subset is for training, and the other subset is used for the validation and testing of the proposed method. Training, validation, and testing are performed by the DRF algorithm to generate the final classification model. The proposed method is implemented using the R language, and the libraries to reprocess and transform the dataset are ‘dplyr’ for facilitating the data manipulation challenges; ‘matrixStats’ for the statistical feature calculation; Forecast for ARIMA and Holt-Winters-related feature extraction; and ‘tidyverse’, ‘H 2 O’, and ‘ggplot2’ for the machine learning and data visualization. The time used to train the model is 25 min on a 32 GB PC with a core-I7 processor and GTX NVIDIA 12 GB Ram graphics card, and the correctly classified records achieve an accuracy of 0.98. and, 2% of the record were incorrectly classified. The obtained F1-score is 0.98. Moreover, the Matthew Correlation Coefficient (MCC) is 0.97. The final root-mean-square error is 0.02.

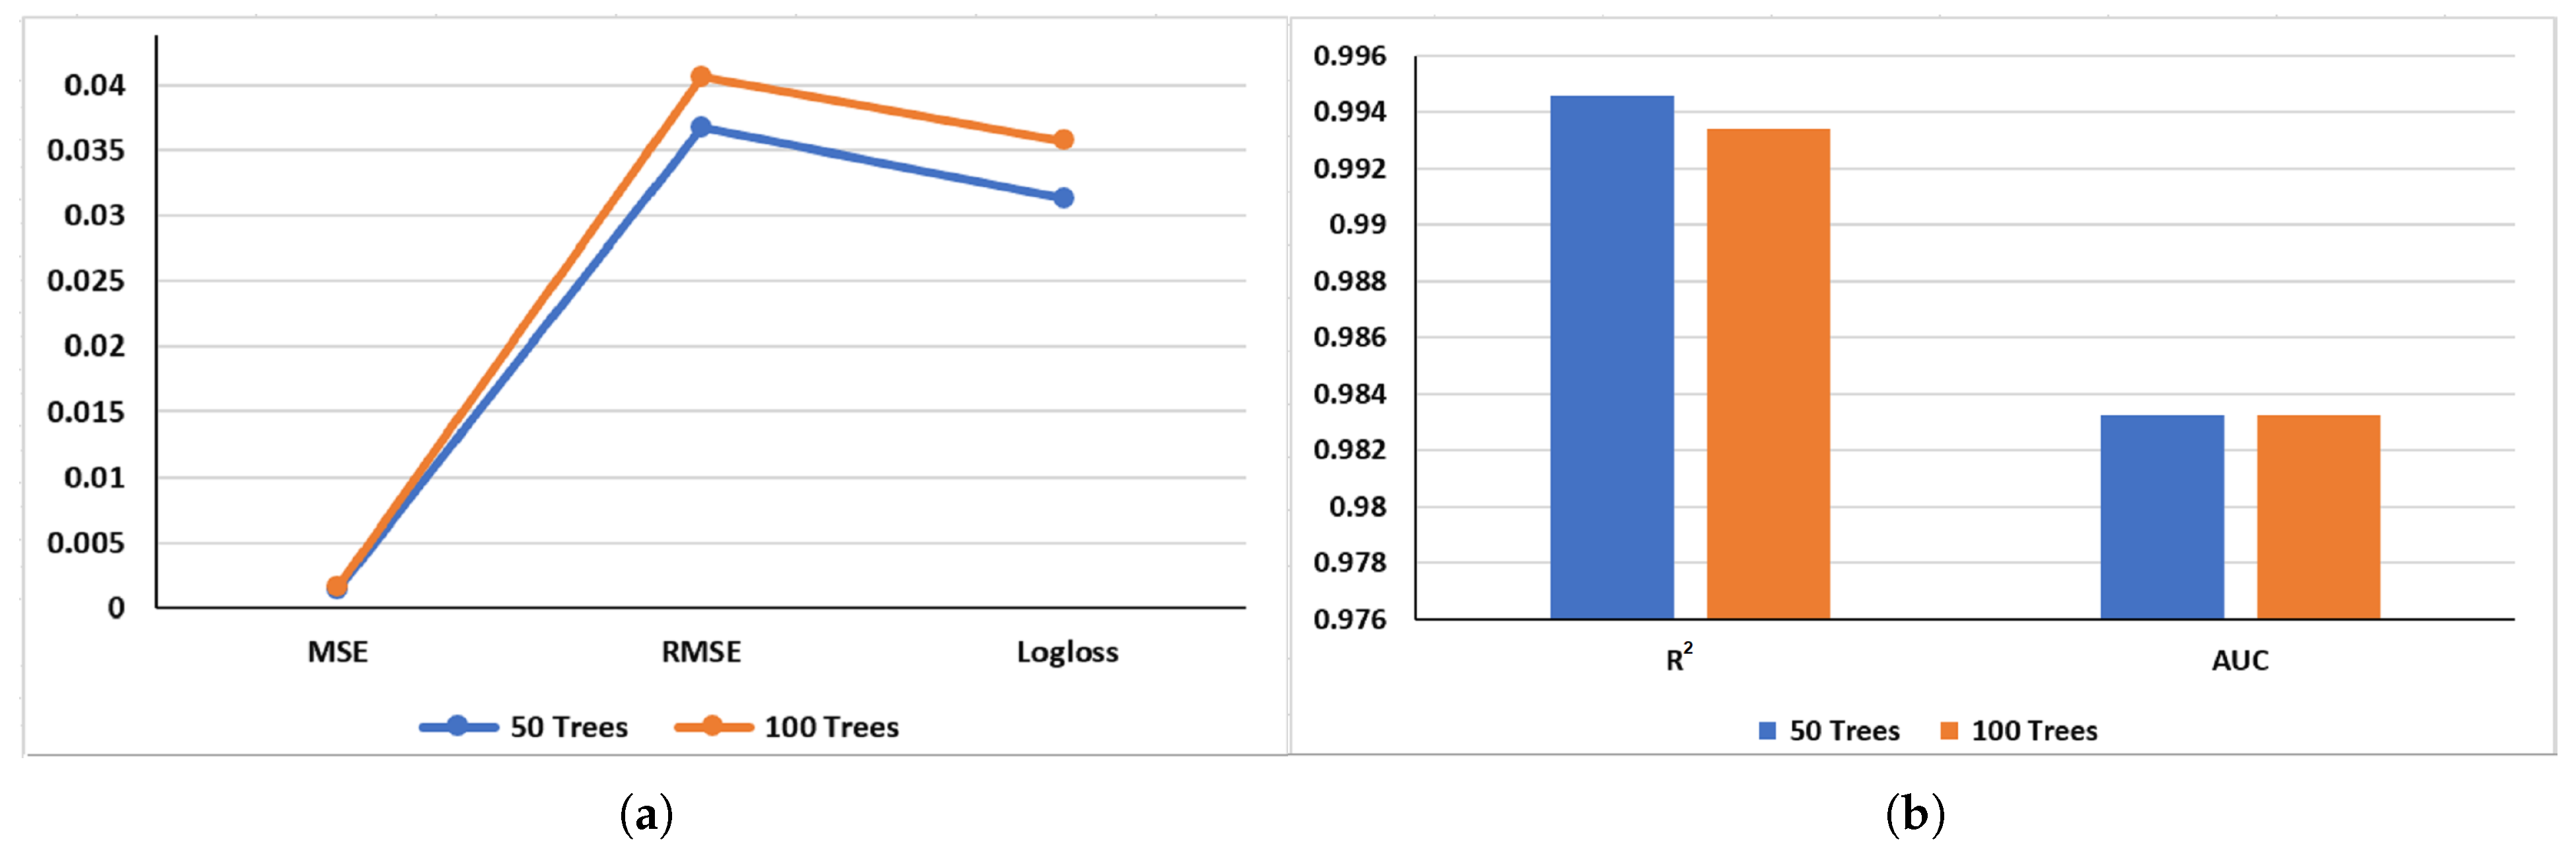
4.1. Impact of the Number of Trees

The distributed random forest machine learning algorithm implemented in the study experiments is initially used with the default parameters, where the number of trees is 50. A seed value defaults as constant to guarantee reproducibility. Then, a second model is created using the distributed random forest, where the number of trees is increased to 100. The results of the above two experiments are illustrated in Table 5.
The results of validating the two distributed random forest models’ findings reveal that having a larger number of trees in a forest might often raise its computational cost while providing no substantial performance benefit (Figure 6).
Varying the model’s number of trees during the training and validation phases from 50 to 100 trees has slightly increased the classification errors ( M S E , R M S E , c r o s s e n t r o p y / l o g l o s s ) and its performance metrics ( A U C , R 2 ) remain unchanged, which leads us to use 50 trees to build our final model. Figure 7 shows that the average and the median AUC asymptotically converge in the training and the validation phases of the model to 0.98 in both scenarios, regardless of the increase in the number of epochs, which confirms our choice.
The optimization behavior is impacted by the three parameters ‘stopping rounds’, ‘stopping metric’, and s t o p p i n g t o l e r a n c e , which are assigned the values 3, AUC, and 0.0005, respectively, implying that the optimization can be stopped in case the s t o p p i n g m e t r i c = A U C value is reduced and ‘stopping rounds’ = 3 consecutive times below the value of a ‘stopping tolerance’ > 0.0005. Hence, during the building of the model, the AUC kept increasing, and it is optimized perfectly despite the slight increase in the MSE, RMSE, and Logloss. Moreover, the increase in the number of trees from 50 to 100 has no significant impact on the model’s performance, as the AUC converges to 0.98 in both scenarios while the cross-entropy decreases significantly with the increase in the number of trees. As a result, the 50-tree DRF model can be suggested.

4.2. Computational Burden

The random forest algorithm can handle a significant number of input variables without any variable deletion. It gives estimates of what variables are important in the classification. It has an effective technique for assessing missing data and maintains accuracy when a large proportion of the data are missing. Random forests produce predictions by nourishing the input to internal trees and summarizing their outputs. One of the main challenges of the computational complexity of the random forest algorithm is the speed of the real-time predictions, which is related to the large number of trees that are necessary to establish the algorithm. A large number of trees facilitates a more accurate prediction process, which affects the speed of the model. Another challenge of the random forest algorithm is that it does not provide any description or characterization of the relationships of the investigated data, which gives the opportunity to examine other approaches. One of the limitations of the random forest is that having a large number of trees can lead the algorithm to be notably slow, which is not effective for real-time scenarios. Generally, although the training time is more in random forests than in other machine learning algorithms, in DRF, the training time is noticeably reduced to more than 60% of the normal RF time, and this is majorly dependent on the ability to run the algorithm in parallel on multiple threads, CPUs, and even GPUs and the number of created trees in the model. It is worth nothing that to obtain an accurate prediction, a large number of trees is required, leading to a slower model if the machine does not have GPUs or a high-end machine. However, the DRF creates 50% fewer trees for binomial problems than the normal random forest. In our classification method, each tree votes, and the most popular class is taken as the final selection. In general, with DRF, speed tradeoffs can occur depending on the trees’ size and depth. The DRF, by default, goes to a depth of 20. This can cause the split of up to 1 + 2 + 4 + 8 + + 2 19 to one million nodes. In addition, for every node, t r e e s o u n t = s q r t ( 4600 ) = 67 columns have to be taken into consideration for splitting. This led to the need of finding up to 1 m i l l i o n × 67 to 67 million split points per tree. In most cases, many trees’ leaves do not reach a depth of 20. Thus, the total number is smaller.

4.3. Comparison with Other Methods

The comparison is based on six performance metrics, where the proposed method achieved superior performance in all those metrics. The methods selected for the comparison with the proposed approach are mentioned in Table 6, as they have used the SGCC dataset and reported high performance in state-of-the-art fraud detection methods.
To compare the results of the proposed method with other methods, the authors used the following six performance metrics given in Table 4: Accuracy, sensitivity (recall or detection rate), and precision are good indicators for classifying the healthiness of the NTL detection model. The specificity is used to reflect the ability of the methods to detect the non-fraud cases, and the AUC is used to measure the method’s ability to find out if the SM reading is fraudulent or not. Lastly, the F1 score is used to measure the balance between the model’s sensitivity and specificity. A high value of the F1 score indicates that the model identifies real fraud cases with a low false-positive rate. Deciding based on a single metric may provide misleading information. Therefore, the selection of the performance metrics is very important.
It is also very important to mention that in this fraud detection application, a small difference between the results of each method can represent a decisive factor in the selection of one method or another. So, for example, for a utility company billing 10,000 consumers, a 1% false positive or false negative can lead to a periodic physical verification of 100 consumers’ smart meters and may reduce the company’s benefits.
The selected methods for comparison are mentioned in Table 6. Their selection is based on the fact that they are tested with the same SGCC dataset and they all belong to the same state-of-the-art family of supervised ML algorithms that have reported the best results in NTL fraud detection in recent years.
From Table 6 and Figure 8, the study’s proposed method stands out compared to the state-of-the-art data-based methods considering the six performance measures combined. Its results are uniformly high with The reported Accuracy, Recall, Specificity, Precision, F1-score, and AUC of the proposed method are higher than the other ensemble methods, namely, FA-XGBoost [21], DERUSBOOST [30], CatBoost [25], NGBoost [26], Decision tree [28], AdaBoost [28], CNN-GRU-PSO [31], CNN [32], WADCNN [1], BSVM [22], ANN [28], and Deep ANN [28].
The FA-XGBoost [21] method achieved the second-best performance after the proposed method when comparing the accuracy, recall, F1-score, and AUC value metrics. As for the CatBoost [25], NGBoost [26], and BSVM [22] methods that were used in very recent research works, they all showed similar performances with an accuracy ranging from 0.93 to 0.94, recall ranging from 0.91 to 0.92, and precision ranging from 0.95 to 0.96. Thus, all three methods reflect a slightly lower performance when detecting fraud compared to the proposed method. Other ensemble methods showed high results in one performance measure but were lacking in the others. For example, the DERUSBOOST method achieved a specificity of 0.99, but it showed a recall and precision of 0.90 and an AUC value of 0.89, which indicates that 10% of what seems accurate are false predictions. Similarly, the Decision tree, AdaBoost, ANN, and Deep ANN methods achieved high accuracies of 0.91, 0.91, 0.92, and 0.92, respectively. However, they showed very low recalls that reached 0.02, 0.07, 0.35, and 0.40, respectively, indicating that all four models have a very low ability to detect fraud cases, and their low F1-scores support these conclusions. The deep neural network methods such as CNN and WADCNN do not perform better as the highest reported result is (Acc, 0.93).
CNN-GRU-PSO [31]: Although a hybrid combined approach is used to transform the CNN design to a gated recurrent neural network and optimized by the Particle Swarm approach, it has reported the accuracy and AUC as 0.87 and 0.89, respectively, which is low. Moreover, it did not mention the recall and specificity, while they are perfectly high in the proposed method.
Finally, the compared methods in [28] on the SGCC dataset, Decision tree, ANN, Deep ANN, and AdaBoost have extremely low recall figures. Given that the recall is about the ability of the classifier to find all (TP) cases, those created models are weak compared to the proposed method’s recall (0.98).

4.4. When to Retrain the Model

There is a phenomenon in the life-cycle of any created ML model called ’Model Drifting’ that may happen after a period of time since its implementation. Such phenomena happen due to changes in the independent variables of the model that may impact the efficiency of the model predictions and become erroneous after some time. When such phenomena happen, it is recommended to retrain the model when this model behavior is detected.
There are two types of model drifting: The first is called ’concept drifting’ [33,34], which happens when the statistical properties of the target class variable (i.e., the target we want to predict) change over time. The second type is called ’data drift’ [35] and happens when the statistical properties of the predictors (i.e., independent variables) change: for example, the seasonality in the data of the time series is one example of the data drift.
The best way to address this problem is to retrain (refit) the model periodically, and such phenomena need to be frequently monitored in the ML periodic results. Metrics related to the stability of the model (e.g., the estimated distribution of the distances between classification errors [36]) need to be monitored. The monitoring intervals should be agreed upon with the business management.
As the NTL detection is critical for utility companies, it is recommended to build automated monitoring for the model efficiency to remain above an accepted threshold and to retrain the model when its efficiency noticed bypasses the accepted thresholds.

5. Conclusions

Utility companies are losing millions of their revenues due to non-technical loss fraud. A novel and practical method for detecting NTL fraud in Smart Grids is presented in this work. The novelty of the proposed model is its robustness in terms of scoring above 0.98 in all its performance measures. Moreover, it has less tendency to overfit since it is built using the distributed random forest that creates multiple trees, where each tree is trained and overfitted differently. The decisions of each tree are then combined to make the final optimized classification The proposed novel data-based method is composed of engineering new features for the smart meter readings extracted from the SGCC dataset and generating a distributed random forest model. Those new features are a combination of data extracted from the calculation of the finite differences around a point of interest and features such as ARIMA and Holt-Winters. The purpose of the extracted data is to detect any presence of a sudden jump in the consumption and other statistical time series summaries. The implemented experiments illustrate the effectiveness of the proposed method. The results of this novel method shows that it is superior to the state-of-the-art methods such as ANN, CNN, AdaBoost, CatBoost, and SVM, as it outperforms them in terms of accuracy, recall, precision, and F1-score. Based on the conducted experiments, a range of 50 to 100 trees in the distributed random forest can be suggested.
Furthermore, adding reinforcement learning can be a practical experiment to enhance the created DRF model.

Author Contributions

Conceptualization, S.A.B. and D.G.; Data curation, S.A.B. and A.A.; Formal analysis, I.E.; Funding acquisition, D.G. and I.E.; Investigation, S.A.B., I.E. and A.A.; Methodology, S.A.B. and A.A.; Project administration, S.A.B. and I.E.; Resources, S.A.B.; Software, S.A.B.; Supervision, S.A.B.; Validation, S.A.B. and A.A.; Visualization, S.A.B. and A.A.; Writing—original draft, S.A.B., D.G. and I.E.; Writing—review & editing, S.A.B., D.G. and I.E. All authors have read and agreed to the published version of the manuscript.

Funding

This research received no external funding.

Institutional Review Board Statement

Not applicable.

Informed Consent Statement

Not applicable.

Data Availability Statement

Not applicable.

Acknowledgments

The authors acknowledge the UAE Ministry of Culture and Youth and its public library in Ras Al-Khaimah for their valued facilities to researchers that helped achieve this work.

Conflicts of Interest

The authors declare no conflict of interest.

References

  1. Zheng, Z.; Yang, Y.; Niu, X.; Dai, H.N.; Zhou, Y. Wide and deep convolutional neural networks for electricity-theft detection to secure smart grids. IEEE Trans. Ind. Inform. 2018, 14, 1606–1615. [Google Scholar] [CrossRef]
  2. Hasan, M.; Toma, R.N.; Nahid, A.A.; Islam, M.; Kim, J.M. Electricity theft detection in smart grid systems: A CNN-LSTM based approach. Energies 2019, 12, 3310. [Google Scholar] [CrossRef] [Green Version]
  3. Nagi, J.; Yap, K.S.; Tiong, S.K.; Ahmed, S.K.; Mohamad, M. Nontechnical loss detection for metered customers in power utility using support vector machines. IEEE Trans. Power Deliv. 2009, 25, 1162–1171. [Google Scholar] [CrossRef]
  4. Glauner, P.; Meira, J.A.; Valtchev, P.; State, R.; Bettinger, F. The challenge of non-technical loss detection using artificial intelligence: A survey. arXiv 2016, arXiv:1606.00626. [Google Scholar] [CrossRef] [Green Version]
  5. Xia, X.; Xiao, Y.; Liang, W. SAI: A suspicion assessment-based inspection algorithm to detect malicious users in smart grid. IEEE Trans. Inf. Forensics Secur. 2019, 15, 361–374. [Google Scholar] [CrossRef]
  6. Viegas, J.L.; Esteves, P.R.; Melício, R.; Mendes, V.; Vieira, S.M. Solutions for detection of non-technical losses in the electricity grid: A review. Renew. Sustain. Energy Rev. 2017, 80, 1256–1268. [Google Scholar] [CrossRef] [Green Version]
  7. Saeed, M.S.; Mustafa, M.W.; Hamadneh, N.N.; Alshammari, N.A.; Sheikh, U.U.; Jumani, T.A.; Khalid, S.B.A.; Khan, I. Detection of non-technical losses in power utilities—A comprehensive systematic review. Energies 2020, 13, 4727. [Google Scholar] [CrossRef]
  8. Messinis, G.M.; Hatziargyriou, N.D. Review of non-technical loss detection methods. Electr. Power Syst. Res. 2018, 158, 250–266. [Google Scholar] [CrossRef]
  9. Tariq, M.; Poor, H.V. Electricity theft detection and localization in grid-tied microgrids. IEEE Trans. Smart Grid 2016, 9, 1920–1929. [Google Scholar] [CrossRef]
  10. Ferreira, T.S.D.; Trindade, F.C.; Vieira, J.C. Load flow-based method for nontechnical electrical loss detection and location in distribution systems using smart meters. IEEE Trans. Power Syst. 2020, 35, 3671–3681. [Google Scholar] [CrossRef]
  11. Chen, L.; Xu, X.; Wang, C. Research on anti-electricity stealing method based on state estimation. In Proceedings of the 2011 IEEE Power Engineering and Automation Conference, Wuhan, China, 8–9 September 2011; Volume 2, pp. 413–416. [Google Scholar]
  12. McLaughlin, S.; Holbert, B.; Fawaz, A.; Berthier, R.; Zonouz, S. A multi-sensor energy theft detection framework for advanced metering infrastructures. IEEE J. Sel. Areas Commun. 2013, 31, 1319–1330. [Google Scholar] [CrossRef]
  13. Xiao, Z.; Xiao, Y.; Du, D.H.C. Exploring malicious meter inspection in neighborhood area smart grids. IEEE Trans. Smart Grid 2012, 4, 214–226. [Google Scholar] [CrossRef]
  14. Jokar, P.; Arianpoo, N.; Leung, V.C. Electricity theft detection in AMI using customers’ consumption patterns. IEEE Trans. Smart Grid 2015, 7, 216–226. [Google Scholar] [CrossRef]
  15. Guo, Y.; Ten, C.W.; Jirutitijaroen, P. Online data validation for distribution operations against cyber tampering. IEEE Trans. Power Syst. 2013, 29, 550–560. [Google Scholar] [CrossRef]
  16. Angelos, E.W.S.; Saavedra, O.R.; Cortés, O.A.C.; De Souza, A.N. Detection and identification of abnormalities in customer consumptions in power distribution systems. IEEE Trans. Power Deliv. 2011, 26, 2436–2442. [Google Scholar] [CrossRef]
  17. Zheng, K.; Chen, Q.; Wang, Y.; Kang, C.; Xia, Q. A novel combined data-driven approach for electricity theft detection. IEEE Trans. Ind. Inform. 2018, 15, 1809–1819. [Google Scholar] [CrossRef]
  18. Badrinath Krishna, V.; Iyer, R.K.; Sanders, W.H. ARIMA-based modeling and validation of consumption readings in power grids. In Proceedings of the International Conference on Critical Information Infrastructures Security, Berlin, Germany, 5–7 October 2015; Springer: Cham, Switzerland, 2015; pp. 199–210. [Google Scholar]
  19. Nagi, J.; Mohammad, A.; Yap, K.S.; Tiong, S.K.; Ahmed, S.K. Non-technical loss analysis for detection of electricity theft using support vector machines. In Proceedings of the 2008 IEEE 2nd International Power and Energy Conference, Johor Bahru, Malaysia, 1–3 December 2008; pp. 907–912. [Google Scholar]
  20. Ramos, C.C.O.; De Souza, A.N.; Gastaldello, D.S.; Papa, J.P. Identification and feature selection of non-technical losses for industrial consumers using the software weka. In Proceedings of the 2012 10th IEEE/IAS International Conference on Industry Applications, Fortaleza, Brazil, 5–7 November 2012; pp. 1–6. [Google Scholar]
  21. Khan, Z.A.; Adil, M.; Javaid, N.; Saqib, M.N.; Shafiq, M.; Choi, J.G. Electricity theft detection using supervised learning techniques on smart meter data. Sustainability 2020, 12, 8023. [Google Scholar] [CrossRef]
  22. Khan, I.U.; Javaid, N.; Taylor, C.J.; Gamage, K.A.; Ma, X. Big Data Analytics for Electricity Theft Detection in Smart Grids. In Proceedings of the 2021 IEEE Madrid PowerTech, Madrid, Spain, 28 June–2 July 2021; pp. 1–6. [Google Scholar]
  23. Nizar, A.; Dong, Z.; Wang, Y. Power utility nontechnical loss analysis with extreme learning machine method. IEEE Trans. Power Syst. 2008, 23, 946–955. [Google Scholar] [CrossRef]
  24. Costa, B.C.; Alberto, B.L.; Portela, A.M.; Maduro, W.; Eler, E.O. Fraud detection in electric power distribution networks using an ann-based knowledge-discovery process. Int. J. Artif. Intell. Appl. 2013, 4, 17. [Google Scholar] [CrossRef]
  25. Hussain, S.; Mustafa, M.W.; Jumani, T.A.; Baloch, S.K.; Alotaibi, H.; Khan, I.; Khan, A. A novel feature engineered-CatBoost-based supervised machine learning framework for electricity theft detection. Energy Rep. 2021, 7, 4425–4436. [Google Scholar] [CrossRef]
  26. Hussain, S.; Mustafa, M.W.; Ateyeh Al-Shqeerat, K.H.; Saeed, F.; Al-Rimy, B.A.S. A Novel Feature-Engineered–NGBoost Machine-Learning Framework for Fraud Detection in Electric Power Consumption Data. Sensors 2021, 21, 8423. [Google Scholar] [CrossRef]
  27. Simonyan, K.; Zisserman, A. Very deep convolutional networks for large-scale image recognition. arXiv 2014, arXiv:1409.1556. [Google Scholar]
  28. Bohani, F.A.; Suliman, A.; Saripuddin, M.; Sameon, S.S.; Md Salleh, N.S.; Nazeri, S. A comprehensive analysis of supervised learning techniques for electricity theft detection. J. Electr. Comput. Eng. 2021, 2021, 9136206. [Google Scholar] [CrossRef]
  29. Badawi, S.A.; Fraz, M.M. Optimizing the trainable B-COSFIRE filter for retinal blood vessel segmentation. PeerJ 2018, 6, e5855. [Google Scholar] [CrossRef] [PubMed] [Green Version]
  30. Mujeeb, S.; Javaid, N.; Khalid, R.; Imran, M.; Naseer, N. DE-RUSBoost: An efficient electricity theft detection scheme with additive 404 communication layer. In Proceedings of the ICC 2020—2020 IEEE International Conference on Communications, Dublin, Ireland, 7–11 June 2020; Volume 405, pp. 1–6. [Google Scholar]
  31. Ullah, A.; Javaid, N.; Samuel, O.; Imran, M.; Shoaib, M. CNN and GRU based deep neural network for electricity theft detection to secure smart grid. In Proceedings of the 2020 International Wireless Communications and Mobile Computing (IWCMC), Limassol, Cyprus, 15–19 June 2020; pp. 1598–1602. [Google Scholar]
  32. Yao, D.; Wen, M.; Liang, X.; Fu, Z.; Zhang, K.; Yang, B. Energy theft detection with energy privacy preservation in the smart grid. IEEE Internet Things J. 2019, 6, 7659–7669. [Google Scholar] [CrossRef]
  33. Zhukov, A.V.; Sidorov, D.N.; Foley, A.M. Random Forest Based Approach for Concept Drift Handling. In Analysis of Images, Social Networks and Texts; Communications in Computer and Information Science; Springer: Berlin/Heidelberg, Germany, 2016; Volume 661. [Google Scholar]
  34. Dal Pozzolo, A.; Boracchi, G.; Caelen, O.; Alippi, C.; Bontempi, G. Credit card fraud detection and concept-drift adaptation with delayed supervised information. In Proceedings of the 2015 International Joint Conference on Neural Networks (IJCNN), Killarney, Ireland, 12–17 July 2015; pp. 1–8. [Google Scholar]
  35. Wang, X.; Fan, Y.; Huang, Y.; Ling, J.; Klimowicz, A.; Pagano, G.; Li, B. Solving Sensor Reading Drifting Using Denoising Data Processing Algorithm (DDPA) for Long-Term Continuous and Accurate Monitoring of Ammonium in Wastewater. ACS EST Water 2020, 1, 530–541. [Google Scholar] [CrossRef]
  36. Bohani, R.S.; Cabral, D.R.; Gonçalves, P.M., Jr.; Santos, S.G. RDDM: Reactive drift detection method. Expert Syst. Appl. 2017, 90, 344–355. [Google Scholar]
Figure 1. The proposed NTL fraud detection methodology.
Mathematics 10 01878 g001
Figure 2. Sudden Jump down in the average Smart Meter usage of the attacker meter. The smart meter consumption in blue. The jump in between the mean of lag meter readings and the mean of the lead meter-readings (red color) at the fraudulent point.
Mathematics 10 01878 g002
Figure 3. Sudden Jump up detection in the average Smart Meter usage of the attacked meter. The smart meter consumption in blue. The jump in between the mean of lag meter readings and the mean of the lead meter-readings (black color) at the fraudulent point. The moving average of the smart meter readings (red color).
Mathematics 10 01878 g003
Figure 4. Hyperparameter tuning and optimizing.
Mathematics 10 01878 g004
Figure 5. Distributed random forest.
Mathematics 10 01878 g005
Figure 6. Impact of the increased number of trees on the model. (a) MSE, RMSE, and logloss; (b) R 2 and AUC.
Mathematics 10 01878 g006
Figure 7. The scoring history results during the model training and testing: (a) AUC vs. number of trees; (b) AUC vs. number of epochs; (c) the cross-entropy or logloss vs. number of trees during the training and validating stages of the proposed method.
Mathematics 10 01878 g007
Figure 8. Results comparison of other methods with the proposed method.
Mathematics 10 01878 g008
Table 1. Fraudulent detection engineered feature-set.
FeatureDescription
Timeseries readings (ts)SM readings.
Sliding windowReadings (32 lead and 32 lag) around each current reading
Mean, Median, Sum,
Variance, Min, Max
Statistical summaries
Delta 1 to Delta 32Delta i = Lead i – lag i
DifferencesSumDelta I summation around current reading
Holt-WintersHolt-winters smoothing moving average
ARIMAAutoregressive integrated moving average
StationarityStationarity transformation.
Trend, Seasonality, RandomExtracted from the seasonal trend decomposition analysis.
Label1 for fraudulent and 0 for normal label
Table 2. Range of values for optimizing hyperparameters.
HyperparameterRange StartRange End
Batch size140
Number of trees1200
Score tree interval120
Stopping rounds110
Stopping tolerance0.0000010.001
Table 3. Optimized DRF hyper-parameters.
Hyper-ParameterDescriptionValue
Batch sizeIs the number of training samples used to compute the loss function25
Number of treesThe number of trees in the random forest100
Score tree intervalScore of the model after every given number of trees5
Stopping roundsTo stop the model training if the AUC does not improve during those rounds3
Stopping metricThe performance metric used to stop the trainingAUC
Stopping toleranceSpecifies the relative tolerance to stop a grid search0.0005
Table 4. Performance metrics used in this work to Compare the Results.
MetricPreprocessing ThresholdFormula
Accuracy (Acc.)Measures the correctly identified fraud and non-fraud cases A c c u r a c y = ( T P + T N ) ( T P + F P + F N + T N )
Sensitivity (Recall)Measures the method’s ability to correctly detect the fraud out of the total predicted fraud cases S e n s i t i v i t y ( R e c a l l ) = T P ( T P + F N )
SpecificityMeasures the method’s ability to correctly detect the non-fraud of the total predicted non-fraud cases S p e c i f i c i t y = T N ( T N + F P )
AUCMeasures the method’s performance to distinguish whether the SM reading is fraudulent or not
Precision (Pr)Measures the capability of the classifier to correctly identify the fraud out of the total actual fraud cases. P r = T P ( T P + F P )
F1-scoreThe F1 score is a harmonic average of the recall and precision F 1 s c o r e = 2 P r S P ( P r + S p )
FP, TP, FN, and TN refer to a false positive, true positive, false negative, and true negative, respectively.
Table 5. Two Distributed Random Forest experiments’ results.
Loss Function50 Trees100 Trees
Mean Square error (MSE)0.001350.00164
Root Mean Square error (RMSE)0.036750.04060
Cross entropy or Logloss0.031270.03571
R 2 0.994600.99340
AUC0.983250.98326
Table 6. The comparison of the proposed method’s results with other methods.
ModelYearAccuracyRecallSpecificityPrecisionF1-ScoreAUC
Proposed method20220.980.980.990.990.980.98
CNN-GRU-PSO [31]20200.87 0.89
CNN [32]20190.93
FA-XGBoost [21]20200.950.97 0.930.940.95
WADCNN [1]20180.860.740.870.70 0.76
DERUSBOOST [30]20200.960.900.990.90 0.89
CatBoost [25]20210.930.92 0.950.94
NGBoost [26]20210.930.91 0.950.920.94
BSVM [22]20210.940.91 0.960.940.93
Decision tree [28]20210.910.02 0.500.050.51
ANN [28]20210.920.35 0.640.420.66
Deep ANN [28]20210.920.40 0.590.450.69
AdaBoost [28]20210.910.07 0.570.130.53
Publisher’s Note: MDPI stays neutral with regard to jurisdictional claims in published maps and institutional affiliations.

