
On the Suitability of Bagging-Based Ensembles with Borderline Label Noise


Abstract
:1. Introduction
- Deepening the understanding of the impact of borderline label noise, which is more frequent in practice than the random label noise that is commonly studied, on the efficacy of traditional classification methods.
- Analysis of the behavior of bagging-based ensembles versus not considering them when dealing with borderline label noise, which has usually been overlooked in the literature.
- Study of the improvement of robustness to noise, through the use of specific measures [35], of methods traditionally considered robust when included in a bagging ensemble.
- Establishing the noise levels in the data where the use of bagging is most recommended, as well as the hypotheses that explain its good behavior with borderline label noise.
2. Background
2.1. Noisy Data in Classification
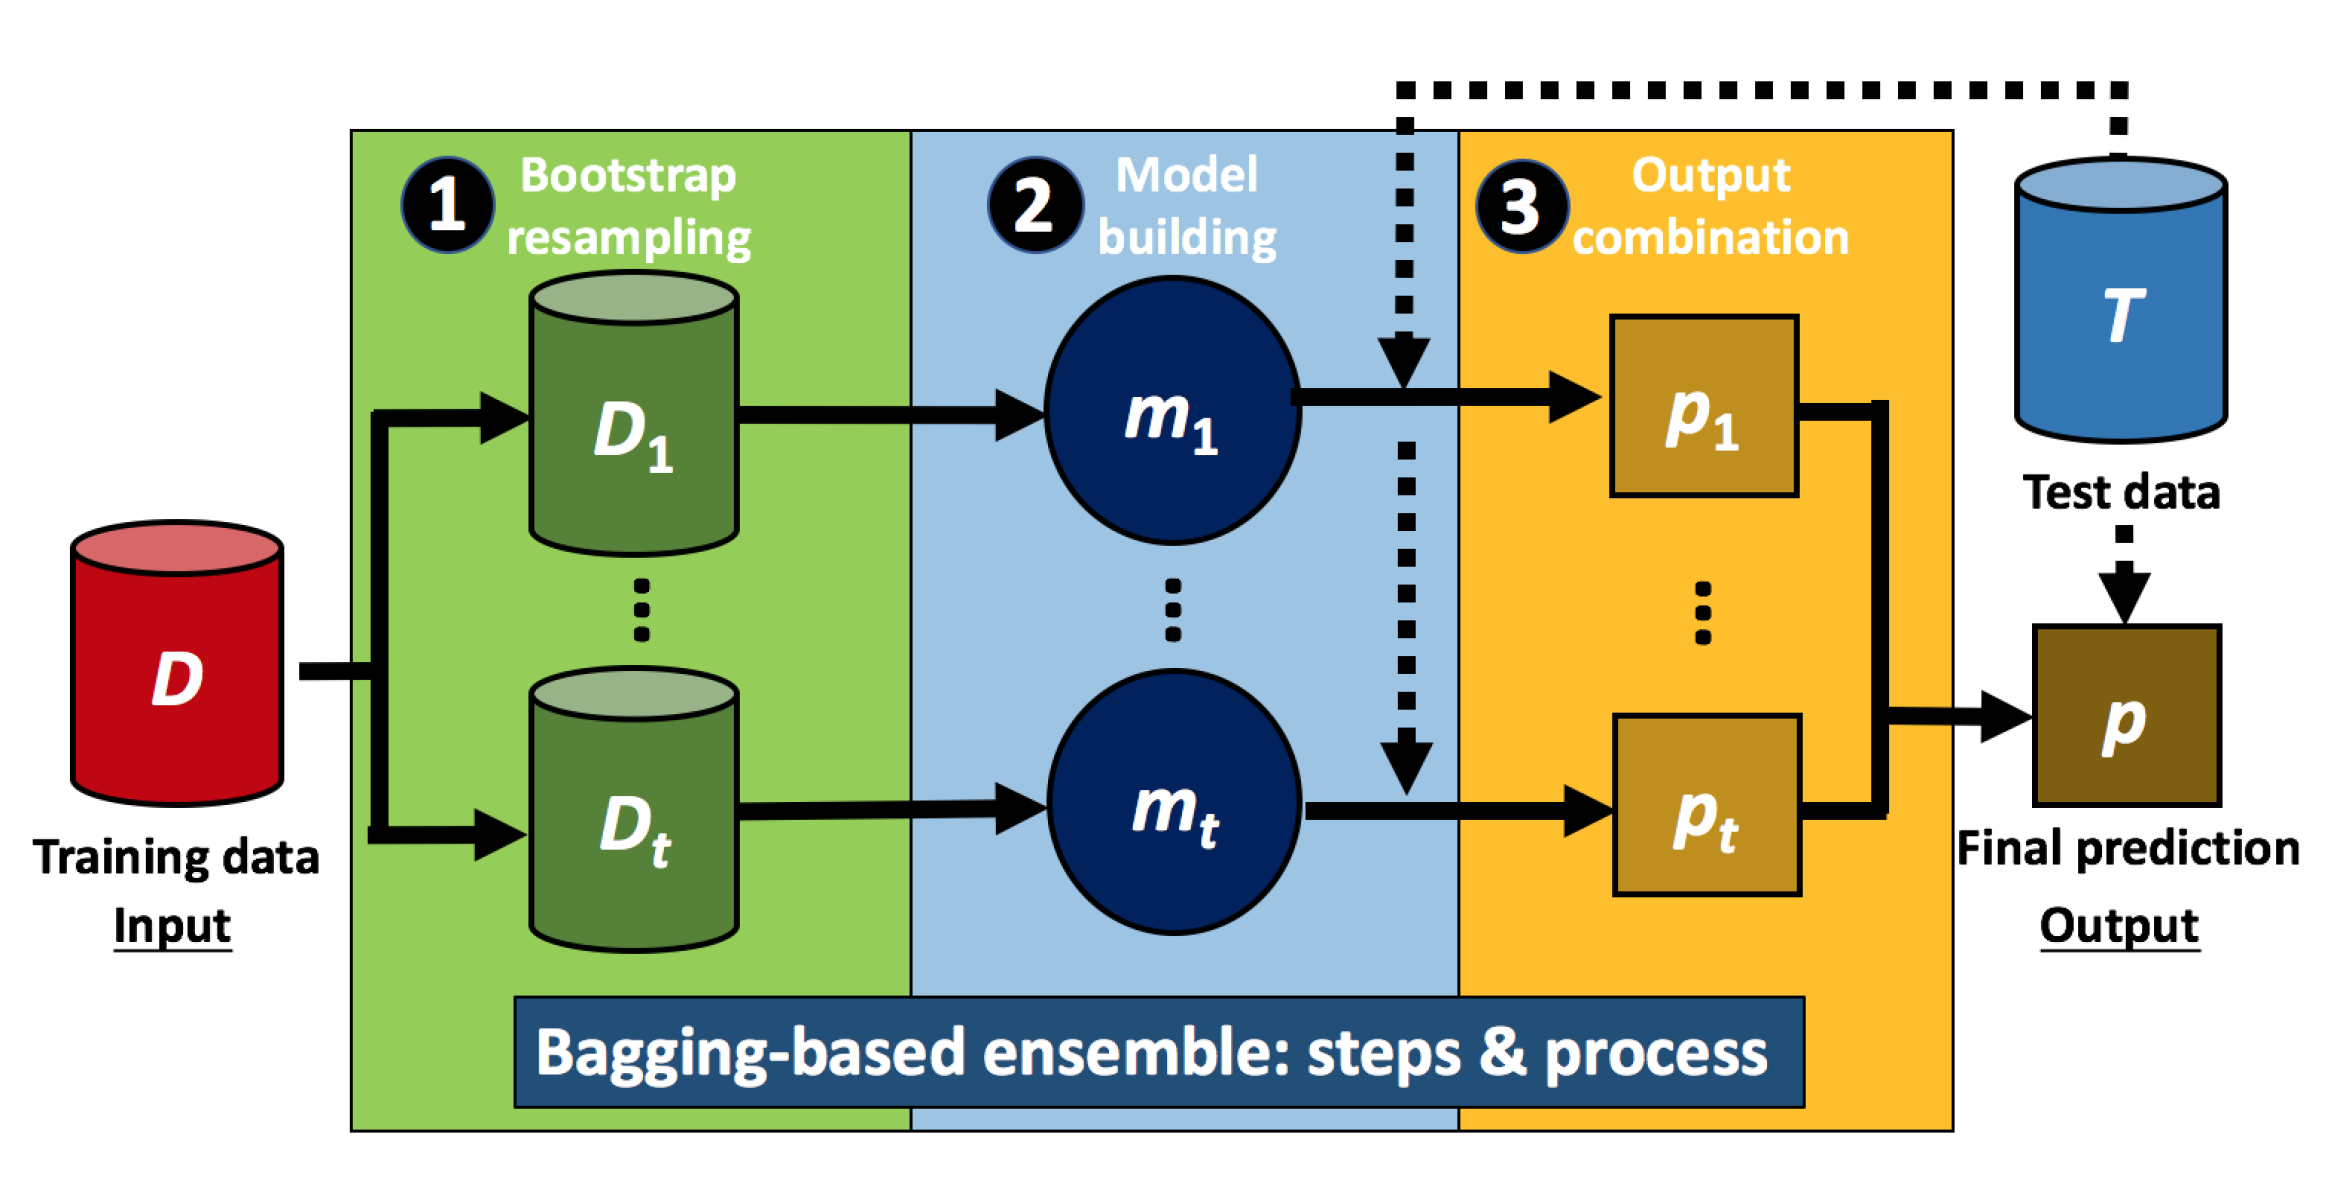
2.2. Building Classification Ensembles Using Bagging
3. Experimental Framework
3.1. Real-World Datasets
3.2. Noise Introduction Models
- 1.
- Neighborwise borderline label noise. This calculates a noise measure for each sample based on the distances to its closest samples from the same class and from a different one. The noise measure has the following expression:where NN is the nearest neighbor of , the Euclidean distance between the samples and , and the class label of the sample . Finally, the values are ordered in descending order, and the first of them are chosen to be mislabeled.
- 2.
- Non-linearwise borderline label noise. This computes a noise metric for each sample based on its distance to the decision limit induced by a support vector machine (SVM) [54]. In order to achieve this, it first uses SVM with a radial basis kernel to compute the decision boundary in the data D. Then, for each sample in D, its distance to the decision border is calculated, considered as the unsigned decision values of SVM for that sample. For multi-class problems, the one-vs-one approach is used, and the distance between the sample and the nearest decision boundary is selected. Finally, the values of the noise metric are ordered in ascending order, and the first of them are chosen to be altered.
3.3. Classification Algorithms
- 1.
- C4.5 [11]. It is based on the ID3 [59] algorithm, including some improvements, such as the handling of missing values, the possibility of treating continuous attributes, and the usage of pruning to avoid overfitting. C4.5 follows a top-down approach to build the decision tree. In order to determine the current node in each of its stages, the attribute that best separates the remaining samples among classes is selected.
- 2.
- RIPPER [29]. Its main goal is to create a set of crisp rules from the training data. The rules are learned one by one, until they cover all the samples of each of the classes according to their frequency. For this, a stopping criterion based on the minimum description length [60] metric is used. Each rule is then pruned to avoid the overfitting of the previous stage. After learning the ruleset for a given class, an optimization stage is run, in which the rules are improved by adjusting their antecedents.
- 3.
- PART [30]. It relies on a divide-and-conquer strategy to create a set of if-else rules from the construction of partial decision trees, which are those whose branches are not completely explored. Thus, when the children of a given node are obtained, it can be chosen to be pruned. At each stage, PART creates a partial decision tree and converts its best branch, the one that covers the most samples, into a rule in the ruleset. The algorithm stops once all samples in the dataset have been covered.
- 4.
- C5.0 [31]. It has been considered in the experimentation as a more recent and advanced version of the classic C4.5 algorithm. Among the improvements that C5.0 offers with respect to its predecessor, we can highlight lower temporal and spatial complexities (which are especially useful when building ensembles), the creation of smaller decision trees that maintain their accuracy, the introduction of sample and misclassification weighting schemes, and the filtering of irrelevant attributes for the classification task.
- C4.5, PART, C5.0: pruning confidence ; min. samples per leaf .
- RIPPER: folds ; optimizations ; min. weights .
3.4. Methodology of Analysis
- 1.
- Classification accuracy. Classification accuracy is computed for each algorithm on each dataset, noise model, and noise level. Note that, even though this paper presents averaged results, the conclusions drawn are supported by the proper statistical tests with respect to each of them. On the other hand, the complete results are accessible through the webpage (https://joseasaezm.github.io/bagbln/ (accessed on 1 May 2022)) with complementary material of this research.
- 2.
- Robustness to noise. The equalized loss of accuracy (ELA) [35] metric is used to evaluate the noise robustness by measuring the performance deterioration with noisy data from a perfect classification weighted by the performance with clean data:where and are, respectively, the classification accuracies without noise and with a noise level . In this case, the lower the ELA value, the greater the robustness of the classification algorithm. It is important to point out that the conclusions reached when studying accuracy and robustness do not necessarily have to coincide: an algorithm can have a good accuracy, but deteriorate to a greater degree (being less robust) when considering higher levels of noise in the data.
- 3.
- Box-plots of robustness results. Box-plots allow completion of the analysis of the robustness to noise of the classification algorithms by analyzing the distribution of the ELA results. Lower medians and interquartile ranges will be an indicator of good robustness in all the datasets used, showing similar performances of the methods before and after introducing noise into the data.
- 4.
- Datasets with the best result. Along with the above metrics (accuracy and ELA), the number of datasets in which each approach (bagging or baseline method) obtains the best result at each noise level is computed.
4. Addressing the Borderline Label Noise Problem with Bagging Ensembles
4.1. Impact of Borderline Label Noise on Classification Accuracy
- The test accuracy results are higher for bagging than for non-bagging in both noise models, neighborwise and non-linearwise, at all the noise levels.
- The improvements using bagging are approximately between 2–4% in all cases.
- They are slightly larger for RIPPER and PART than for C4.5 and C5.0.
- The largest improvements for each method are generally found at medium-high noise levels, that is, from 15–20% onwards.
- The rows Best show a clear advantage in favor of bagging, which provides the best accuracy in the majority of the datasets.
- The low p-values obtained with Wilcoxon’s test support the superiority of the bagging schemes in all the comparisons.
4.2. Analysis of Classification Robustness to Borderline Noise
- The ELA values are better for the algorithms using bagging than for baseline classifiers at all the noise levels for the two borderline noise models studied.
- The most favorable advantages for each method using bagging generally occur at medium-high noise levels (from 20–25% onwards).
- These differences are usually more noticeable in the RIPPER algorithm, followed by PART, C4.5, and finally C5.0.
- The number of datasets in which each algorithm shows a greater robustness provides clear results in favor of bagging, being the best in most datasets.
- The p-values of Wilcoxon’s test confirm the robustness of the bagging schemes compared to their non-application.
5. Conclusions
Author Contributions
Funding
Data Availability Statement
Acknowledgments
Conflicts of Interest
References
- Chen, W.; Yang, K.; Shao, Y.; Chen, Y.; Zhang, J.; Yao, J. A trace lasso regularized robust nonparallel proximal Support Vector Machine for noisy classification. IEEE Access 2019, 7, 47171–47184. [Google Scholar] [CrossRef]
- Nematzadeh, Z.; Ibrahim, R.; Selamat, A. Improving class noise detection and classification performance: A new two-filter CNDC model. Appl. Soft Comput. 2020, 94, 106428. [Google Scholar] [CrossRef]
- Martín, J.; Sáez, J.A.; Corchado, E. On the regressand noise problem: Model robustness and synergy with regression-adapted noise filters. IEEE Access 2021, 9, 145800–145816. [Google Scholar] [CrossRef]
- Pawara, P.; Okafor, E.; Groefsema, M.; He, S.; Schomaker, L.; Wiering, M. One-vs-One classification for deep neural networks. Pattern Recognit. 2020, 108, 107528. [Google Scholar] [CrossRef]
- Tian, Y.; Sun, M.; Deng, Z.; Luo, J.; Li, Y. A new fuzzy set and nonkernel SVM approach for mislabeled binary classification with applications. IEEE Trans. Fuzzy Syst. 2017, 25, 1536–1545. [Google Scholar] [CrossRef]
- Yu, Z.; Wang, D.; Zhao, Z.; Chen, C.L.P.; You, J.; Wong, H.; Zhang, J. Hybrid incremental ensemble learning for noisy real-world data classification. IEEE Trans. Cybern. 2019, 49, 403–416. [Google Scholar] [CrossRef]
- Liu, T.; Tao, D. Classification with noisy labels by importance reweighting. IEEE Trans. Pattern Anal. Mach. Intell. 2016, 38, 447–461. [Google Scholar] [CrossRef] [Green Version]
- Sáez, J.A.; Corchado, E. ANCES: A novel method to repair attribute noise in classification problems. Pattern Recognit. 2022, 121, 108198. [Google Scholar] [CrossRef]
- Huang, L.; Shao, Y.; Zhang, J.; Zhao, Y.; Teng, J. Robust rescaled hinge loss twin support vector machine for imbalanced noisy classification. IEEE Access 2019, 7, 65390–65404. [Google Scholar] [CrossRef]
- Li, J.; Zhu, Q.; Wu, Q.; Zhang, Z.; Gong, Y.; He, Z.; Zhu, F. SMOTE-NaN-DE: Addressing the noisy and borderline examples problem in imbalanced classification by natural neighbors and differential evolution. Knowl.-Based Syst. 2021, 223, 107056. [Google Scholar] [CrossRef]
- Quinlan, J. C4.5: Programs for Machine Learning; Morgan Kaufmann: San Francisco, CA, USA, 2014. [Google Scholar]
- Sáez, J.A.; Luengo, J.; Herrera, F. Predicting noise filtering efficacy with data complexity measures for nearest neighbor classification. Pattern Recognit. 2013, 46, 355–364. [Google Scholar] [CrossRef]
- Chaudhury, S.; Yamasaki, T. Robustness of adaptive neural network optimization under training noise. IEEE Access 2021, 9, 37039–37053. [Google Scholar] [CrossRef]
- Cui, S.; Wang, Y.; Yin, Y.; Cheng, T.; Wang, D.; Zhai, M. A cluster-based intelligence ensemble learning method for classification problems. Inf. Sci. 2021, 560, 386–409. [Google Scholar] [CrossRef]
- Xia, Y.; Chen, K.; Yang, Y. Multi-label classification with weighted classifier selection and stacked ensemble. Inf. Sci. 2021, 557, 421–442. [Google Scholar] [CrossRef]
- Lughofer, E.; Pratama, M.; Škrjanc, I. Online bagging of evolving fuzzy systems. Inf. Sci. 2021, 570, 16–33. [Google Scholar] [CrossRef]
- Sun, J.; Lang, J.; Fujita, H.; Li, H. Imbalanced enterprise credit evaluation with DTE-SBD: Decision tree ensemble based on SMOTE and bagging with differentiated sampling rates. Inf. Sci. 2018, 425, 76–91. [Google Scholar] [CrossRef]
- Jafarzadeh, H.; Mahdianpari, M.; Gill, E.; Mohammadimanesh, F.; Homayouni, S. Bagging and boosting ensemble classifiers for classification of multispectral, hyperspectral and polsar data: A comparative evaluation. Remote Sens. 2021, 13, 4405. [Google Scholar] [CrossRef]
- Abellán, J.; Castellano, J.; Mantas, C. A new robust classifier on noise domains: Bagging of credal C4.5 trees. Complexity 2017, 2017, 9023970. [Google Scholar] [CrossRef] [Green Version]
- Khoshgoftaar, T.; Van Hulse, J.; Napolitano, A. Comparing boosting and bagging techniques with noisy and imbalanced data. IEEE Trans. Syst. Man Cybern. Part A Syst. Hum. 2011, 41, 552–568. [Google Scholar] [CrossRef]
- Wei, Y.; Gong, C.; Chen, S.; Liu, T.; Yang, J.; Tao, D. Harnessing side information for classification under label noise. IEEE Trans. Neural Netw. Learn. Syst. 2020, 31, 3178–3192. [Google Scholar] [CrossRef]
- Bootkrajang, J. A generalised label noise model for classification. In Proceedings of the 23rd European Symposium on Artificial Neural Networks, Bruges, Belgium, 22–23 April 2015; pp. 349–354. [Google Scholar]
- Garcia, L.P.F.; Lehmann, J.; de Carvalho, A.C.P.L.F.; Lorena, A.C. New label noise injection methods for the evaluation of noise filters. Knowl.-Based Syst. 2019, 163, 693–704. [Google Scholar] [CrossRef]
- Bootkrajang, J.; Chaijaruwanich, J. Towards instance-dependent label noise-tolerant classification: A probabilistic approach. Pattern Anal. Appl. 2020, 23, 95–111. [Google Scholar] [CrossRef]
- Du, J.; Cai, Z. Modelling class noise with symmetric and asymmetric distributions. In Proceedings of the 29th Conference on Artificial Intelligence, Austin, TX, USA, 25–30 January 2015; pp. 2589–2595. [Google Scholar]
- Sáez, J.A.; Krawczyk, B.; Woźniak, M. On the influence of class noise in medical data classification: Treatment using noise filtering methods. Appl. Artif. Intell. 2016, 30, 590–609. [Google Scholar] [CrossRef]
- Sluban, B.; Gamberger, D.; Lavrac, N. Ensemble-based noise detection: Noise ranking and visual performance evaluation. Data Min. Knowl. Discov. 2014, 28, 265–303. [Google Scholar] [CrossRef]
- Garcia, L.P.F.; Lorena, A.C.; Matwin, S.; de Leon Ferreira de Carvalho, A.C.P. Ensembles of label noise filters: A ranking approach. Data Min. Knowl. Discov. 2016, 30, 1192–1216. [Google Scholar] [CrossRef]
- Cohen, W. Fast effective rule induction. In Proceedings of the 12th International Conference on Machine Learning, Tahoe City, CA, USA, 9–12 July 1995; pp. 115–123. [Google Scholar]
- Frank, E.; Witten, I. Generating accurate rule sets without global optimization. In Proceedings of the 15th International Conference on Machine Learning, Madison, WI, USA, 24–27 July 1998; pp. 144–151. [Google Scholar]
- Rajeswari, S.; Suthendran, K. C5.0: Advanced Decision Tree (ADT) classification model for agricultural data analysis on cloud. Comput. Electron. Agric. 2019, 156, 530–539. [Google Scholar] [CrossRef]
- Nettleton, D.; Orriols-Puig, A.; Fornells, A. A study of the effect of different types of noise on the precision of supervised learning techniques. Artif. Intell. Rev. 2010, 33, 275–306. [Google Scholar] [CrossRef]
- Frenay, B.; Verleysen, M. Classification in the presence of label noise: A survey. IEEE Trans. Neural Netw. Learn. Syst. 2014, 25, 845–869. [Google Scholar] [CrossRef]
- Singh, P.; Sarkar, R.; Nasipuri, M. Significance of non-parametric statistical tests for comparison of classifiers over multiple datasets. Int. J. Comput. Sci. Math. 2016, 7, 410–442. [Google Scholar] [CrossRef]
- Sáez, J.A.; Luengo, J.; Herrera, F. Evaluating the classifier behavior with noisy data considering performance and robustness: The Equalized Loss of Accuracy measure. Neurocomputing 2016, 176, 26–35. [Google Scholar] [CrossRef]
- Ho, T.K.; Basu, M. Complexity measures of supervised classification problems. IEEE Trans. Pattern Anal. Mach. Intell. 2002, 24, 289–300. [Google Scholar]
- Gupta, S.; Gupta, A. Dealing with noise problem in machine learning data-sets: A systematic review. Procedia Comput. Sci. 2019, 161, 466–474. [Google Scholar] [CrossRef]
- Zeng, S.; Duan, X.; Li, H.; Xiao, Z.; Wang, Z.; Feng, D. Regularized fuzzy discriminant analysis for hyperspectral image classification with noisy labels. IEEE Access 2019, 7, 108125–108136. [Google Scholar] [CrossRef]
- Bootkrajang, J. A generalised label noise model for classification in the presence of annotation errors. Neurocomputing 2016, 192, 61–71. [Google Scholar] [CrossRef]
- Yuan, W.; Guan, D.; Ma, T.; Khattak, A. Classification with class noises through probabilistic sampling. Inf. Fusion 2018, 41, 57–67. [Google Scholar] [CrossRef]
- Adeli, E.; Thung, K.; An, L.; Wu, G.; Shi, F.; Wang, T.; Shen, D. Semi-supervised discriminative classification robust to sample-outliers and feature-noises. IEEE Trans. Pattern Anal. Mach. Intell. 2019, 41, 515–522. [Google Scholar] [CrossRef]
- Koziarski, M.; Krawczyk, B.; Wozniak, M. Radial-Based oversampling for noisy imbalanced data classification. Neurocomputing 2019, 343, 19–33. [Google Scholar] [CrossRef]
- Zhao, Z.; Chu, L.; Tao, D.; Pei, J. Classification with label noise: A Markov chain sampling framework. Data Min. Knowl. Discov. 2019, 33, 1468–1504. [Google Scholar] [CrossRef]
- Shanthini, A.; Vinodhini, G.; Chandrasekaran, R.M.; Supraja, P. A taxonomy on impact of label noise and feature noise using machine learning techniques. Soft Comput. 2019, 23, 8597–8607. [Google Scholar] [CrossRef]
- Pechenizkiy, M.; Tsymbal, A.; Puuronen, S.; Pechenizkiy, O. Class noise and supervised learning in medical domains: The effect of feature extraction. In Proceedings of the 19th IEEE International Symposium on Computer-Based Medical Systems, Salt Lake City, UT, USA, 22–23 June 2006; pp. 708–713. [Google Scholar]
- Khoshgoftaar, T.M.; Hulse, J.V. Empirical case studies in attribute noise detection. IEEE Trans. Syst. Man Cybern. Part C Appl. Rev. 2009, 39, 379–388. [Google Scholar] [CrossRef]
- Sculley, D.; Cormack, G.V. Filtering email spam in the presence of noisy user feedback. In Proceedings of the 5th Conference on Email and Anti-Spam, Mountain View, CA, USA, 21–22 August 2008; pp. 1–10. [Google Scholar]
- Bi, J.; Zhang, T. Support vector classification with input data uncertainty. In Proceedings of the Advances in Neural Information Processing Systems; MIT Press: Cambridge, MA, USA, 2004; Volume 17, pp. 161–168. [Google Scholar]
- Liang, D.; Yi, B. Two-stage three-way enhanced technique for ensemble learning in inclusive policy text classification. Inf. Sci. 2021, 547, 271–288. [Google Scholar] [CrossRef]
- Dong, X.; Yu, Z.; Cao, W.; Shi, Y.; Ma, Q. A survey on ensemble learning. Front. Comput. Sci. 2020, 14, 241–258. [Google Scholar] [CrossRef]
- Moyano, J.; Gibaja, E.; Cios, K.; Ventura, S. Review of ensembles of multi-label classifiers: Models, experimental study and prospects. Inf. Fusion 2018, 44, 33–45. [Google Scholar] [CrossRef]
- Singhal, Y.; Jain, A.; Batra, S.; Varshney, Y.; Rathi, M. Review of bagging and boosting classification performance on unbalanced binary classification. In Proceedings of the 8th International Advance Computing Conference, Greater Noida, India, 14–15 December 2018; pp. 338–343. [Google Scholar]
- Pakrashi, A.; Namee, B.M. KalmanTune: A Kalman filter based tuning method to make boosted ensembles robust to class-label noise. IEEE Access 2020, 8, 145887–145897. [Google Scholar] [CrossRef]
- Baldomero-Naranjo, M.; Martínez-Merino, L.; Rodríguez-Chía, A. A robust SVM-based approach with feature selection and outliers detection for classification problems. Expert Syst. Appl. 2021, 178, 115017. [Google Scholar] [CrossRef]
- Dietterich, T. Experimental comparison of three methods for constructing ensembles of decision trees: Bagging, boosting, and randomization. Mach. Learn. 2000, 40, 139–157. [Google Scholar] [CrossRef]
- Zhang, D.; Zhou, X.; Leung, S.; Zheng, J. Vertical bagging decision trees model for credit scoring. Expert Syst. Appl. 2010, 37, 7838–7843. [Google Scholar] [CrossRef]
- Cherif, I.L.; Kortebi, A. On using extreme gradient boosting (XGBoost) machine learning algorithm for home network traffic classification. In Proceedings of the 2019 Wireless Days, Manchester, UK, 24–26 April 2019; p. 8734193. [Google Scholar]
- Hansch, R. Handbook of Random Forests: Theory and Applications for Remote Sensing; World Scientific Publishing: Singapore, 2018. [Google Scholar]
- Quinlan, J. Induction of decision trees. Mach. Learn. 1986, 1, 81–106. [Google Scholar] [CrossRef] [Green Version]
- Grunwald, P.; Roos, T. Minimum description length revisited. Int. J. Math. Ind. 2019, 11, 1930001. [Google Scholar] [CrossRef] [Green Version]
- Baringhaus, L.; Gaigall, D. Efficiency comparison of the Wilcoxon tests in paired and independent survey samples. Metrika 2018, 81, 891–930. [Google Scholar] [CrossRef]
- Derrac, J.; García, S.; Molina, D.; Herrera, F. A practical tutorial on the use of nonparametric statistical tests as a methodology for comparing evolutionary and swarm intelligence algorithms. Swarm Evol. Comput. 2011, 1, 3–18. [Google Scholar] [CrossRef]


| Dataset | sa | at | cl | Dataset | sa | at | cl |
|---|---|---|---|---|---|---|---|
| balance | 625 | 4 | 3 | lsvt | 126 | 309 | 2 |
| banana | 5300 | 2 | 2 | miceprotein | 552 | 77 | 8 |
| banknote | 1372 | 4 | 2 | pageblocks | 5473 | 10 | 5 |
| biodeg | 1055 | 41 | 2 | parkinson | 195 | 22 | 2 |
| breast | 106 | 9 | 6 | pendigits | 10,992 | 16 | 10 |
| bupa | 345 | 6 | 2 | pima | 768 | 8 | 2 |
| climatemuq | 540 | 18 | 2 | seeds | 210 | 7 | 3 |
| column2C | 310 | 6 | 2 | segment | 2310 | 19 | 7 |
| column3C | 310 | 6 | 3 | sonar | 208 | 60 | 2 |
| energyheat | 768 | 8 | 37 | spectf | 267 | 44 | 2 |
| glass | 214 | 9 | 6 | transfusion | 748 | 4 | 2 |
| haberman | 306 | 3 | 2 | userkw | 403 | 5 | 4 |
| ionosphere | 351 | 34 | 2 | wdbc | 569 | 30 | 2 |
| iris | 150 | 4 | 3 | wine | 178 | 13 | 3 |
| landsat | 6435 | 36 | 6 | wisconsin | 683 | 9 | 2 |
| leaf | 340 | 14 | 30 | wpbc | 194 | 33 | 2 |
| letter | 20,000 | 16 | 26 | wqred | 1599 | 11 | 6 |
| libras | 360 | 90 | 15 | wqwhite | 4898 | 11 | 7 |
| Neighborwise Borderline Label Noise | ||||||||||
|---|---|---|---|---|---|---|---|---|---|---|
| Method | 0% | 5% | 10% | 15% | 20% | 25% | 30% | 35% | 40% | |
| ACC | C4.5 | 0.8120 | 0.8120 | 0.8044 | 0.7906 | 0.7725 | 0.7540 | 0.7296 | 0.7030 | 0.6716 |
| Bag-C4.5 | 0.8399 | 0.8398 | 0.8321 | 0.8233 | 0.8049 | 0.7850 | 0.7595 | 0.7344 | 0.7004 | |
| Best | C4.5 | 3 | 3 | 4 | 4 | 5 | 4 | 6 | 5 | 6 |
| Bag-C4.5 | 33 | 33 | 32 | 32 | 31 | 32 | 30 | 31 | 30 | |
| pWil | - | <0.001 | <0.001 | <0.001 | <0.001 | <0.001 | <0.001 | <0.001 | <0.001 | <0.001 |
| ACC | RIPPER | 0.7990 | 0.7926 | 0.7854 | 0.7839 | 0.7647 | 0.7523 | 0.7285 | 0.7015 | 0.6766 |
| Bag-RIPPER | 0.8301 | 0.8253 | 0.8239 | 0.8192 | 0.8072 | 0.7846 | 0.7621 | 0.7388 | 0.7093 | |
| Best | RIPPER | 6 | 5 | 4 | 4 | 2 | 6 | 6 | 6 | 8 |
| Bag-RIPPER | 30 | 32 | 32 | 33 | 34 | 30 | 30 | 30 | 28 | |
| pWil | - | <0.001 | <0.001 | <0.001 | <0.001 | <0.001 | <0.001 | <0.001 | <0.001 | <0.001 |
| ACC | PART | 0.8136 | 0.8080 | 0.8009 | 0.7846 | 0.7677 | 0.7494 | 0.7207 | 0.6974 | 0.6644 |
| Bag-PART | 0.8428 | 0.8373 | 0.8338 | 0.8229 | 0.8106 | 0.7880 | 0.7641 | 0.7329 | 0.7040 | |
| Best | PART | 6 | 3 | 4 | 0 | 3 | 6 | 3 | 7 | 4 |
| Bag-PART | 30 | 34 | 32 | 36 | 33 | 30 | 33 | 29 | 32 | |
| pWil | - | <0.001 | <0.001 | <0.001 | <0.001 | <0.001 | <0.001 | <0.001 | <0.001 | <0.001 |
| ACC | C5.0 | 0.8135 | 0.8117 | 0.8075 | 0.7951 | 0.7790 | 0.7524 | 0.7315 | 0.7083 | 0.6815 |
| Bag-C5.0 | 0.8371 | 0.8368 | 0.8320 | 0.8229 | 0.8068 | 0.7868 | 0.7589 | 0.7326 | 0.7025 | |
| Best | C5.0 | 5 | 6 | 4 | 1 | 5 | 7 | 5 | 7 | 9 |
| Bag-C5.0 | 31 | 30 | 32 | 35 | 31 | 29 | 31 | 29 | 27 | |
| pWil | - | <0.001 | <0.001 | <0.001 | <0.001 | <0.001 | <0.001 | <0.001 | <0.001 | <0.001 |
| Non-Linearwise Borderline Label Noise | ||||||||||
| Method | 0% | 5% | 10% | 15% | 20% | 25% | 30% | 35% | 40% | |
| ACC | C4.5 | 0.8120 | 0.8058 | 0.7994 | 0.7828 | 0.7663 | 0.7449 | 0.7200 | 0.6963 | 0.6681 |
| Bag-C4.5 | 0.8399 | 0.8344 | 0.8238 | 0.8102 | 0.7949 | 0.7779 | 0.7522 | 0.7291 | 0.7032 | |
| Best | C4.5 | 3 | 5 | 4 | 5 | 8 | 2 | 6 | 6 | 6 |
| Bag-C4.5 | 33 | 31 | 32 | 31 | 28 | 34 | 30 | 30 | 30 | |
| pWil | - | <0.001 | <0.001 | <0.001 | <0.001 | <0.001 | <0.001 | <0.001 | <0.001 | <0.001 |
| ACC | RIPPER | 0.7990 | 0.7943 | 0.7845 | 0.7731 | 0.7590 | 0.7435 | 0.7236 | 0.7010 | 0.6851 |
| Bag-RIPPER | 0.8301 | 0.8253 | 0.8167 | 0.8071 | 0.7940 | 0.7750 | 0.7604 | 0.7367 | 0.7124 | |
| Best | RIPPER | 6 | 6 | 3 | 4 | 5 | 6 | 4 | 5 | 7 |
| Bag-RIPPER | 30 | 30 | 34 | 34 | 31 | 30 | 33 | 32 | 30 | |
| pWil | - | <0.001 | <0.001 | <0.001 | <0.001 | <0.001 | <0.001 | <0.001 | <0.001 | <0.001 |
| ACC | PART | 0.8136 | 0.8071 | 0.7976 | 0.7826 | 0.7696 | 0.7471 | 0.7239 | 0.6907 | 0.6632 |
| Bag-PART | 0.8428 | 0.8385 | 0.8279 | 0.8140 | 0.7993 | 0.7835 | 0.7621 | 0.7305 | 0.7034 | |
| Best | PART | 6 | 4 | 3 | 5 | 6 | 3 | 3 | 4 | 8 |
| Bag-PART | 30 | 32 | 33 | 33 | 30 | 33 | 33 | 32 | 28 | |
| pWil | - | <0.001 | <0.001 | <0.001 | <0.001 | <0.001 | <0.001 | <0.001 | <0.001 | <0.001 |
| ACC | C5.0 | 0.8135 | 0.8122 | 0.7999 | 0.7830 | 0.7672 | 0.7425 | 0.7205 | 0.6988 | 0.6680 |
| Bag-C5.0 | 0.8371 | 0.8321 | 0.8247 | 0.8132 | 0.7947 | 0.7736 | 0.7530 | 0.7270 | 0.7026 | |
| Best | C5.0 | 5 | 8 | 5 | 4 | 6 | 7 | 7 | 8 | 7 |
| Bag-C5.0 | 31 | 28 | 31 | 32 | 30 | 29 | 29 | 28 | 29 | |
| pWil | - | <0.001 | <0.001 | <0.001 | <0.001 | <0.001 | <0.001 | <0.001 | <0.001 | <0.001 |
| Neighborwise Borderline Label Noise | ||||||||||
|---|---|---|---|---|---|---|---|---|---|---|
| Method | 0% | 5% | 10% | 15% | 20% | 25% | 30% | 35% | 40% | |
| ELA | C4.5 | 0.2613 | 0.2591 | 0.2681 | 0.2833 | 0.3052 | 0.3258 | 0.3537 | 0.3844 | 0.4215 |
| Bag-C4.5 | 0.2114 | 0.2104 | 0.2195 | 0.2288 | 0.2493 | 0.2711 | 0.3003 | 0.3284 | 0.3673 | |
| Best | C4.5 | 3 | 3 | 3 | 4 | 5 | 5 | 5 | 4 | 5 |
| Bag-C4.5 | 33 | 33 | 33 | 32 | 31 | 31 | 31 | 32 | 31 | |
| pWil | - | <0.001 | <0.001 | <0.001 | <0.001 | <0.001 | <0.001 | <0.001 | <0.001 | <0.001 |
| ELA | RIPPER | 0.3015 | 0.3060 | 0.3154 | 0.3166 | 0.3396 | 0.3528 | 0.3819 | 0.4151 | 0.4413 |
| Bag-RIPPER | 0.2350 | 0.2405 | 0.2407 | 0.2450 | 0.2586 | 0.2852 | 0.3105 | 0.3366 | 0.3700 | |
| Best | RIPPER | 6 | 4 | 4 | 4 | 2 | 6 | 6 | 4 | 7 |
| Bag-RIPPER | 30 | 32 | 32 | 32 | 34 | 30 | 30 | 32 | 29 | |
| pWil | - | <0.001 | <0.001 | <0.001 | <0.001 | <0.001 | <0.001 | <0.001 | <0.001 | <0.001 |
| ELA | PART | 0.2607 | 0.2659 | 0.2736 | 0.2920 | 0.3115 | 0.3316 | 0.3654 | 0.3926 | 0.4305 |
| Bag-PART | 0.2075 | 0.2139 | 0.2168 | 0.2291 | 0.2409 | 0.2674 | 0.2944 | 0.3303 | 0.3618 | |
| Best | PART | 6 | 4 | 4 | 2 | 4 | 6 | 3 | 7 | 5 |
| Bag-PART | 30 | 32 | 32 | 34 | 32 | 30 | 33 | 29 | 31 | |
| pWil | - | <0.001 | <0.001 | <0.001 | <0.001 | <0.001 | <0.001 | <0.001 | <0.001 | <0.001 |
| ELA | C5.0 | 0.2571 | 0.2574 | 0.2623 | 0.2759 | 0.2952 | 0.3259 | 0.3496 | 0.3758 | 0.4066 |
| Bag-C5.0 | 0.2177 | 0.2162 | 0.2216 | 0.2311 | 0.2488 | 0.2715 | 0.3035 | 0.3324 | 0.3668 | |
| Best | C5.0 | 5 | 7 | 4 | 2 | 5 | 4 | 4 | 8 | 8 |
| Bag-C5.0 | 31 | 29 | 32 | 34 | 31 | 32 | 32 | 28 | 28 | |
| pWil | - | <0.001 | <0.001 | <0.001 | <0.001 | <0.001 | <0.001 | <0.001 | <0.001 | <0.001 |
| Non-Linearwise Borderline Label noise | ||||||||||
| Method | 0% | 5% | 10% | 15% | 20% | 25% | 30% | 35% | 40% | |
| ELA | C4.5 | 0.2613 | 0.2676 | 0.2736 | 0.2934 | 0.3131 | 0.3384 | 0.3670 | 0.3968 | 0.4285 |
| Bag-C4.5 | 0.2114 | 0.2182 | 0.2301 | 0.2454 | 0.2631 | 0.2816 | 0.3112 | 0.3374 | 0.3658 | |
| Best | C4.5 | 3 | 4 | 4 | 3 | 6 | 2 | 5 | 5 | 6 |
| Bag-C4.5 | 33 | 32 | 32 | 33 | 30 | 34 | 31 | 31 | 30 | |
| pWil | - | <0.001 | <0.001 | <0.001 | <0.001 | <0.001 | <0.001 | <0.001 | <0.001 | <0.001 |
| ELA | RIPPER | 0.3015 | 0.3062 | 0.3167 | 0.3329 | 0.3484 | 0.3675 | 0.3899 | 0.4177 | 0.4334 |
| Bag-RIPPER | 0.2350 | 0.2402 | 0.2502 | 0.2624 | 0.2763 | 0.2987 | 0.3141 | 0.3418 | 0.3701 | |
| Best | RIPPER | 6 | 5 | 3 | 1 | 4 | 5 | 1 | 4 | 5 |
| Bag-RIPPER | 30 | 31 | 33 | 35 | 32 | 31 | 35 | 32 | 31 | |
| pWil | - | <0.001 | <0.001 | <0.001 | <0.001 | <0.001 | <0.001 | <0.001 | <0.001 | <0.001 |
| ELA | PART | 0.2607 | 0.2671 | 0.2777 | 0.2950 | 0.3093 | 0.3372 | 0.3636 | 0.4025 | 0.4339 |
| Bag-PART | 0.2075 | 0.2122 | 0.2246 | 0.2406 | 0.2568 | 0.2739 | 0.2979 | 0.3349 | 0.3655 | |
| Best | PART | 6 | 3 | 4 | 6 | 6 | 4 | 3 | 3 | 6 |
| Bag-PART | 30 | 33 | 32 | 30 | 30 | 32 | 33 | 33 | 30 | |
| pWil | - | <0.001 | <0.001 | <0.001 | <0.001 | <0.001 | <0.001 | <0.001 | <0.001 | <0.001 |
| ELA | C5.0 | 0.2571 | 0.2569 | 0.2716 | 0.2910 | 0.3091 | 0.3390 | 0.3650 | 0.3906 | 0.4256 |
| Bag-C5.0 | 0.2177 | 0.2226 | 0.2311 | 0.2437 | 0.2649 | 0.2894 | 0.3124 | 0.3415 | 0.3691 | |
| Best | C5.0 | 5 | 7 | 3 | 2 | 4 | 5 | 7 | 7 | 7 |
| Bag-C5.0 | 31 | 29 | 33 | 34 | 32 | 31 | 29 | 29 | 29 | |
| pWil | - | <0.001 | <0.001 | <0.001 | <0.001 | <0.001 | <0.001 | <0.001 | <0.001 | <0.001 |
Publisher’s Note: MDPI stays neutral with regard to jurisdictional claims in published maps and institutional affiliations. |
© 2022 by the authors. Licensee MDPI, Basel, Switzerland. This article is an open access article distributed under the terms and conditions of the Creative Commons Attribution (CC BY) license (https://creativecommons.org/licenses/by/4.0/).
Share and Cite
Sáez, J.A.; Romero-Béjar, J.L. On the Suitability of Bagging-Based Ensembles with Borderline Label Noise. Mathematics 2022, 10, 1892. https://doi.org/10.3390/math10111892
Sáez JA, Romero-Béjar JL. On the Suitability of Bagging-Based Ensembles with Borderline Label Noise. Mathematics. 2022; 10(11):1892. https://doi.org/10.3390/math10111892
Chicago/Turabian StyleSáez, José A., and José L. Romero-Béjar. 2022. "On the Suitability of Bagging-Based Ensembles with Borderline Label Noise" Mathematics 10, no. 11: 1892. https://doi.org/10.3390/math10111892