
A New 12-Lead ECG Signals Fusion Method Using Evolutionary CNN Trees for Arrhythmia Detection


Abstract
:1. Introduction
2. ECG Data
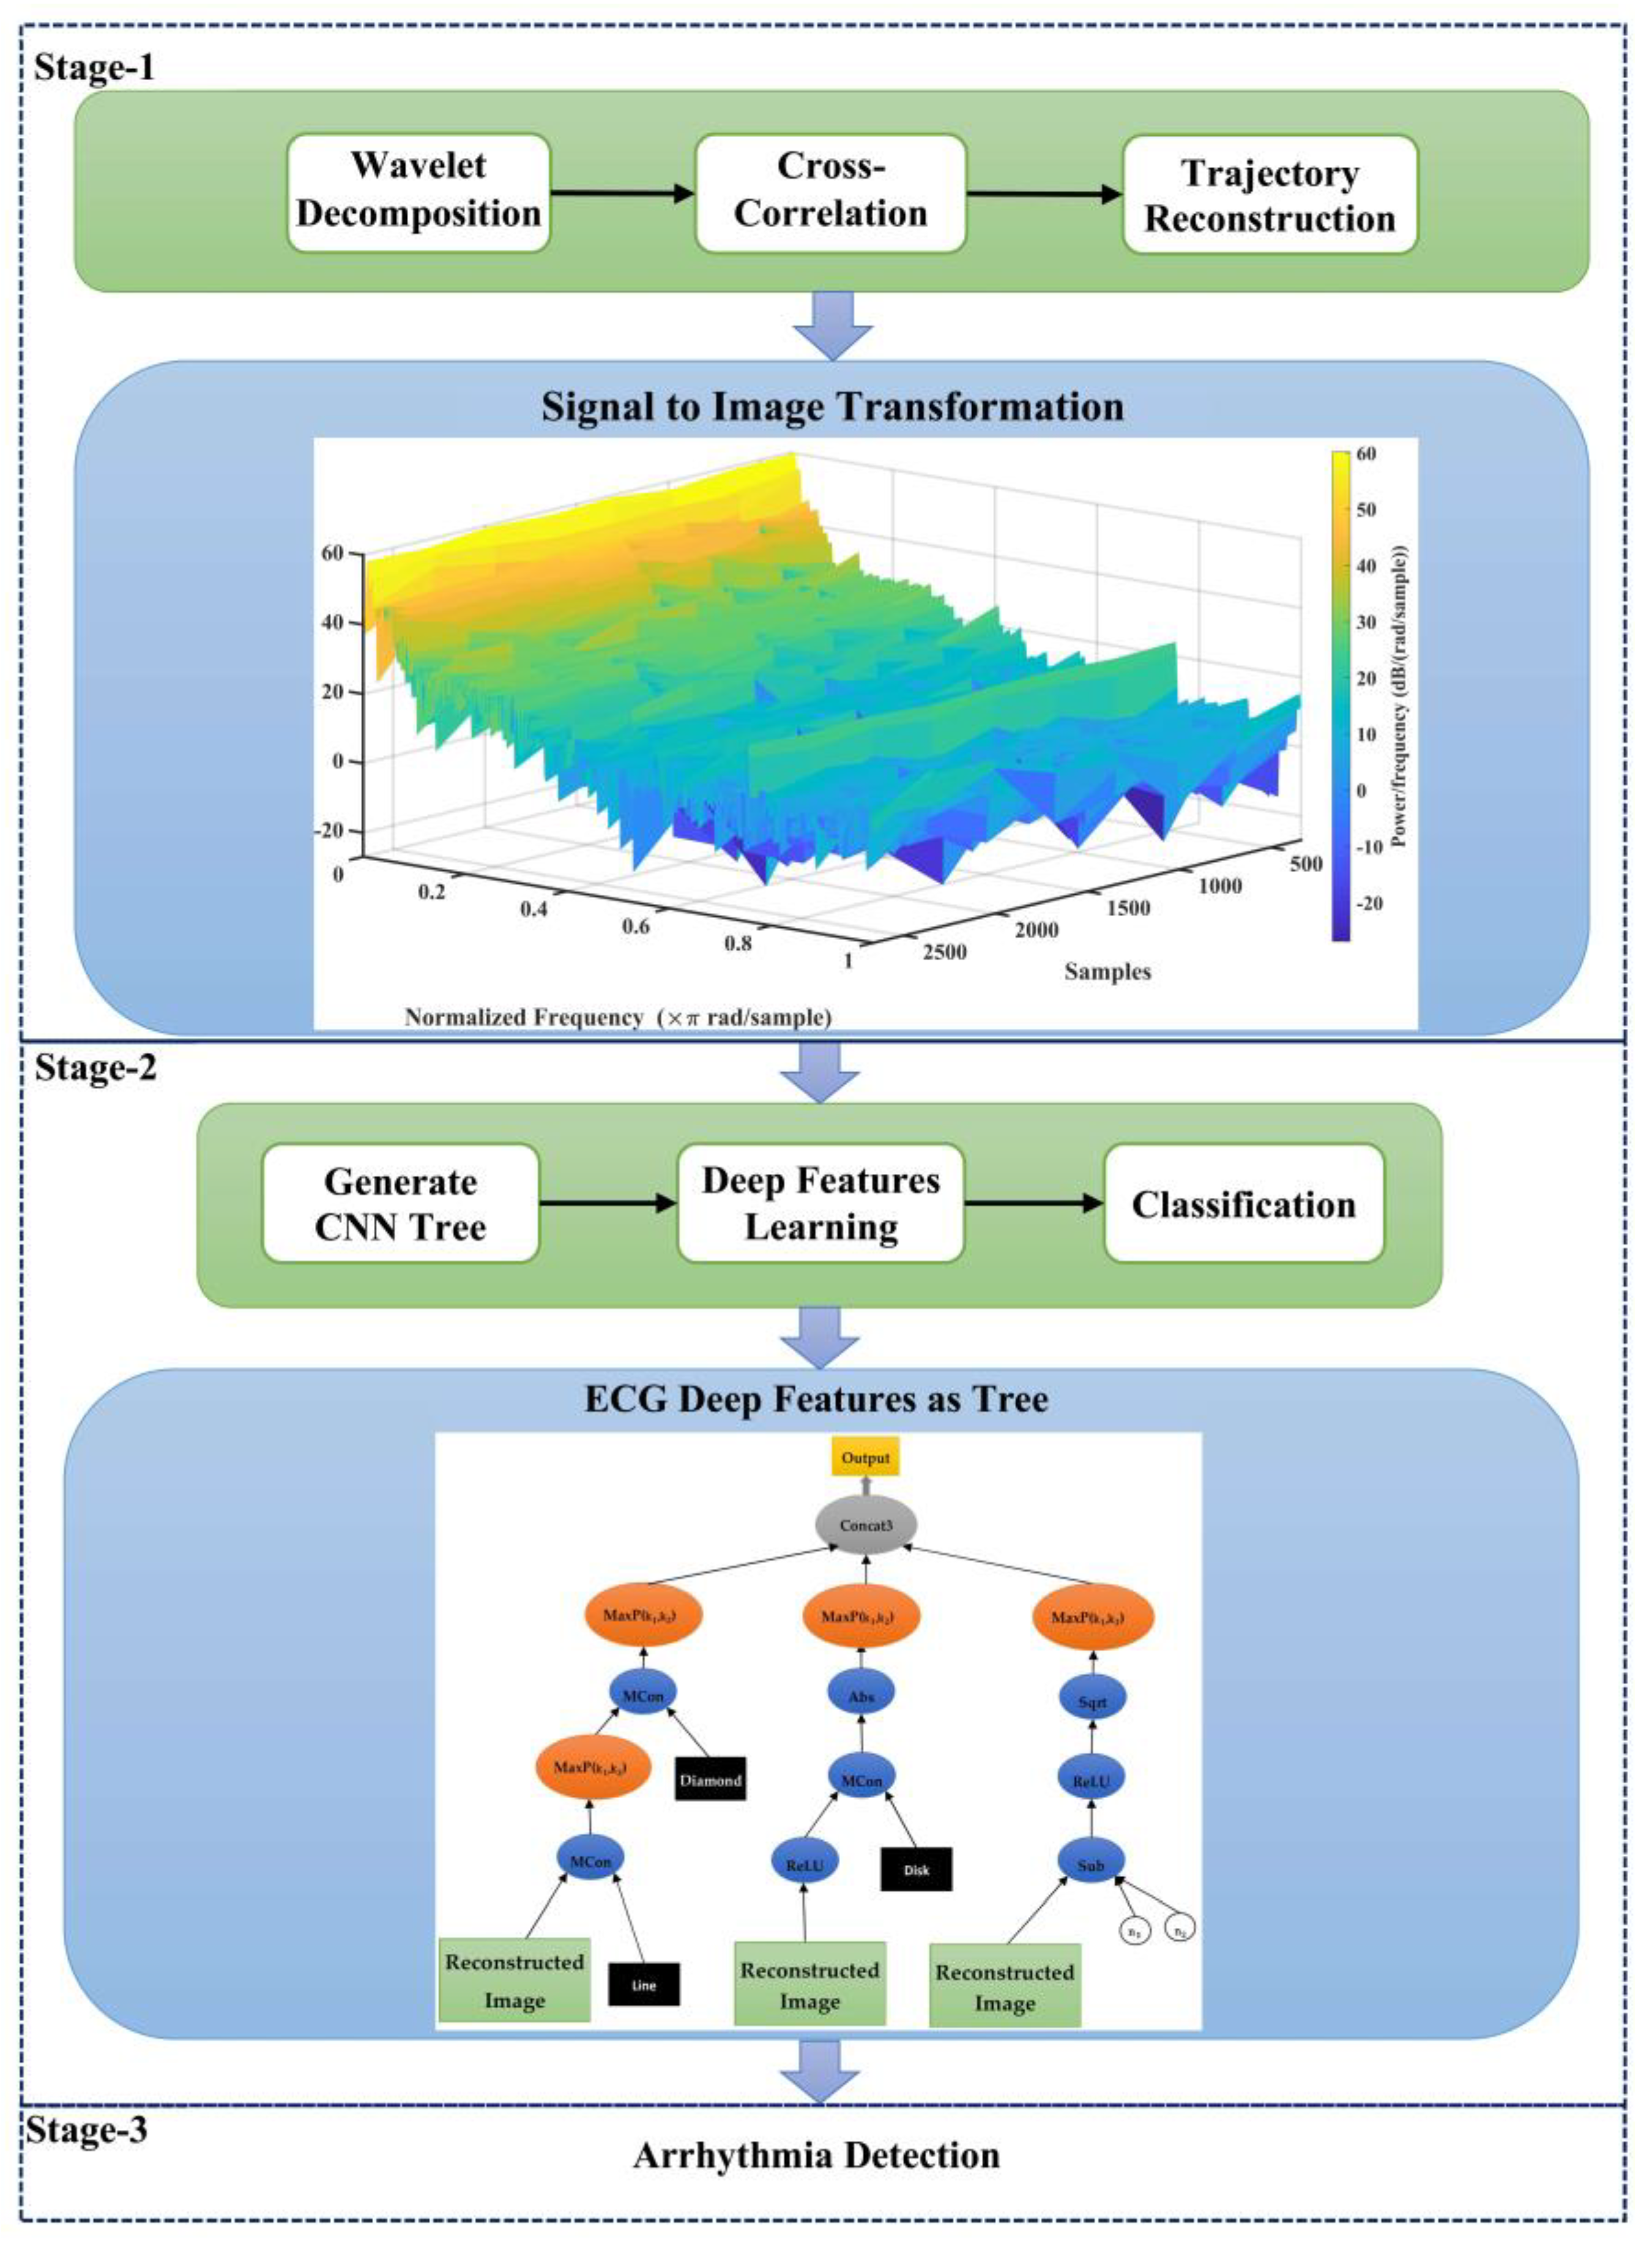
3. The Proposed Method
- Employing the approach of trajectory image creation at ECG signals instead of raw signals to increment the integration of the proposed model;
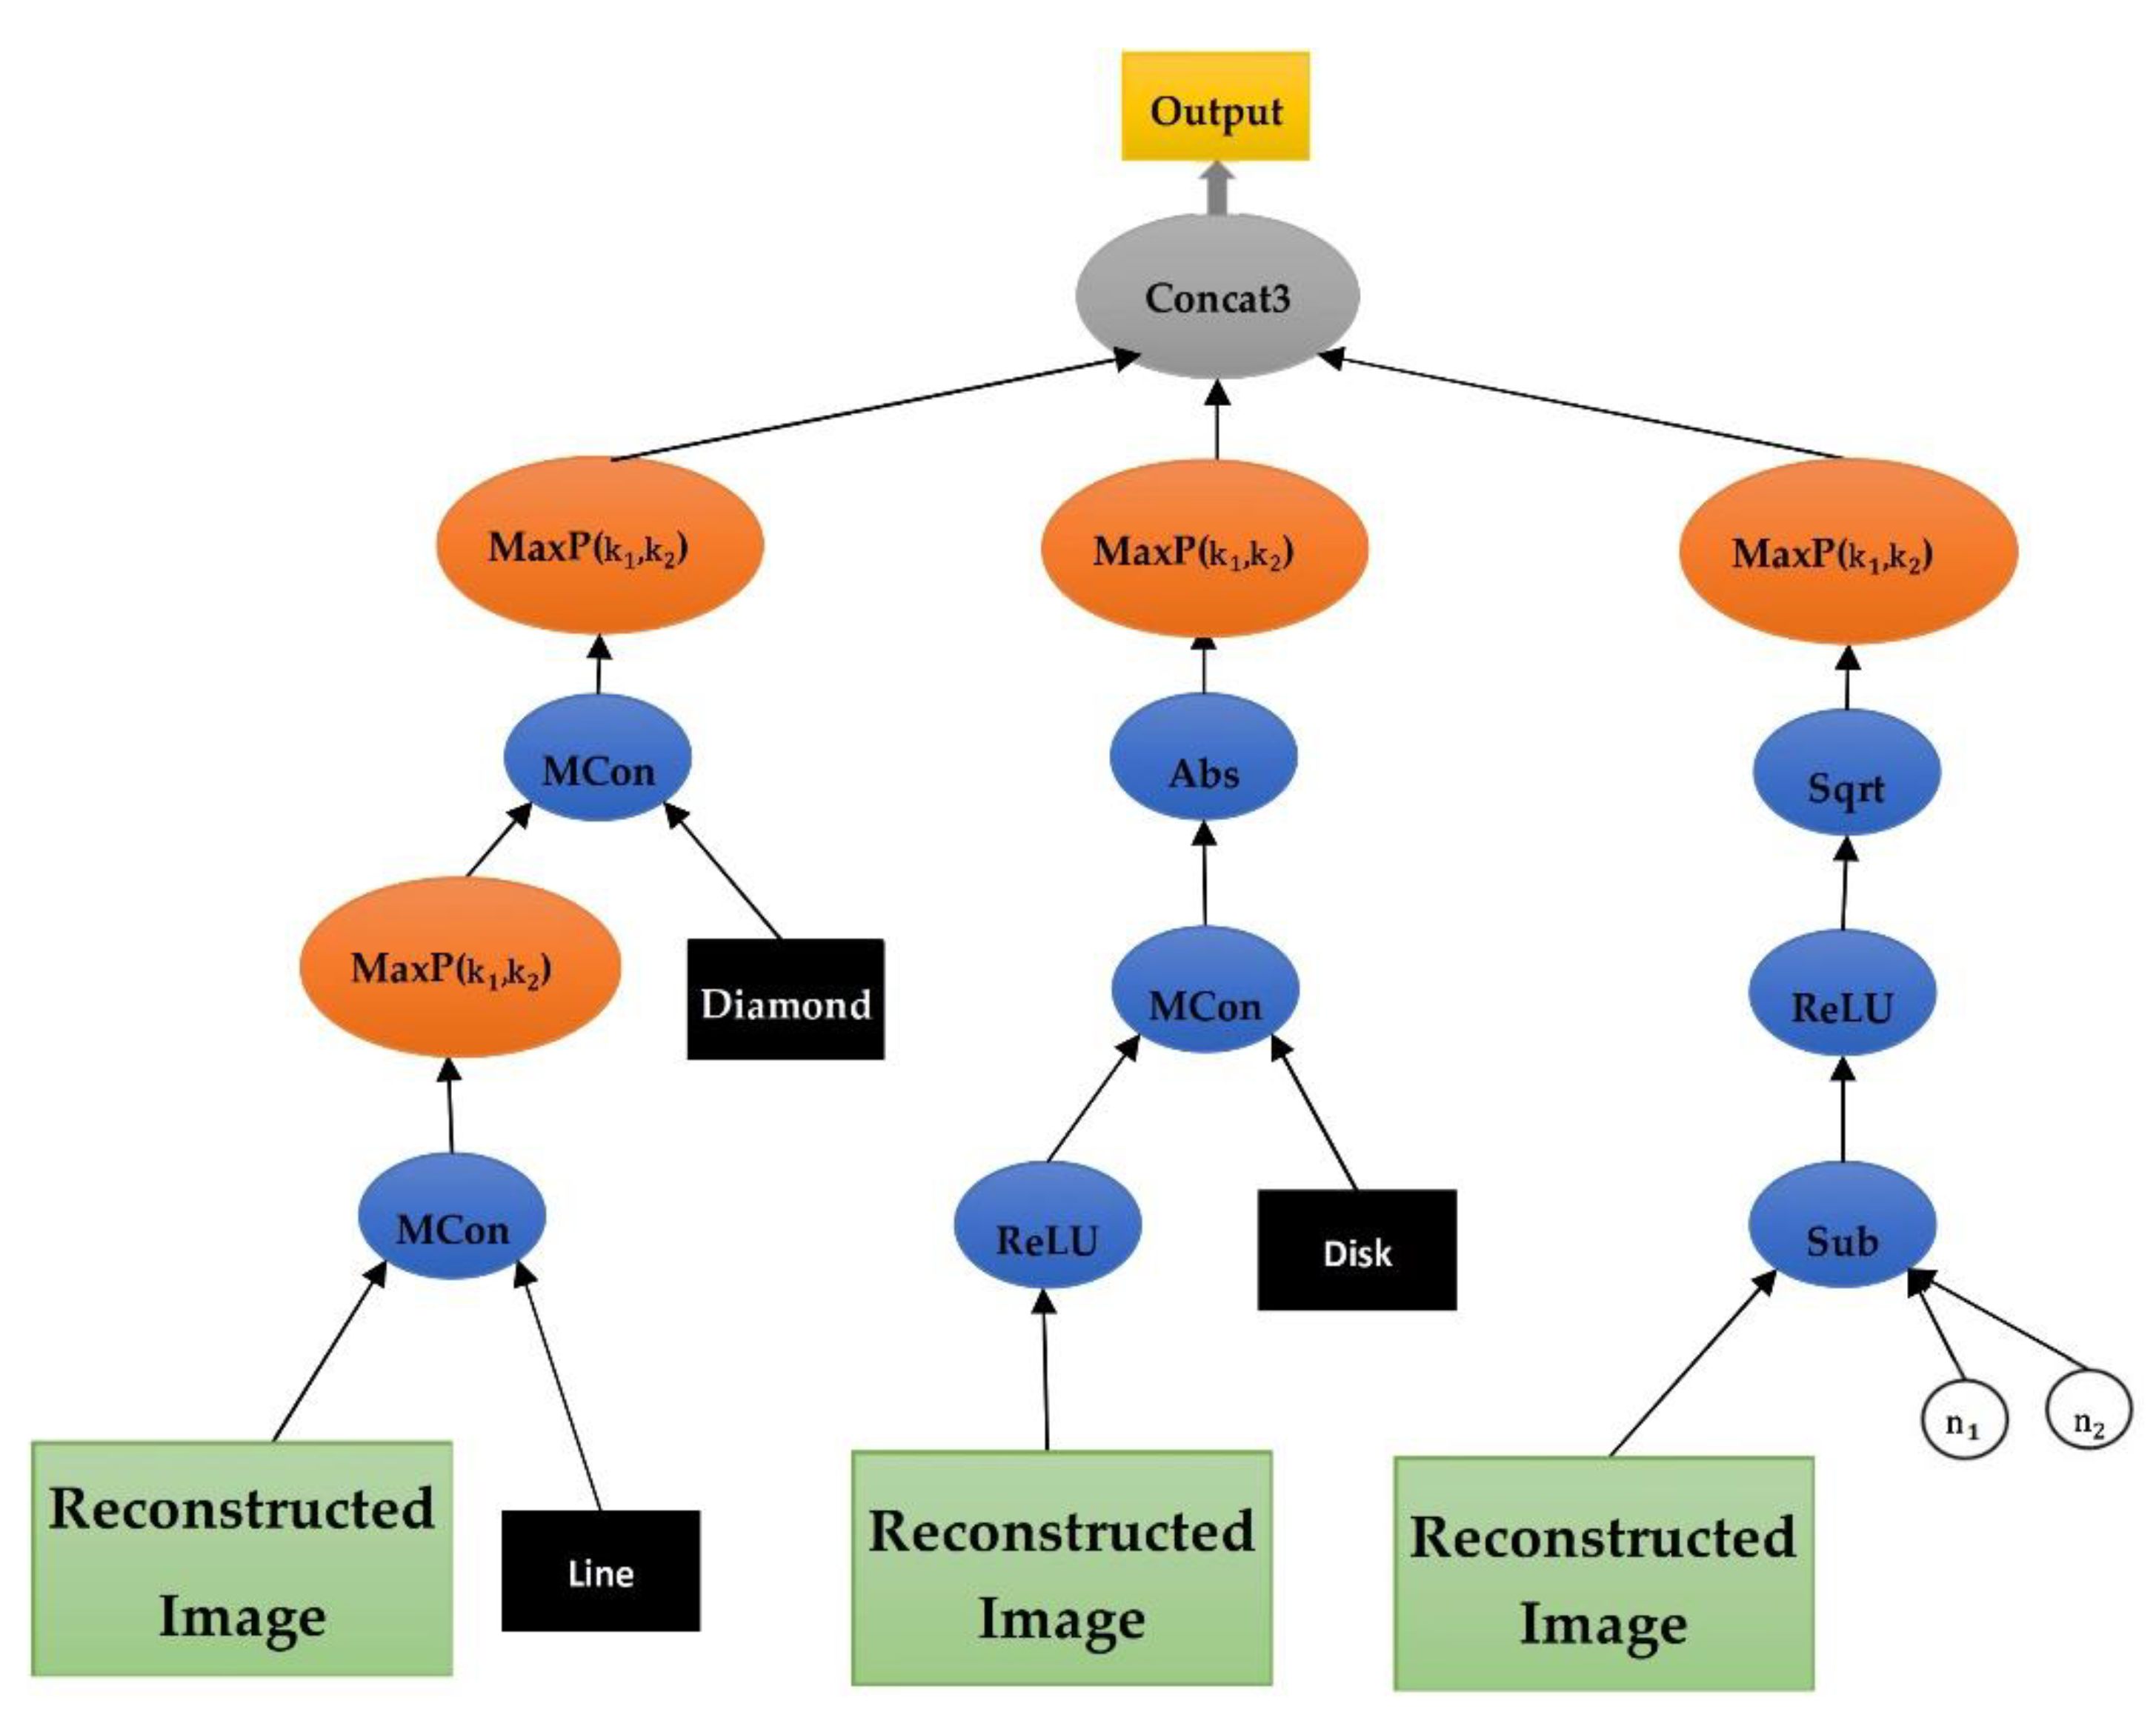
- Proposing a genetic programming-based model to learn deep features at ECG signals and employing several genes at GP to fusion these features.
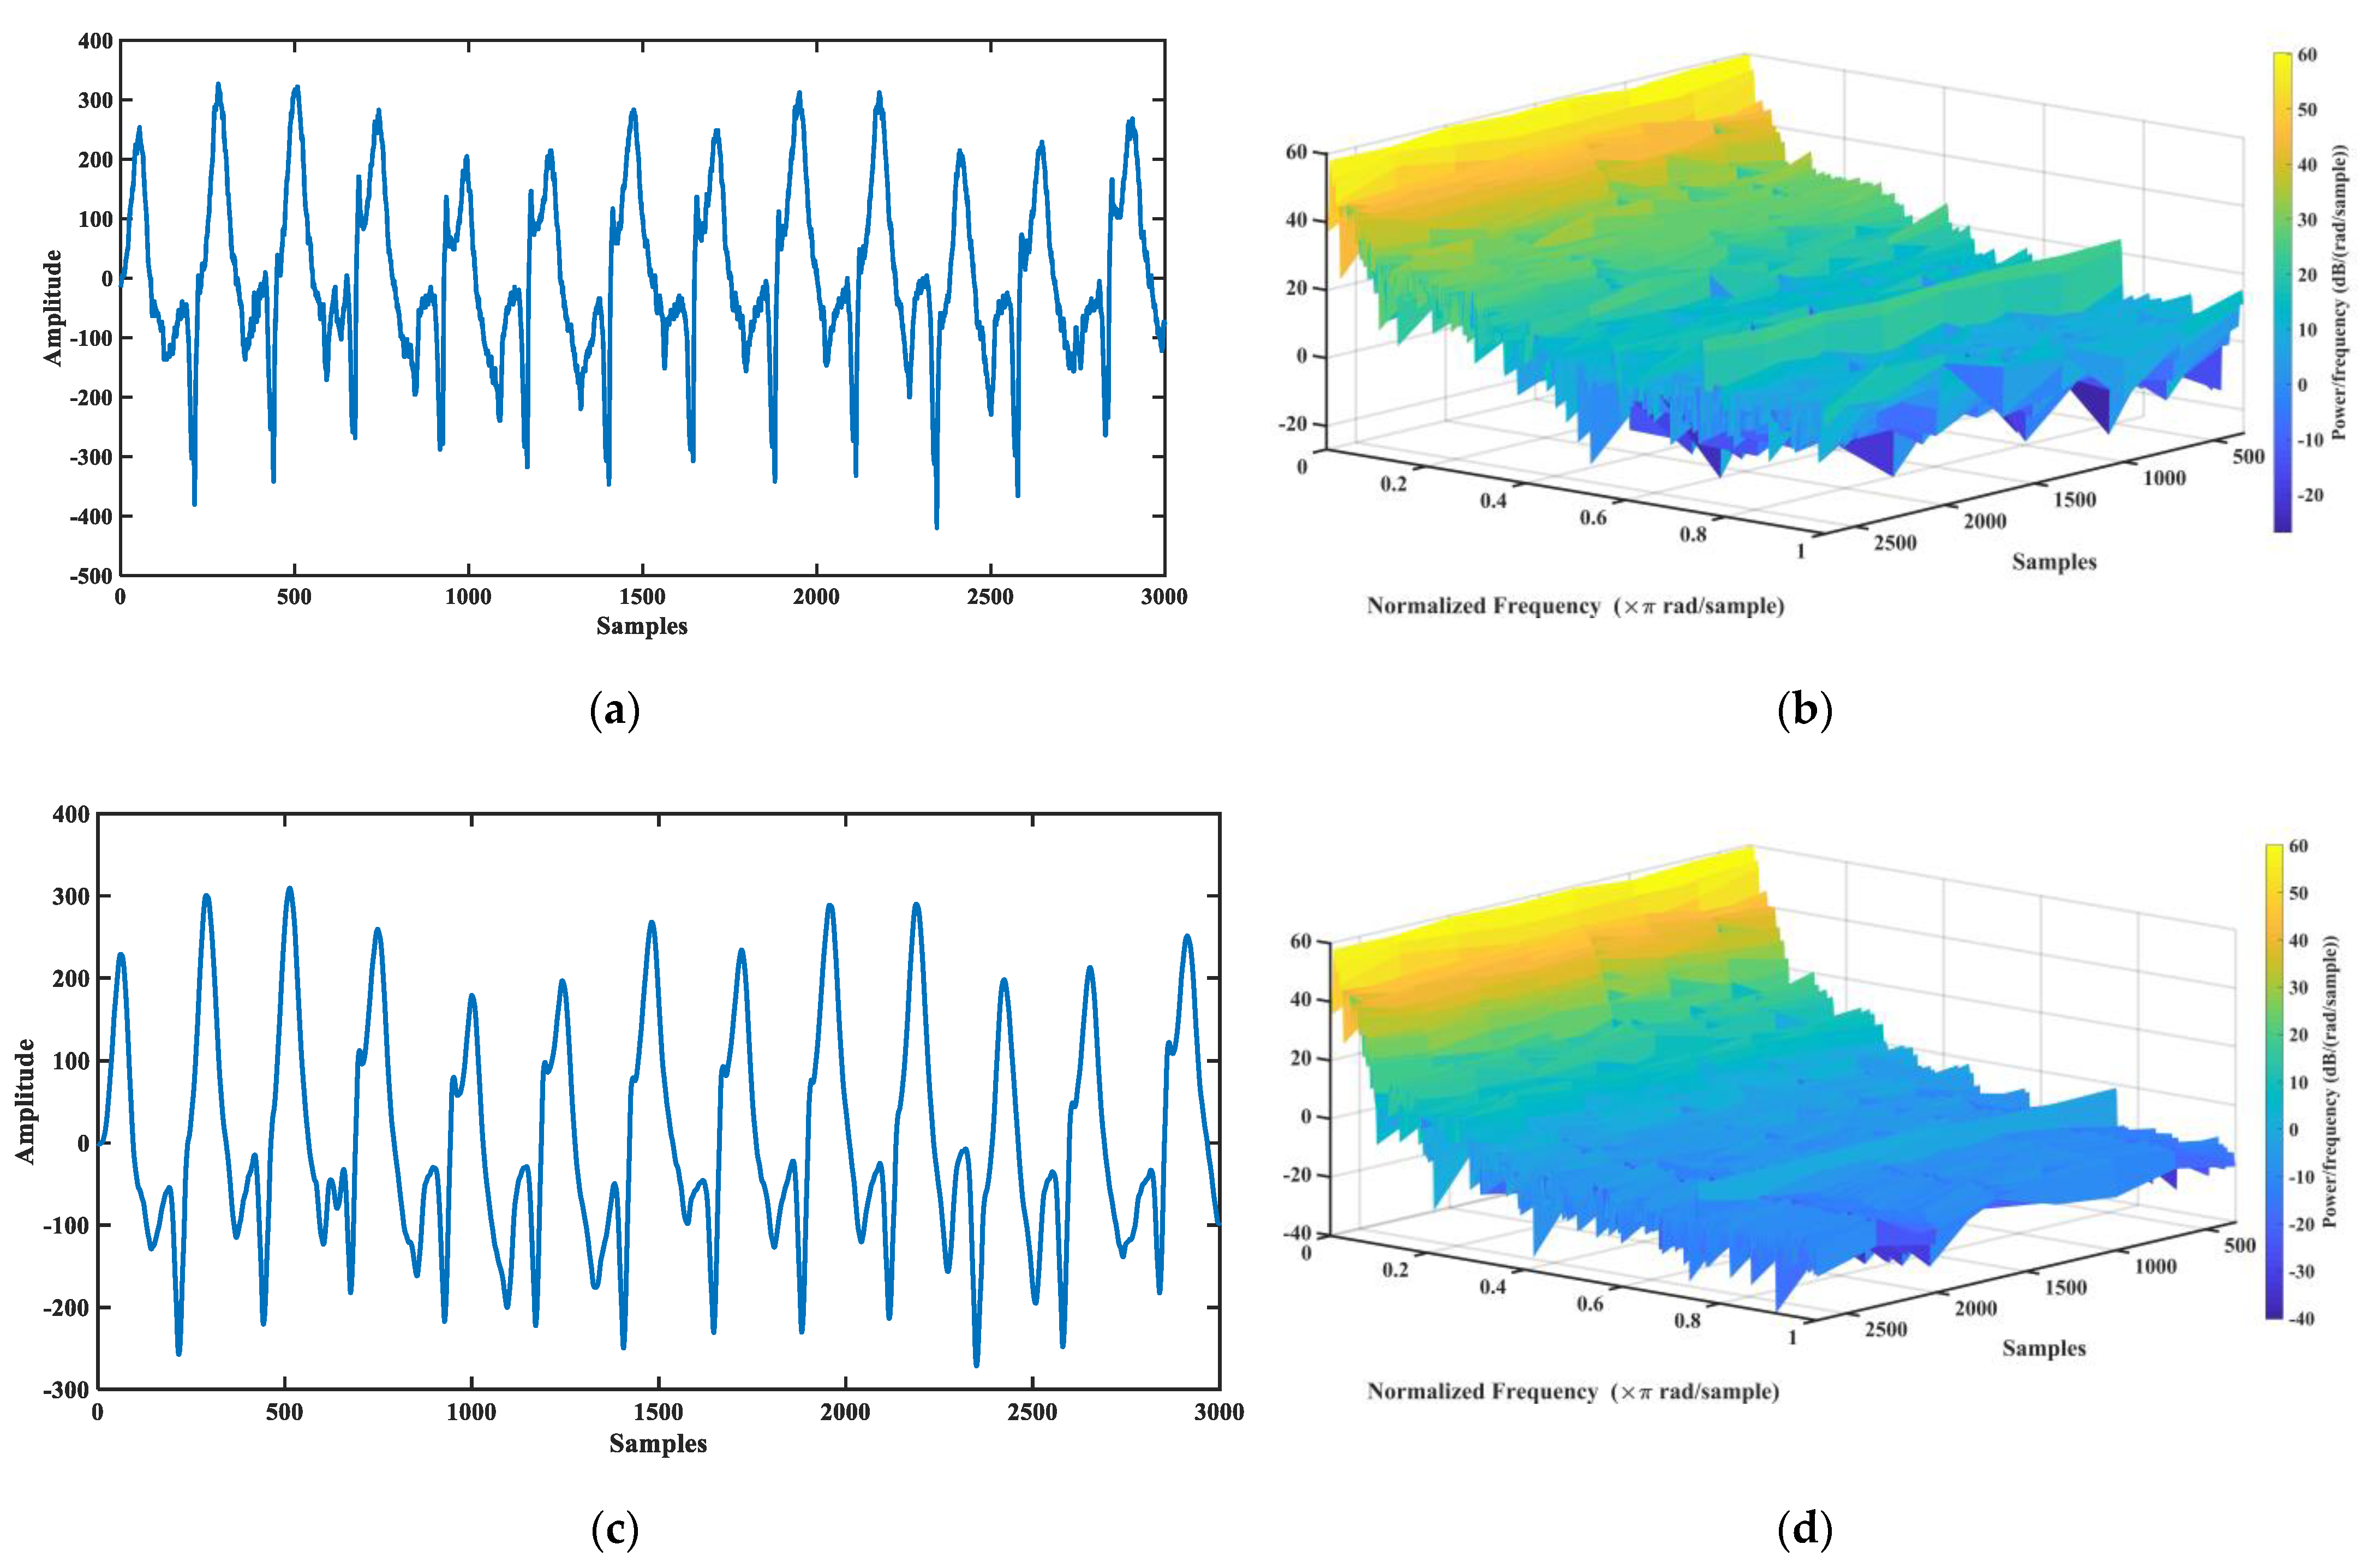
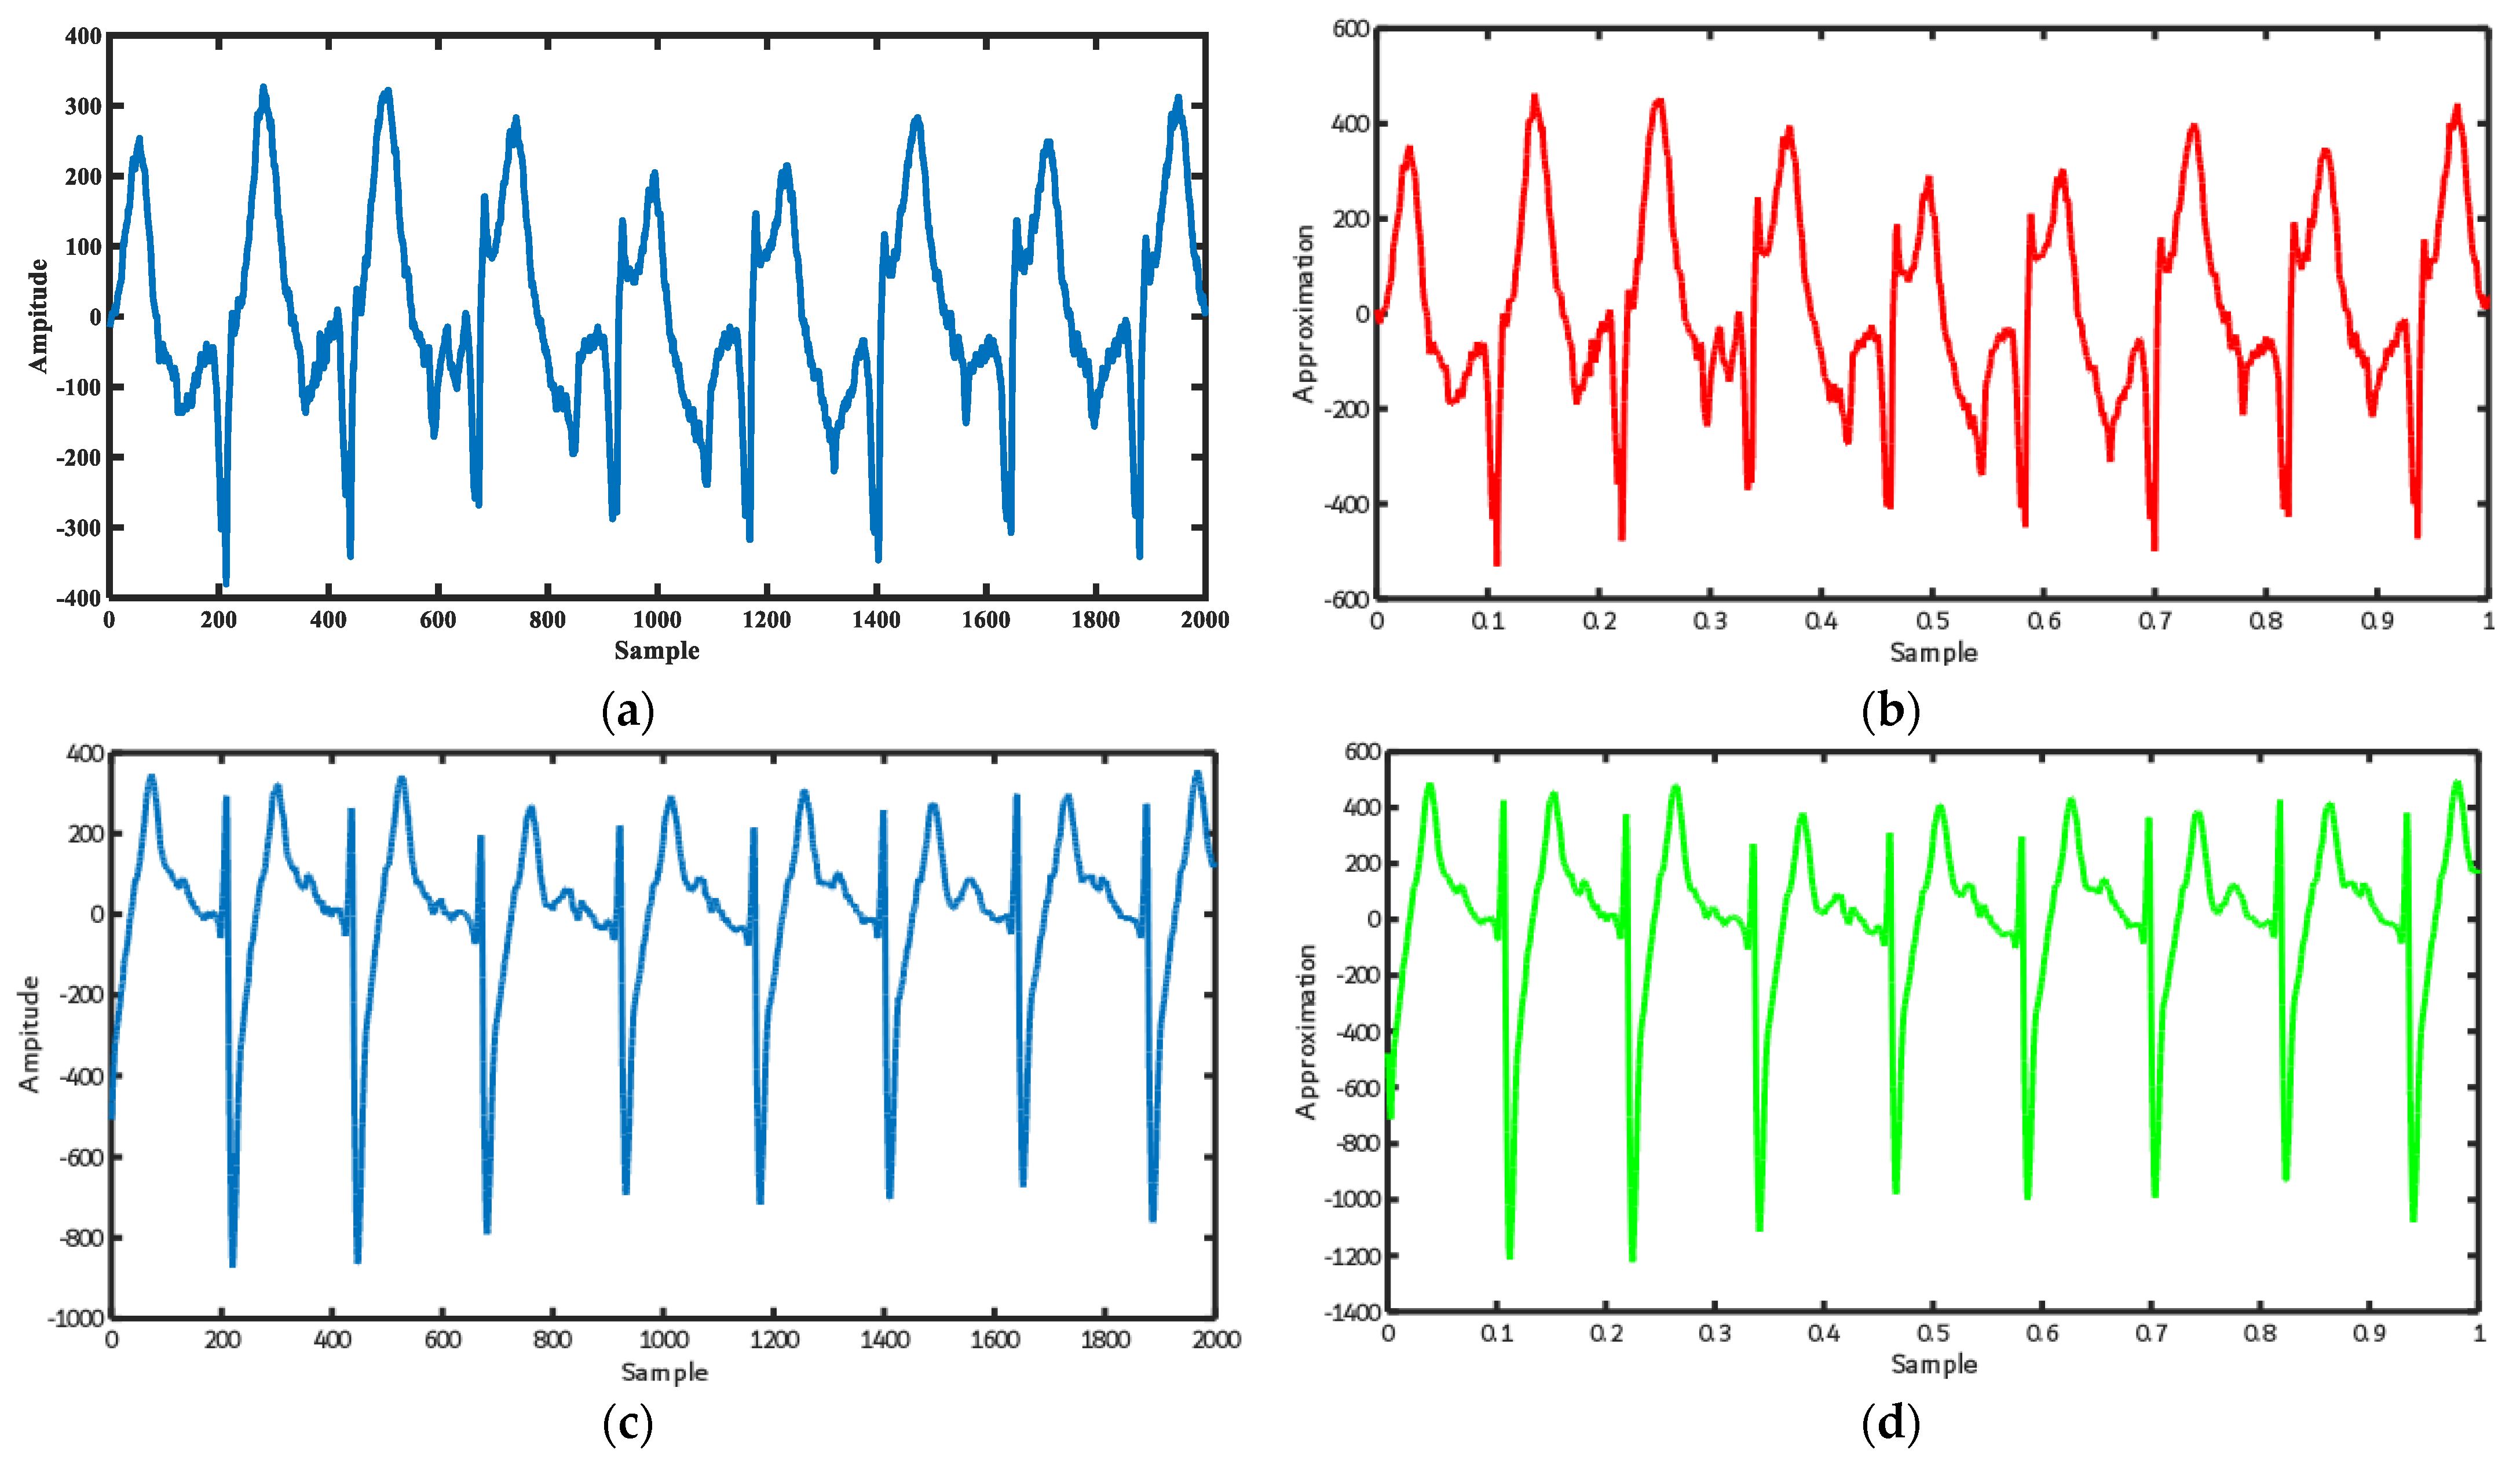
3.1. Wavelet Decomposition of ECG Signal
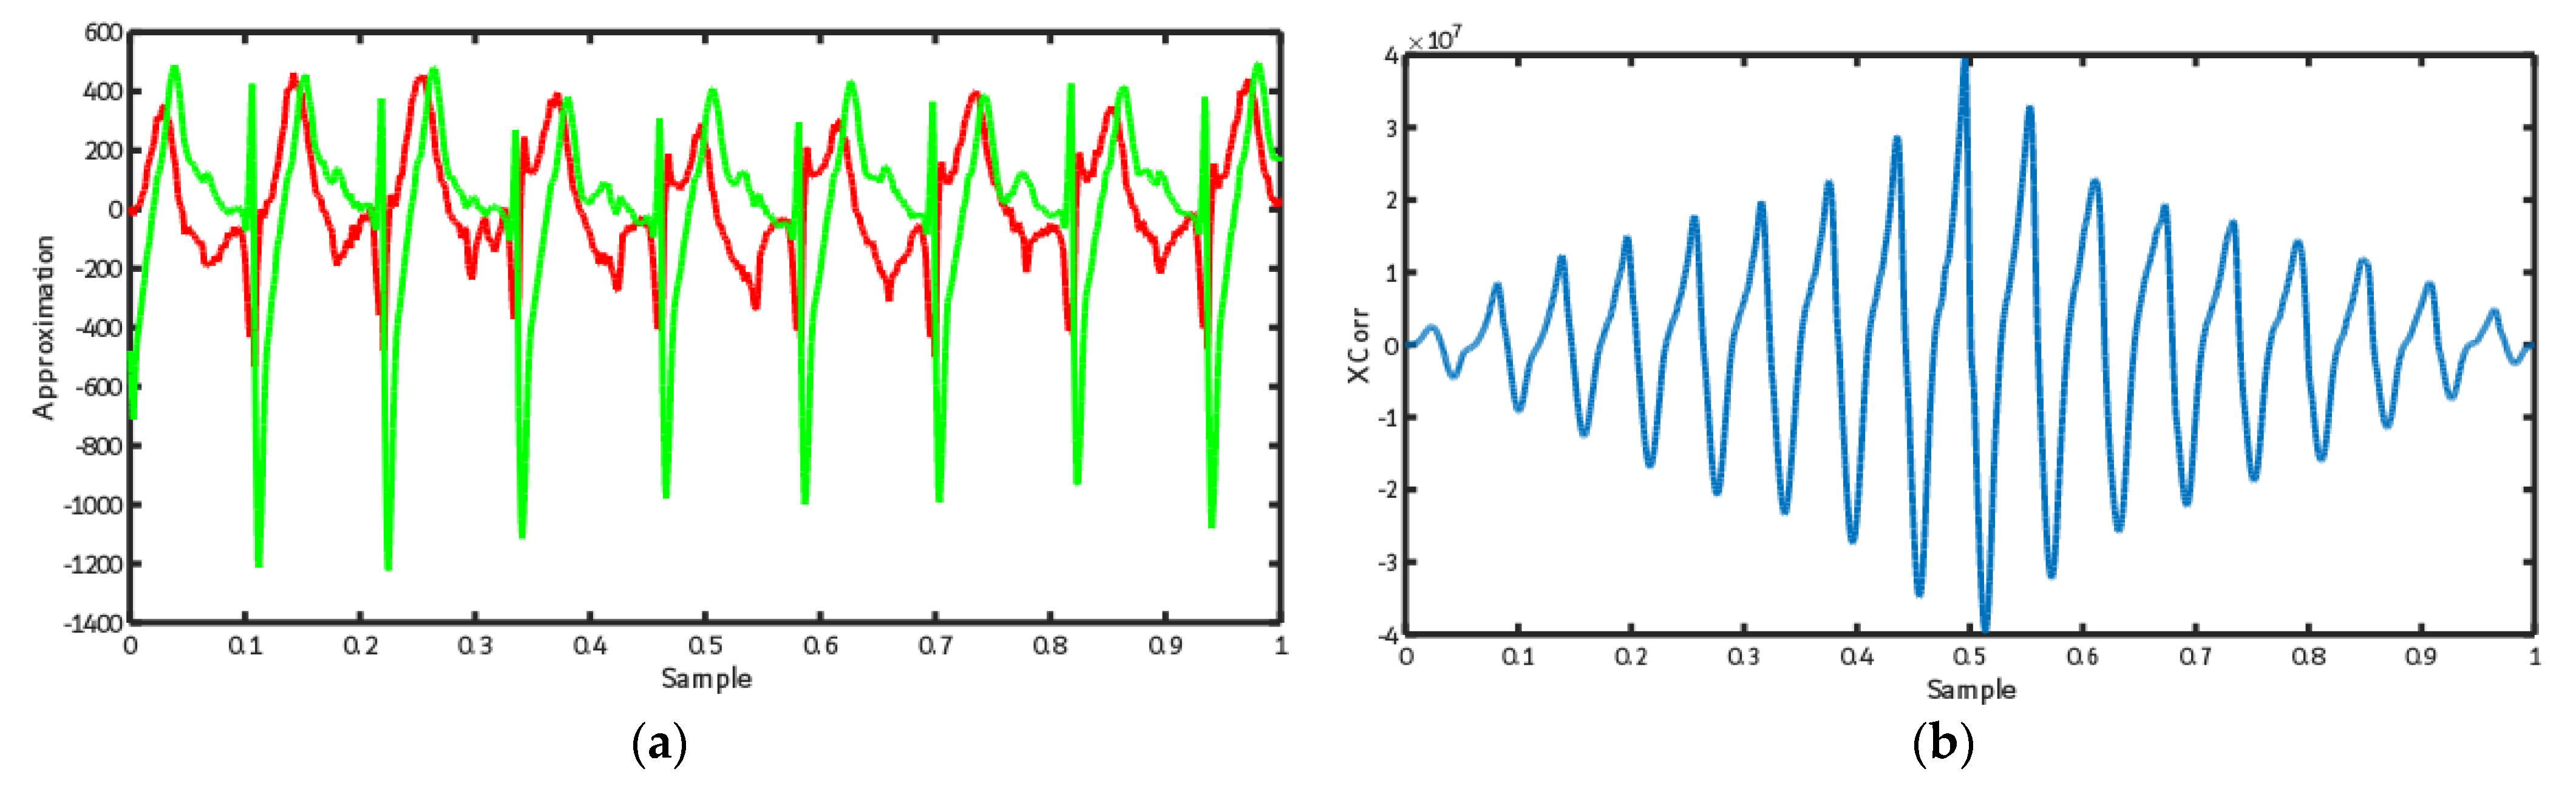
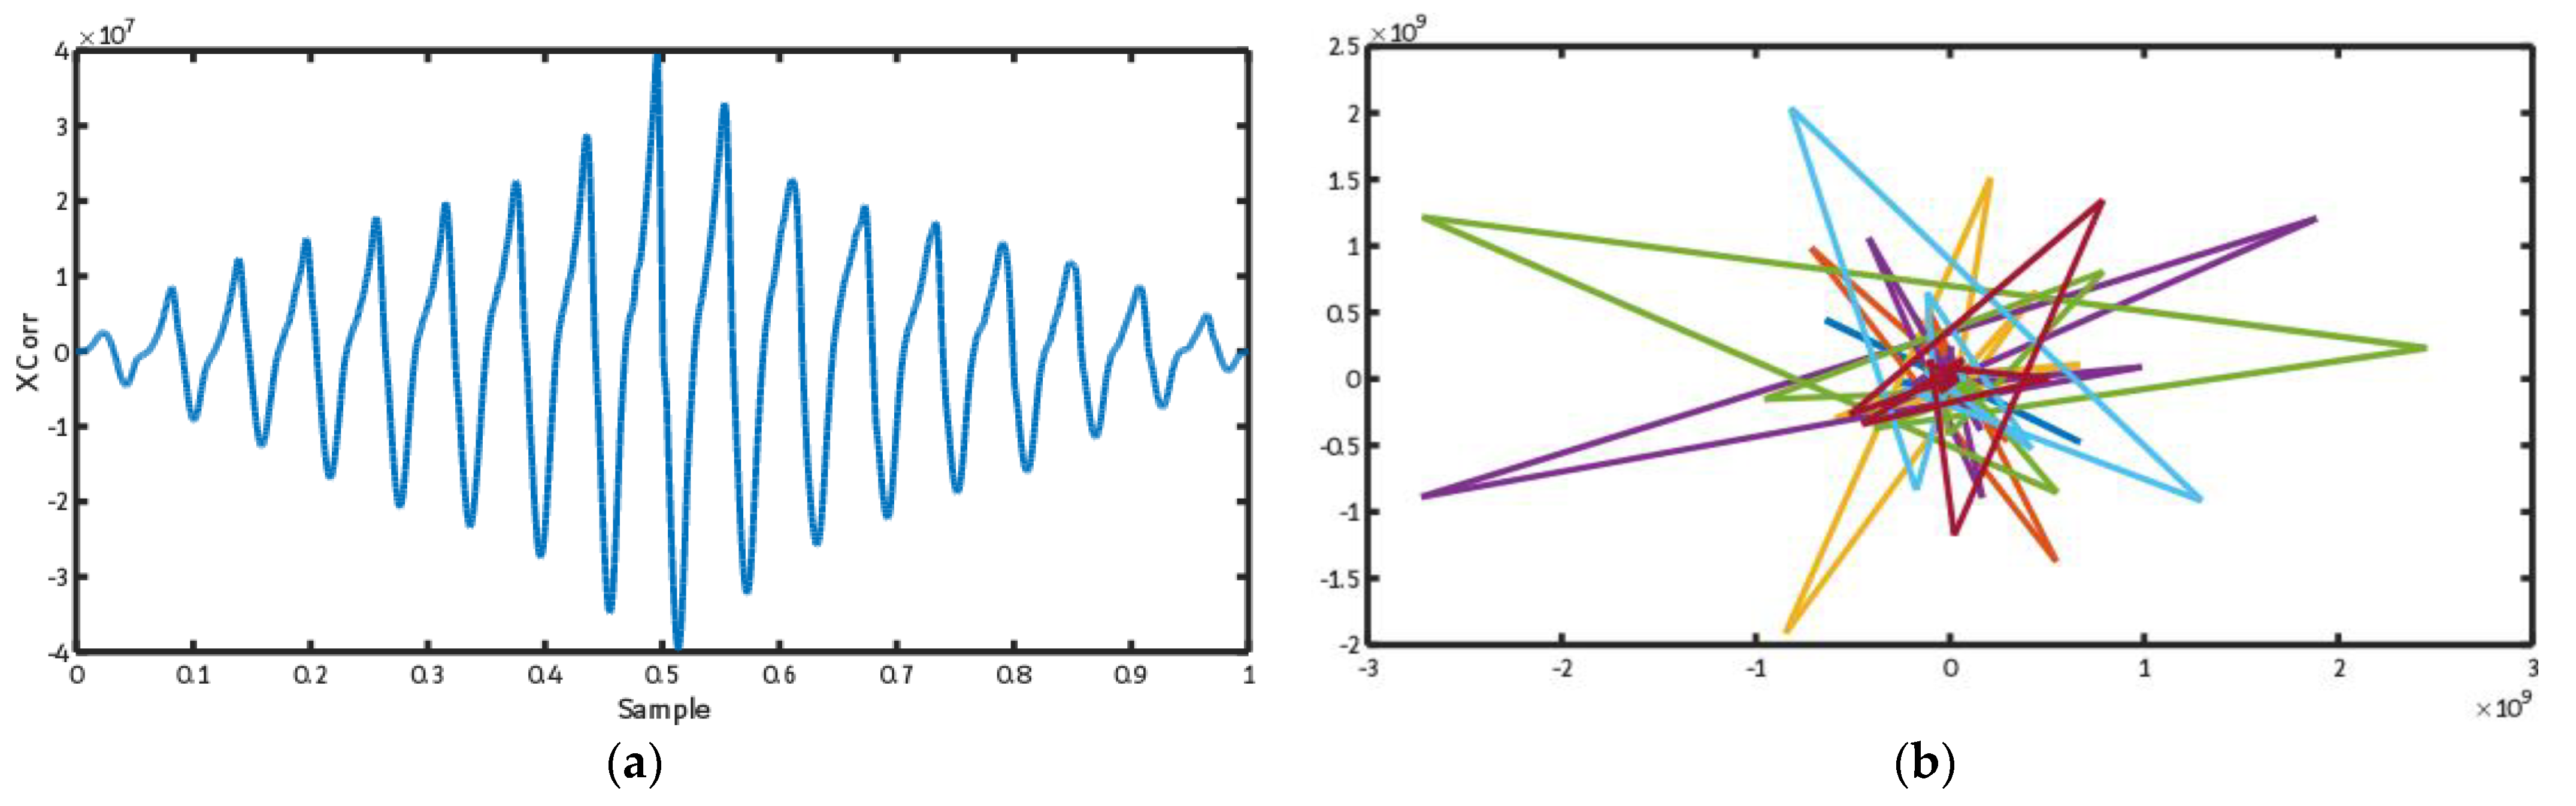
3.2. Calculate Cross-Correlation between 12-Lead ECG
3.3. ECG Trajectory Image Presentation
3.4. Feature Learning Using the Evolutionary CNN Tree
4. Results
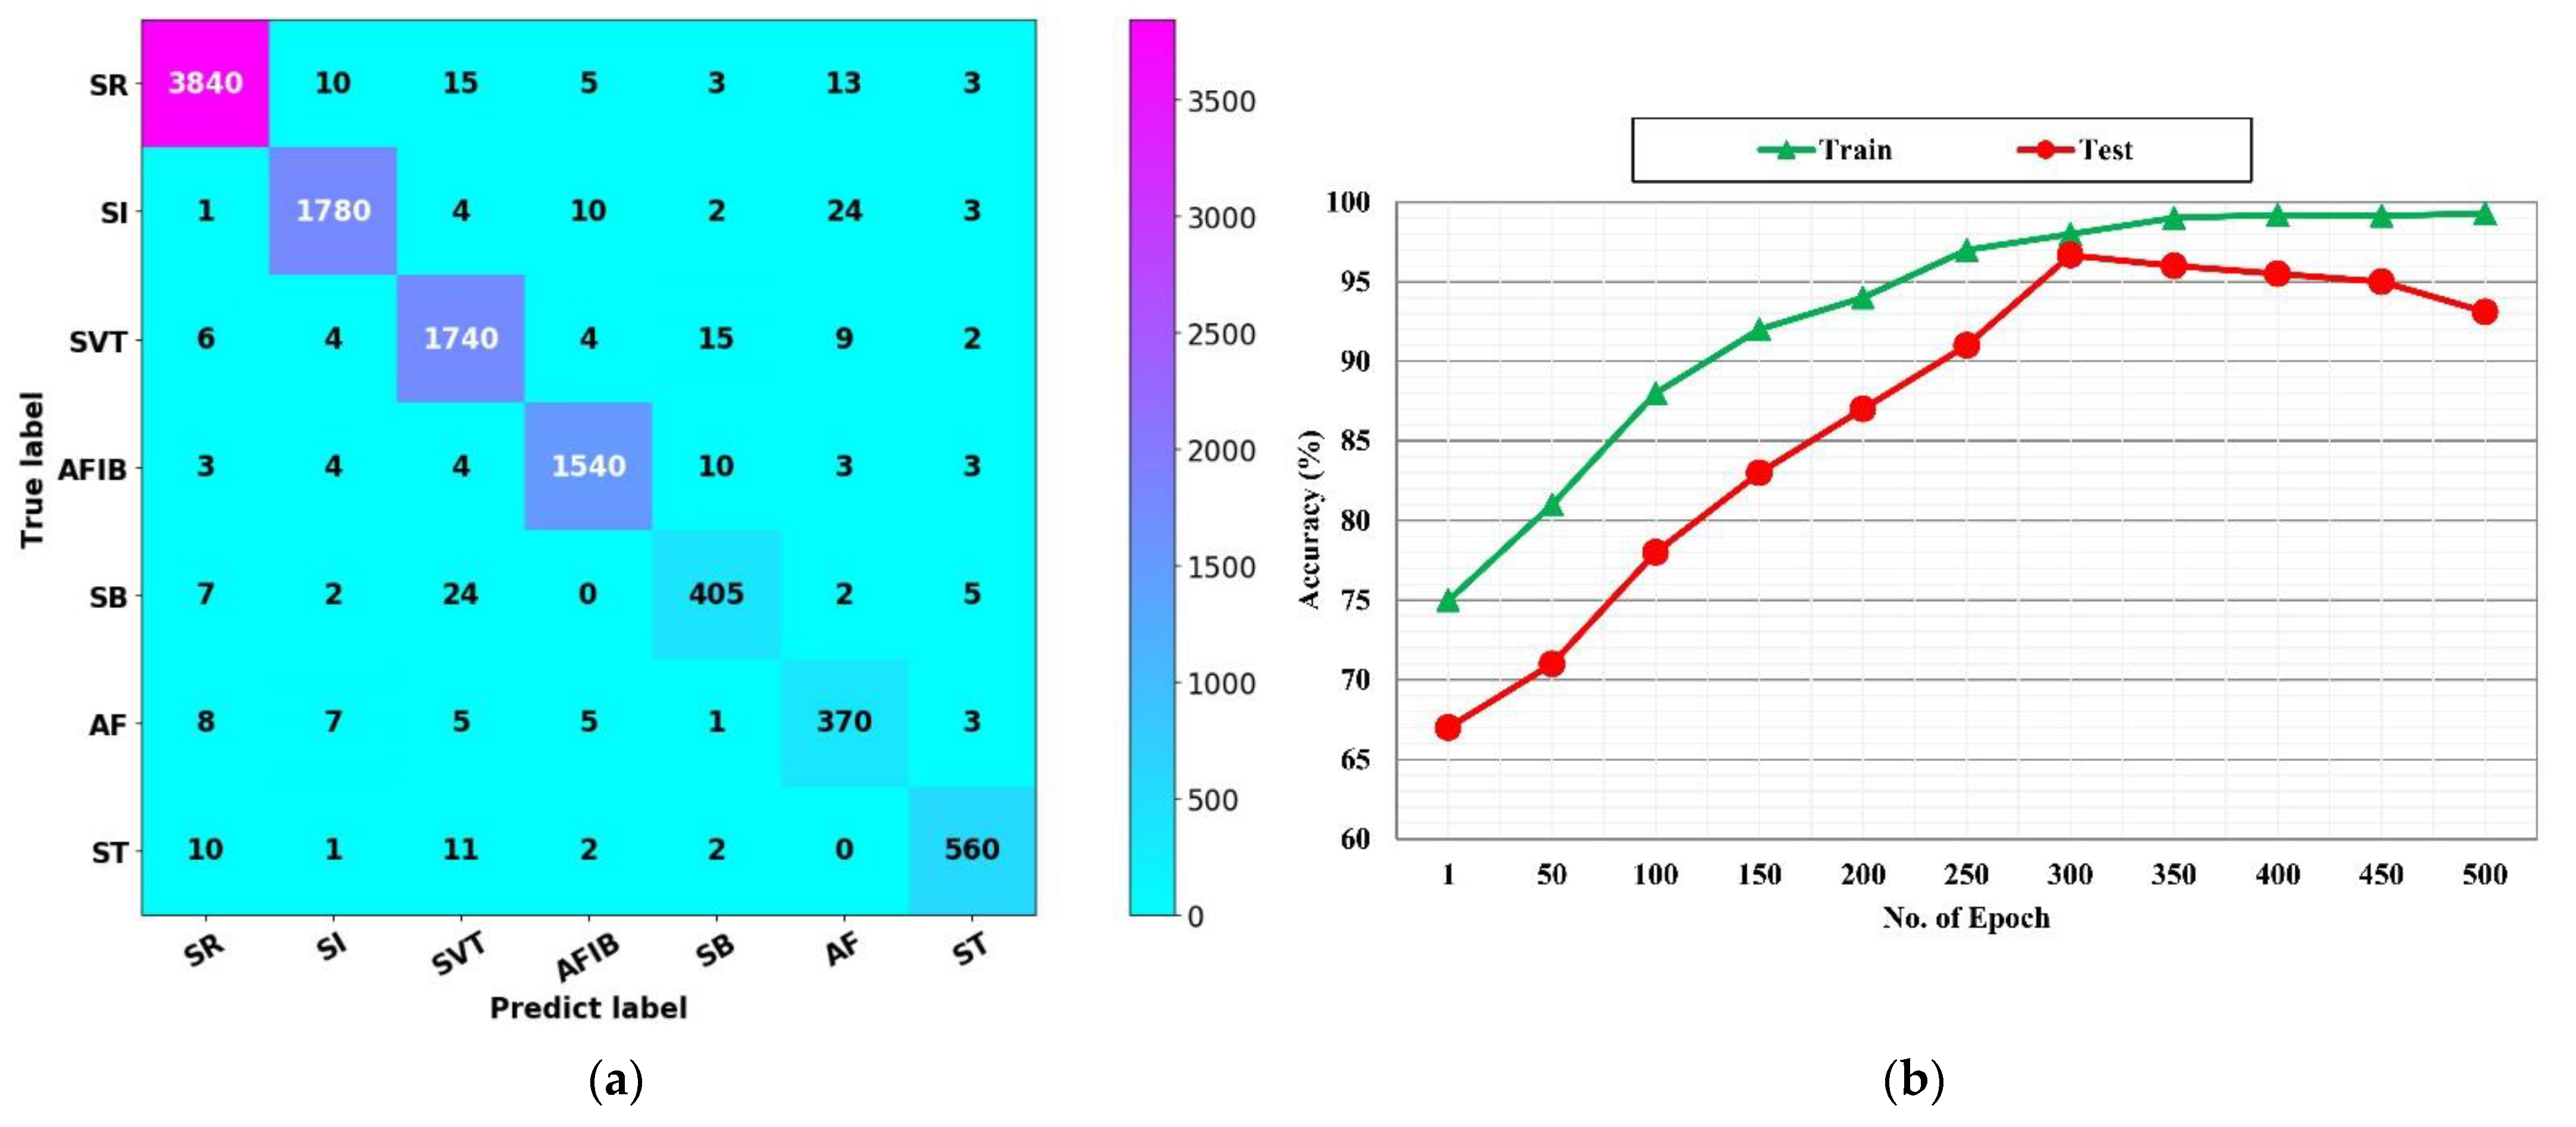
4.1. Results Analysis Method
4.2. Evaluating the Proposed Method through 12 Leads
4.3. Comparing the Proposed Fusion Algorithm with the Other Deep-Learning Methods
5. Conclusions
Author Contributions
Funding
Institutional Review Board Statement
Informed Consent Statement
Data Availability Statement
Conflicts of Interest
References
- Mozaffarian, D.; Benjamin, E.J.; Go, A.S.; Arnett, D.K.; Blaha, M.J.; Cushman, M.; Das, S.R.; de Ferranti, S.; Després, J.P.; Fullerton, H.J.; et al. Executive Summary: Heart Disease and Stroke Statistics—2016 Update: A Report from the American Heart Association. Circulation 2016, 133, 447–454. [Google Scholar] [CrossRef]
- Sansone, M.; Fusco, R.; Pepino, A.; Sansone, C. Electrocardiogram pattern recognition and analysis based on artificial neural networks and support vector machines: A review. J. Healthc. Eng. 2013, 4, 465–504. [Google Scholar] [CrossRef] [Green Version]
- Kusumoto, F. ECG Interpretation: From Pathophysiology to Clinical Application; Springer Nature: Berlin, Germany, 2020. [Google Scholar]
- Sepahvand, M.; Abdali-Mohammadi, F. A novel multi-lead ECG personal recognition based on signals functional and structural dependencies using time-frequency representation and evolutionary morphological CNN. Biomed. Signal Process. Control 2021, 68, 102766. [Google Scholar] [CrossRef]
- Tutuko, B.; Rachmatullah, M.N.; Darmawahyuni, A.; Nurmaini, S.; Tondas, A.E.; Passarella, R.; Partan, R.U.; Rifai, A.; Sapitri, A.I.; Firdaus, F. Short Single-Lead ECG Signal Delineation-Based Deep Learning: Implementation in Automatic Atrial Fibrillation Identification. Sensors 2022, 22, 2329. [Google Scholar] [CrossRef]
- Tadesse, G.A.; Javed, H.; Weldemariam, K.; Liu, Y.; Liu, J.; Chen, J.; Zhu, T. DeepMI: Deep multi-lead ECG fusion for identifying myocardial infarction and its occurrence-time. Artif. Intell. Med. 2021, 121, 102192. [Google Scholar] [CrossRef] [PubMed]
- Ge, Z.; Jiang, X.; Tong, Z.; Feng, P.; Zhou, B.; Xu, M.; Wang, Z.; Pang, Y. Multi-label correlation guided feature fusion network for abnormal ECG diagnosis. Knowl.-Based Syst. 2021, 233, 107508. [Google Scholar] [CrossRef]
- Ahmad, Z.; Tabassum, A.; Guan, L.; Khan, N.M. ECG heartbeat classification using multimodal fusion. IEEE Access 2021, 9, 100615–100626. [Google Scholar] [CrossRef]
- Ahmad, Z.; Tabassum, A.; Guan, L.; Khan, N. Ecg Heart-Beat Classification Using Multimodal Image Fusion; IEEE: Piscataway, NJ, USA, 2021. [Google Scholar]
- Vijayakumar, T.; Vinothkanna, R.; Duraipandian, M. Fusion based feature extraction analysis of ECG signal interpretation–a systematic approach. J. Artif. Intell. 2021, 3, 1–16. [Google Scholar]
- Li, H.; Boulanger, P. Structural Anomalies Detection from Electrocardiogram (ECG) with Spectrogram and Handcrafted Features. Sensors 2022, 22, 2467. [Google Scholar] [CrossRef]
- Zhang, X.; Jiang, M.; Wu, W.; de Albuquerque, V.H.C. Hybrid feature fusion for classification optimization of short ECG segment in IoT based intelligent healthcare system. Neural Comput. Appl. 2021, 1–15. [Google Scholar] [CrossRef]
- Mishra, A.; Dharahas, G.; Gite, S.; Kotecha, K.; Koundal, D.; Zaguia, A.; Kaur, M.; Lee, H.-N. ECG Data Analysis with Denoising Approach and Customized CNNs. Sensors 2022, 22, 1928. [Google Scholar] [CrossRef]
- Sepahvand, M.; Abdali-Mohammadi, F. A Novel Method for Reducing Arrhythmia Classification from 12-Lead ECG Signals to Single-Lead ECG with Minimal Loss of Accuracy through Teacher-Student Knowledge Distillation. Inf. Sci. 2022, 593, 64–77. [Google Scholar] [CrossRef]
- Li, W.; Tang, Y.M.; Yu, K.M.; To, S. SLC-GAN: An Automated Myocardial Infarction Detection Model Based on Generative Adversarial Networks and Convolutional Neural Networks with Single-Lead Electrocardiogram Synthesis. Inf. Sci. 2022, 589, 738–750. [Google Scholar] [CrossRef]
- Sepahvand, M.; Abdali-Mohammadi, F. A Deep Learning-Based Compression Algorithm for 9-DOF Inertial Measurement Unit Signals Along with an Error Compensating Mechanism. IEEE Sens. J. 2019, 19, 632–640. [Google Scholar] [CrossRef]
- Sepahvand, M.; Abdali-Mohammadi, F.; Taherkordi, A. Teacher–student knowledge distillation based on decomposed deep feature representation for intelligent mobile applications. Expert Syst. Appl. 2022, 202, 117474. [Google Scholar] [CrossRef]
- Sepahvand, M.; Abdali-Mohammadi, F. A novel representation in genetic programming for ensemble classification of human motions based on inertial signals. Expert Syst. Appl. 2021, 185, 115624. [Google Scholar] [CrossRef]
- Zheng, J.; Zhang, J.; Danioko, S.; Yao, H.; Guo, H.; Rakovski, C. A 12-lead electrocardiogram database for arrhythmia research covering more than 10,000 patients. Sci. Data 2020, 7, 48. [Google Scholar] [CrossRef] [Green Version]
- Evans, B.; Al-Sahaf, H.; Xue, B.; Zhang, M. Evolutionary Deep Learning: A Genetic Programming Approach to Image Classification. In Proceedings of the 2018 IEEE Congress on Evolutionary Computation (CEC), Rio de Janeiro, Brazil, 8–13 July 2018. [Google Scholar]
- Goshvarpour, A.; Goshvarpour, A. Human identification using a new matching Pursuit-based feature set of ECG. Comput. Methods Programs Biomed. 2019, 172, 87–94. [Google Scholar] [CrossRef]
- Sepahvand, M.; Abdali-Mohammadi, F. A New Learning-based Spatiotemporal Descriptor for Online Symbol Recognition. J. AI Data Min. 2022, 10, 75–86. [Google Scholar]
- Mellouli, D.; Hamdani, T.M.; Sanchez-Medina, J.J.; Ben Ayed, M.; Alimi, A.M. Morphological Convolutional Neural Network Architecture for Digit Recognition. IEEE Trans. Neural Netw. Learn. Syst. 2019, 30, 2876–2885. [Google Scholar] [CrossRef]
- Sepahvand, M.; Abdali-Mohammadi, F.; Mardukhi, F. Evolutionary Metric-Learning-Based Recognition Algorithm for Online Isolated Persian/Arabic Characters, Reconstructed Using Inertial Pen Signals. IEEE Trans. Cybern. 2017, 47, 2872–2884. [Google Scholar] [CrossRef]
- Sepahvand, M.; Abdali-Mohammadi, F. Overcoming limitation of dissociation between MD and MI classifications of breast cancer histopathological images through a novel decomposed feature-based knowledge distillation method. Comput. Biol. Med. 2022, 145, 105413. [Google Scholar] [CrossRef]
- Fujita, H.; Cimr, D. Computer Aided detection for fibrillations and flutters using deep convolutional neural network. Inf. Sci. 2019, 486, 231–239. [Google Scholar] [CrossRef]
- Oh, S.L.; Ng, E.Y.; San Tan, R.; Acharya, U.R. Automated beat-wise arrhythmia diagnosis using modified U-net on extended electrocardiographic recordings with heterogeneous arrhythmia types. Comput. Biol. Med. 2019, 105, 92–101. [Google Scholar] [CrossRef]
- Oh, S.L.; Ng, E.Y.; San Tan, R.; Acharya, U.R. Automated diagnosis of arrhythmia using combination of CNN and LSTM techniques with variable length heart beats. Comput. Biol. Med. 2018, 102, 278–287. [Google Scholar] [CrossRef]
- Yildirim, O.; Talo, M.; Ciaccio, E.J.; Tan, R.S.; Acharya, U.R. Accurate deep neural network model to detect cardiac arrhythmia on more than 10,000 individual subject ECG records. Comput. Methods Programs Biomed. 2020, 197, 105740. [Google Scholar] [CrossRef]
- Acharya, U.R.; Oh, S.L.; Hagiwara, Y.; Tan, J.H.; Adam, M.; Gertych, A.; San Tan, R. A deep convolutional neural network model to classify heartbeats. Comput. Biol. Med. 2017, 89, 389–396. [Google Scholar] [CrossRef]
- Xu, S.S.; Mak, M.W.; Cheung, C.C. Towards End-to-End ECG Classification with Raw Signal Extraction and Deep Neural Networks. IEEE J. Biomed. Health Inform. 2019, 23, 1574–1584. [Google Scholar] [CrossRef]
- Gao, J.; Zhang, H.; Lu, P.; Wang, Z. An effective LSTM recurrent network to detect arrhythmia on imbalanced ECG dataset. J. Healthc. Eng. 2019, 2019, 6320651. [Google Scholar] [CrossRef] [Green Version]
- Hannun, A.Y.; Rajpurkar, P.; Haghpanahi, M.; Tison, G.H.; Bourn, C.; Turakhia, M.P.; Ng, A.Y. Cardiologist-level arrhythmia detection and classification in ambulatory electrocardiograms using a deep neural network. Nat. Med. 2019, 25, 65–69. [Google Scholar] [CrossRef]
- Yıldırım, Ö.; Pławiak, P.; Tan, R.S.; Acharya, U.R. Arrhythmia detection using deep convolutional neural network with long duration ECG signals. Comput. Biol. Med. 2018, 102, 411–420. [Google Scholar] [CrossRef] [PubMed]
- Shaker, A.M.; Tantawi, M.; Shedeed, H.A.; Tolba, M.F. Generalization of Convolutional Neural Networks for ECG Classification Using Generative Adversarial Networks. IEEE Access 2020, 8, 35592–35605. [Google Scholar] [CrossRef]
- Xiong, Z.; Nash, M.P.; Cheng, E.; Fedorov, V.V.; Stiles, M.K.; Zhao, J. ECG signal classification for the detection of cardiac arrhythmias using a convolutional recurrent neural network. Physiol. Meas. 2018, 39, 094006. [Google Scholar] [CrossRef] [PubMed]
- Mousavi, S.; Fotoohinasab, A.; Afghah, F. Single-modal and multi-modal false arrhythmia alarm reduction using attention-based convolutional and recurrent neural networks. PLoS ONE 2020, 15, e0226990. [Google Scholar] [CrossRef]
- Wu, Q.; Sun, Y.; Yan, H.; Wu, X. ECG signal classification with binarized convolutional neural network. Comput. Biol. Med. 2020, 121, 103800. [Google Scholar] [CrossRef]
- Salem, M.; Taheri, S.; Yuan, J. ECG Arrhythmia Classification Using Transfer Learning from 2-Dimensional Deep CNN Features. In Proceedings of the 2018 IEEE Biomedical Circuits and Systems Conference (BioCAS), Cleveland, OH, USA, 17–19 October 2018. [Google Scholar]
- Xia, Y.; Wulan, N.; Wang, K.; Zhang, H. Detecting atrial fibrillation by deep convolutional neural networks. Comput. Biol. Med. 2018, 93, 84–92. [Google Scholar] [CrossRef]
- Mehari, T.; Strodthoff, N. Self-supervised representation learning from 12-lead ECG data. Comput. Biol. Med. 2022, 141, 105114. [Google Scholar] [CrossRef]
- Rahul, J.; Sharma, L.D. Automatic cardiac arrhythmia classification based on hybrid 1-D CNN and Bi-LSTM model. Biocybern. Biomed. Eng. 2022, 42, 312–324. [Google Scholar] [CrossRef]
- Kang, J.; Wen, H. A study on several critical problems on arrhythmia detection using varying-dimensional electrocardiography. Physiol. Meas. 2022. [Google Scholar] [CrossRef]
- Sepahvand, M.; Abdali-Mohammadi, F. A Meta-heuristic Model for Human Micro Movements Recognition Based on Inertial Sensors. Tabriz J. Electr. Eng. 2019, 49, 221–234. [Google Scholar]
- Abdali-Mohammadi, F.; Bajalan, V.; Fathi, A. Toward a Fault Tolerant Architecture for Vital Medical-Based Wearable Computing. J. Med. Syst. 2015, 39, 149. [Google Scholar] [CrossRef]
- Lobabi-Mirghavami, H.; Abdali-Mohammadi, F.; Fathi, A. A Novel Grammar-Based Approach to Atrial Fibrillation Arrhythmia Detection for Pervasive Healthcare Environments. J. Comput. Secur. 2015, 2, 155–163. [Google Scholar]


| Description | Method |
|---|---|
| ) | |
| ) | |
| matrix | ) |
| matrix | ) |
| matrix | ) |
| ) | |
| matrices together as a diagram | ) |
| matrices together as a diagram | ) |
| matrices together as a diagram | ) |
| Description | Value Range | Terminal |
|---|---|---|
| The input matrix includes functional relativity information | [−1,1] | |
| in MConv function | {0,1} [24] | |
| in MConv function | {0,1} | |
| in MConv function | {0,1} | |
| Random numbers that are the inputs of Add and Sub functions. | [0.000,1.000] | |
| The kernel measurement of MaxP function | {2,4} |
| Predicted Label | ||||||||
|---|---|---|---|---|---|---|---|---|
| AF | SB | SVT | ST | SR | AFIB | SI | ||
| True Label | AF | |||||||
| SB | ||||||||
| SVT | ||||||||
| ST | ||||||||
| SR | ||||||||
| AFIB | ||||||||
| SI | ||||||||
| Class Name | (%) | |||
|---|---|---|---|---|
| AF | 97.47 ± 0.5 | 97.93 ± 0.4 | 96.64 ± 0.2 | 97.25 ± 0.3 |
| SB | 97.83 ± 0.7 | 97.59 ± 0.6 | 96.26 ± 0.7 | 97.45 ± 0.7 |
| SVT | 97.58 ± 0.8 | 97.37 ± 0.6 | 96.44 ± 1.0 | 96.87 ± 1.0 |
| ST | 96.93 ± 0.0 | 97.93 ± 0.4 | 96.69 ± 0.6 | 96.36 ± 0.3 |
| SR | 97.60 ± 0.2 | 97.96 ± 1.1 | 97.69 ± 0.8 | 96.70 ± 1.0 |
| AFIB | 98.94 ± 0.7 | 96.79 ± 1.0 | 97.00 ± 1.1 | 97.56 ± 1.1 |
| SI | 96.88 ± 0.4 | 96.38 ± 0.7 | 97.47 ± 0.7 | 97.47 ± 0.7 |
| Average | 97.09 ± 0.7 | 96.88 ± 0.7 | 97.42 ± 0.7 | 97.60 ± 0.5 |
| Training Phase | Validation Phase | Testing Phase | |
|---|---|---|---|
| CPU Time | 15:10:30 | 00:30:50 | 00:31:40 |
| References | #Subjects | #Records | #Rhythm | Method | Performance |
|---|---|---|---|---|---|
| Acharya et al. [30] | 47 | 109,449 | 5 Class | CNN | Acc: 94.03 |
| Xu et al. [31] | 22 | 50,977 | 5 Class | DNN | Acc: 93.10 |
| Gao et al. [32] | - | 93,371 | 8 Heartbeats | LSTM | Acc: 90.26 |
| Hannun et al. [33] | 53,549 | 91,232 | 12 Rhythm | CNN | F1: 83.00 |
| Yildirim et al. [34] | 45 | 1000 | 5 Heartbeats | CNN | Acc: 91.33 |
| Shaker et al. [35] | 44 | 102,098 | 12 Class | CNN | Acc: 94.30 |
| Oh et al. [27] | 47 | 16,499 | 5 Heartbeats | UNet | Acc: 93.10 |
| Xiong et al. [36] | 12,186 | 12,186 | 4 Class | CNN + RNN | F1: 82.00 |
| Oh et al. [28] | 170 | 150,268 | 3 Cardiac Disease | CNN + LSTM | Acc: 94.51 |
| Mousavi et al. [37] | - | 750 | 5 Rhythm | CNN + LSTM | Acc: 93.75 |
| Wu et al. [38] | - | 8528 | 4 Class | Binarized CNN | F1: 86.00 |
| Fujita et al. [26] | 47 | 109,449 | 4 Class | Normalization + CNN | Acc: 93.45 |
| Salem et al. [39] | 22 | 7000 | 4 Class | STFT + CNN | Acc: 94.23 |
| Xia et al. [40] | - | - | 2 Class | SWT + CNN | Acc: 95.63 |
| Yildirim et al. [29] | 10,436 | 10,436 | 7 Rhythm | CNN + LSTM | Acc: 92.24 |
| Mehari et al. [41] | 10,646 | 10,646 | 7 Rhythm | Single Classifier | Acc: 92.89 |
| Rahul et al. [42] | 10,646 | 10,646 | 7 Rhythm | 1-D CNN | Acc: 94.01 |
| Kang et al. [43] | 10,646 | 10,646 | 7 Rhythm | RNN | Acc: 96.21 |
| Proposed Method | 10,646 | 10,646 | 7 Rhythm | 12 Lead Fusion + CNN Trees | Acc: 97.60 |
Publisher’s Note: MDPI stays neutral with regard to jurisdictional claims in published maps and institutional affiliations. |
© 2022 by the authors. Licensee MDPI, Basel, Switzerland. This article is an open access article distributed under the terms and conditions of the Creative Commons Attribution (CC BY) license (https://creativecommons.org/licenses/by/4.0/).
Share and Cite
Meqdad, M.N.; Abdali-Mohammadi, F.; Kadry, S. A New 12-Lead ECG Signals Fusion Method Using Evolutionary CNN Trees for Arrhythmia Detection. Mathematics 2022, 10, 1911. https://doi.org/10.3390/math10111911
Meqdad MN, Abdali-Mohammadi F, Kadry S. A New 12-Lead ECG Signals Fusion Method Using Evolutionary CNN Trees for Arrhythmia Detection. Mathematics. 2022; 10(11):1911. https://doi.org/10.3390/math10111911
Chicago/Turabian StyleMeqdad, Maytham N., Fardin Abdali-Mohammadi, and Seifedine Kadry. 2022. "A New 12-Lead ECG Signals Fusion Method Using Evolutionary CNN Trees for Arrhythmia Detection" Mathematics 10, no. 11: 1911. https://doi.org/10.3390/math10111911
APA StyleMeqdad, M. N., Abdali-Mohammadi, F., & Kadry, S. (2022). A New 12-Lead ECG Signals Fusion Method Using Evolutionary CNN Trees for Arrhythmia Detection. Mathematics, 10(11), 1911. https://doi.org/10.3390/math10111911