Article

Design and Operation of Multipurpose Production Facilities Using Solar Energy Sources for Heat Integration Sustainable Strategies

1
CEG-IST, Instituto Superior Técnico, Universidade de Lisboa, 1049-001 Lisboa, Portugal
2
Univ Coimbra, CEMMPRE, 3030-788 Coimbra, Portugal
3
EIGeS, Universidade Lusófona, 1749-024 Lisboa, Portugal
4
Centro ALGORITMI, Universidade do Minho, 4800-058 Guimarães, Portugal
*
Authors to whom correspondence should be addressed.
Mathematics 2022, 10(11), 1941; https://doi.org/10.3390/math10111941
Submission received: 21 April 2022 / Revised: 26 May 2022 / Accepted: 2 June 2022 / Published: 6 June 2022
(This article belongs to the Special Issue Operations Research and Optimization)

Abstract

:
Industrial production facilities have been facing the requirement to optimise resource efficiency, while considering sustainable goals. This paper addresses the introduction of renewable energies in production by exploring the combined design and scheduling of a multipurpose batch facility, with innovative consideration of direct/indirect heat integration using a solar energy source for thermal energy storage. A mixed-integer linear programming model is formulated to support decisions on scheduling and design selection of storage and processing units, heat exchange components, collector systems, and energy storage units. The results show the minimisation of utilities consumption, with an increase in the operational profit using combined heat integration strategies for the production schedule. A set of illustrative case-study examples highlight the advantages of the solar-based heat storage integration, assessing optimal decision support in the strategic and operational management of these facilities.

1. Introduction

Currently, almost all industrial sectors are adapting not only to a new demand behaviour, but also to an increasing environmental consciousness. This change of behaviour requires the efficient production of mass customised products with high process flexibility to deal with uncertainty [1,2]. Multipurpose production facilities are a reliable option to deal with current market requirements, enabling a flexible configuration defined by a set of multipurpose equipment that can be combined to produce a large number of different batch products. The design of these flexible production facilities can be explored through an efficient integration between its production process characteristics and its scheduling [3,4]. Moreover, as noted in [5], several exact/non-exact modelling approaches have addressed the industrial design and scheduling decision making, with regards to equipment capacity efficiency, and uncertainty impacts of resources’ reliability. Simultaneously, governmental entities have increased pressure to define long-term sustainable production strategies to reduce the carbon footprint impact (e.g., Paris Agreement). At the operational level, the focus on energy consumption often centers on heat and power integration as a way to reduce overall fossil fuel costs in the production process [6], while other current technologies, such as solar thermal and heat storage methods, can be studied to generate important operational savings in energy usage and greenhouse gas emissions [7]. As these technologies become more accessible, but still account for a significant share of capital investment within the plant budget, they also should be considered at the design level as an integrated optimisation approach to select adequate equipment/resource capacities.

Background

Process sustainability is becoming one of the business pillars of most industrial companies [8,9]. Therefore, several research works have focused on bridging strategic and operational decisions with the challenges of production design, planning, and scheduling problems [10,11]. In a few examples from the literature that addressed energy factor efficiency in industrial applications, ref. [12] the authors integrated facility design, with scheduling considering direct heat integration of different utility components, using an economic indicator as an objective function. More recently, in [6], the authors explored the minimisation of wastewater generation and energy utility usage, while simultaneously optimising the batch process schedule with improved profitability. In [13], the authors addressed heat recovery and short-term batch scheduling in multipurpose batch processes using a continuous-time grid, maximising the pairwise use of hot and cold streams with feasible temperature driving forces with the intermittent behaviour of process streams. Moreover, in [14], the authors coped with the scheduling and heat integration in batch facilities using a continuous-time grid, exploring a bi-objective approach, using the makespan and utility consumption minimisation as objective functions. In [15], the authors proposed an exact mixed-integer continuous-time grid formulation to minimise energy consumption in multipurpose batch plants, considering only indirect heat integration and heat storage vessels. In the same year, in [16], the authors used a continuous-time grid and a source-demand classification to tackle direct heat integration. The approach considers each stream as a source/demand for heat, based on the target temperature, with the identification of the minimum hot and cold utility requirements for the process. The authors of [17] explored the campaign production using a periodic production process and developed scheduling with direct and indirect heat integration in multipurpose batch facilities. Finally, the authors of [18] proposed long-term scheduling of batch plants, using the active task concept, cyclic scheduling, and direct and indirect heat integration possibilities in the design of heat storage vessels. However, it is evident that the overall scope of energy sources is typically non-renewable (Table 1). In regards to these works, displayed in Table 1, the majority are based on a continuous-time grid formulation and explicit consideration of either direct or indirect integration.
Along with these diverse modelling approaches, in [19] a comprehensive literature review on the optimisation models concerning industrial symbiosis exposes the different networking contexts and optimisation tools to tackle them.
Ref. [20] proposed a framework characterised by several steps based on a pinch analysis to promote more sustainable productions. The framework maximises the heat recovery between units, and optimises the power allocation and integration of the renewable energy system for predefined scheduling. In the same year, ref. [21] developed a review using metaheuristics algorithms considering the design of heat exchange networks to approach the drawback of exact approaches. However, scheduling operations were not considered. Among renewable energy sources, in [7], the integration of solar power sources in problems ranging from heat exchange networks to process cogeneration is reviewed. As some examples with the combined focus on heat integration, the authors of [22] presented a methodology using a combinatorial approach for a solar process heat and storage system design in batch facilities. To address the intermittent availability of solar energy, the authors of [23] presented a methodology for maximising solar thermal use, with a mixed-integer linear programming (MILP) formulation to heat integration methodologies for batch processes based on the time slice model (TSM) and considering heat storage. In [24], a MILP model is created for the optimal design and combined operation of solar-heated utilities, with evidence of economic and environmental attractiveness for industrial processes. Additionally, in [25], the authors modelled the design distribution optimisation of solar heat systems, integrated with heat storage, using different temperature intervals. The authors of [26] addressed the concept of flexible heat integration with a hybrid power plant based on real-time adaptive ambient conditions. Therefore, the recognised advantages of solar energy integration should be considered, along with the inherent thermodynamic and technical constraints, as noted by the authors of [27], to determine the economic potential and operational performance.
To the best of our knowledge, the combined design and scheduling for a multipurpose production considering solar energy as a renewable source for heat integration has not been yet explored in the literature. Therefore, this work pursues the concept of a sustainable production process under two main contributions: (i) to integrate the design and scheduling with equipment topology selection while coping with the demand behaviour; and (ii) to promote the mitigation of fuel energy resources using a renewable energy source in production. The aim is to propose a discrete-time model-based approach addressing optimal strategic and operational decision support, while the energy integration uses direct and indirect heat exchange, using a thermal energy storage (TES) unit to store solar energy. The strategic level considers the topology and design of the process, such as the use of streams, heat exchange, thermal energy storage, and collector systems. At the operational level, the production schedule satisfies the product demand, simultaneously characterising which combined energy strategy allows for the maximisation of heat exchange and plant profit. The paper structure is organised in the following sections: Section 2 defines the modelling framework and problem characterisation, followed by a mathematical formulation in Section 3; the applicability of the proposed model is illustrated in Section 4, followed by conclusions and suggestions for further work in Section 5.

2. Modelling Approach

Considering an industrial process with known operational demands, it is necessary to develop a systematic approach for the design and operation optimisation of heat integration by assessing a solar energy source. Due to the intermittent nature of solar energy, an intermediate medium to transform it into thermal energy is considered using a TES unit to collect, store, and dispatch energy, depending on availability and demand. Therefore, heat integration in a production process can be achieved through direct and/or indirect integration, considering a combination of hot streams, which include exothermic and TES discharge tasks, and cold streams, which include endothermic and TES charge tasks:
i.
Direct heat integration is performed if the heat exchange conditions between the streams of an exothermic and endothermic task i are satisfied, and their scheduling overlaps, as shown in Figure 1. During the overlap period, p(i′,i), the heat exchange requires an exchange unit. To reach the heat exchange condition, an offset time, ξ i , may be considered before the heat integration starts. An external heat source h may be required if the heat exchanged is not enough.
ii.
Indirect heat integration is performed through a TES unit, combining (a) the TES unit that collects heat from the solar field or from an exothermic task, Figure 2, or (b) the TES unit that provides heat for an endothermic task.
Regarding the TES unit operation, the following reasonable assumptions provided by expert partners in the field are defined below:
  • The solar field is characterised by parallel flat plates with a set of properties in which each solar field is connected to one TES unit;
  • The solar panels composing a solar field have the same inlet/outlet temperature;
  • During time t, the inlet temperature of a solar field is the same as the average temperature of the respective TES unit;
  • The TES unit exchanges heat with only one processing task at a time, but may receive heat from the solar field and simultaneously exchange heat with a processing task;
  • Once the TES unit starts to exchange heat, no pre-emptive action is allowed;
  • The heat exchange only occurs if a minimum temperature difference ( T m i n ) between tasks is verified;
  • The temperature decay in the TES is based on its thermal resistance R t o t ;
  • No phase change is assumed in the TES heat medium.
With the complexity of real-size industrial problems, developing an appropriate representation to describe the process interactions in the modelling approach becomes essential, as shown in Figure 2. The state-task network (STN) is a generic representation used to characterise the macrostructure of product recipes, commonly applied to multipurpose batch processes [28]. This unambiguous graphical depiction is characterised by tasks and states, with minimum details, in order to map the problem connections of the process, plant units, and operations. The tasks denoted by rectangles characterise processing operations, while the material is defined as state, represented as circles. Tasks consume/produce their states as inputs/outputs, which allows a more straightforward constraints formulation. The macrostructure representation of the production process is defined by connecting all the states and tasks, defining all possible combinations for production. In the given example, S1 and S2 nodes designate material in a particular state (held in suitable vessels), transformed by task i and linked through arcs. This general representation does not explicitly show the processes equipment, requiring a separate list of processing units available, characterized by capacity and a list of tasks which can be performed in that unit. When scheduled for execution, each task is assigned to an appropriate equipment and batch of material according to the problem network (please refer to the seminal paper for a more detailed information). Moreover, given the proven flexibility of a discrete-time model base, the scheduling horizon is divided into a finite number of time intervals, with predefined duration, allowing the events, such as the beginning or end of tasks, to occur only at the boundaries of these time periods (or instants). In addition to the specifications of product requirements, modes of operation and constraints, plant/process goals, cost parameters, heat integration options and requirements, this representation can provide the information structure to state the problem case.

Problem Statement

The problem under study can be summarised as follows.
Given:
  • Product recipes according to STN representation;
  • Production requirements and time horizon;
  • Units’ suitability to perform the process/storage tasks and max./min. capacities;
  • Task operating temperature and time;
  • Utility requirements, heat integration options, and min. temperature differences;
  • Operating and capital costs for each unit and task;
  • Solar irradiation profile and collector data: type of collector, optical and heat loss performance coefficients, and concentrating ratio.
Determine:
  • The optimal plant topology and design: number and type of processing units, thermal energy storage units, heat exchange units and heat transfer area, number of solar panels and storage vessel collectors;
  • Optimal production schedule, with storage policies and batch size characterisation;
  • Products and utility profiles, with corresponding heat transfer strategies.
These specifications must be met in order to optimise the economic performance, measured in terms of the capital expenditure, operating costs, and revenues.

3. Mathematical Formulation

The proposed MILP formulation follows the reasoning by Pinto et al. (2003), which explored the utility savings in the operating and capital costs structure, without the consideration of renewable energy sources. In this sense, this work appears as an extension to consider a solar energy source in the stated design and scheduling problem using the concept of direct and indirect heat integration. In order to be consistent with the original notation, the indices t ,   i ,   j ,   s ,   u ,   and   h , respectively, refer to time, tasks, units (of type k), states, utilities, and heat transfer unit (with property types z, z*, and w) of the process representation. A time discretisation is used to define the scheduling horizon H, divided into a number of time intervals t of fixed duration. To avoid an extensive description of the formulation, in the nomenclature appendix is listed the sets, parameters, and variables used to formulate the model constraints under the STN process representation, which are divided into four main groups: (i) process, (ii) direct heat integration, (iii) indirect heat integration, and (iv) solar constraints.

3.1. Process Constraints

In the process constraints of the mathematical model, Equation (1) assures the allocation of processing unit j, if installed, to only a single type k, and Equation (2) guarantees that the processing task i in the unit j cannot be pre-empted, once started. Concerning capacity Vj, and the batch size of process units B i , j , t   , Equation (3) defines that if unit j processes task i, then binary variable W i j t = 1 , and the batch quantity must be within the unit capacity. The unit installed when E j , k = 1 is then bounded by the minimum and maximum defined capacities V j , k m i n / V j , k m a x in Equation (4). Otherwise, the batch is null and W i j t = 0 , set by Equation (5). Finally, Equation (6) assures the material balances in state s at instant t, S s , t , given by the quantity in the previous instant t 1 plus the quantity produced in instant t , subtracted by the amount consumed, delivered D s , t and received R s , t at instant t. The final product quantity delivered plus the quantity at the end of the production horizon, s S F i n a l , must satisfy the minimum and maximum demand requirements, given in Equation (7).
k K j E j , k = E j           j J p r o c J s t o r e  
i I j I p r o c θ = 0 p i 1 W i , j , t θ 1           j J p r o c ,   t = 1 , , H
i , j m i n · V j V j m a x 1 W i j t B i , j , t i , j m a x V j           i I p r o c ,   j J i ,   t = 1 , , H
k K j V j , k m i n · E j , k V j k K j V j , k m a x · E j , k             j J p r o c J s t o r e
0   B i , j , t V j m a x · W i , j , t             i I p r o c ,   j J i ,   t = 1 , , H
S s , t = S s ,   t 1 + i I s i n j J i ρ i , s i n · B i , j , t i I s o u t j J i ρ i , s o u t · B i , j , t D s , t + R s , t           s ,   t = 1 , , H + 1
Q s m i n S s , H + 1 S s , 0 + D s , H + 1 Q s m a x           s ϵ S F i n a l

3.2. Direct Heat Integration Constraints

Regarding the direct heat integration, the total heat required by each task I Q i , t   , is characterised by a fixed and a variable quantity (based on production batch), given by the first and second term of Equation (8), respectively. The required heat to be exchanged between tasks i and i′ is firstly satisfied using the energy integration variable Q i , i , h , t , either by direct or indirect integration. Only if necessary, external utilities consumption is used, Q u , i , t U . The relation between those quantities is characterised by Equations (9) and (10), for an exothermic and endothermic task, respectively. The batch of external utility, B u , i , t U , satisfies the external heat requirements Q i , t U , Equation (11), and the maximum available quantity B u , t m a x , Equation (12). To guarantee the direct heat exchange condition between two processing tasks, the exchange can only start at instant t, if the exothermic/endothermic task started at time t ξ i , ensured by Equations (13) and (14), respectively, as shown in Figure 1. The ξ i is the offset time required for a processing task to start its heat exchange. Concerning the unit selection and design, at each time t, a heat-exchange unit, h, can transfer heat between two processing tasks and cannot be pre-empted once started; the exchange period p i i , Equation (15), and the unit h must perform the heat exchange, Equation (16). A heat transfer area, A h , must be defined to satisfy the heat flux, as in Equation (17), respecting the maximum and minimum area capacity, Equation (18).
Q i , t   = θ = 0 p i 1 j ϵ J i Q i θ W i , j , t θ   + B i θ   B i , j , t θ             i I p r o c ,   t = 1 , , H
Q i , t   = Q i , t U + i h H I i , i Q i , i , h , t           i I e n d o ,   t = 1 , , H
Q i , t   = Q i , t U + i   h H I i , i Q i , i , h , t         i I e x o ,   t = 1 , , H
Q i , t U = u   ϵ   U i B u , i , t U · c p u · T u           i I p r o c , t = 1 , , H
0 i ϵ I p r o c I u   B u , i , t U B u , t m a x           u ,   t = 1 , , H
h H I i , i i W i , i , h , t j J i W i , j , t ξ i             i ϵ I h e a t i n g , t = 1 , , H
h H I i , i   i W i , i , h , t j J i W i , j , t ξ i             i ϵ I e n d o , t = 1 , , H
θ = 0 p i i 1 i i W i , i , h , t θ     1           h H I i , i , i , i ϵ I i n t , t = 1 , , H
Q i , i , h , t M · θ = 0 p i i 1 W i , i , h , t θ 0           h H I i , i ,   t = 1 , , H
C U h · A h · Tln i , i   Q i , i , h , t           h H I i , i ,   t = 1 , , H
E h · A h m i n A h A h m a x · E h           h

3.3. Indirect Heat Integration Constraints

For the indirect heat integration, which is performed using thermal energy storage (TES), the unit is charged by receiving heat from the renewable energy source, through a system defined by a set of flat solar panels, or from an exothermic processing task, i. The TES is discharged every time it exchanges heat with an endothermic processing task, i. Equation (19) assures that the TES unit j can only exchange heat with one charging or one discharging task at each time. If an indirect heat integration is being performed, a TES unit must be installed, and the binary unit takes the value one ( E j = 1 ) . Regarding the energy balance, the amount of heat stored in the TES unit at time t corresponds to the heat stored at time t − 1 plus all the heat exchanged during time t − 1 (Equation (20)). It can be charged by solar panels and exothermic tasks, or it can be discharged by heat loss or discharging tasks. The heat stored Q s t o r e d , set by the fluid density ρ w and heat capacity c p w , is given by Q s t o r e d = V T E S · ρ w   · c p w · T T E S T a m b , which leads to a nonlinear constraint, since TES temperature variable T T E S and volume capacity V T E S are continuous variables. A linearisation is proposed with Equation (21), which uses the volume discretisation parameter V z T E S , a binary variable that selects the volume to be installed E j , z T E S , and the TES temperature T j , z , t T E S becomes dependent on unit j, and volume discretisation z, Equations (22) and (23). The heat loss is characterised by Equation (24), using the thermal resistance coefficient R z T o t and TES temperature T j , z , t T E S . Equation (25) defines that the TES temperature must respect a minimum and maximum temperature allowed, due to safety and operational restrictions. To drive the heat exchange, the minimum temperature difference T m i n   between the TES and the processing unit at the end of a charging/discharging task must be guaranteed, as set by Equations (26) and (27), respectively. Moreover, the discharging tasks must also guarantee the minimum temperature difference T m i n at the beginning of the heat integration, due to the simultaneous charging effect of the solar panels, Equation (28).
θ = 0 p i i 1 h H I i , i ,   i ϵ   I e x o     i     I j c h W i , i , h , t θ + i   I j d i s c h i     I e n d o W i , i , h , t θ   E j           j J T E S , t = 1 , , H
Q j , t s t o r e d = Q j , t 1 s t o r e d + h H I i , i ,   i ϵ   I e x o     i     I j c h Q i , i , h , t 1 i   I j d i s c h i     I e n d o Q i , i , h , t 1 Q j , t 1 l o s s + Q j , t 1 s o l a r           j   ϵ   J T E S ,   t = 1 , , H + 1
Q j , t s t o r e d = z   ϵ   Z T V z T E S · ρ w   · c p w · T j , z , t T E S T a m b · E j , z T E S           j   ϵ   J T E S , t = 1 , , H + 1
T j , t T E S = z   ϵ   Z T T j , z , t T E S           j   ϵ   J T E S ,   t = 1 , , H + 1
E j = z ϵ Z T E j , z T E S           j   ϵ   J T E S
Q j , t l o s s = z   ϵ   Z T T j , z , t T E S T A m b · E j , z T E S R z T o t             j   ϵ   J T E S ,   t = 1 , , H
E j , z T E S · T T E S m i n T j , z , t T E S E j , z T E S · T T E S m a x           z   ϵ   Z T ,   j   ϵ   J T E S ,   t = 1 , , H + 1
T i   T j , t + 1 T E S T m i n   M · 1 θ = 0 p i i 1 h H I i , i W i , i , h , t θ           i I j c h ,   j   ϵ   J T E S ,   t = 1 , , H + 1
T j , t + 1 T E S T i   T m i n   M · 1 θ = 0 p i i 1 h H I i , i W i , i , h , t θ           i I j d i s c h ,   j   ϵ   J T E S ,   t = 1 , , H + 1
T j , t T E S T i   T m i n   M · 1 θ = 0 p i i 1 h H I i , i W i , i , h , t θ           i I j d i s c h ,   j   ϵ   J T E S ,   t = 1 , , H + 1

3.4. Solar Energy Constraints

Concerning the constraints related to the solar energy source, a set of solar panels connected to the TES unit is considered, using an hourly solar profile with a low-medium energy flat collector. Equation (29) requires that if a solar energy collector technology is installed, a TES unit must also be installed. The collector efficiency is defined by Equation (30), where the η j , t changes hourly, based on the solar profile, G t , temperature, T a m b = 25 °C, and the collector internal fluid temperature T j , t c o l l e c t o r . The parameters values of optical efficiency, τ α   , and thermal loss coefficients UL used, are based on the methods of [29]. The internal fluid temperature is defined by the average of inlet T j , t I N and outlet T j , t O U T temperatures, Equation (31), while with Equation (32), the inlet temperature, T j , t I N , defines the average temperature of TES during period t. The total heat collected, Q j , t s o l a r , depends on the discrete number of solar panels, N z s o l a r , the surface, A s o l a r , the thermal efficiency,   η j , t , and the solar profile, G t . If a solar collector system is installed, E j s o l a r = 1 , only one of a set of flat plates must be selected from the available options z*, set by Equations (33) and (34). The solar heat collected is quantified in Equations (35) and (36), considering the mass flowrate, B j , t s o l a r , and temperature inside the collector, T s o l a r . Additionally, the total collector system mass flowrate must satisfy the capacity limits, B S O L m a x / B S O L m i n , and the set of plates selected with Equation (37). Finally, Equations (38) and (39) set the variables’ bounds.
E j s o l a r E j             j   ϵ   J T E S
η j , t = τ α     UL · T j , t c o l l e c t o r T a m b G t             j   ϵ   J T E S ,   t = 1 , , H
T j , t C o l l e c t o r = T j , t I N + T j , t O U T 2             j   ϵ   J T E S ,   t = 1 , , H
T j , t I N = T j , t T E S + T j , t + 1 T E S 2             j   ϵ   J T E S , t = 1 , , H
Q j , t s o l a r G t · N z s o l a r · A s o l a r · η j , t + M · 1 E j , z s o l a r             j   ϵ   J T E S ,   z ϵ   Z s ,   t = 1 , , H
E j s o l a r = z   ϵ   Z s E j , z s o l a r             j   ϵ   J T E S
Q j , t s o l a r = B j , t s o l a r · c p w · T s o l a r           j   ϵ   J T E S ,   t = 1 , , H
T s o l a r = T j , t O U T T j , t I N           j   ϵ   J T E S , t = 1 , , H
z   ϵ   Z s   B S O L m i n · N z s o l ·   E j , z s o l B j , t s o l a r   z   ϵ   Z s B S O L m a x · N z s o l ·   E j , z s o l             j   ϵ   J T E S ,   t = 1 , , H
E j , E j , k ,   E h ,   E j , z T E S ,   E j , z s o l , W i , j , t   ,   W i , i , h , t   0 , 1             i , j , k , h , z , z , i , t
B i , j , t   ,   V j ,   S s , t ,   D s , t ,   R s , t ,   B u , i , t U ,   Q i , t U ,   A h ,   Q i , t   , Q i , i , h , t , I i n t ,   Q j , t l o s s ,   J T E S , Q j , t s t o r e d ,   T j , t T E S ,   T j , z , t T E S , η j , t , T j , t c o l l e c t o r ,   T j , t i n ,   T j , t o u t , B j , t s o l a r , Q j , t s o l a r 0             i , j , t , s , u , h , i , z

3.5. Objective Function

The profit maximisation is defined in Equation (40), where the first term characterises the revenue subtracted by operational and raw materials costs, and the second term quantifies the fixed costs. In Equation (41), the revenue quantifies the products sold at the end of the time horizon, plus the deliveries along the time horizon, and the product between the raw material price and the amount of raw material received and consumed over the time horizon quantify the raw material costs, given by Equation (42). The operational cost of the processing task is quantified in Equation (43) by a fixed O C i , j 0 and variable O C i , j 1 cost, based on the batch quantity and the storage costs O C s . The cost of external utility consumed is defined in Equation (44), while the heat transfer units’ capital cost is quantified by a fixed O C i , i , h 0 H I and a variable O C i , i , h 1 H I coefficient, based on the amount of heat exchanged, Equation (45). The collector operation cost O C s o l a r is based on the batch flowrate, as defined in Equation (46). The design cost for production and heat integration units is also characterised by a fixed and variable cost, as shown in Equations (47)–(50), for processing units, TES unit, direct heat integration unit, and the solar collector, respectively.
m a x P r o f i t = P R R M C O C O C Q O C T O C H I O C S O L · H o u r s Y r H ( C C + C C T + C C H I + C C S O L ) · C C F
P R = s S F i n a l S s , H + 1 · v s + t D s , t · v s
R M C = s S R M S s , o S s , H + 1 · p s + t R s , t · p s
O C = t i I p r o c j J i O C i , j 0 · W i , j , t + O C i , j 1 · B i , j , t + s t O C s · S s , t
O C Q = t i ϵ I p r o c     u   ϵ   U i O C u U · B u , i , t U
O C H I = t i i h H I   i , i O C i , i , h 0 H I · W i , i , h , t + O C i , i , h 1 H I · Q i , i , h , t
O C S O L = j   ϵ   J T E S t B j , t s o l a r · O C s o l a r
C C = j ϵ J p r o c J s t o r e k ϵ K j ( E j , k · C C j , k 0 + V j · C C j 1 )
C C T = j   ϵ   J T E S z   ϵ   Z T   ( C C 0 T E S + C C 1 T E S · V z T E S ) E j , z T E S
C C H I = h C C h 0 H I · E h , + C C h 1 H I · A h
C C S O L = z   ϵ   Z s   j   ϵ   J T E S E j , z s o l a r · C C 0 s o l a r + N z s o l a r · C C 1 s o l a r

4. Illustrative Examples

To discuss the suitability of the model, two illustrative examples are presented based on an industrial context. Example I addresses a multipurpose batch plant problem under two scenarios, adapted from [12], while Example II considers a more complex process to detail energy integration strategies using multiple TES. The model was implemented in GAMS (v25.1.1), coupled with the CPLEX optimisation package (Version 12.5). All solutions were obtained with a 0% optimality gap on a Pentium II 333 MHz 4 GB RAM. To guide the discussion of the results, the main case parameters are presented, and additional data on resources characteristics are provided as supplementary material upon request.

4.1. Example I

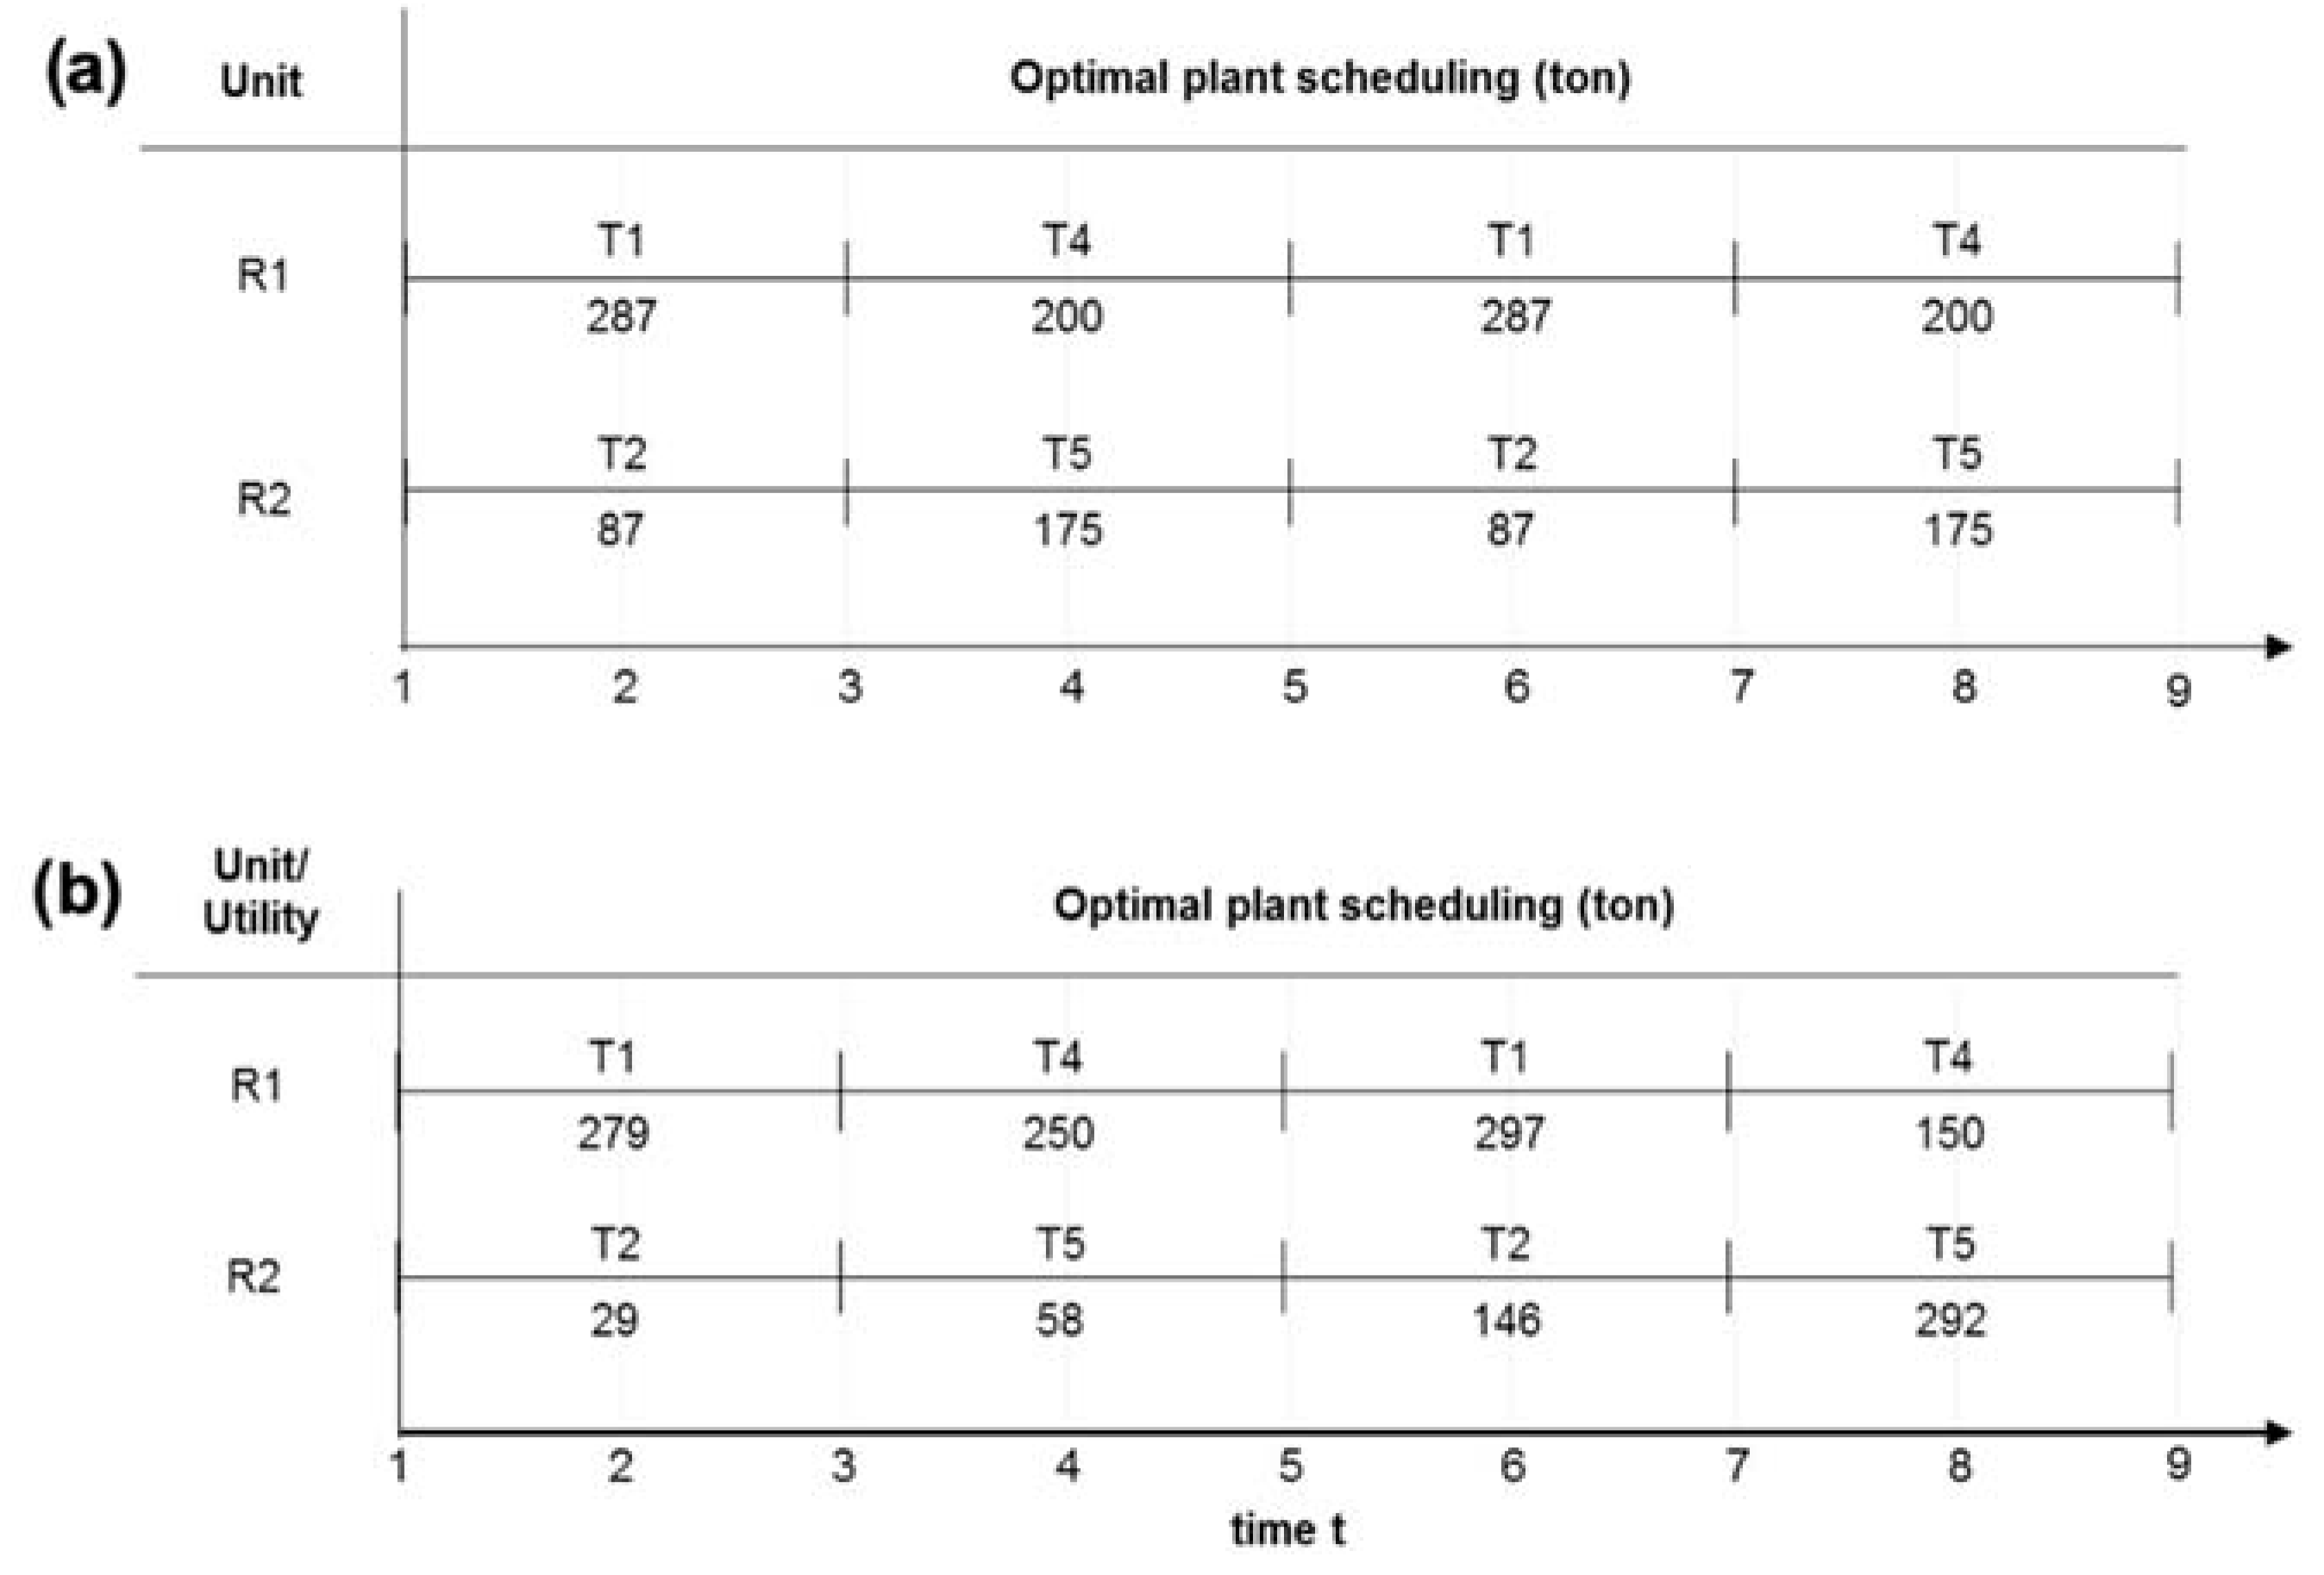
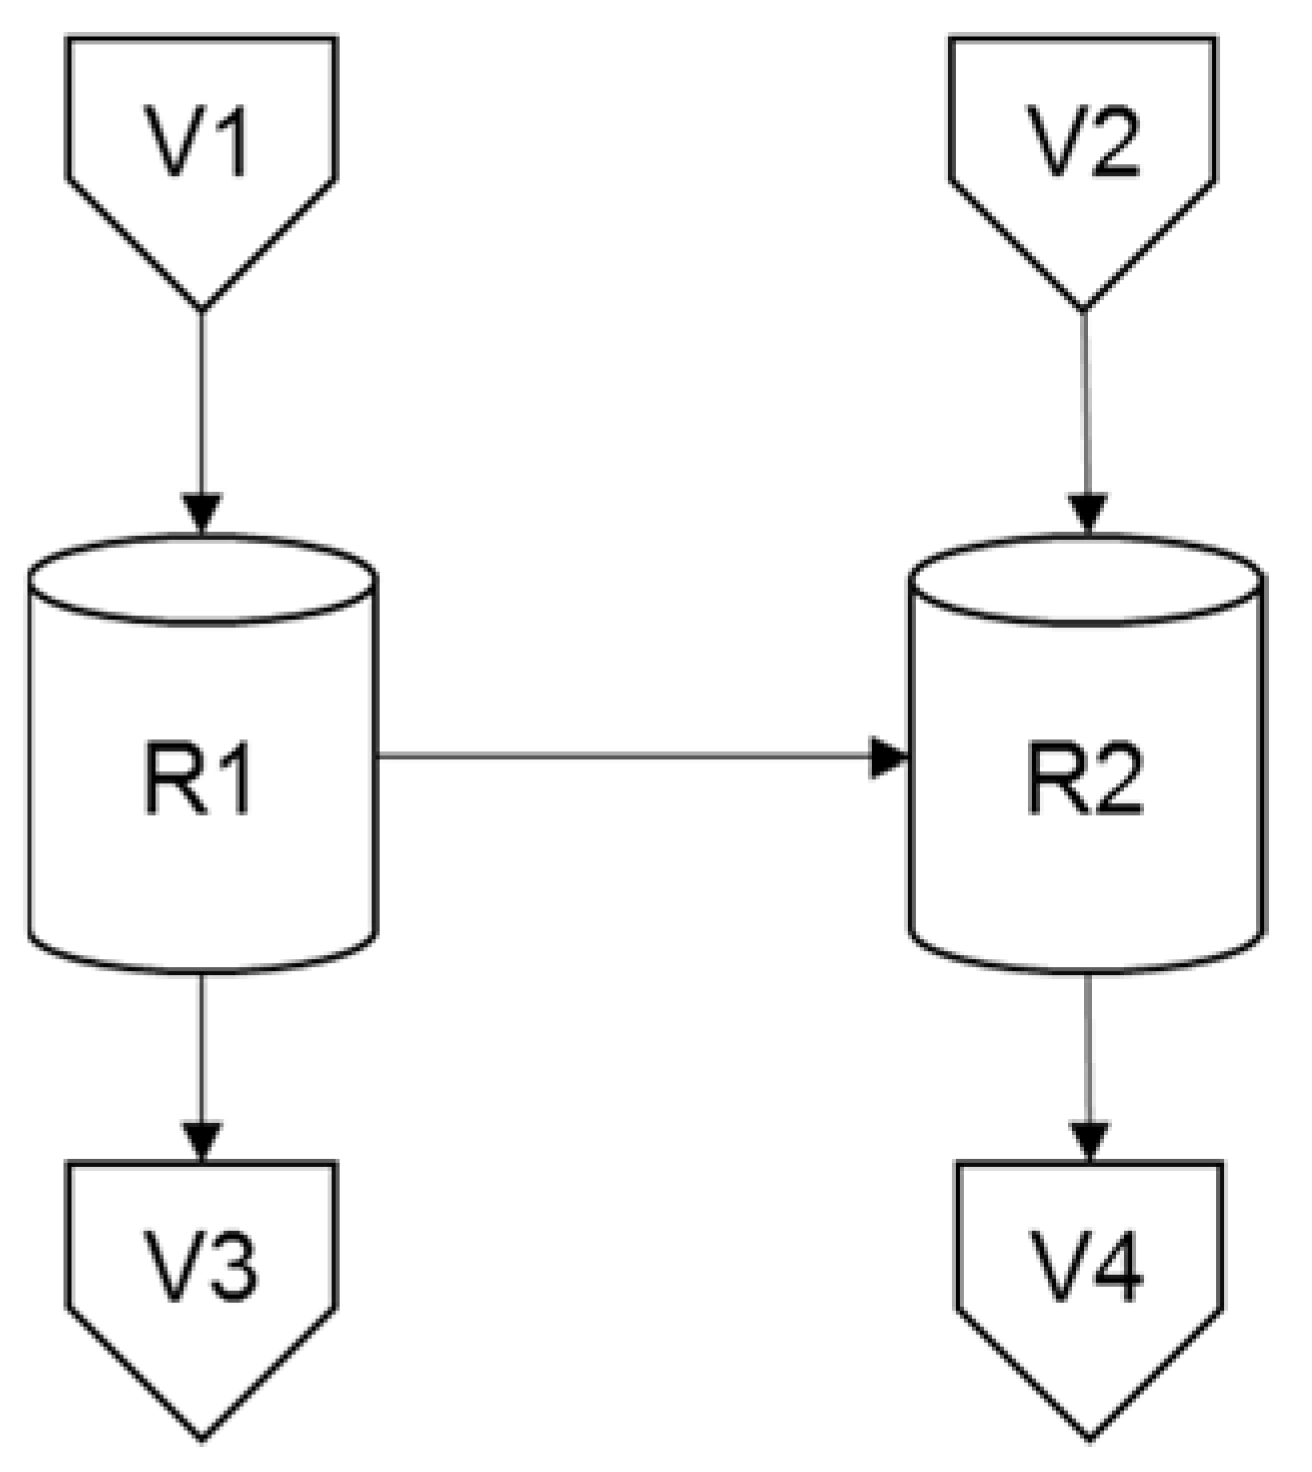
For this example, a multipurpose batch plant is designed to maximise its profit while guaranteeing the production of 350 tons of S3 and 400 tons of S4, from raw materials S1 and S2, in a horizon H of 8 h basis. Figure 3 depicts the manufacturing process and duration of tasks, as task T1 consumes raw material S1 to produce an intermediary product S5, which is used in tasks T4 and T5. Task T2 consumes raw material S2 to produce intermediary product S6, to be used in half proportion in task T5. Multipurpose processing reactors are defined to provide flexibility to the system, and the raw materials assume dedicated storage vessels with unlimited capacity. Table 2 and Table 3 resume the main process unit characteristics/costs and energy requirements of the tasks. The raw material costs and final products S3/S4 values are, respectively, 5 and 100 currency units/ton. External utilities are steam and water, costing 10 and 2 c.u./kWh, respectively. This case example compares the solution obtained in two scenarios: scenario (a) considers the design and scheduling with baseline utilities consumption, while scenario (b) explores heat integration strategies.

Results and Discussion: Scenario (a) vs. Scenario (b)

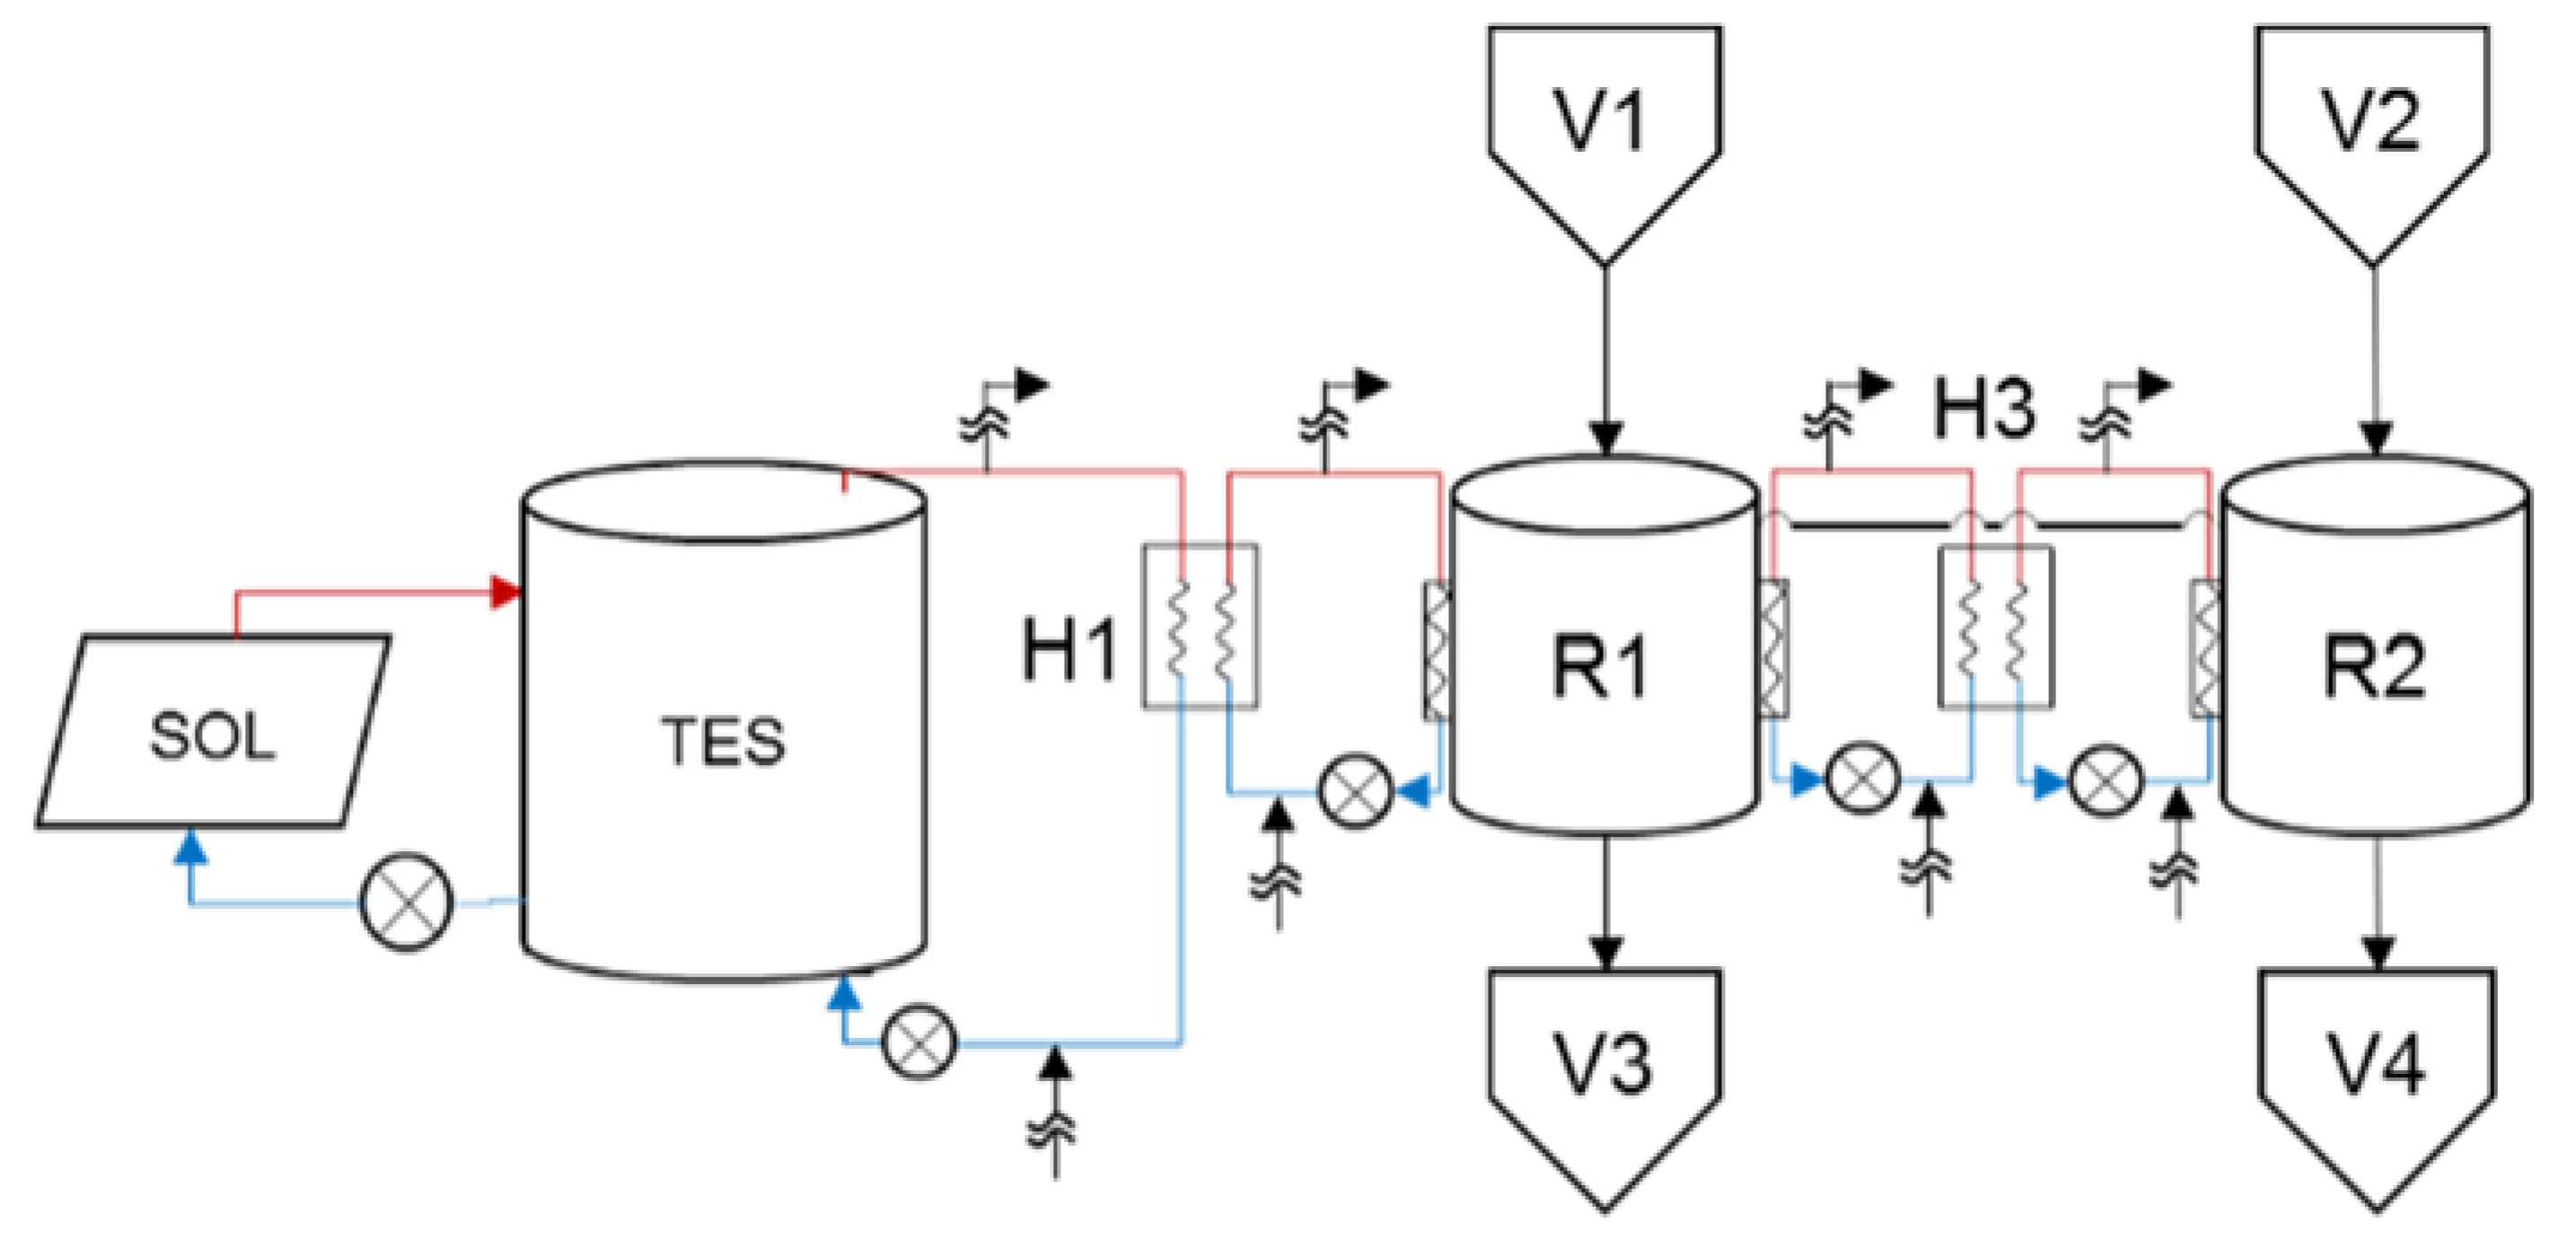
The scheduling solutions for scenarios (a) and (b) are shown in Figure 4a,b, respectively. The unit design and its comparison analysis are shown in Table 4. The scheduling in both cases highlights the multipurpose behaviour of the processing units, given heat balance requirements, using different capacity designs for the equipment to produce the same demand. The solution for scenario (b) verifies the installation of the TES1 unit with a capacity of 4.8 m3 and connected to 400 solar units, although requiring a capacity design increment of 3% and 67% for R1 and R2, respectively, using two heat exchangers, H1 and H3, with heat transfer areas of 6.5 m2 and 1.3 m2, respectively. This difference in the R2 capacity can be explained by the unstable availability of TES1 energy stored during the time horizon to adequately provide the heat exchange requirements of production tasks at each interval.
In more detail, the heat exchanged strategies are shown for both scenarios in Figure 5 and Figure 6. The current scenario (a) requires an amount of 1178 kWh of steam and 604 kWh of water, while in scenario (b), the solution suggests a profitable advantage for a combination of heat exchange strategies with these utilities and TES. Indirect heat integration is performed between task T1 and TES1 in periods t 1 , 3 , while in periods t 3 , 5 and 7 , 9 the indirect heat integration is performed by task T4 and the TES1. Task T5 only uses external utilities. Task T1 provides 293 kWh to TES1 unit through heat exchanger H1, during t 1 , 3 , while task T2, in the same period, uses external utilities. Despite the exchanged heat between TES1 and task T4 in period t 3 , 5 , the requirements of task T4 are not fully satisfied. Tasks T4 and T5 use external utilities to fulfil the remaining heat requirement, while in period t 7 , 9 TES1 fulfils all the requirements of task T4. Direct heat integration of 95 kWh is performed between task T1 and T2, in period t 5 , 7 , using heat exchanger H3. However, task T1 requires an external amount of 214 kWh to satisfy its energy requirements (cooling water). A mixed heat integration strategy is also used in t 3 , 5 , where task T4 receives heat from TES1 and requires external utilities to operate.
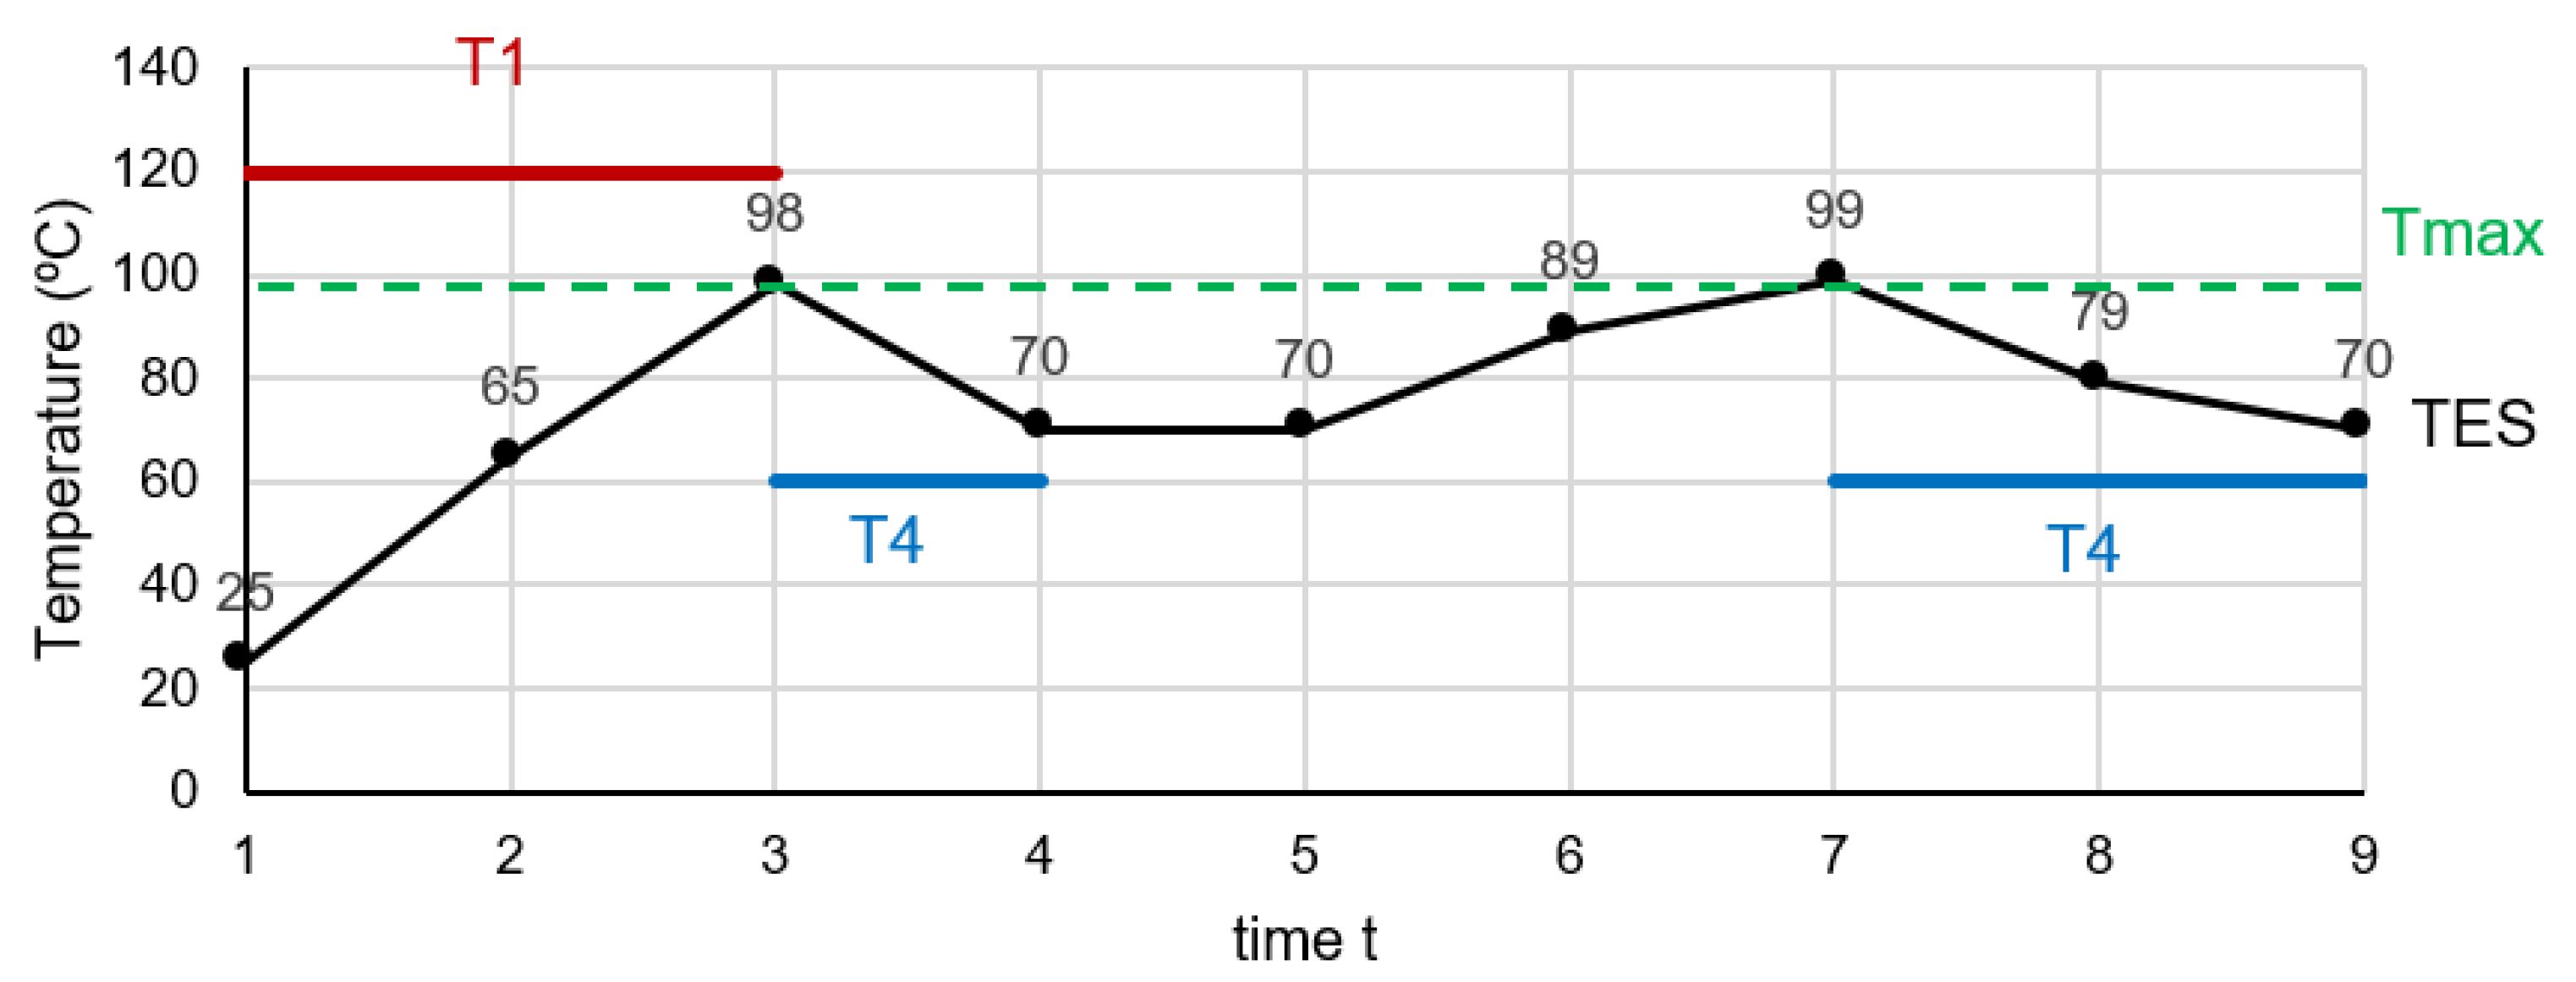
As verified, the solar collectors SOL1 provide between 30 to 128 kWh of heat to TES1. Whenever the heat exchanged between a task and the TES1 is positive, the TES1 is performing a charging task and the temperature in the TES1 increases (as shown, for instance, in t 1 , 3 temperature profile of Figure 7). Despite the fact that task T1 operates at 120 °C, the TES1 temperature profile remains within its operating limits [25,100] °C, reaching 98 °C, and verifying the minimum driving force for heat exchange (10 °C). TES1 reaches 70 °C, while in the exchange heat between TES1 and task T4, T = 60 °C. The TES1 temperature profile shows that the operational conditions vary. The solar collector’s efficiency profile, displayed in Figure 8, shows the highest efficiency when the TES1 temperature is lower, mitigating the losses over the solar panel. On the other hand, higher temperatures lead to higher heat losses inside the solar panel, triggering a lower efficiency profile.
The optimal topologies of both cases are shown in Figure 9 and Figure 10, respectively, followed by their solution comparison in Table 5. Despite the investment in equipment, the use of renewable energy in the process increases the profit by 11%, since external utilities consumption decreases by 67% for cooling water and 52% for steam.

4.2. Example II

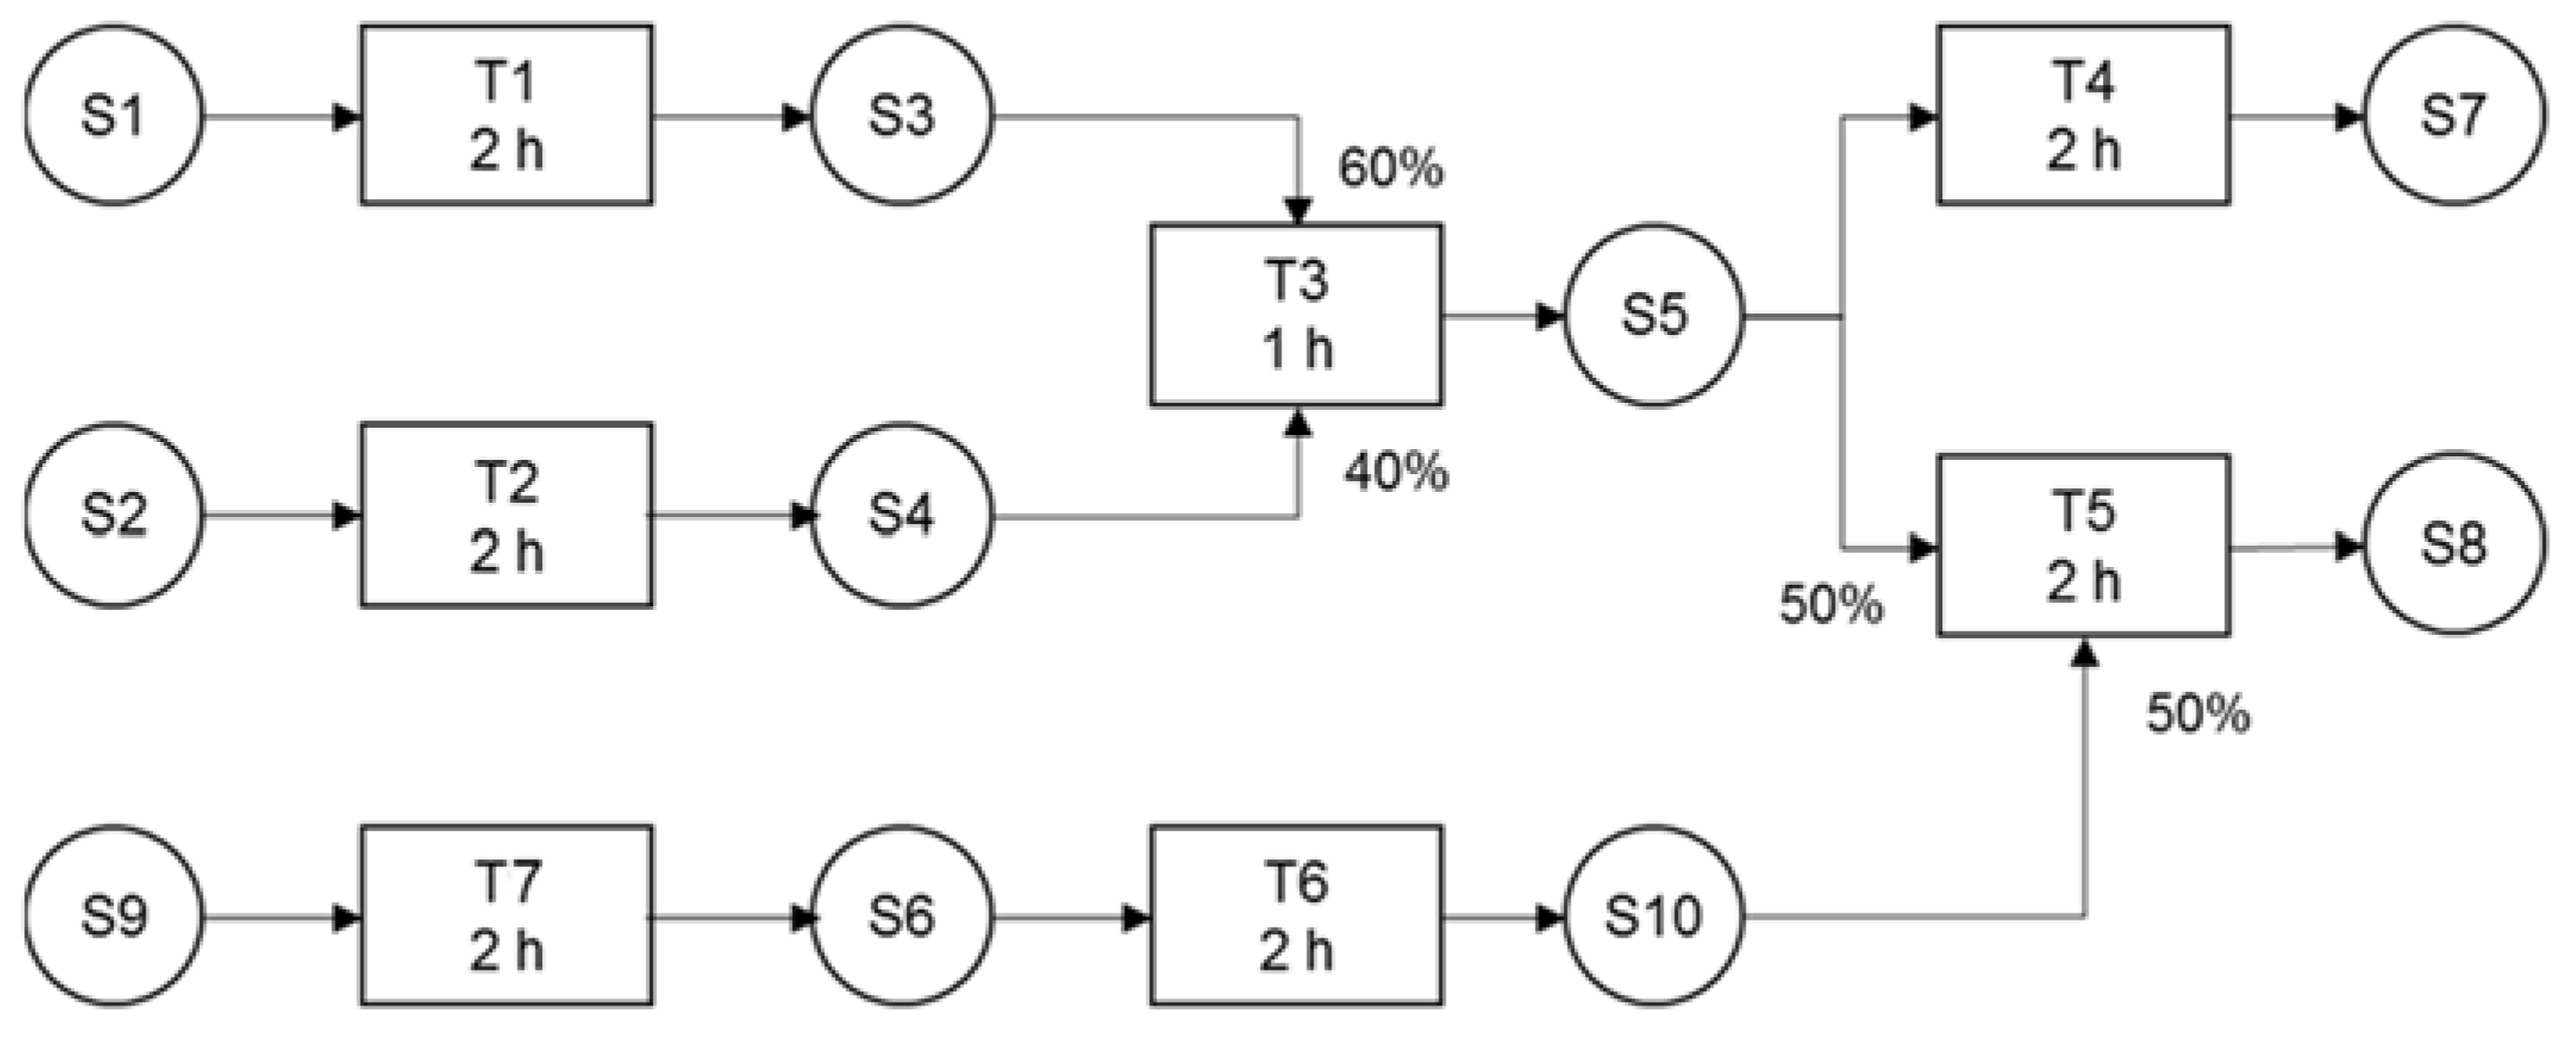
In this example, the plant topology complexity is increased to maximise profit and energy integration in a multipurpose batch plant. The process produces three main products, S7, S8, and S10, within the range of 300 to 350 tons, 200 to 250 tons, and 200 to 250 tons, respectively, for a basis of 8 h horizon H. The product S10 is not only a final product, but also an intermediary product used in task T5. The products recipes with the corresponding task processing times, are represented in Figure 11, and the unit’s characteristics are shown in Table 6, followed by its energy requirements in Table 7.
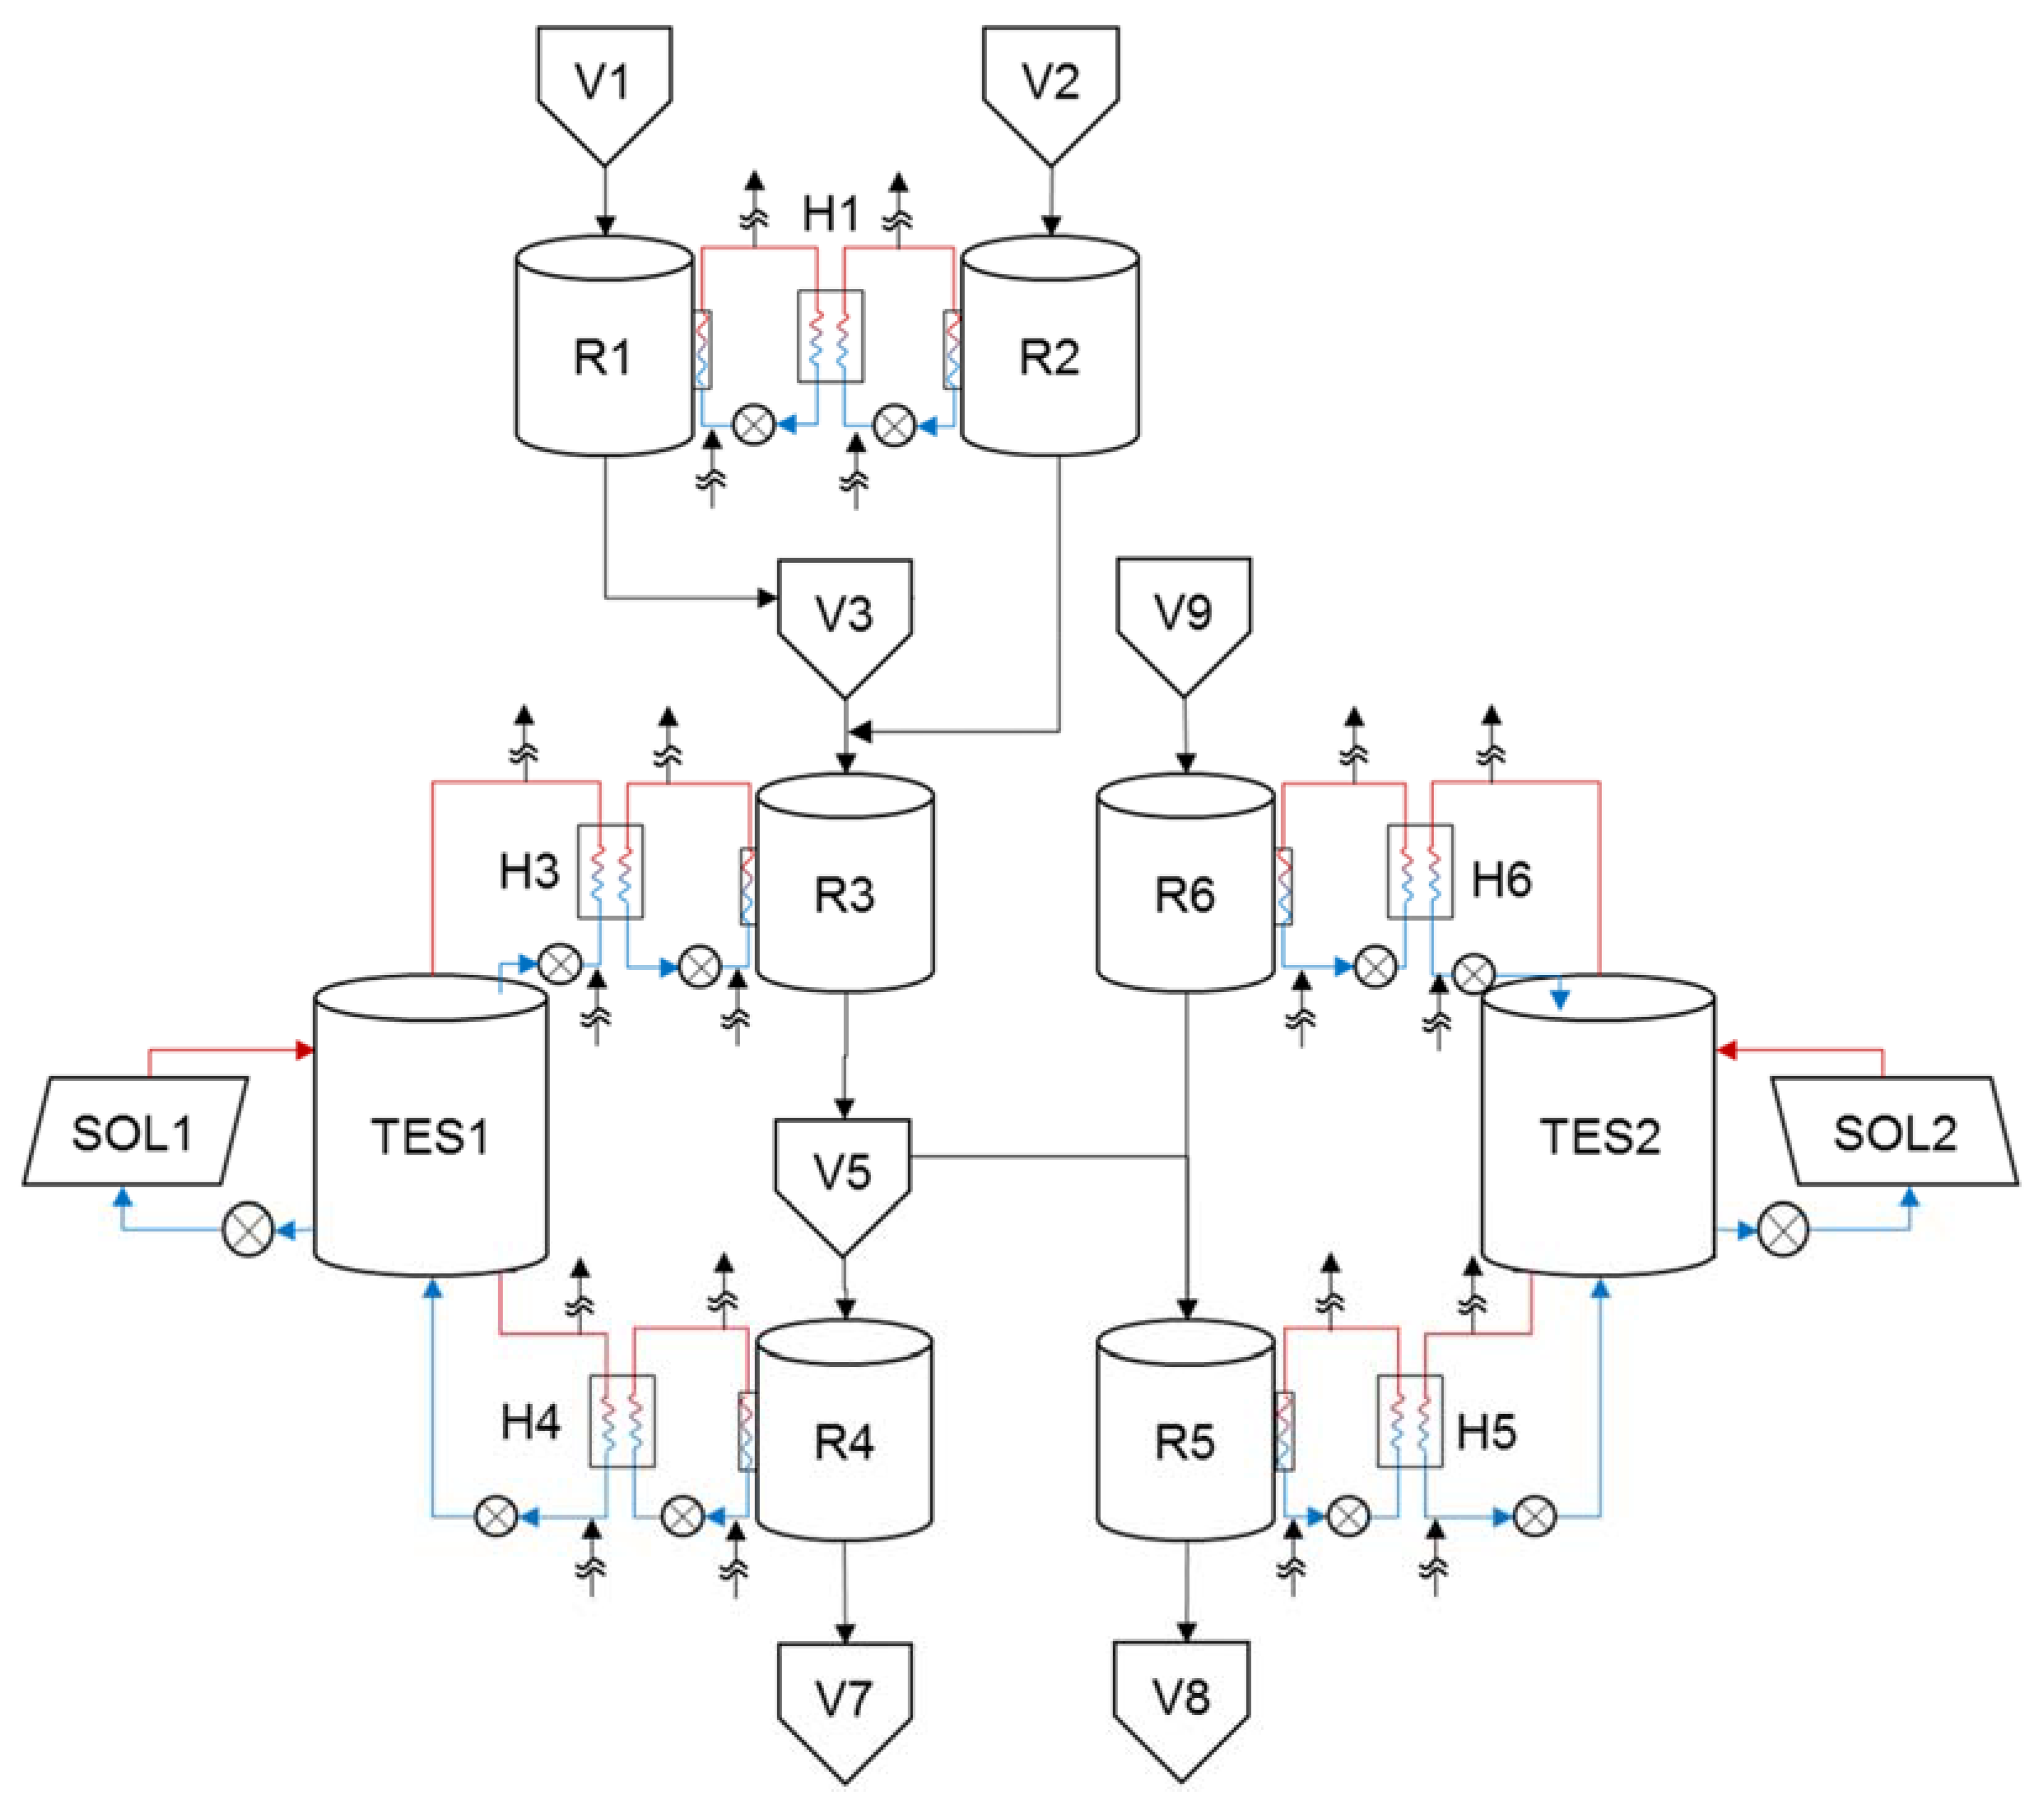
The processing units R1, R2, R3, R4, R5, and R6 can be used for processing tasks, with units R3 and R6 being multipurpose. The raw-materials storage vessels are dedicated and have unlimited capacity. Heat storage units TES1 and TES2 can perform charge/discharge tasks C1/D1 and C2/D2, respectively. The pairs of units R1-R2, R3-TES1, R4-TES1, R5-TES2, and R6-TES2 may process heat integration using the respective heat exchanger unit H1, H3, H4, H5, and H6. Additionally, systems SOL1 and SOL2, with corresponding solar units, may be connected to units TES1 and TES2, respectively. The tasks T1, T3, and T6 operate at 80 °C, 120 °C, and 150 °C, respectively, requiring cooling, while the tasks T2, T4, T5, and T7 require heat and operate at 70 °C, 60 °C, 70 °C, and 80 °C, respectively. The TES units can charge and discharge within their temperature limits.

Results and Discussion: Scenario (a) vs. Scenario (b)

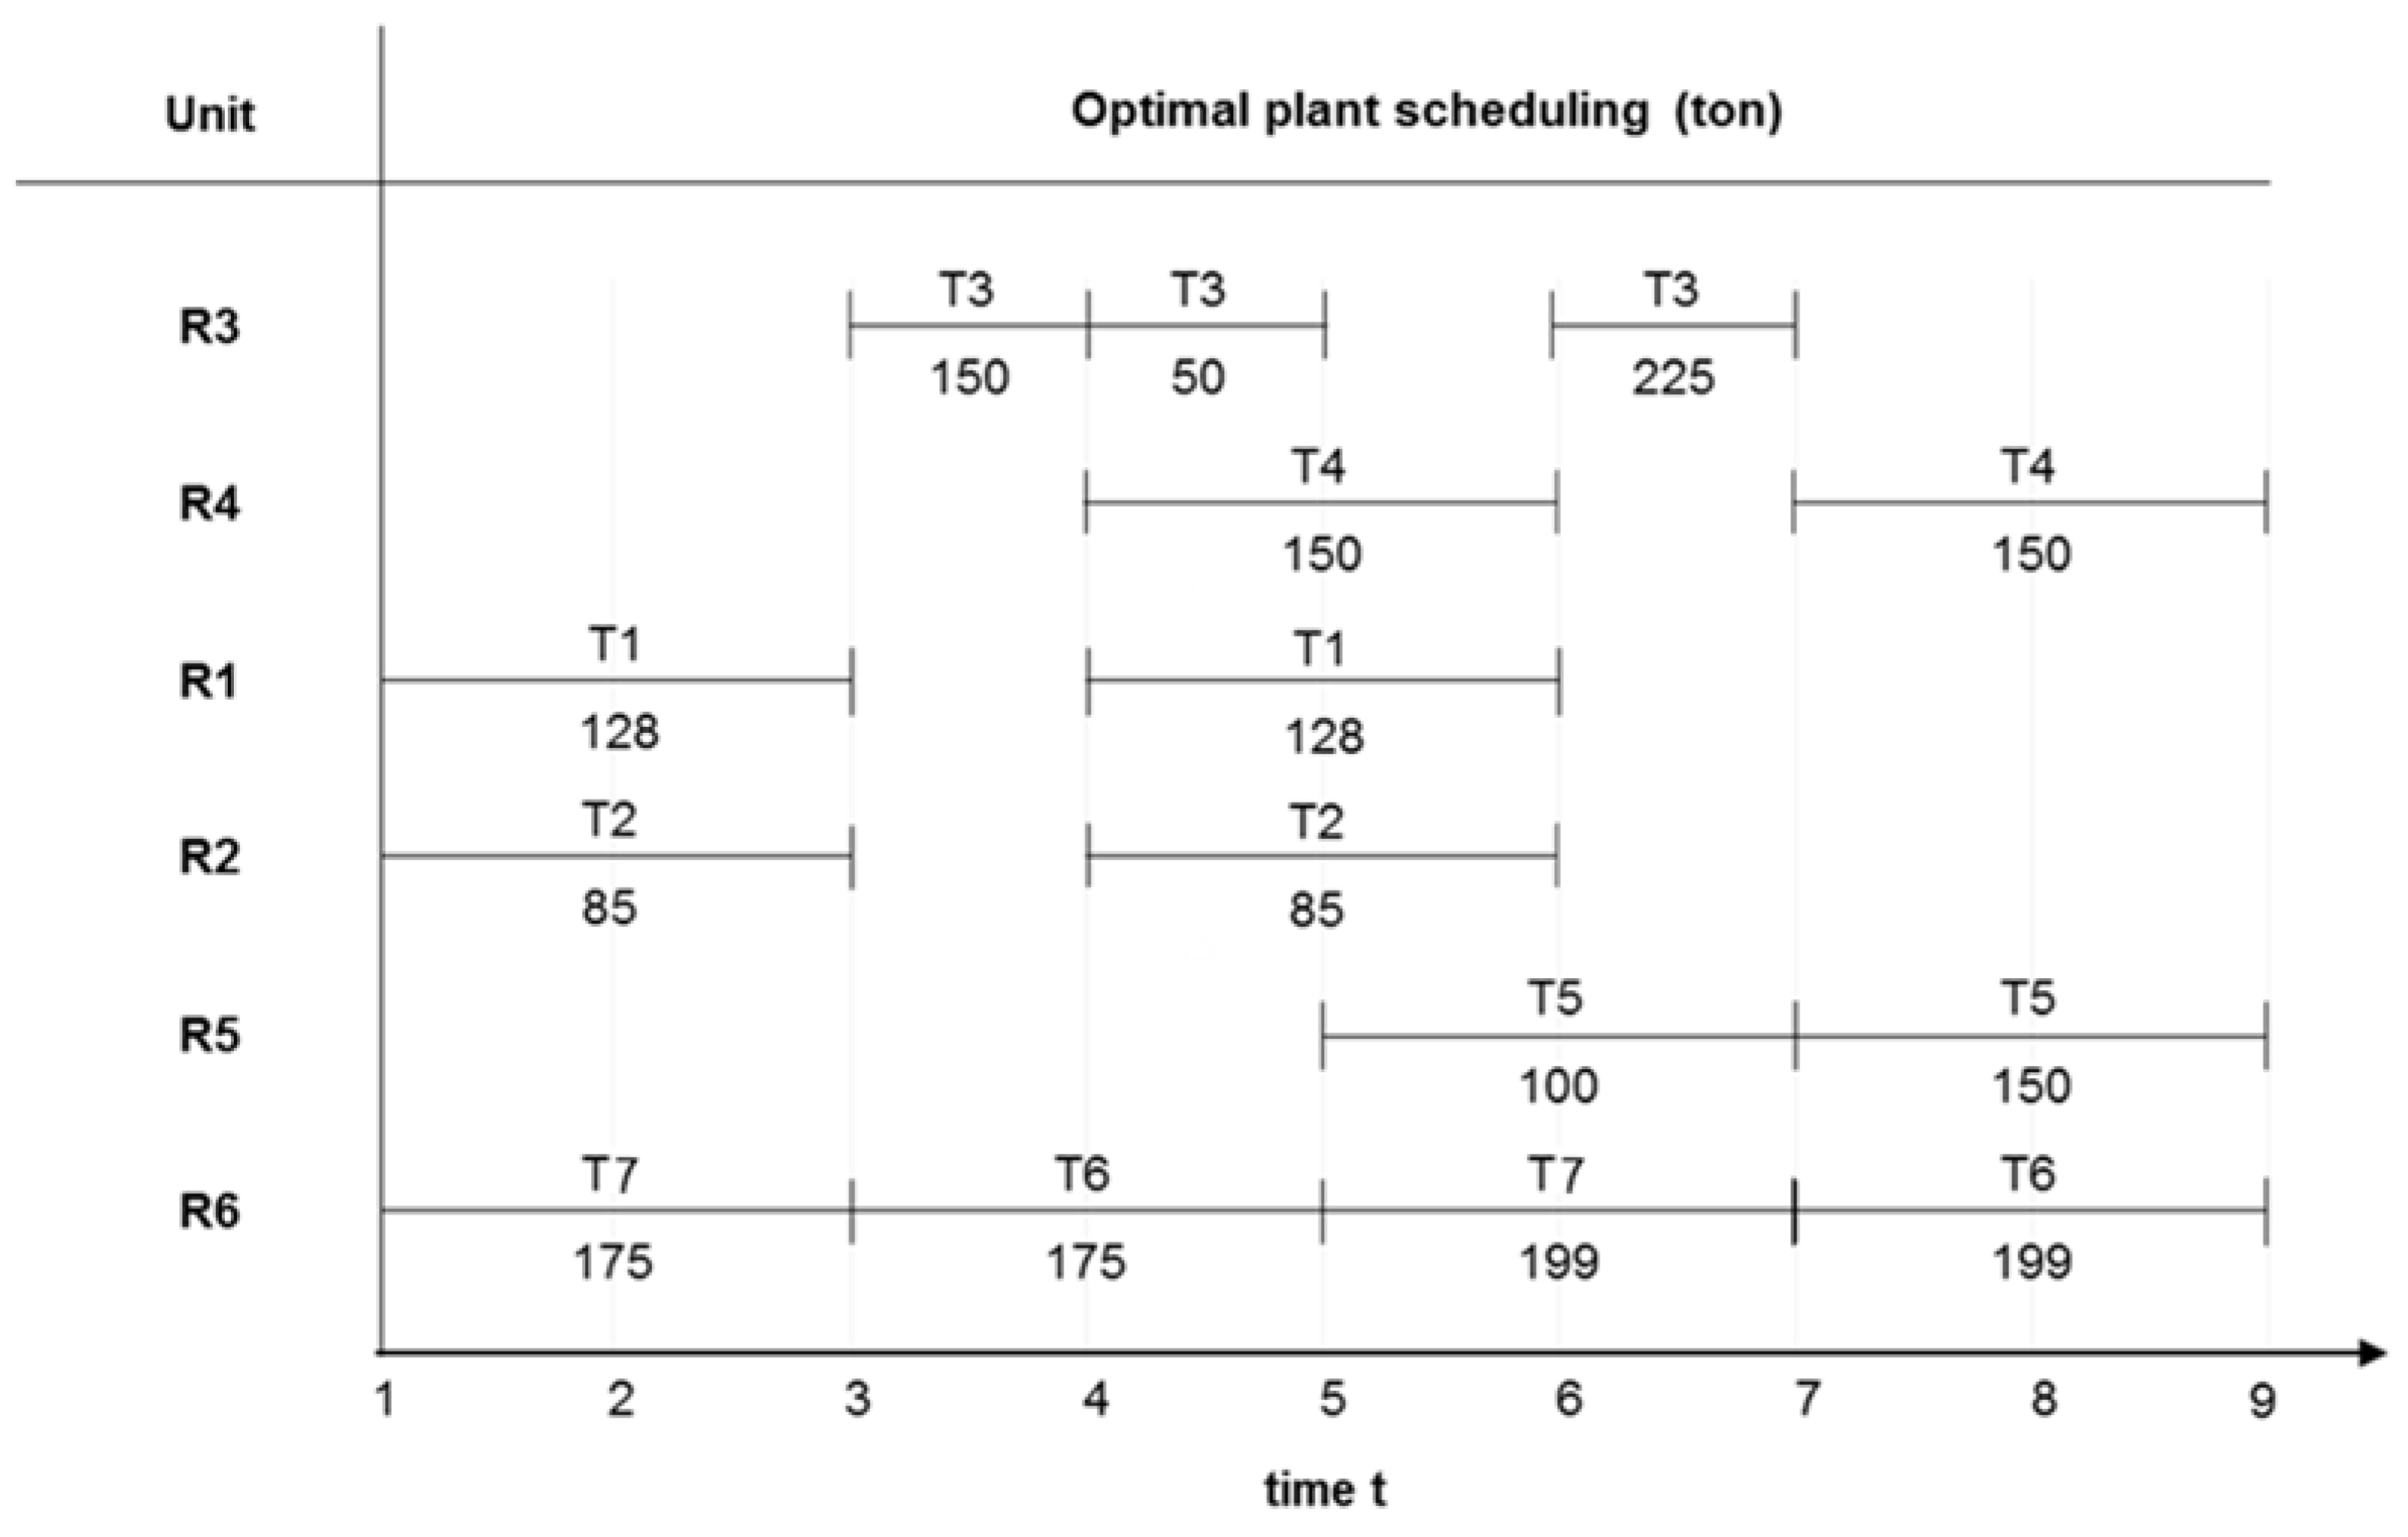
The optimal scheduling and unit design is shown in Figure 12 and Table 8. The schedule shows the process bottleneck as R6, with its multipurpose behaviour, and the process produces 300, 250, and 250 tons for products S7, S8, and S10, respectively. Seven indirect and two direct heat exchanges are characterised during the production horizon, using two TES1/2 connected with 260 and 390 solar panels.
As depicted in the energy profile solution in Figure 13, Tasks T3 and T4 exchange heat with TES1, while tasks T5, T6, and T7 exchange heat with TES2. Two direct heat integrations are performed between tasks T1 and T2, in period t 1 , 3 and 4 , 6 . In both integrations, the energy for task T2 is fully satisfied, while task T1 requires external cooling water to fulfil its remaining energy needs. Task T3 provides 204 kWh and 207 kWh to TES1, through heat exchanger H3, in periods t 3 , 5 and 6 , 8 , respectively. However, an additional amount of 95 kWh from cooling water is required to fulfil the remaining needs of task T3 ( t = 6 ). A direct heat exchange of 110 kWh is performed between tasks T1 and T2, in periods t 1 , 3 and 4 , 6 , through heat exchanger H1. Despite task T2 being self-sufficient, task T1 requires an additional 31 kWh of cooling water. Task T4 perform an indirect heat-exchange strategy with TES1 in periods t 4 , 6 and 7 , 9 , 286 kWh. Tasks T5, T6, and T7 perform a self-sufficient indirect heat exchange with TES2 by receiving/providing heat at 232, 332, and 244 kWh, respectively. SOL1 provides between 23 and 85 kWh to unit TES1, and SOL2 provides between 43 and 114 kWh to unit TES2.
The TESs temperature profile is shown in Figure 14a,b, emphasizing its operability conditions [25,100] °C. The upper limit is reached between the heat exchange of task T6 and TES2. However, to guarantee the upper limit in TES1, it is necessary to use 95 kWh (the difference between 302 and 207 kWh) from external utilities in task T3. In both TES1/2, the heat exchange driving force is verified.
To highlight the reduction of utilities and their impact on the profit, a comparison with the solution without the heat integration is provided, followed by the optimal topology solution in Table 9 and Figure 15. The consumption of the external utilities of water and steam were reduced by 61% and 77%, respectively, and the profit increased by 19%, even by selecting the combination with the installation of the two TES.

5. Conclusions

In this work, an approach to strategic and operational decision levels is proposed to address a sustainable energy source for heat integration, a problem of growing importance in the current industrial context. Through the combined process design and scheduling optimisation, these concerns can be explored by the overall energy consumption strategy of utilities, with direct and indirect heat integration using a solar energy source. This integration is considered through the design optimisation of heat transfer areas, heat storage volumes, and the number of solar collectors. Moreover, the optimal plant topology capacity provided through the selection of the most suitable process equipment is considered to satisfy production demand, and the optimal schedule defines the task sequences and the best heat exchange combination for the given time horizon. The problem was formulated through a MILP discrete-time model, which was implemented and applied to multipurpose industrial-based examples, presenting solutions with low computational times. Along with the direct heat integration (integration of the process streams), the model flexibility allows the TES unit to simultaneously exchange heat with a processing task and the renewable energy source from the solar field. With this ability, these diverse heat integration strategies increase the problem complexity. The obtained results allow the overall problem assessment regarding optimal cost-effective decision support, measuring the increased profitability by significantly reducing the utility consumption with the selection of TES heat storage strategies (e.g., in example II, the profit increased by 19%, with a reduction in utilities costs of over 60%). Despite some assumptions related to the solar field constraints, it is also acknowledged that the enlargement of the time horizon, or assuming more combinatorial issues, can increase the computational time, while trying to preserve the tractability of the MILP. Further work can also be developed to evaluate the performance of heat integration problems using alternative renewable energy sources or cogeneration systems.

Author Contributions

Conceptualization and methodology, P.S. and T.P.-V.; validation, investigation, and formal analysis, P.S., M.V., T.P., and T.P.-V.; writing—original draft preparation, P.S. and T.P-V.; writing—review and editing, M.V. and T.P.; supervision, T.P.-V. All authors have read and agreed to the published version of the manuscript.

Funding

This research was funded by national funds through FCT—Fundação para a Ciência e a Tecnologia—under the projects UIDB/00097/2020, UIDB/00285/2020, UIDB/00319/2020, and PTDC/EME-SIS/6019/2020.

Data Availability Statement

Data is available on request from the authors.

Acknowledgments

The authors would like to acknowledge the financial support from national funds through FCT—Fundação para a Ciência e a Tecnologia—under the projects UIDB/00097/2020, UIDB/00285/2020, UIDB/00319/2020, and PTDC/EME-SIS/6019/2020.

Conflicts of Interest

The authors declare no conflict of interest.

Nomenclature

Sets:
I processing and material storage tasks i
J processing, material storage, and Thermal Energy Storage (TES) units j
S product states s
I p r o c processing tasks i
J p r o c processing units j
J s t o r e dedicated material storage units j
J s s t o r e dedicated storage units suitable for storing state s
K j set of k types of unit j
I j i tasks which can be performed in unit j
J i j units suitable for task i
I s o u t / I s i n i tasks producing/receiving material to state s
S R M / S F i n a l initial/final states s
H E h units suitable to transfer heat
U utilities u
H I i , i h units suitable to transfer heat between tasks i , i I i n t
I u i tasks that can use utility u
U i u utilities suitable for task i
I e x o i tasks that produce heat
I e n d o i tasks that require heat
I j c h i tasks that charge TES unit, j   J T E S
I j d i s c h i tasks that discharge TES unit, j   J T E S
J T E S TES units j
I i n t heat integrated tasks i / j , i / j
Z T volume discretisation for TES unit j   J T E S
Z s number of solar panels connected to TES unit j   J T E S
Parameters:
HTime horizon (discretised with fixed duration δ )
Mbig number
p i processing time of task i
ρ i , s i n / ρ i , s o u t proportion of material of state, s entering/leaving task i
i , j m a x / i , j m i n maximum/minimum utilisation factor of task i in unit j
V j , k m i n / V j , k m a x / V j m a x   maximum/minimum capacity of unit j of type k/overall max value
Q s m i n / Q s m a x minimum/maximum production requirements of material s   S F i n a l
B u , t m a x maximum availability of utility u at time t
c p u heat capacity of utility u
T u temperature difference for utility u
ξ i time offset of task i
Q i , θ / B i , θ fixed/variable heat demand factor of task i at processing time θ
A h m i n / A h m a x   maximum/minimum heat transfer area of unit h
p i , i integration time of tasks i , i I i n t
T l n i i   mean fluid logarithmic temperature difference in unit h per-forming tasks i , i I i n t
C U h overall heat transfer coefficient of unit h
c p w heat capacity of storage fluid w
T i processing temperature of task i
T T E S m a x / T T E S m i n maximum/minimum TES temperature
V z T E S volume of TES unit for z   Z T
R z T o t thermal resistance of TES unit for z   Z T
ρ w density of storage fluid w
T m i n   minimum thermal driving force for integration
T a m b ambient temperature
G t hourly solar radiation
τ α solar collector optical efficiency
U L solar collector 1st order heat loss coefficient
A s o l a r surface area of one solar collector
B S O L m i n / B S O L m a x maximum/minimum flowrate inside solar collector k
N z s o l a r number of solar collectors z   Z S
T s o l a r temperature variation inside the solar collector
H o u r s Y r number of annual working hours
CCFcapital charge factor
v s / p s value/price of state s
O C s operating cost of dedicated storage of state s
O C u U batch size-dependent operational cost of utility u
O C i , j 0 / O C i , j 1 fixed/variable operating cost of task i, in unit j
C C j , k 0 / C C j , k 1 fixed/variable capital cost of unit j of type k
O C 0 s o l a r / O C 1 s o l a r fixed/variable operational cost of solar task
C C 0 T E S / C C 1 T E S fixed/variable capital costs of TES unit
C C h 0 H I / C C h 1 H I fixed/variable capital costs of heat transfer unit h
Binary variables
E j / E j , k 1 if unit j (of type k) is installed, 0 otherwise
E h 1 if heat transfer unit h is installed, 0 otherwise
E j , z T E S 1 if TES unit j   J T E S with volume z   Z T is installed, 0 otherwise
E j , z s o l 1 if the number of solar collectors of option z   Z S is connected to TES unit, j   J T E S , 0 otherwise
W i , j , t   1 if unit j is performing task i Iint at the time t, 0 otherwise
W i , i , h , t   1 if heat transfer unit h is performing heat integration of tasks i , i I i n t , at the time t, 0 otherwise
Continuous variables:
B i , j , t   batch of task i, in unit j, at instant t
V j capacity of processing unit j
S s , t amount of material in the state s, at period t
D s , t amount of material s, delivered at period t
R s , t amount of material s received at period t
B u , i , t U batch of external utility u, required by task i, at period t
Q i , t U heat supplied to task i, by external utility u, at period t
A h heat transfer area of unit h
Q i , t   heat required by processing task i   I p r o c during time t
Q i , i , h , t heat transferred between tasks i , i I i n t , using unit h, at period t
Q j , t l o s s energy lost from TES unit j   J T E S during time t
Q j , t s t o r e d energy stored in TES unit j   J T E S at the beginning of time t
T j , t T E S temperature of TES unit j   J T E S at the beginning of time t
T j , z , t T E S temperature of TES unit j, with z volume at the beginning of time t
η j , t efficiency of solar collector connected to TES unit j   J T E S at time t
T j , t c o l l e c t o r average fluid temperature inside solar collector connected to TES unit j   J T E S at time t
T j , t i n solar collector inlet fluid temperature coming from TES unit j   J T E S at time t
T j , t o u t solar collector outlet fluid temperature going to TES unit j   J T E S at time t
B j , t s o l a r mass flow rate supplied to the solar field at time t, connected to TES unit j   J T E S
Q j , t s o l a r solar heat charged to TES unit j   J T E S at time t
V T E S ,   T T E S volume capacity and temperature of TES unit (linearisation)

References

  1. Chung, B.D.; Kim, S.I.; Lee, J.S. Dynamic supply chain design and operations plan for connected smart factories with additive manufacturing. Appl. Sci. 2018, 8, 583. [Google Scholar] [CrossRef] [Green Version]
  2. Han, X.; Li, R.; Wang, J.; Ding, G.; Qin, S. A systematic literature review of product platform design under uncertainty. J. Eng. Des. 2020, 31, 266–296. [Google Scholar] [CrossRef]
  3. Vieira, M.; Paulo, H.; Pinto-Varela, T.; Barbosa-Póvoa, A.P. Assessment of financial risk in the design and scheduling of multipurpose plants under demand uncertainty. Int. J. Prod. Res. 2021, 59, 6125–6145. [Google Scholar] [CrossRef]
  4. Woolway, M.; Majozi, T. A novel metaheuristic framework for the scheduling of multipurpose batch plants. Chem. Eng. Sci. 2018, 192, 678–687. [Google Scholar] [CrossRef]
  5. Harjunkoski, I.; Maravelias, C.T.; Bongers, P.; Castro, P.M.; Engell, S.; Grossmann, I.E.; Hooker, J.; Méndez, C.; Sand, G.; Wassick, J. Scope for industrial applications of production scheduling models and solution methods. Comput. Chem. Eng. 2014, 62, 161–193. [Google Scholar] [CrossRef] [Green Version]
  6. Seid, E.R.; Majozi, T. Optimization of energy and water use in multipurpose batch plants using an improved mathematical formulation. Chem. Eng. Sci. 2014, 111, 335–349. [Google Scholar] [CrossRef]
  7. Abdelhady, F.; Bamufleh, H.; El-Halwagi, M.M.; Ponce-Ortega, J.M. Optimal design and integration of solar thermal collection, storage, and dispatch with process cogeneration systems. Chem. Eng. Sci. 2015, 136, 158–167. [Google Scholar] [CrossRef]
  8. Harik, R.; El Hachem, W.; Medini, K.; Bernard, A. Towards a holistic sustainability index for measuring sustainability of manufacturing companies. Int. J. Prod. Res. 2015, 53, 4117–4139. [Google Scholar] [CrossRef]
  9. Trianni, A.; Cagno, E.; Neri, A.; Howard, M. Measuring industrial sustainability performance: Empirical evidence from Italian and German manufacturing small and medium enterprises. J. Clean. Prod. 2019, 229, 1355–1376. [Google Scholar] [CrossRef]
  10. Li, Z.; Ierapetritou, M.G. Integrated production planning and scheduling using a decomposition framework. Chem. Eng. Sci. 2009, 64, 3585–3597. [Google Scholar] [CrossRef]
  11. Vázquez, D.; Guillén-Gosálbez, G. Process design within planetary boundaries: Application to CO2 based methanol production. Chem. Eng. Sci. 2021, 246, 116891. [Google Scholar] [CrossRef]
  12. Pinto, T.; Novais, A.Q.; Barbosa-Póvoa, A.P.F. Optimal design of heat-integrated multipurpose batch facilities with economic savings in utilities: A mixed integer mathematical formulation. Ann. Oper. Res. 2003, 120, 201–230. [Google Scholar] [CrossRef]
  13. Lee, J.-Y.; Seid, E.R.; Majozi, T. Heat integration of intermittently available continuous streams in multipurpose batch plants. Comput. Chem. Eng. 2015, 74, 100–114. [Google Scholar] [CrossRef]
  14. Castro, P.M.; Custódio, B.; Matos, H.A. Optimal scheduling of single stage batch plants with direct heat integration. Comput. Chem. Eng. 2015, 82, 172–185. [Google Scholar] [CrossRef]
  15. Sebelebele, N.; Majozi, T. Heat integration of multipurpose batch plants through multiple heat storage vessels. Comput. Chem. Eng. 2017, 106, 269–285. [Google Scholar] [CrossRef]
  16. Chaturvedi, N.D.; Manan, Z.A.; Alwi, S.R.W. A mathematical model for energy targeting of a batch process with flexible schedule. J. Clean. Prod. 2017, 167, 1060–1067. [Google Scholar] [CrossRef]
  17. Stamp, J.D.; Majozi, T. Long-term heat integration in multipurpose batch plants using heat storage. J. Clean. Prod. 2017, 142, 1492–1509. [Google Scholar] [CrossRef]
  18. Vooradi, R.; Mummana, S.S. Cyclic scheduling and heat integration of batch process: Design of heat storage vessels. Chem. Eng. Res. Des. 2022, 179, 130–142. [Google Scholar] [CrossRef]
  19. Boix, M.; Montastruc, L.; Azzaro-Pantel, C.; Domenech, S. Optimization methods applied to the design of eco-industrial parks: A literature review. J. Clean. Prod. 2015, 87, 303–317. [Google Scholar] [CrossRef] [Green Version]
  20. Aziz, E.A.; Alwi, S.R.W.; Lim, J.S.; Manan, Z.A.; Klemeš, J.J. An integrated Pinch Analysis framework for low CO2 emissions industrial site planning. J. Clean. Prod. 2017, 146, 125–138. [Google Scholar] [CrossRef]
  21. Toimil, D.; Gómez, A. Review of metaheuristics applied to heat exchanger network design. Int. Trans. Oper. Res. 2017, 24, 7–26. [Google Scholar] [CrossRef]
  22. Muster-Slawitsch, B.; Brunner, C.; Padinger, R.; Schnitzer, H. Methodology for batch heat integration and storage system design for ideal integration of solar process heat. Chem. Eng. Trans. 2011, 25, 887–892. [Google Scholar]
  23. Nemet, A.; Klemeš, J.J.; Varbanov, P.S.; Kravanja, Z. Methodology for maximising the use of renewables with variable availability. Energy 2012, 44, 29–37. [Google Scholar] [CrossRef]
  24. Wallerand, A.S.; Kermani, M.; Voillat, R.; Kantor, I.; Maréchal, F. Optimal design of solar-assisted industrial processes considering heat pumping: Case study of a dairy. Renew. Energy 2018, 128, 565–585. [Google Scholar] [CrossRef] [Green Version]
  25. Baniassadi, A.; Momen, M.; Amidpour, M.; Pourali, O. Modeling and design of solar heat integration in process industries with heat storage. J. Clean. Prod. 2018, 170, 522–534. [Google Scholar] [CrossRef]
  26. Rashid, K.; Safdarnejad, S.M.; Powell, K.M. Process intensification of solar thermal power using hybridization, flexible heat integration, and real-time optimization. Chem. Eng. Processing-Process Intensif. 2019, 139, 155–171. [Google Scholar] [CrossRef] [Green Version]
  27. Schoeneberger, C.A.; McMillan, C.A.; Kurup, P.; Akar, S.; Margolis, R.; Masanet, E. Solar for industrial process heat: A review of technologies, analysis approaches, and potential applications in the United States. Energy 2020, 206, 118083. [Google Scholar] [CrossRef]
  28. Kondili, E.; Pantelides, C.C.; Sargent, R.W. A general algorithm for short-term scheduling of batch operations—I. MILP formulation. Comput. Chem. Eng. 1993, 17, 211–227. [Google Scholar] [CrossRef]
  29. Atkins, M.J.; Walmsley, M.R.; Morrison, A.S. Integration of solar thermal for improved energy efficiency in low-temperature-pinch industrial processes. Energy 2010, 35, 1867–1873. [Google Scholar] [CrossRef]
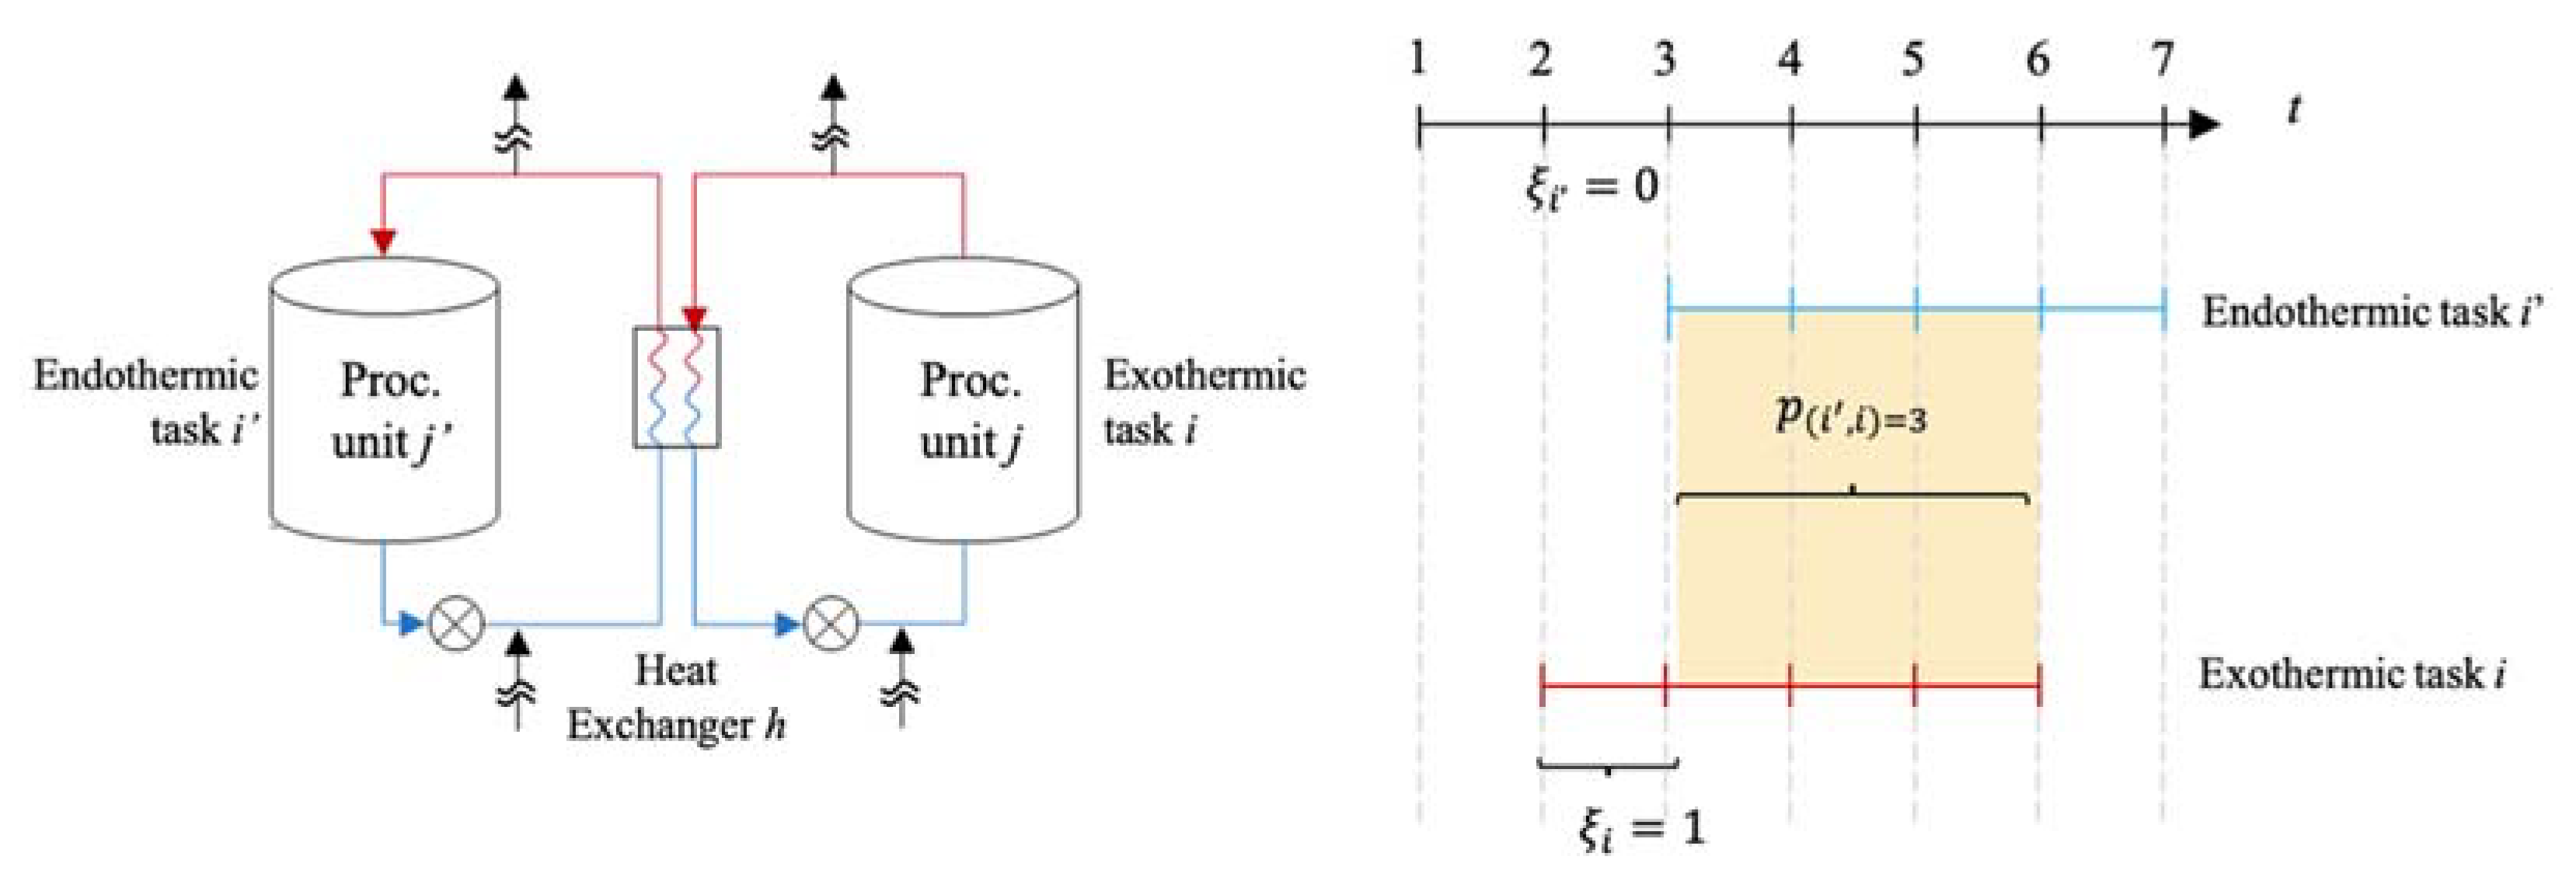
Figure 1. Direct heat integration representation.
Mathematics 10 01941 g001
Figure 2. Thermal energy storage (TES) system and state-task network (STN) representation.
Mathematics 10 01941 g002
Figure 3. STN representation of the products recipe.
Mathematics 10 01941 g003
Figure 4. Optimal scheduling and batch processing solutions for scenarios (a,b).
Mathematics 10 01941 g004
Figure 5. Energy profile for scenario (a).
Mathematics 10 01941 g005
Figure 6. Energy profile for scenario (b).
Mathematics 10 01941 g006
Figure 7. Scenario (b) TES1 temperature profile.
Mathematics 10 01941 g007
Figure 8. Scenario (b) Solar collector efficiency.
Mathematics 10 01941 g008
Figure 9. Plant topology for scenario (a).
Mathematics 10 01941 g009
Figure 10. Plant topology for scenario (b).
Mathematics 10 01941 g010
Figure 11. STN representation of the product recipe.
Mathematics 10 01941 g011
Figure 12. Optimal scheduling and batch processing solution.
Mathematics 10 01941 g012
Figure 13. Energy profile.
Mathematics 10 01941 g013
Figure 14. TES1 (a) and TES2 (b) temperature profiles.
Mathematics 10 01941 g014
Figure 15. Plant topology.
Mathematics 10 01941 g015
Table 1. Brief summary of referenced papers on heat integration.
AuthorsDesignSchedulingObjectiveDirect Heat IntegrationIndirect Heat IntegrationTime Grid
Pinto et al. (2003) [12] YesYesMinimisation of economic indicatorYesNoDiscrete
Seid and Majozi (2014) [6]YesYesMinimisation of wastewater generation and energy utility usageYesYesContinuous
Lee et al. (2015) [13]NoYesMaximisation of heat recovery from process streams YesNoContinuous
Castro et al. (2015) [14]NoYesBi-objective: makespan and utility consumption minimisationYesNoContinuous
Sebelebele and Majozi (2017) [15]YesYesMinimisation of energy consumptionYesYesContinuous
Chaturvedi et al. (2017) [16]No YesMinimisation of energy targets YesYesContinuous
Stamp and Majozi (2017) [17]YesYesMakespan minimisation YesYesContinuous
Vooradi and Mummana (2022) [18]YesYesMakespan minimisationYesYesContinuous
Table 2. Unit characteristics of Example I.
UnitSuitabilityCapacity Min:MaxCosts Fix:Var
(103 c.u.)
R1Task T1/T440:300 m35:0.05
R2Task T2/T570:300 m35:0.05
V1Store S1Unlim.3:0.01
V2Store S2Unlim.3:0.01
V3Store S30:450 m33:0.01
V4Store S40:450 m33:0.01
H3Transfer heat R1-R20:15 m25:1
H1Transfer heat R1-TES10:15 m25:1
H2Transfer heat TES1-R20:15 m25:1
TES1Perform task C1/D11:9 m25:1
SOL1Connect to TES110:400 units5:1
c.u.= currency units.
Table 3. Energy requirements and characteristics of Example I.
TaskTypeHeating/Cooling Fix + Var (kWh)UtilityOperating Temp. (°C)
T1Exothermic 7 + 0.5 BWater120
T2Endothermic4 + 0.3 BSteam100
T4Endothermic8 + 0.9 BSteam60
T5Endothermic6 + 0.4 BSteam70
C1/D1Charge/Discharge- 25–100
Table 4. Optimal unit design solutions.
Unit Scenario (a)
Capacity
Scenario (b)
Capacity
R1+3%287 m3297 m3
R2+67%175 m3292 m3
V30350 m3350 m3
V40400 m3400 m3
H1--6.5 m2
H3--1.3 m2
TES1--4.8 m3
SOL1--400 un.
Table 5. Comparison of scenario solutions.
Scenario (a) Scenario (b)
Profit (c.u. 10³) +11%21,83024,297
External utilities
Water (kWh)−67%604194
Steam (kWh)−52%1178564
Model statistics
CPU time (s) 0.29.1
Int. Variables 56184
Constraints 3361696
Table 6. Unit characteristics of Example II.
UnitSuitabilityCapacity Min:MaxCosts Fix:Var
(103 c.u.)
R1Task T10:150 m35:0.05
R2Task T20:150 m35:0.05
R3Task T3/T60:400 m35:0.05
R4Task T40:150 m35:0.05
R5Task T50:150 m35:0.05
R6Task T6/T70:200 m35:0.05
V1Store S1Unlim.3:0.01
V2Store S2Unlim.3:0.01
V3Store S3Unlim.3:0.01
V4Store S4Unlim.3:0.01
V7Store S70:450 m33:0.01
V8Store S80:450 m33:0.01
V9Store S90:450 m33:0.01
V10Store S10Unlim.3:0.01
H1Transfer heat R1-R20:15 m25:1
H3Transfer heat R3-TES10:15 m25:1
H4Transfer heat R4-TES10:15 m25:1
H5Transfer heat R5-TES20:15 m25:1
H6Transfer heat R6-TES20:15 m25:1
TES1Perform task C1/D11:8 m35:1
TES2Perform task C2/D21:9 m35:1
SOL1Connect to TES110:400 un.5:2
SOL2Connect to TES210:400 un.5:2
Table 7. Energy requirements and characteristics of Example II.
TaskTypeHeating/Cooling Fix + Var (kWh)Operating Temp. (°C)
T1Exothermic7 + 0.5 B80
T2Endothermic4 + 0.6 B70
T3Exothermic9 + 1.3 B120
T4Endothermic8 + 0.9 B60
T5Endothermic6 + 0.8 B70
T6Exothermic 9 + 0.9 B150
T7Endothermic2 + 0.2 B80
C1TES1 charge-25–100
D1TES1 discharge-25–100
C2TES2 charge-25–100
D2TES2 discharge-25–100
Table 8. Optimal scheduling and batch processing solution.
UnitCapacityUnitCapacity
R1128 m3H10.55 m2
R285 m3H32.07 m2
R3225 m3H41.43 m2
R4150 m3H51.26 m2
R5150 m3H61.67 m2
R6199 m3TES15.8 m3
V7300 m3TES19 m3
V8250 m3SOL1260 units
V10250 m3SOL2390 units
Table 9. Solutions comparison.
No Heat-
Integration
With Heat-
Integration
Profit (c.u. 103) +19%21,00924,890
External utilities
Water (kWh)−61%1565609
Steam (kWh)−77%1674387
Model statistics
CPU time (s) 0.62180
Int. Variables 95324
Constraints 6283333
Publisher’s Note: MDPI stays neutral with regard to jurisdictional claims in published maps and institutional affiliations.