Article

XAI-Fall: Explainable AI for Fall Detection on Wearable Devices Using Sequence Models and XAI Techniques

1
Department of Computer Science and Engineering, Institute of Technology, Nirma University, Ahmedabad 382481, India
2
Computer Science Department, Community College, King Saud University, Riyadh 11437, Saudi Arabia
3
Department of Power Engineering, “Gheorghe Asachi” Technical University of Iasi, 700050 Iasi, Romania
4
National Research and Development Institute for Cryogenic and Isotopic Technologies—ICSI Rm. Valcea, Uzinei Street, No. 4, P.O. Box 7 Raureni, 240050 Ramnicu Valcea, Romania
*
Authors to whom correspondence should be addressed.
Mathematics 2022, 10(12), 1990; https://doi.org/10.3390/math10121990
Submission received: 28 April 2022 / Revised: 24 May 2022 / Accepted: 5 June 2022 / Published: 9 June 2022

Abstract

:
A fall detection system is vital for the safety of older people, as it contacts emergency services when it detects a person has fallen. There have been various approaches to detect falls, such as using a single tri-axial accelerometer to detect falls or fixing sensors on the walls of a room to detect falls in a particular area. These approaches have two major drawbacks: either (i) they use a single sensor, which is insufficient to detect falls, or (ii) they are attached to a wall that does not detect a person falling outside its region. Hence, to provide a robust method for detecting falls, the proposed approach uses three different sensors for fall detection, which are placed at five different locations on the subject’s body to gather the data used for training purposes. The UMAFall dataset is used to attain sensor readings to train the models for fall detection. Five models are trained corresponding to the five sensors models, and a majority voting classifier is used to determine the output. Accuracy of 93.5%, 93.5%, 97.2%, 94.6%, and 93.1% is achieved on each of the five sensors models, and 92.54% is the overall accuracy achieved by the majority voting classifier. The XAI technique called LIME is incorporated into the system in order to explain the model’s outputs and improve the model’s interpretability.

1. Introduction

According to the World Health Organization (WHO), the proportion of the world’s population with age > 60 will be doubled (an increase from 12% to 22%) by 2050 [1]. Falling is an action where a person loses balance due to internal or external factors that cause them to collapse. There are many causes for falls; some of them are weak muscles (especially leg muscles), out-of-sync body balance, which can cause your feet to become unstable, dizziness, blackouts, over-consumption of alcohol, etc. [2]. Age is also one of the reasons for body falls in people. As the age of the population increases, the risk of falls in them also increases [3]. Increasing age generally leads to poor vision and weaker muscles, which becomes the most common cause of falls in older people. When a young person falls, the chances of being injured are quite low, but on the contrary, the same is high for an older adult [4]. It is due to their skeletal fragility, i.e., their bones lose their density and strength as people age. Falling accounts for almost 90% of hip fractures in older people [5,6]. Although a collapse affects older people more, it is a problem amongst all age groups. There are a few ways of preventing falls, some of which are mentioned below [7]:
  • Stay physically active: Regular exercise strengthens the muscles and increases flexibility.
  • Get enough sleep: People are more likely to fall if they are sleep-deprived.
  • Limit alcohol consumption: Alcohol can adversely affect the body balance and reflexes of a person.
  • Be extremely careful when walking on slippery surfaces: It is easier to fall on slippery surfaces due to their low coefficient of friction.
  • Keep a bright living space: Bright rooms allow a person to see the surroundings more clearly.
  • Get the aid of assistive devices: Use a cane or walker while walking, use handrails while climbing staircases, etc.
Since falls can cause serious injuries, many wearable devices have been introduced to protect people by sending alert messages to their close ones or emergency contacts. Wearables are devices that can be worn on the body and provide various monitoring and scanning features, including biofeedback or other sensory physiological functions such as biometry-related ones [8,9]. These devices have built-in sensors that monitor the user’s motion. For fall detection, wearables generally rely on sensors such as accelerometers, gyroscopes and magnetometers [10,11,12]. Based on the data given by these sensors, the device can decide whether the person has fallen or not. Apple Watch series five is one such wearable device that supports automatic fall detection and has a unique feature of automatically calling the emergency services within 60 s [13]. Another wearable device is the tango belt, which is worn around the waist and can detect falls automatically. This device can deploy an airbag, similar to the one in cars, which can protect the person from injuring themselves when they fall [14].
Wearable devices have many benefits; they are mobile, portable, low cost, readily available, etc. [15,16]. For fall detection, wearable devices are preferable because, as the name suggests, the devices have to be worn, which means that the device will continuously monitor the person. This is a major advantage for wearables compared to other alternatives such as ambient sensors, which have to be fixed in place [17,18]. Even though these approaches are good at detecting falls, their main disadvantage is that they have to be fixed in place, which means that if a person goes out of frame, the devices will not be able to detect if the person fell or not. A large amount of data are required to train the model for fall detection. The traditional approaches feed data into the model and generate output without showing the user how it makes decisions. Such models are generally known as black-box models [19]. To explain the inner workings of a model, eXplainable Artificial Intelligence (XAI) [20,21] was introduced. It aims to make models more interpretable and easier for naive users to understand their predictions. In fall detection systems, the traditional model takes the decisions based on the data collected from the sensors and does not attempt to explain the prediction results. However, XAI, on the other hand, explains model prediction to make it more interpretable. XAI allows a user to understand which features play a role in prediction and which ones do not.
Motivated from the aforementioned discussion, we propose a Long Short-Term Memory (LSTM)-based sequence model (as the dataset used is time-series), which is trained on five different sensors for fall detection and explains its predictions using Local Interpretation of Model-Agnostic Explanations (LIME) [22]. The explanation for each time-stamp can be obtained using LIME, which can further prove useful to increase model explainability.

1.1. State-of-the-Art Works

This section discusses several state-of-the-art techniques utilized in fall detection systems. The authors of [23] proposed a fall detection system where the accelerometer sensor has been placed on the shoes. Average acceleration is determined for the sensor, and if it goes past the threshold value, it is regarded as a fall. The approach proposed by the authors of [24] utilizes sound waves. When the device senses a sound, it locates the source and then amplifies the signals. The device then classifies the sound as a fall or not. Ref. [25] has proposed a system that features a depth camera to discriminate between the body and surroundings. A randomized decision tree was employed for important joint extractions. A support vector machine is employed in the end for the categorization of falls. Ref. [26] proposed a device featuring a tri-axial accelerometer, microcontroller, and a communication device. The micro-controller collects the data from the accelerometer and recognizes a fall if the threshold is reached. Ref. [27] proposes a wearable sensor for ultra-low-power networks that connect with a smart home system. The equipment is capable of detecting falls which can assist in the monitoring of older people to improve safety. Ref. [28] proposes a wearable sensor-based continuous fall monitoring system that is capable of detecting a fall and determining the falling pattern and the activity related with the fall incidence. A novel radar-based fall detection system is proposed by [29]. An ultrawideband radar has been used to monitor human everyday activities and determine the occurrence of falls. Ref. [17] presented a platform to monitor old persons living alone and, in case of fall detection, convey essential information to family or medical professionals and/or conduct specific actions. Ref. [30] have proposed a 2D LiDAR-based system that is used to gather information from a room. Moreover, KNN and random forest are applied to discriminate between ADL and fall. Ref. [31] utilizes YOLOv5 for enhancing the detection speed of vision-based fall detection and also enhancing the accuracy of identifying overlapping objects. Ref. [32] presents a system for fall detection which is based on integrating convolutional neural networks, RetinaNet and Mobilenet in addition to handcrafted features. The proposed framework relies on handmade characteristics to express the form and motion attributes of the detected human. Ref. [33] proposes a system where the YOLO object detection technique is integrated with temporal classification models and the Kalman filter tracking algorithm, which are utilized to identify falls separately on video streams. Table 1 presents the comparative examination of the aforementioned methodologies.

1.2. Motivation and Research Novelty

There have been many notable works for fall detection systems [23,24,25,26,34], but these systems either take one mobile sensor to detect falls or use fixed sensors that monitor a particular area. Thus, in this paper, we propose a deep learning-based approach which takes into consideration three different sensors attached to five different body parts of the test subject to detect falls in human beings. Now, as these models are complex and difficult to interpret, we also integrate XAI modules with the models to improve their explainability and interpretability. The novelty of the proposed work compared to the works presented in the literature is described as follows. For example, ref. [23] places the sensor quite close to the ground, which leads to less acceleration than the rest of the body. Our approach, however, uses five sensors placed at different locations on the body to provide accurate data. Furthermore, our approach uses the XAI technique to explain how the system makes a decision. The flaw in the system proposed by [24] is that it considers a large item being dropped as a fall. Our paper considers sensors such as accelerometers, gyroscopes and magnetometers, which are not affected by sound waves. Ref. [34] uses Kinect sensors for 3D fall detection. A major drawback of this system is that it is not portable. This means that a person falling outside the range of Kinect sensors will not be detected. Our paper, on the other hand, places the sensors on the human body itself. This means that the sensors continuously monitor detection, irrespective of the location.
Then, ref. [25] fails to detect a fall if one of the joints of the human body is hidden behind an object. Our paper uses sensors that work on motion data and do not require the detection of joints. The success rate of [26] is not very good, as it uses only one accelerometer sensor. On the other hand, our paper uses three sensors for the detection of falls, which provides much better accuracy for detecting falls. If a person trips and falls, the system proposed by [28] finds it very difficult to detect falls as it only uses a single gyroscope sensor. The use of three sensors in our paper allows for more accurate fall detection than using a single gyroscope sensor. Ref. [29] uses ultrawideband radar for fall detection, but no explanations are provided regarding how the model is predicting falls. Our paper, on the other hand, takes the aid of the XAI technique to increase the interpretability of the model and provides insights into how the model detects that a fall has occurred. Ref. [17] also takes the aid of the Kinect sensor, which limits the system to a particular region. Our paper takes the aid of sensors located on the body, which allows them to detect falls at any place. Refs. [31,32,33] performed fall detection on video data which require cameras to be placed everywhere in order to detect falls at any place. Furthermore, the authors have not described how the model detects a fall. Our approach, on the other hand, does not require any cameras for fall detection, as the sensors are sufficient enough for detecting falls at any given place. Moreover, LIME, and the XAI technique, are used to increase the model’s interpretability and explain how the model detects a fall. Based on the aforementioned discussion, the following are the major research contributions of this paper:
  • The UMA-Fall dataset is trained on deep learning-based sequence models to achieve the task of fall detection. We train different models for all the sensors from the experiment, test them and obtain the predictions. We apply a Majority Voting Classifier (MVC) system, which takes the predictions from each sensor model to obtain a final class.
  • We propose an XAI system that is integrated with the trained models that produce explanations for the output of the models. Interpretations specific to the context of falls are generated using LIME as the XAI algorithm.
The flow of the rest of the paper is as follows. Section 2 discusses the system model for fall detection in wearable devices and the proposed sequence-based model approach. Section 3 provides insights on the performance evaluation of the trained model and XAI integration, and finally, Section 4 concludes the paper.

2. The Proposed Sequence-Based Model

This section discusses the system model and the proposed approach for fall detection using the sensor data. Figure 1 depicts the system model for the fall detection system with XAI integration. First, CSV files for each sensor are retrieved from the UMAFall dataset. These files are then utilized to train each sensor model separately. Each sensor model has a different architecture here to accommodate different train dataset sizes. The collective decision of each model is calculated using an MVC. LIME is then applied to obtain local explanations for the outputs of the prediction model. The model’s decision-making process can hence become more transparent, which further increases its interpretability. Figure 2 depicts the proposed system for fall detection. Complete insights about dataset description and preprocessing, model building, predictions, and XAI integration are discussed as follows.

2.1. Dataset Description

Various techniques can be employed to achieve fall detection using ML models. The computer vision-based approach involves a video or image feed of an event to predict the activity type, while the sensor-based approach involves training a model on the dataset collected by wearable devices, which can constantly store movement data. The UMA fall detection [35] dataset is used in this paper, which is a sensor-based wearable device dataset and falls under the category of time-series dataset [36]. It consists of 746 samples for a variety of test subjects. Five different kinds of wireless sensors are set up for each test subject, one of which is a smartphone and the other four being sensor tags. The smartphone is always placed in the right pocket, and the other four sensors are attached to the test subject’s ankle, chest, waist, and wrist. Each sensor transmits tri-axial ( V = [ x , y , z ] ) accelerometer, gyroscope, and magnetometer data using the Bluetooth [35], which is stored along with a timestamp at each transmission interval. Two types of activities are considered, namely Activity Daily Life (ADL) and fall. ADL includes 12 different sub-activities and fall includes three sub-scenarios, namely forward fall, backward fall, and lateral fall. Label mappings for the experiment can be seen in Table 2. The dataset is obtained under controlled settings, and readings are obtained from the sensor by performing deliberate natural-seeming falls on several surfaces. A total of 17 subjects were involved in collecting this dataset, out of which 10 were males and seven were females. The age range of the subjects involved in the experiment is 18–55 years. The average weight of the subjects was found to be around 70 kg, and the mean height was found to be around 171 centimetres. The dataset is stored in the form of CSV rows and columns. There are a total of seven columns, namely timestamp, sample number, x-axis, y-axis, z-axis, sensor type, and sensor ID. While the column names are fixed, the number of rows/total timestamp for each activity for different subjects may vary. The UMA Fall dataset is freely available on the internet at [35]. It should be noted that the UMA fall dataset has some limitations. The experiment for obtaining sensor readings for falls/ADL is carried out in a simulated environment. The use of a simulated environment raises the question of whether the simulated activities are indicative of their real-world equivalents. Because the sensors are evaluated in a controlled environment, they generally have better sensitivity and specificity, but the detection rate drops in real-world scenarios [37]. As a result, assessing the performance of a system whose sensors have gathered data from a simulated environment would be challenging.

2.2. Data Preprocessing

This section discusses data pre-processing and initial data preparation. There are 746 different samples of the sensor data, each derived from a test subject with sensors attached to body parts. Each CSV file contains the data collected by the different sensors. We first separate the values according to the sensor IDs; i.e., the data collected from the ankle sensor, chest, right pocket, waist and wrist is separately stored. The tri-axial data containing the vector V = [ x , y , z ] are the sensor data. We calculate the Signal Magnitude Vector (SMV) [35] for these vectors and store them. Hence, three features for each timestamp now become a single value.
s m v i j = x i j 2 + y i j 2 + z i j 2
i trainset
j timestamps
Since for each sensor, the number of timestamps may vary and for training purposes, only a fixed number of timestamps should be given, we downsample the data to obtain constant 350 timestamps for all the rows in the dataset. In addition, we intend to train the data on the LSTM-based sequence model; hence, it is recommended that the maximum length of timestamps should be kept below 500. It is observed that LSTMs with timestamp length greater than 500 generally suffer from a vanishing gradient problem. Choosing a specific number, 350, ensures maximum retention of the data after downsampling, and LSTM does not suffer from the vanishing gradient problem. For each timestamp, the feature space is further split into two attributes: SMV values and sensor type, which are continuous and categorical, respectively. We further obtain sensor-wise datasets and create a single file for each of them. Each of these files further undergoes a normal train test split. The arguments s t r a t i f y = t a r g e t   l a b e l s   c o l u m n are added to the train–test split function of the built-in and trusted python library sklearn. Hence, uniform distributions of fall and ADL categories in the dataset are ensured. The ratio of split taken here for each of these files is 30% test for every 70% train data. Hence, we obtain five different training data files which will be trained on five different models. These models will then be evaluated on the corresponding five different test data files.

2.3. Prediction Model

As discussed earlier, there are five different sensor-wise datasets based on the placement of the sensor on the body. We train a different model on each of these datasets. Hence, there will be a total of five different trained sequence models. The LSTM-based sequence models have proved efficient for time series forecasting and classification. The model configuration used for each sensor is presented in Table 3. To predict whether an activity is a fall or not, we apply MVC to the individual prediction probabilities obtained from each sensor model. For example, if the ankle, chest, and right pocket models classify the activity as a fall based on the input data, the remaining sensor models (waist and wrist) classify the activity as ADL. An MVC, in this case, would conclude that the activity is a fall, as it is the higher voted label than the ADL class.

2.4. XAI Features for Complexity Reduction

XAI can be an essential tool for explaining model prediction and feature importance. It is a tool that can help in model interpretation. In this paper, we use LIME as the XAI method to generate local explanations to interpret the model predictions. LIME is a model-agnostic explanation technique, which is independent of the model type. Given sample data and the trained model, LIME can generate individual feature explanations by producing importance values. The greater the lime value, the more the feature affects positive predictions of the class labels. The overall goal of LIME is to produce an interpretable representation that is locally faithful to the classifier [22]. We apply LIME (as shown in Algorithm 1) to the trained sensor-wise models and attempt to explain obtained values by comparing them with the original signal values from the input test example. The benefit of LIME as XAI is to reduce the model complexity and increase the interpretability by unrevealing explanations at different timestamps.
Algorithm 1 Applying LIME on the trained sensor models.
    Input: train_set, test_sample, sensor_model, sensor_type, num_features
    Output: lime
1:  time_stamps ← 350
2:  exp = LimeExplainer(train_set)
▷ Applying LIME on the trained model
3:  lime = exp.explain(test_sample,model,num_features)
4:  feature_smv = lime[’smv’,’sensor_type’]
▷ Extracting lime values for a particular input sensor_type
5:  indices = (feature_smv[:,1] == sensor_type)
6:  dataframe = DataFrame(feature_smv[indices]) return dataframe
The forthcoming section discusses the performance of the proposed sequence models and the results of the applied LIME technique as discussed above.

3. Performance Evaluation

The prediction results of the proposed deep learning-based model and LIME predictions have been discussed in this section. Evaluation metrics or performance measures provide comprehensive insights on the merits of a particular trained machine learning model. LIME, a model agnostic XAI technique, is further used to explain the training and feature importance of the proposed models.

3.1. Evaluation Metrics

Evaluation metrics give us a comprehensive idea about model performance and statistics. The classification problem, which is a supervised machine learning paradigm, has been discussed in this paper. Whether a collapse is detected or not largely depends upon the model training and its prediction efficiency. Evaluation metrics hence provide us with a medium to check the correctly and incorrectly identified predictions. The performance measurement for binary classification can be seen below.

3.1.1. Accuracy Score
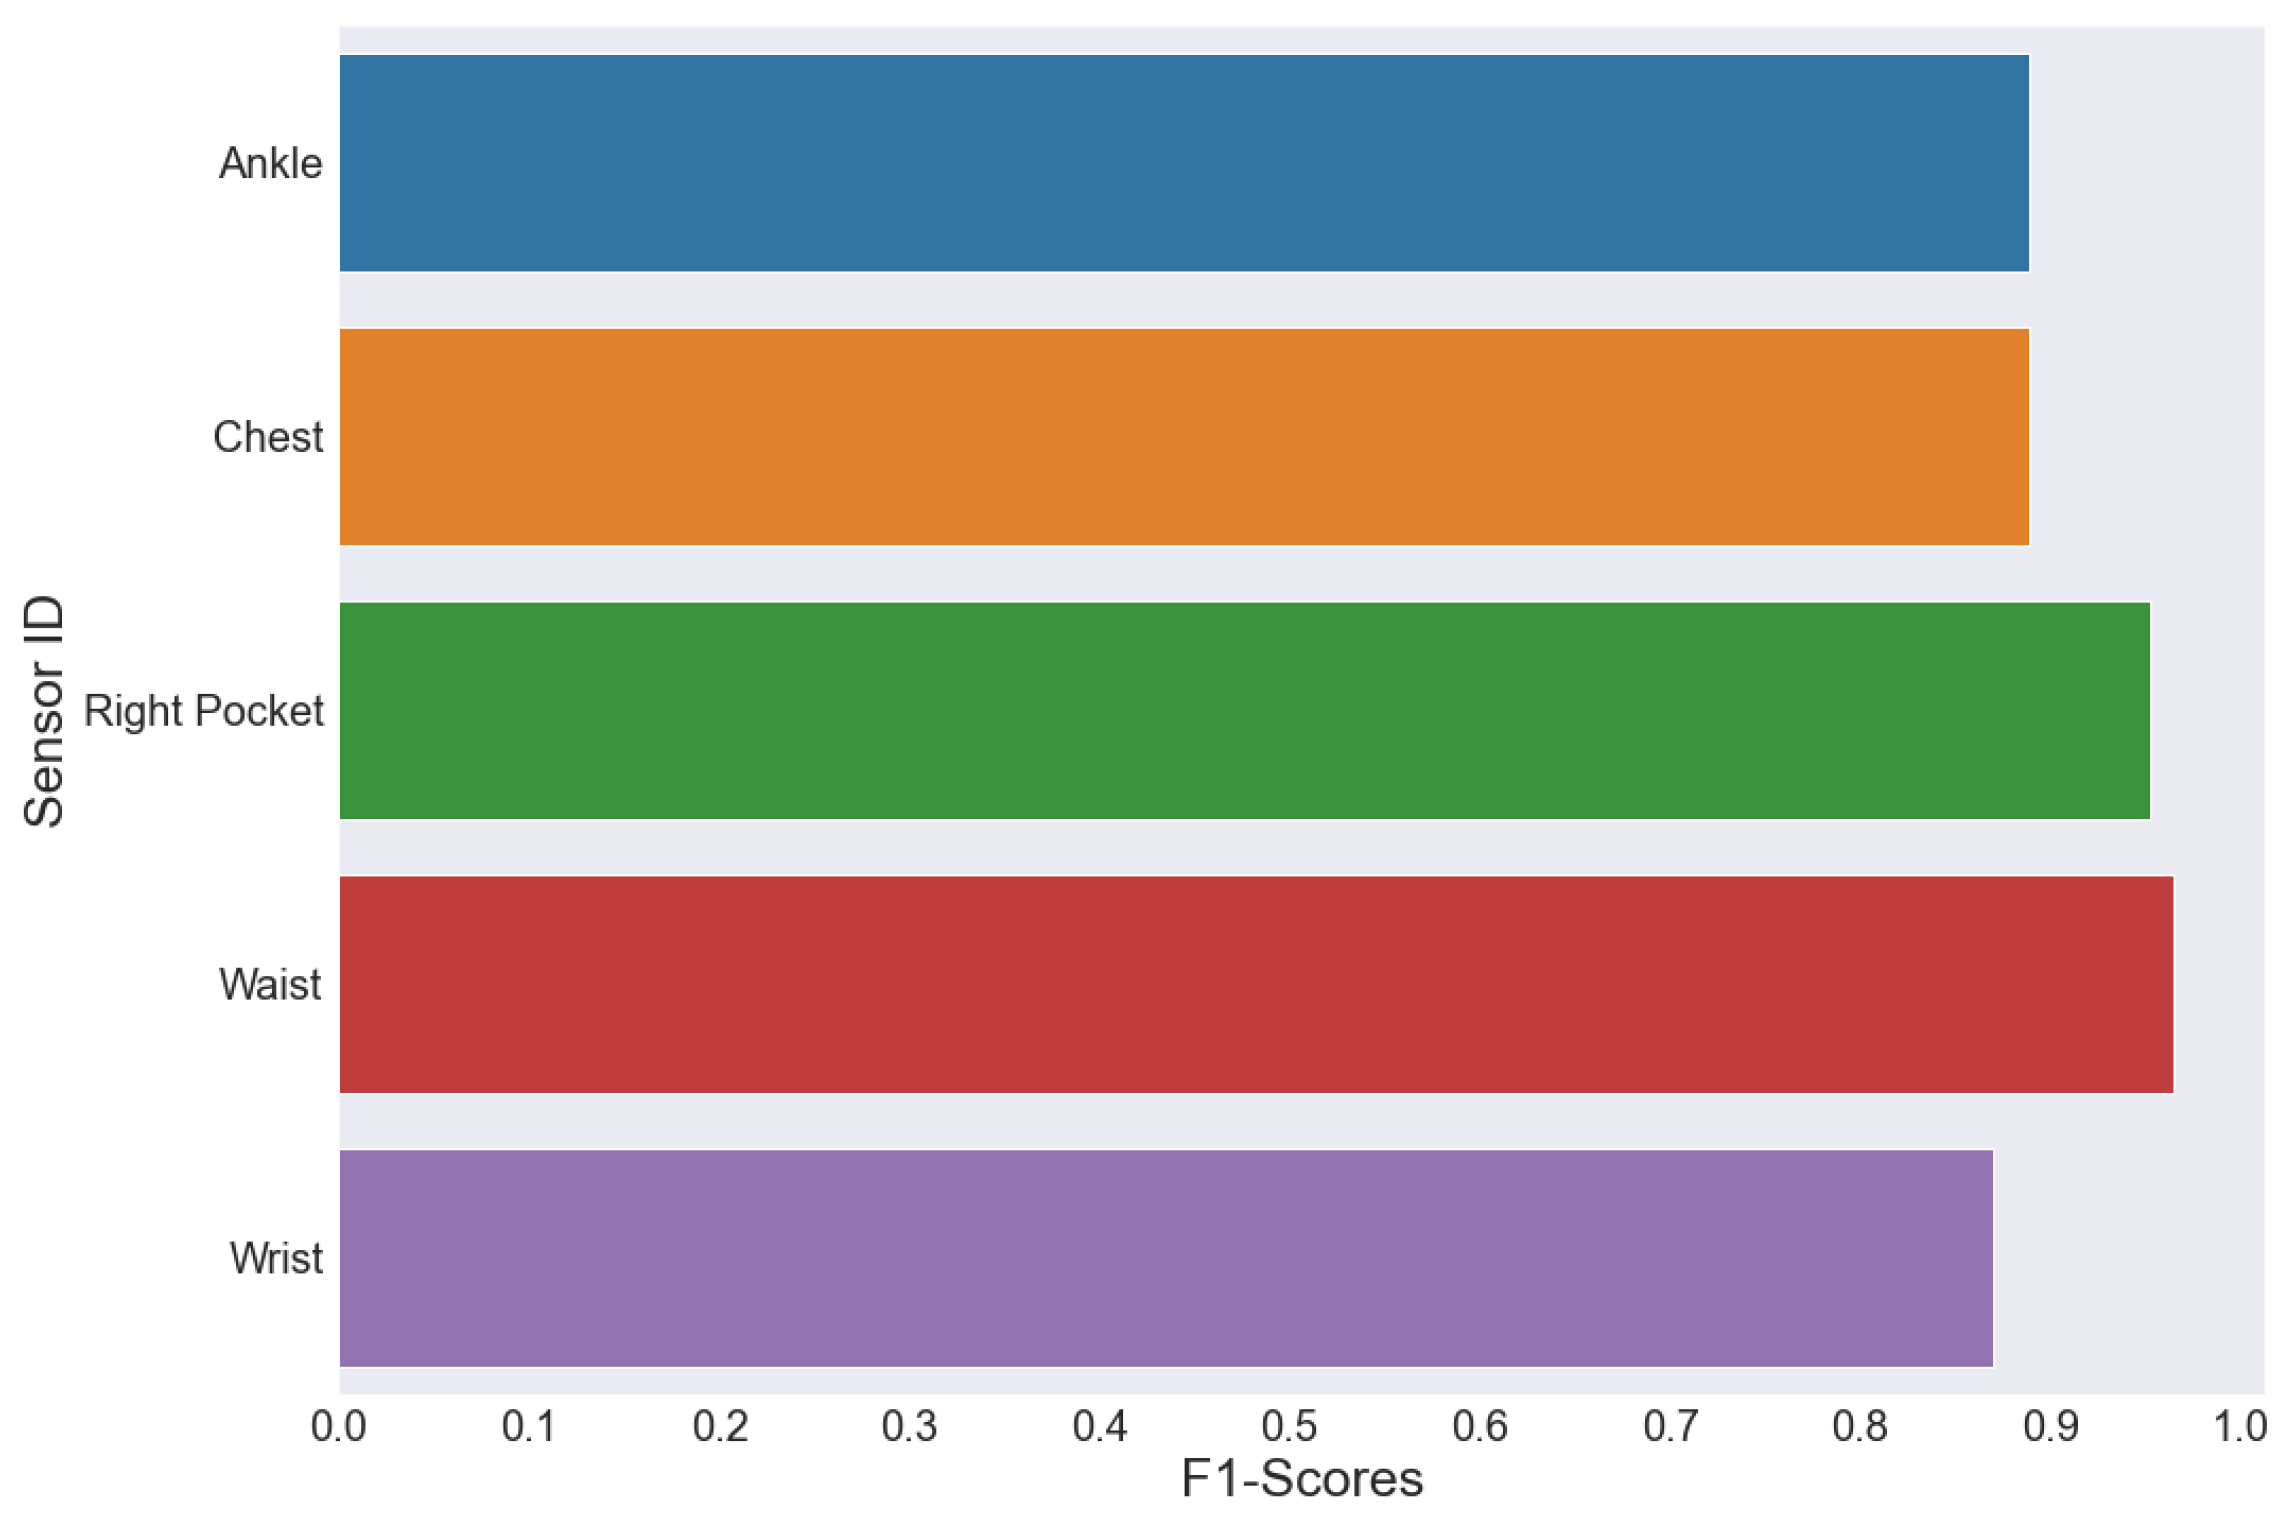
Accuracy scores can be calculated on the train and the test dataset. It can be mathematically seen as below.
Accuracy Score = i = 1 d T P i i = 1 d T P i + F P i + F N i
d = number of classes. Here, d = 2 for our case, as we are performing binary classification, where TP = True Positive, FP = False Positive, FN = False Negative.
Figure 3 presents the accuracy plot for the sensor-wise trained models. It is important to note that the sensor’s accuracy should not be compared with one another, as these models are trained on different data collected by that particular sensor. A confusion matrix for the predicted value after applying MVC is depicted in Figure 4. The overall accuracy obtained after applying MVC is 92.54%. The following is the mathematical representation for calculating MVC:
y ^ = m o d e { C 1 ( x ) , C 2 ( x ) , , C 5 ( x ) }
where y ^ signifies the final predicted class label and C 1 ( x ) , C 2 ( x ) , , C 5 ( x ) is the predicted class label by each of the five sensors. The mode of all predicted class labels is taken, and this value becomes the MVC’s final predicted class label.

3.1.2. F1-Score

F1-score is another common metric that can provide specific insights on the model performance. The greater the F1-score, the better the model performance. The F1-score can be mathematically defined as the harmonic mean of precision and recall values [38,39].
F 1 = ( 2 × Precision × Recall Precision + Recall )
Figure 5 presents F1-scores for the trained sequence models on the test dataset. Previously, we discussed results of evaluation metrics; specifically, accuracy and F1-scores are presented above. The forthcoming section shall present the LIME results and generate example-specific local explanations for the models.

3.2. Lime Results

As discussed above, LIME provides local explanations for model explainability and interpretation. The UMA-Fall detection data were trained using LSTM models and further used to obtain LIME results. Python’s “lime” library [40] was used to generate explanations in this paper. As there are 350 timestamps for each training example for all sensor tags, the number of features for each training example also becomes 350. The LIME model can be used to generate importance scores for these timestamps. This importance score can be interpreted as the effect of a particular feature for contribution to the final class results. Below, LIME values for a few sensors are calculated and plotted using a bar-plot. Both the class labels, ADL and fall, have been presented in the figures below. This paper also tries to correlate between the SMV values at a certain timestamp with the sequential changes in the LIME values of a particular training example. In addition, it is important to note that the LIME graphs presented below are generated for sensor-type accelerometers. However, it is not imperative, as LIME values can also be calculated for the other sensor types.
Figure 6 presents a comparison between the SMV plot and the generated LIME values for fall as the activity class. A positive LIME value for a particular timestamp denotes that the feature positively predicts the correct class label. As we can see, the initial LIME values in Figure 6b are positive, comparing them with initial timestamps in Figure 6a, it can be inferred that the sudden changes in SMV values depicted by spikes as shown in Figure 6a positively affect the predictions for the model; i.e., it supports the fall as the prediction class. Now, as the fall ends, the SMV signal changes, and the LIME values are negatively affected. These subsequent negative LIME values in Figure 6b further support predictions of the model toward the ADL activity class. This is because as a person falls, he/she lies down on the surface, and the body comes to a stop. Since the body comes to a rest position, not many variations in SMV values are found. Such correlations can be generated by examining the LIME outputs and SMV signals, thereby also increasing the explainability of the outputs of the trained model.
Figure 7 presents a similar comparison between LIME values and SMV, but here, ADL as the activity class is taken into consideration. Unlike LIME values for the fall class (where positive LIME values represent feature contribution for positive/fall class prediction and negative LIME values represent negative/ADL class predictions), here, negative LIME values suggest high feature contributions for predicting the ADL class and vice versa. As we can see in the Figure 7b, the initial LIME values are positive, depicting the contributions for predicting the fall class instead of ADL. However, as time proceeds and as SMV values change, negative LIME values for timestamps start to become more significant, denoting a positive contribution to predicting the correct class, i.e., the ADL class for this particular sample. For the last few timestamps, it can be visualized that there are more negative LIME predictions than positives, which shows that the timestamps at the end of the activity, particularly shown above, have high feature importance and influence more in predicting the ADL class. This implies that the trained model eventually at the finish of the activity ends up predicting the class of the sample correctly.
Such LIME graphs can be analyzed to know if the prediction model is trained properly or if the model architecture is designed appropriately. A poorly performing model may result in an incorrect class prediction. Using LIME values can help here to analyze the event for each timestamp, thereby obtaining specific insights about model performance. We can obtain insights as to why the model took a specific decision at a particular timestamp and whether the overall model performance is satisfactory. Such analysis can prove helpful in taking necessary steps in updating the model architectural pipeline to increase the model performance.

4. Conclusions

This paper trained five different LSTM-based sequence models for each sensor tag on UMA-Fall sensor data and evaluated them. We further proposed an MVC-based approach for fall detection using the data transmitted by all five sensors on the test subject. Accuracy and F1-scores were plotted, as seen in the Results section. To generate local explanations for the proposed sequence models, we use an XAI-based model-agnostic technique called LIME and obtain its values for different timestamps. Interpretations of the model’s outputs predicted LIME values and correlations with real-life scenarios are described using two specific samples belonging to different classes. Different LIME graphs for ADL and fall activities are obtained, showing unique fashion decision-making patterns in the prediction models. For classes predicting the class ADL, the majority of negative LIME values are obtained, whereas for the class fall, positive LIME values are obtained in the majority. Although the explanations proposed in this paper give specific insights about the model’s prediction, it does not completely solve the black-boxes issue of modern machine learning algorithms.
In the future, we would further optimize the system to reduce the time complexity of the prediction models by allowing variable length timestamps for each of the data input streams and performing predictions accordingly. Variable length timestamp also allows the LIME-based explainability module to dynamically present the explanations for the resulting predictions and reduces the inference time of the explanations.

Author Contributions

Conceptualization: A.T., H.M., M.S.R. and S.T.; writing—original draft preparation: D.J., A.A., R.G. and B.-C.N.; methodology: A.A., B.-C.N. and S.T.; writing—review and editing: R.G., H.M., D.J. and A.T.; Investigation: B.-C.N., M.S.R. and S.T.; Visualization: H.M. and R.G. All authors have read and agreed to the published version of the manuscript.

Funding

This research was funded by the Researchers Supporting Project No. (RSP2022R444) King Saud University, Riyadh, Saudi Arabia.

Institutional Review Board Statement

Not applicable.

Informed Consent Statement

Not applicable.

Data Availability Statement

No data are associated with this reserach work.

Acknowledgments

This work was funded by the Researchers Supporting Project No. (RSP2022R444) King Saud University, Riyadh, Saudi Arabia and partially funded by Subprogram 1.1. Institutional performance-Projects to finance excellence in RDI, Contract No. 19PFE/30.12.2021 and a grant of the National Center for Hydrogen and Fuel Cells (CNHPC)—Installations and Special Objectives of National Interest (IOSIN) and also supported by Gheorghe Asachi Technical University of Iasi, Romania.

Conflicts of Interest

The authors declare no conflict of interest.

References

  1. Ageing and Health. 2021. Available online: https://www.who.int/news-room/fact-sheets/detail/ageing-and-health (accessed on 4 October 2021).
  2. Aziz, O.; Robinovitch, S.N. An Analysis of the Accuracy of Wearable Sensors for Classifying the Causes of Falls in Humans. IEEE Trans. Neural Syst. Rehabil. Eng. 2011, 19, 670–676. [Google Scholar] [CrossRef] [PubMed] [Green Version]
  3. Falls. 2021. Available online: https://www.who.int/news-room/fact-sheets/detail/falls (accessed on 26 April 2021).
  4. Yogi, R.; Sammy, I.; Paul, J.; Nunes, P.; Robertson, P.; Ramcharitar Maharaj, V. Falls in older people: Comparing older and younger fallers in a developing country. Eur. J. Trauma Emerg. Surg. 2018, 44, 567–571. [Google Scholar] [CrossRef] [PubMed]
  5. Causes of Falls. 2021. Available online: https://www.nhsinform.scot/healthy-living/preventing-falls/causes-of-falls (accessed on 16 September 2021).
  6. Alshehri, M.D. A System and Method for Prevention of Cyber Attacks in Real-Time Healthcare Industry Using Ann. Available online: https://patentscope.wipo.int/search/en/detail.jsf?docId=AU339289702&_cid=P22-L19S11-49719-1 (accessed on 21 October 2021).
  7. Prevent Falls and Fractures. 2021. Available online: https://www.nia.nih.gov/health/prevent-falls-and-fractures (accessed on 15 March 2017).
  8. Ometov, A.; Shubina, V.; Klus, L.; Skibińska, J.; Saafi, S.; Pascacio, P.; Flueratoru, L.; Gaibor, D.Q.; Chukhno, N.; Chukhno, O.; et al. A Survey on Wearable Technology: History, State-of-the-Art and Current Challenges. Comput. Netw. 2021, 193, 108074. [Google Scholar] [CrossRef]
  9. Khan, S.; Parkinson, S.; Grant, L.; Liu, N.; Mcguire, S. Biometric Systems Utilising Health Data from Wearable Devices: Applications and Future Challenges in Computer Security. ACM Comput. Surv. 2020, 53, 1–29. [Google Scholar] [CrossRef]
  10. Wisesa, I.; Mahardika, G. Fall detection algorithm based on accelerometer and gyroscope sensor data using Recurrent Neural Networks. IOP Conf. Ser. Earth Environ. Sci. 2019, 258, 012035. [Google Scholar] [CrossRef]
  11. Wu, F.; Zhao, H.; Zhao, Y.; Zhong, H. Development of a wearable-sensor-based fall detection system. Int. J. Telemed. Appl. 2015, 2015, 1–12. [Google Scholar] [CrossRef] [PubMed] [Green Version]
  12. Khan, I.; Hassan, M.; Alshehri, M.; Ikram, M.; Alyamani, H.J.; Alturki, R.; Truong, V. Monitoring System-Based Flying IoT in Public Health and Sports Using Ant-Enabled Energy-Aware Routing. J. Healthc. Eng. 2021, 2021, 1686946. [Google Scholar] [CrossRef] [PubMed]
  13. Best Wearable Senior Monitors. 2021. Available online: https://www.safewise.com/blog/top-safety-wearable-products-for-seniors/ (accessed on 26 May 2022).
  14. The Tango Belt. 2021. Available online: https://www.tangobelt.com/ (accessed on 25 May 2022).
  15. Seneviratne, S.; Hu, Y.; Nguyen, T.; Lan, G.; Khalifa, S.; Thilakarathna, K.; Hassan, M.; Seneviratne, A. A Survey of Wearable Devices and Challenges. IEEE Commun. Surv. Tutor. 2017, 19, 2573–2620. [Google Scholar] [CrossRef]
  16. The Benefits of Wearable Technology. 2021. Available online: https://cusjc.ca/agingtech/chapter-two/characteristics-the-benefits-of-wearable-tech/ (accessed on 25 May 2022).
  17. Barabas, J.; Bednar, T.; Vychlopen, M. Kinect-Based Platform for Movement Monitoring and Fall-Detection of Elderly People. In Proceedings of the 2019 12th International Conference on Measurement, Smolenice, Slovakia, 27–29 May 2019; pp. 199–202. [Google Scholar] [CrossRef]
  18. Erol, B.; Amin, M.G. Effects of range spread and aspect angle on radar fall detection. In Proceedings of the 2016 IEEE Sensor Array and Multichannel Signal Processing Workshop (SAM), Janerio, Brazil, 10–13 July 2016; pp. 1–5. [Google Scholar]
  19. Castelvecchi, D. Can we open the black box of AI. Nature 2016, 538, 20. [Google Scholar] [CrossRef] [PubMed] [Green Version]
  20. Tjoa, E.; Guan, C. A Survey on Explainable Artificial Intelligence (XAI): Toward Medical XAI. IEEE Trans. Neural Netw. Learn. Syst. 2021, 32, 4793–4813. [Google Scholar] [CrossRef] [PubMed]
  21. Mankodiya, H.; Obaidat, M.S.; Gupta, R.; Tanwar, S. XAI-AV: Explainable Artificial Intelligence for Trust Management in Autonomous Vehicles. In Proceedings of the 2021 International Conference on Communications, Computing, Cybersecurity, and Informatics (CCCI), Beijing, China, 15–17 October 2021; pp. 1–5. [Google Scholar] [CrossRef]
  22. Ribeiro, M.T.; Singh, S.; Guestrin, C. “Why Should I Trust You?”: Explaining the Predictions of Any Classifier. In Proceedings of the 22nd ACM SIGKDD International Conference on Knowledge Discovery and Data Mining, San Francisco, CA, USA, 13–17 August 2016; Association for Computing Machinery: New York, NY, USA, 2016; pp. 1135–1144. [Google Scholar] [CrossRef]
  23. Sim, S.; Jeon, H.; Chung, G.; Kim, S.; Kwon, S.; Lee, W.; Park, K. Fall detection algorithm for the elderly using acceleration sensors on the shoes. In Proceedings of the 2011 Annual International Conference of the IEEE Engineering in Medicine and Biology Society, Boston, MA, USA, 30 August–3 September 2011; pp. 4935–4938. [Google Scholar] [CrossRef]
  24. Li, Y.; Ho, K.C.; Popescu, M. A Microphone Array System for Automatic Fall Detection. IEEE Trans. Biomed. Eng. 2012, 59, 1291–1301. [Google Scholar] [CrossRef] [PubMed]
  25. Bian, Z.P.; Hou, J.; Chau, L.P.; Magnenat-Thalmann, N. Fall Detection Based on Body Part Tracking Using a Depth Camera. IEEE J. Biomed. Health Inform. 2015, 19, 430–439. [Google Scholar] [CrossRef] [PubMed]
  26. Kurniawan, A.; Hermawan, A.R.; Purnama, I.K.E. A wearable device for fall detection elderly people using tri dimensional accelerometer. In Proceedings of the 2016 International Seminar on Intelligent Technology and Its Applications (ISITIA), Lombok, Indonesia, 28–30 July 2016; pp. 671–674. [Google Scholar]
  27. Torres, G.G.; Bayan Henriques, R.V.; Pereira, C.E.; Müller, I. An EnOcean Wearable Device with Fall Detection Algorithm Integrated with a Smart Home System. In Proceedings of the 3rd IFAC Conference on Embedded Systems, Computational Intelligence and Telematics in Control CESCIT, Faro, Portugal, 6–8 June 2018; Volume 51, pp. 9–14. [Google Scholar] [CrossRef]
  28. Hussain, F.; Hussain, F.; Ehatisham-ul Haq, M.; Azam, M.A. Activity-Aware Fall Detection and Recognition Based on Wearable Sensors. IEEE Sens. J. 2019, 19, 4528–4536. [Google Scholar] [CrossRef]
  29. Sadreazami, H.; Bolic, M.; Rajan, S. TL-FALL: Contactless Indoor Fall Detection Using Transfer Learning from a Pretrained Model. In Proceedings of the 2019 IEEE International Symposium on Medical Measurements and Applications (MeMeA), Istanbul, Turkey, 26–28 June 2019; pp. 1–5. [Google Scholar] [CrossRef]
  30. Miawarni, H.; Sardjono, T.A.; Setijadi, E.; Arraziqi, D.; Gumelar, A.B.; Purnomo, M.H. Fall Detection System for Elderly based on 2D LiDAR: A Preliminary Study of Fall Incident and Activities of Daily Living (ADL) Detection. In Proceedings of the 2020 International Conference on Computer Engineering, Network, and Intelligent Multimedia (CENIM), Surabaya, Indonesia, 17–18 November 2020; pp. 1–5. [Google Scholar] [CrossRef]
  31. Li, J.; Zhao, Q.; Yang, T.; Fan, C. An Algorithm of Fall Detection Based on Vision. In Proceedings of the 2021 6th International Symposium on Computer and Information Processing Technology (ISCIPT), Changsha, China, 11–13 June 2021; pp. 133–136. [Google Scholar] [CrossRef]
  32. Abdo, H.; Amin, K.M.; Hamad, A.M. Fall Detection Based on RetinaNet and MobileNet Convolutional Neural Networks. In Proceedings of the 2020 15th International Conference on Computer Engineering and Systems (ICCES), Cairo, Egypt, 15–16 December 2020; pp. 1–7. [Google Scholar] [CrossRef]
  33. Gomes, M.E.N.; Macêdo, D.; Zanchettin, C.; de Mattos-Neto, P.S.G.; Oliveira, A. Multi-human fall detection and localization in videos. Comput. Vis. Image Underst. 2022, 220, 103442. [Google Scholar] [CrossRef]
  34. Stone, E.E.; Skubic, M. Fall Detection in Homes of Older Adults Using the Microsoft Kinect. IEEE J. Biomed. Health Inform. 2015, 19, 290–301. [Google Scholar] [CrossRef] [PubMed]
  35. Casilari, E.; Santoyo-Ramón, J.A.; Cano-García, J.M. UMAFall: A Multisensor Dataset for the Research on Automatic Fall Detection. Procedia Comput. Sci. 2017, 110, 32–39. [Google Scholar] [CrossRef]
  36. Casilari, E.; Santoyo-Ramón, J.A.; Cano-García, J.M. Analysis of public datasets for wearable fall detection systems. Sensors 2017, 17, 1513. [Google Scholar] [CrossRef] [PubMed] [Green Version]
  37. Noury, N.; Fleury, A.; Rumeau, P.; Bourke, A.; Laighin, G.O.; Rialle, V.; Lundy, J. Fall detection–Principles and Methods. In Proceedings of the 2007 29th Annual International Conference of the IEEE Engineering in Medicine and Biology Society, Lyon, France, 22–26 August 2007; pp. 1663–1666. [Google Scholar] [CrossRef]
  38. Raju, V.N.G.; Lakshmi, K.P.; Jain, V.M.; Kalidindi, A.; Padma, V. Study the Influence of Normalization/Transformation process on the Accuracy of Supervised Classification. In Proceedings of the 2020 Third International Conference on Smart Systems and Inventive Technology (ICSSIT), Tirunelveli, India, 20–22 August 2020; pp. 729–735. [Google Scholar] [CrossRef]
  39. Yong, Z.; Xiaoming, Z.; Alshehri, M. A machine learning-enabled intelligent application for public health and safety. Neural Comput. Appl. 2021, 2021, 1–14. [Google Scholar] [CrossRef]
  40. Lime. 2021. Available online: https://github.com/marcotcr/lime (accessed on 30 July 2021).
Figure 1. System model for fall detection using wearable technology.
Mathematics 10 01990 g001
Figure 2. Proposed system for fall detection using wearable technology.
Mathematics 10 01990 g002
Figure 3. Accuracy results of the different trained sequence models on the fall detection dataset. A separate model is trained for each of the sensors, as mentioned above on the x-axis.
Mathematics 10 01990 g003
Figure 4. Confusion matrix for predicted values after applying MVC.
Mathematics 10 01990 g004
Figure 5. F1-score for each sensor wise trained models calculated on the test dataset.
Mathematics 10 01990 g005
Figure 6. Original activity class: fall, Predicted activity class: fall, Prediction probablity: 0.94. The pair of figures shows SMV values from the ankle sensor and LIME values generated on the trained model. The timestamp axis, i.e., the x-axis, should be considered common for both the above sub-plots. (a) Line plot of SMV values by accelerometer for sensor ankle for the given timestamps. (b) Bar plot for LIME values for sensor ankle for the given timestamps.
Mathematics 10 01990 g006
Figure 7. Original activity class: ADL, Predicted activity class: ADL, Prediction probability: 0.99. The pair of figures shows SMV values from the right pocket sensor and LIME values generated on the trained model. The timestamp axis, i.e., the x-axis, should be considered common for both the above sub-plots. (a) The line plot of SMV values by accelerometer for sensor Right Pocket for the given timestamps. (b) Bar plot for LIME values for sensor Right Pocket for the given timestamps.
Mathematics 10 01990 g007
Table 1. A relative comparison of various state-of-the-art fall detection approaches.
AuthorYearObjectivePerformance MeasuresResearch Findings
Mouglas et al. [33]2022For fall detection in videos, YOLO object detection with temporal classification using the Kalman filter is used.ROC AUC = 84.54% using YOLOK + 3DCNNWorks only on video data which implies that a person falling in an unmonitored zone will not be detected.
Abdo et al. [32]2021RetinaNet is used to recognize persons in videos and MobileNet is used to categorize the motion of fall or not-fall.Accuracy = 98%The system is restricted to dealing with video data alone.
Li et al. [31]2021YOLOv5 is utilized for enhancing vision-based fall detection and the detection accuracy of overlapping subjects.Detection Accuracy = 97.45% at 30 frames per secondFall detection is done by video exclusively. Hence, areas without cameras cannot notice a person falling.
Miawarni et al. [30]2020Two-dimensional (2D) LiDAR is used for gathering information from a room. KNN and random forest are used to differentiate between ADL and fall in a room.Accuracy: KNN = 100% RF = 94%Dedicated to 2D environments only, not appropriate for 3D settings.
Barabas et al. [17]2019A system programmed in C# for movement monitoring and fall detection of people using data from microsoft kinect v2 sensor.True Positive Rate = 82% False Alarm Rate = 18%High false alarm rate which requires review of RGB image by human.
Sadreazami et al. [29]2019Ultrawideband radar is used to monitor daily activity and identify occurrence of falls.Accuracy = 95.64% Precision = 96.12% Sensitivity = 96.73%Since there is a large number of convolutional layers, fine tuning the layer will result in overfitting.
Hussain et al. [28]2019Angular rotation of gyroscope sensor is considered along with acceleration to minimize the false positives. The problem is converted to a binary classification which is tested with random forest and KNN.Accuracy: KNN classifier = 99.8% RF classifier = 96.82%If a person trips and falls down, it is hard for the system to detect the fall.
Torres et al. [27]2018Tri-axial accelerometer and gyroscope sensors are attached to the chest of the patient. The X, Y and Z axe values are noted and are compared with accelerometer and gyroscope to make a decision.Sensitivity = 96% Specificity = 100%The system fails to detect a fall if a person is using stairs or short corridors.
Kurniawan et al. [26]2016Tri-axial accelerometer has been used to send data to a microcontroller to detect fall.Forward Fall = 75% Backward Fall = 95%The success rate is not very good as the approach uses only one accelerometer sensor.
Bian et al. [25]2014A depth camera is used to distinguish body from environment and a randomized decision tree is used for key joint extraction. Finally, SMV is used to classify whether a fall occurs or not.Sensitivity = 95.3% Specificity = 100% Accuracy = 97.6% Error = 2.4%If one of the joints is hidden behind an object, the system does not detect it as a fall.
Stone et al. [34]2014Real-time 3D fall detection system with the help of kinect sensors.Accuracy = 98.6%Requires a large amount of computing resources.
Li et al. [24]2012Fall detection system using acoustics. Signals are recorded using array of microphones, sampled at 20 KHz.Specificity = 97% Sensitivity = 100%If large items are dropped, the system considers it as a fall.
Sim et al. [23]2011Accelerometer attached to the shoes to detect fall for older people.Sensitivity = 81.5%The placement of the sensor is quite close to the ground, which means that the acceleration would be less than the rest of the body.
Table 2. Label mapping of UMA-Fall dataset.
ActivityClass Label
Applauding, Hands Up, Making a Call, Opening Door, Sitting, Getting Up, Walking, Bending, Hopping, Jogging, Lying Down on Bed, Go Downstairs, Go UpstairsADL
Backward Fall, Forward Fall, Lateral FallFall
Table 3. Training models and configuration for the given sensors.
Sensor/Model NameLayersEpochsTraining Configuration
Anklelstm(150)dropout(0.2)lstm(150)dropout(0.4)dense(1)200Optimizer: Adam
Loss: Binary Cross-Entropy
Metrics: Accuracy
Chestlstm(150)dropout(0.7)lstm(150)dropout(0.4)dense(1)100
Waistlstm(150)dense(1) 200
Right PocketBatchNormilization(momentum = 0.99)dropout(0.7)lstm(150)dense(1) 360
Wristlstm(150)dropout(0.8)dense(1) 125
Publisher’s Note: MDPI stays neutral with regard to jurisdictional claims in published maps and institutional affiliations.

