Article

Effect of Particle Size Distribution on the Dynamic Mechanical Properties and Fractal Characteristics of Cemented Rock Strata

School of Resources & Safety Engineering, Central South University, Changsha 410083, China
*
Author to whom correspondence should be addressed.
Mathematics 2022, 10(12), 2078; https://doi.org/10.3390/math10122078
Submission received: 17 May 2022 / Revised: 11 June 2022 / Accepted: 13 June 2022 / Published: 15 June 2022
(This article belongs to the Special Issue Mathematical Problems in Rock Mechanics and Rock Engineering)

Abstract

:
To investigate the dynamic mechanics and post-failure characteristics of fault-cemented rock strata, broken rock particles were reshaped to obtain cemented rock samples with various particle size distributions (PSDs). Split Hopkinson pressure bar (SHPB) dynamic impact tests were performed on the cemented rock samples under different strain rates. The test results show that plastic deformation occurs in the cemented rock sample as a result of its porous structure. Therefore, there is no linear phase in the dynamic stress–strain curves. With an increase in the Talbot index and mixture type, more large particles were contained inside the cemented rock sample, and the dynamic strength gradually increased. A power function can effectively describe the relationship between the strain rate and dynamic strength for various Talbot indices. After dynamic impact, the fragments of the cemented rock samples exhibit evident fractal laws, and the breakage of the samples includes breakage of the original rock particle itself and breakage between the rock particles and cementations. The breakage ratio and fractal dimension both decrease with the increase in the number of mixture type and Talbot index but increase with the increase in strain rate. It is worth noting that the breakage ratio and fractal dimension have a linear relationship regardless of the PSD or strain. The relationship between the dynamic strength and fractal dimension has different response laws for the PSD and strain rate effects. The dynamic strength is negatively linearly related to the fractal dimension under the PSD effect but positively linearly related to the fractal dimension under the strain rate effect. This research work can provide foundation support for investigating the instability mechanism of fault cemented rock strata under dynamic stress.

1. Introduction

Faults are common geological structures [1,2] encountered in underground mining activities. As shown in Figure 1, the roadway advance faces a hidden fault: the fault rock strata may be in cemented states because the fault zone includes silicate, lime minerals, mineral water, and broken rock and other components [3]. The dynamic stress induced by the disturbance of excavation is inevitably loaded onto fault-cemented strata and may cause failure of the fault’s geological structure. Therefore, investigating the dynamic mechanical properties of fault-cemented rock strata is vital for understanding fault instability mechanisms.
Cemented rock strata widely exist in various engineering geological conditions [4,5], and there is much research [3,6,7,8,9] on their physical and mechanical properties. Fall et al. [10,11] studied the strength characteristics of cemented paste backfill (CPB), and suggested that the uniaxial compression strength (UCS) has an exponential relationship with the solid-phase mass fraction and a linear relationship with the cement–sand ratio. Jiang et al. [12] investigated the influence of sodium chloride on the yield stress and strength law of cemented tailings material, and found that the UCS of CPB decreases with an increase in the initial NaCl concentration. Xu et al. [13,14] conducted triaxial compression experiments on CPB samples, and their results showed that the brittleness and failure pattern change with increasing cement content. Through acoustic emissions (AE) and computed tomography (CT) scanning [15], shear cracks have been observed inside rock specimens, and tensile cracks observed along rock/backfill interfaces. The laboratory testing strength of CPB material is determined by many factors such as the binder proportion [16], curing age [17], concentration [18] and cement-tailings ratio [19], whereas the load characteristics of cemented rock strata under geotechnical engineering conditions are highly complex. Therefore, investigating the static mechanical properties of cemented rock strata is insufficient to reveal the instability mechanism.
A dynamic load [20] is inevitable for cemented rock strata in underground engineering activities, and much attention [21,22,23,24] has been paid to the dynamic mechanical properties of cemented materials. Cao et al. [25] investigated the effect of the strain rate on the dynamical mechanical response and failure patterns of cemented tailings composite specimens; the dynamic strength increases exponentially and the fractal dimension increases linearly with the average strain rate. Tan et al. [26] reported that the dynamic strength has a power-function relationship with the average strain rate; the failure pattern shows tensile failure and X-shaped shear failure. When cemented tailings backfill was reinforced by polyester fiber, the dynamic stress–strain curves exhibited a “double-peak” phenomenon [27]. Yang et al. [28] proposed that cemented tailings backfill (CTB) experience shear failure and tensile failure with an increase in the confining pressure. The compression strength and ultrasonic pulse velocity (UPV) [29] of cemented rock samples increase linearly with increasing curing time, and the UPV can be applied to the prediction of the UCS of cemented rock samples. Chen et al. [30] established an exponential correlation between the dynamic strength and strain rate. The interface shear strength between CPB and rock were investigated by direct shear tests, which indicated that the strength is time-dependent [31]. Zheng et al. [32] discussed the energy dissipation law of CTB samples after split Hopkinson pressure bar (SHPB) tests, and the results suggest that the absorbed energy first increases and then decreases with increasing average strain rate. Wang et al. [33] reported that the dynamic tensile and shear strengths increase by 72% and 127%, respectively, relative to static loading strengths. However, these achievements focused on the strength characteristics and failure patterns of cemented rock materials. In actuality, cemented rock is likely to have fragmented under impact loading. The fragmentation of partial surrounding rock is a key factor affecting the stability of the rock strata. Therefore, it is necessary to study and analyze the fragmentation characteristics of cemented rock strata under impact load.
The state of cemented rock materials after failure can indicate the instability mechanism in the cemented rock strata [34,35]. In the present study, fault-broken red sandstone rocks were cemented and reshaped into specimens for dynamic impact tests. The choice of the particle fractions in the mixture was considered; we investigated the influence of the particle size distribution (PSD) on the dynamical mechanical properties of cemented rock samples and their fractal characteristics. Finally, the functional relationship between the dynamic strength and the fractal dimension was established, and the influences of the PSD and strain rate on this relationship were analyzed.

2. Materials and Scheme

2.1. Materials

Broken red sandstones were collected from the fault zone of the Sima coal field in the Shanxi province of China. The material collected was subjected to a secondary crushing before manufacturing the cemented rock samples; the sample preparation process is shown in Figure 2.
(a) Rock particle preparation
Rock particles of different sizes were obtained by sieving the crushed granular red sandstone. In the natural accumulation state of broken rock in the fault zone, the size of the broken rock pieces follows a continuous distribution. To simulate the continuous nature of the PSD in the cemented rock samples prepared for testing, the sieved rock particles were divided into five groups (0–2 mm, 2–3 mm, 3–5 mm, 5–8 mm and 8–10 mm) (Figure 2a–e).
(b) Component proportion
Rock particles of a single size and mixtures of particles of various sizes were used for specimen preparation. For the mixtures, the PSD of each group in the cemented sample was described using Talbot’s [36] grading method:
P i = ( d i d m ) T × 100 %
where Pi is the mass percentage of rock particles whose size is smaller than di, dm is the largest particle size (dm = 10 mm) and T is the Talbot index characterizing the distribution
(c) Cementing reshaped sample
After measuring the raw material quantities for specimens of various Talbot indices (particle size fractions) and cement fractions, the cementation materials (Figure 2f) and red sandstone particles were mixed with water and stirred, and the slurry mixture was then injected into molds (Figure 2g). To reduce the number of gas holes in the preparation process and obtain a uniform distribution of fine particles, the slurry mixture specimens were vibrated and tamped. After the molds were removed, the cemented rock samples were cured for 28 days. The finished cemented samples, with a diameter of 50 mm and a height of 25 mm after manufacturing, are shown in Figure 2h.

2.2. Test Scheme

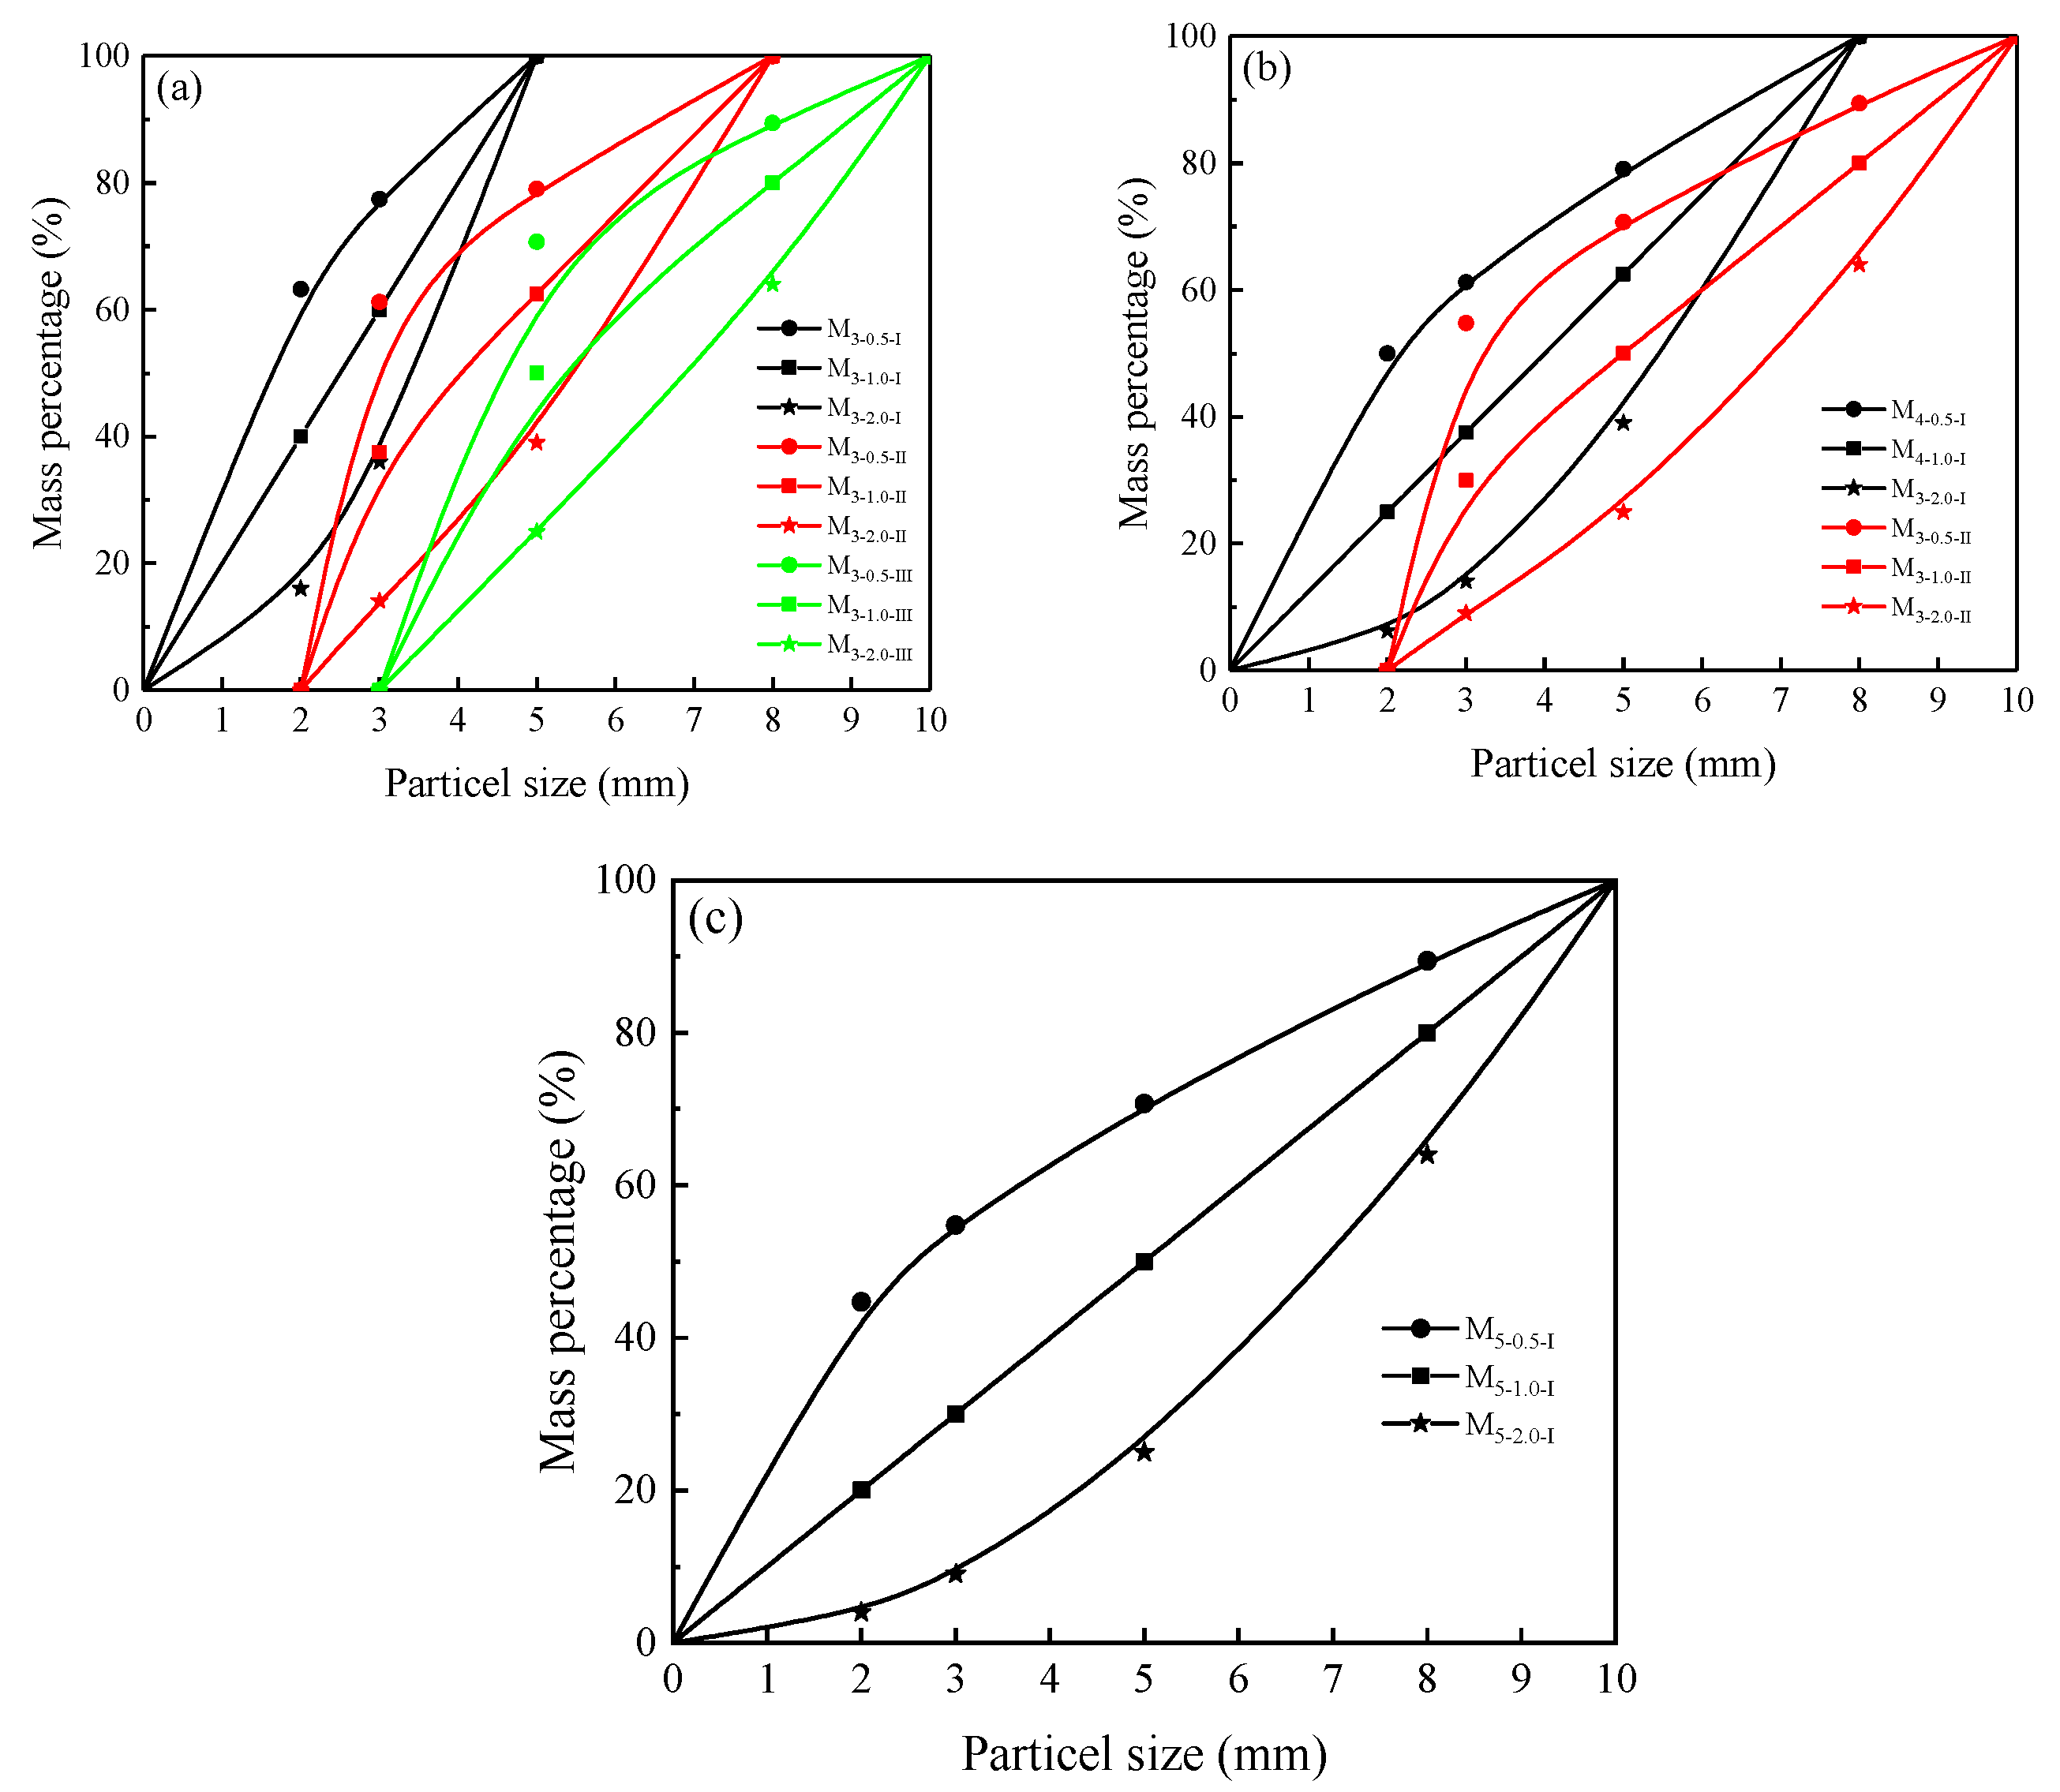
To investigate the effect of the PSD on the dynamic mechanical properties of cemented rock samples, the Talbot index and mixture type were varied to realize different PSDs. In the series of cemented rock samples designated S3, three of the five particle mass groups (maximum size 2, 3, 5, 8, 10 mm) are chosen in a sequence (i.e., {2, 3, 5}, {3, 5, 8} and {5, 8, 10}) with mass ratios selected to produce three distinct Talbot indices (0.5, 1.0, 2.0); there are nine S3 sample types in total. Specimens denoted by S4 have four components (i.e., {2, 3, 5, 8} and {3, 5, 8, 10}) to create two mixture types with three Talbot indices; there are six sample types. In the S5 series, only one mixture type is possible {2, 3, 5, 8, 10}, and with three Talbot indices, there are only three types of cemented rock sample. The masses of each component were calculated for the various Talbot indices and mixture types and are listed in Table 1.
The total mass of the rock particles in each sample was 70 g and the mass of cement was 25 g. In addition, Figure 3a–c shows the relationship between the mass percentage and particle size of the S3, S4 and S5 series samples, respectively. The cemented rock samples were composed of rock particles of at least three sizes, for a total of 18 types. To explore the PSD effect, 18 cemented rock samples were subjected to dynamic impact tests at the same strain rate. To explore the strain rate effect, the S5 series of cemented rock samples were subjected to impact tests under five different strain rates.

3. Test System and Measurement Principles

3.1. SHPB Experimental Setup

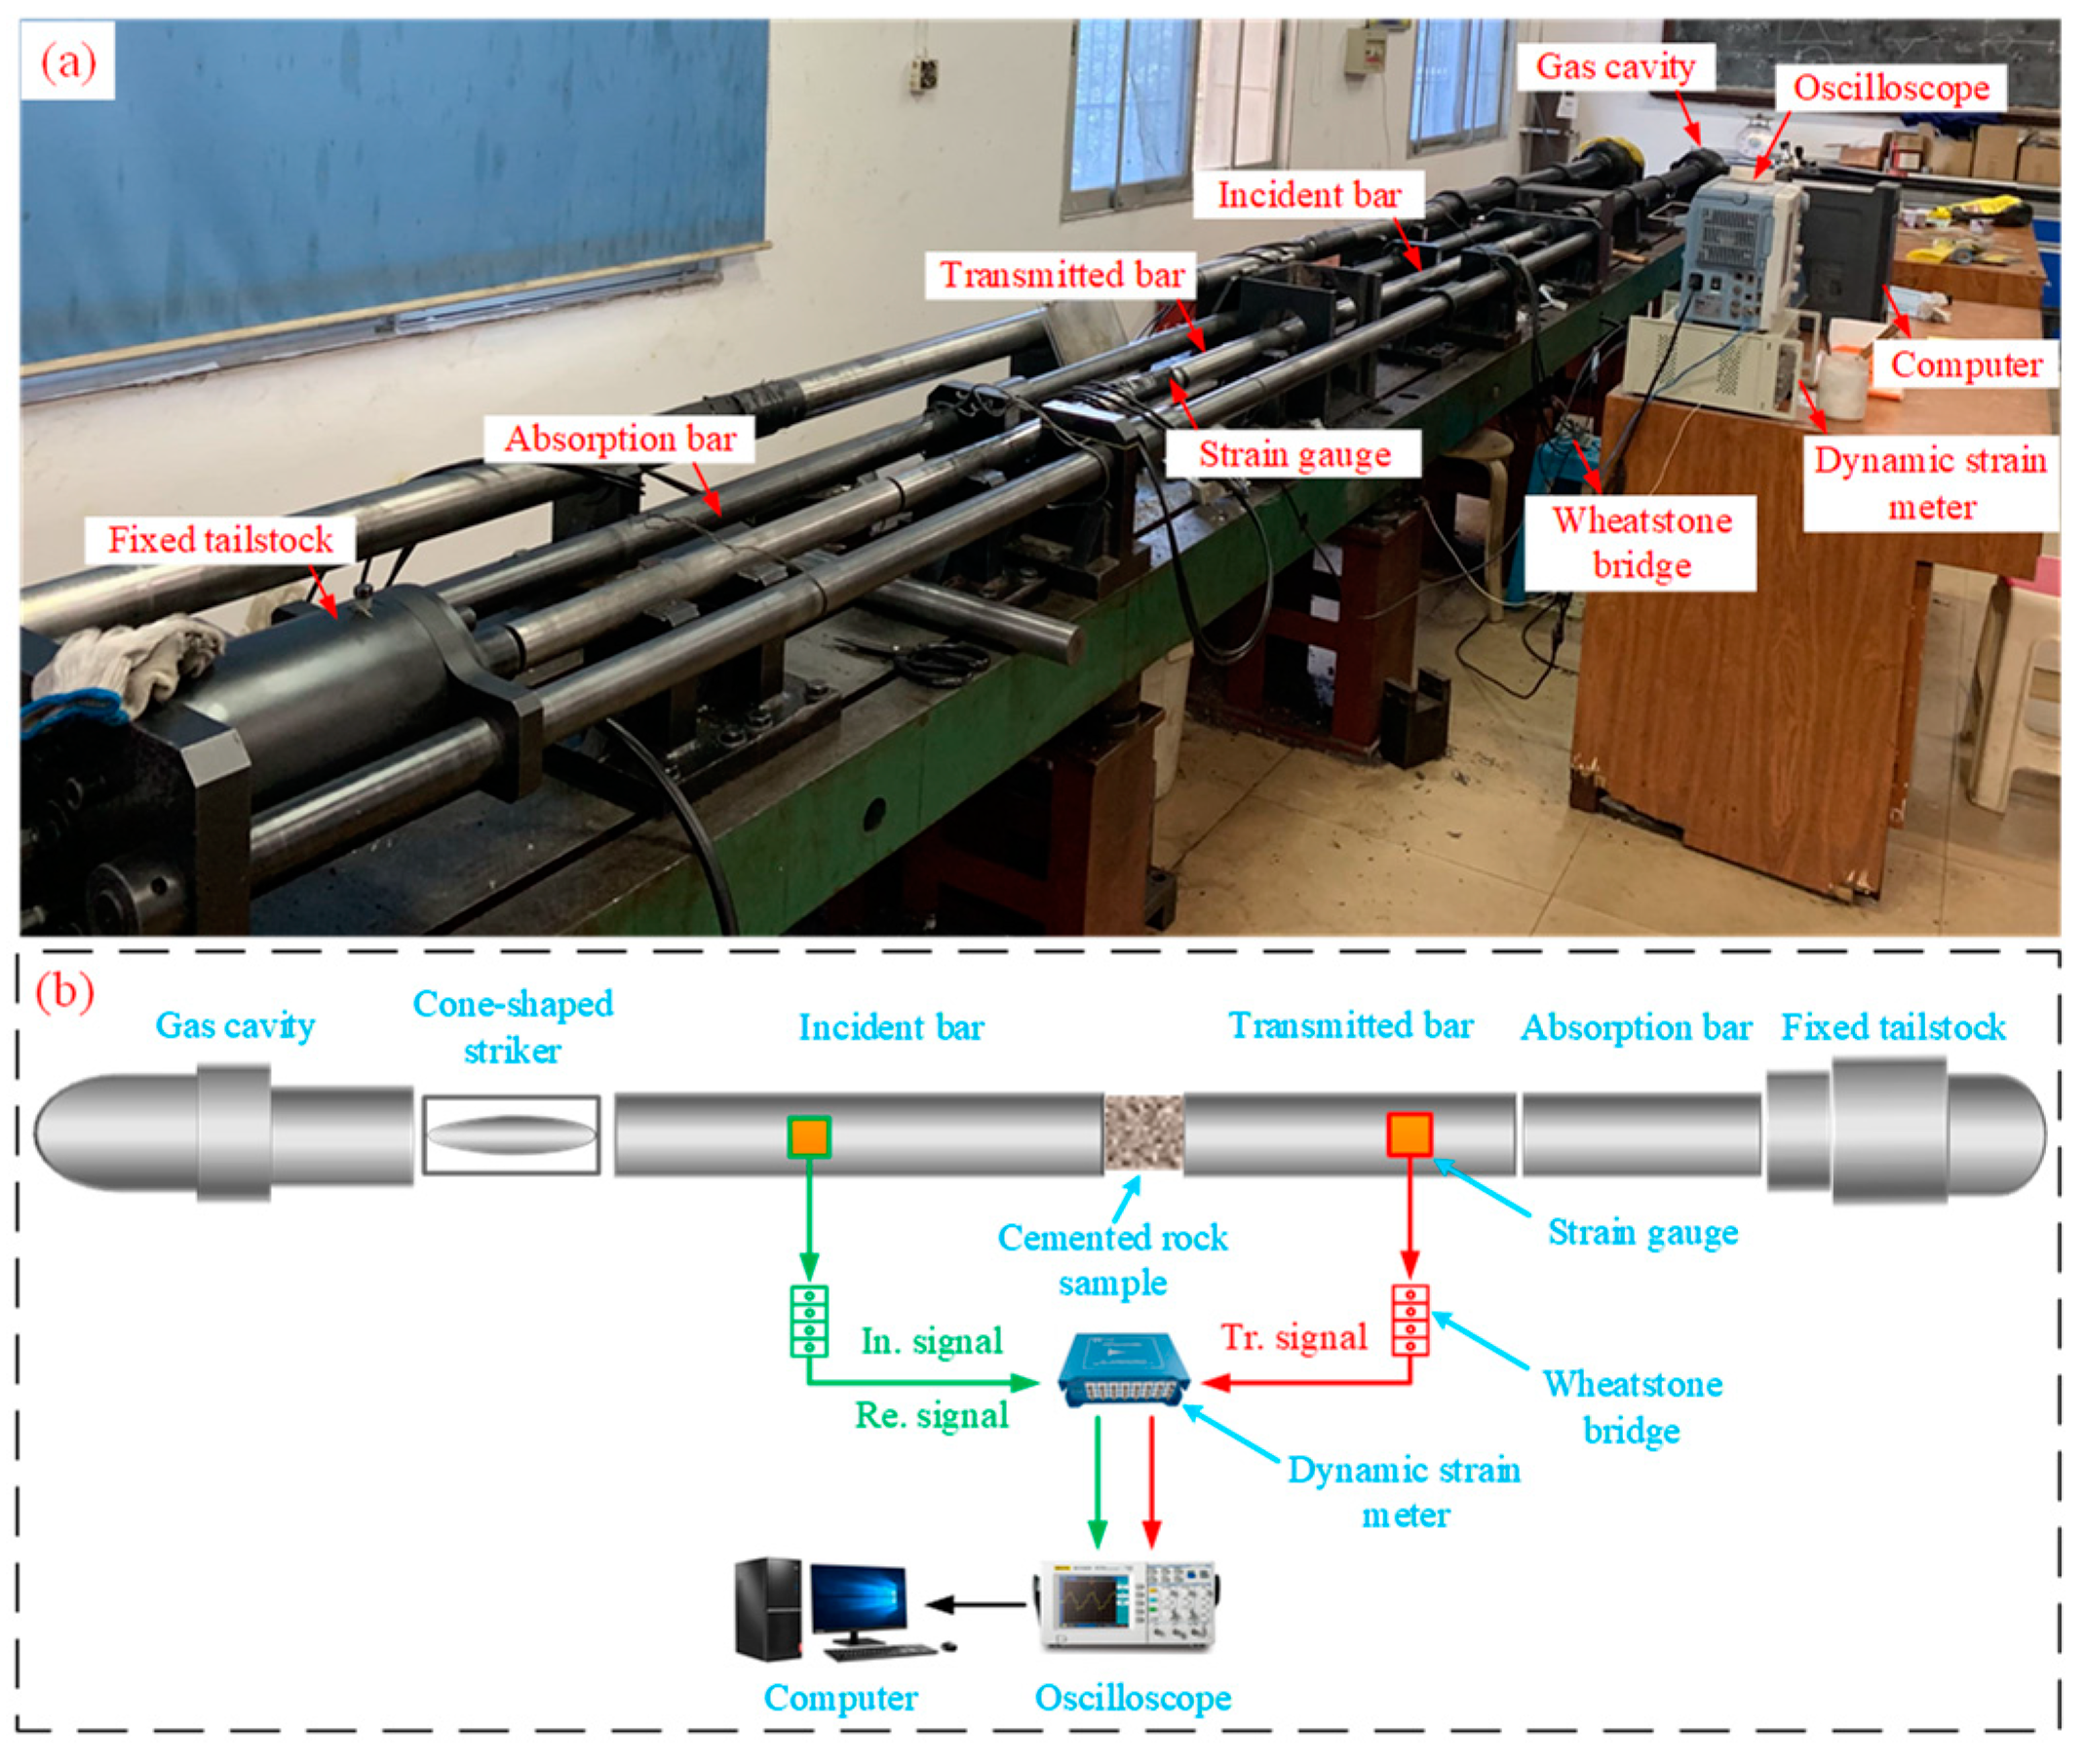
Dynamic impact tests were performed using a modified SHPB system [37]. As shown in Figure 4, the impact device is composed of a gas cavity, cone-shaped striker, incident bar, transmitted bar, absorption bar and fixed tailstock. The data acquisition subsystem includes an acquisition computer, oscilloscope, dynamic strain meter, Wheatstone bridges, strain gauges and a data line.
The rock sample is placed between the incident and transmitted bars. Strain gauges are installed on both the incident and transmitted bars. During testing, a slowly rising half-sine wave is generated when the cone-shaped striker impacts the front end of the incident bar; this wave is generated when high-pressure gas drives the cone-shaped striker against the incident bar. When the incident wave arrives at the bar–sample interface, part of the wave amplitude is reflected back into the incident bar (reflected wave), while the remainder passes through the sample and propagates in the transmitted bar (transmitted wave). As a result of the time difference between the incident and reflected waves passing the strain gauges on the incident bar, the incident and reflected wave signals may be distinguished and recorded. A strain gauge on the transmitted bar also records the transmitted wave signal. The two sets of strain gauges are connected to Wheatstone bridges, and the pulse signals are monitored with a dynamic strain gauge and an oscilloscope and passed to the acquisition computer. The pulse signal set contains primarily the incident strain ε I ( t ) , reflected strain ε R ( t ) and transmitted strain ε T ( t ) . Based on one-dimensional stress wave theory [38], the axial stress σ ( t ) , strain ε ( t ) and strain rate ε ˙ ( t ) of the cemented rock sample are expressed as:
{ σ ( t ) = A b E b 2 A s [ ε I ( t ) + ε R ( t ) + ε T ( t ) ] ε ( t ) = C b L s 0 t [ ε I ( t ) ε R ( t ) ε T ( t ) ] d t ε ˙ ( t ) = C b L s [ ε I ( t ) ε R ( t ) ε T ( t ) ]
where Ab, Cb and Eb are the cross-sectional area, P-wave velocity and Young’s modulus of the three bars. AS and Ls are the cross-sectional area and length of the cemented rock sample, respectively.

3.2. Measurement Principles

3.2.1. Fractal Dimension

The concept of a fractal was used in geophysics by Turcotte [39]; the number of fragments N(r) with a particle size larger than r exhibits a power-function relationship with r as follows:
N ( r ) = c r D f
where c is the proportionality coefficient, and Df is the fractal dimension.
The probability density distribution function [40] of fragments with sizes smaller than r can be expressed as:
P ( r ) = 1 ( r min r ) D f
where P(r) is the probability of fragments smaller than r and rmin is the minimum fragment size.
The total volume of the fragments can be calculated by integrating fragments of various sizes.
V = r min r max N t ( 4 3 π r 3 ) d P ( r ) 4 3 π N t D f 3 D f r min D f r max 3 D f
where Nt is the total number of fragments of various sizes and rmax is the maximum size of the fragments.
From Equation (5), the mass of rock fragments with sizes smaller than ri can be obtained as:
M ( r < r i ) = 4 3 π N t ρ D f 3 D f r min D f r max 3 D f
where M ( r < r i ) is the mass of rock fragments with sizes smaller than ri and ρ is the rock density. The mass ratio is expressed as follows:
M ( r < r i ) M t = ( r i r max ) 3 D f
where Mt is the total mass of rock fragments.
Taking the logarithm of Equation (6), a linear form is obtained:
L n ( M ( r < r i ) M t ) = ( 3 D f ) L n ( r i r max )
The fractal dimension Df can be calculated by fitting L n ( M ( r < r i ) M t ) and L n ( r i r max ) linearly.

3.2.2. Crushing Ratio

The crushing ratio is a significant parameter for the failure of geological features. Ma et al. proposed a quantitative method to measure the particle breakage degree, and the breakage ratio (BM) is defined as the variation in all PSD after a dynamic impact, which is calculated as follows:
B M = i = 1 N ( w i d w i o )
where N is the component range appropriate to the increased particle content after dynamic impact, ω i o is the original particle content within a certain range and ω i d is the corresponding particle content after the dynamic impact.

4. Test Results

4.1. Dynamic Mechanical Characteristics

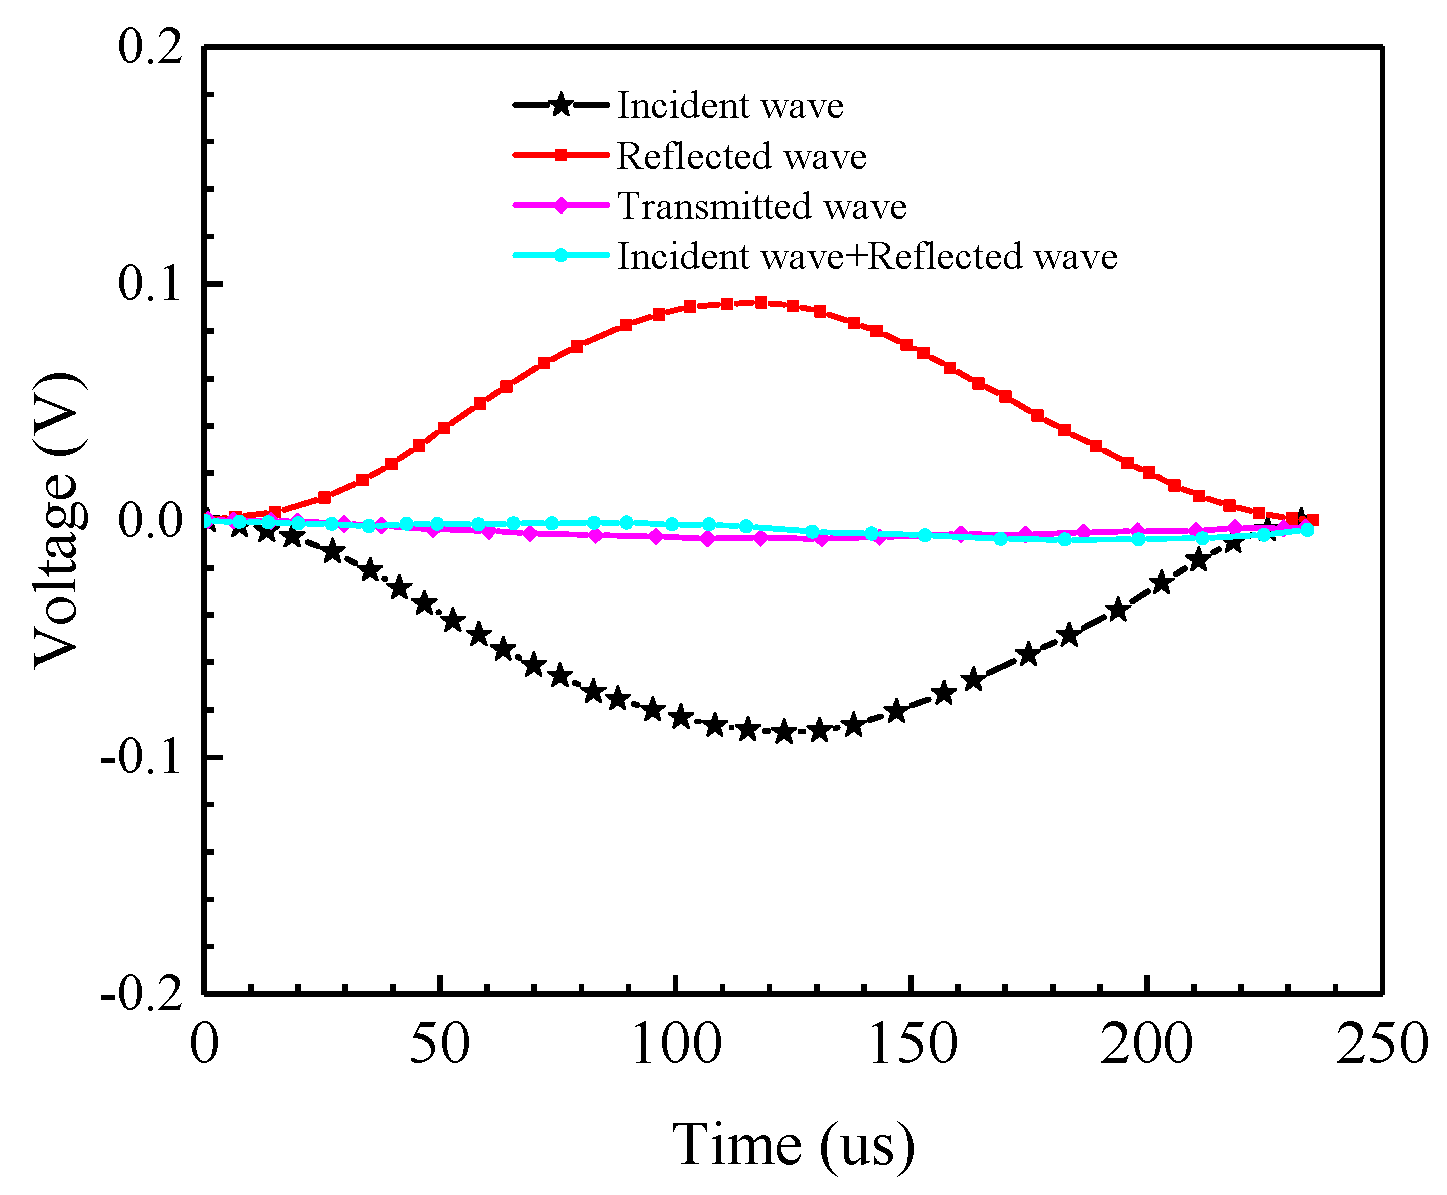
The one-dimensional stress wave propagation theory and stress equilibrium in cemented rock samples should be confirmed during SHPB tests [41]. The strain gauge attached to the incident bar recorded the incident and reflected signals, which were used for the calculation of the incident and reflected waves. The strain gauge attached to the transmitted bar recorded the transmitted signal, which was used to calculate the transmitted wave. As shown in Figure 5, the sum of the incident and reflected waves is approximately equal to that of the transmitted wave. This indicated that the two ends of the cemented rock sample in the dynamic impact experiment reached a stressed equilibrium condition.
Figure 6 shows the dynamic stress–strain curves of cemented rock samples with different PSDs; Figure 6a–c shows the S3, S4 and S5 series individually. The curves show that the dynamic stress first increases and then decreases with strain, which conforms to a typical dynamic stress evolution law [42]. The dynamic stress curves have no obvious linear stage, which can be attributed to the abundant pore structures in the cemented rock sample. Damage and plastic deformation can easily occur in a porous medium, resulting in a stress that nonlinearly varies with strain under a dynamic load. Figure 7 shows the dynamic stress–strain curves of the S5 series samples with different strain rates for different Talbot indices. Comparing Figure 7a–c, the dynamic strength increases with increasing Talbot index; this suggests that the large particles in the skeleton structure mainly contributed to the dynamic strength.

4.2. Variation of Fractal Characteristics of Cemented Rock Samples

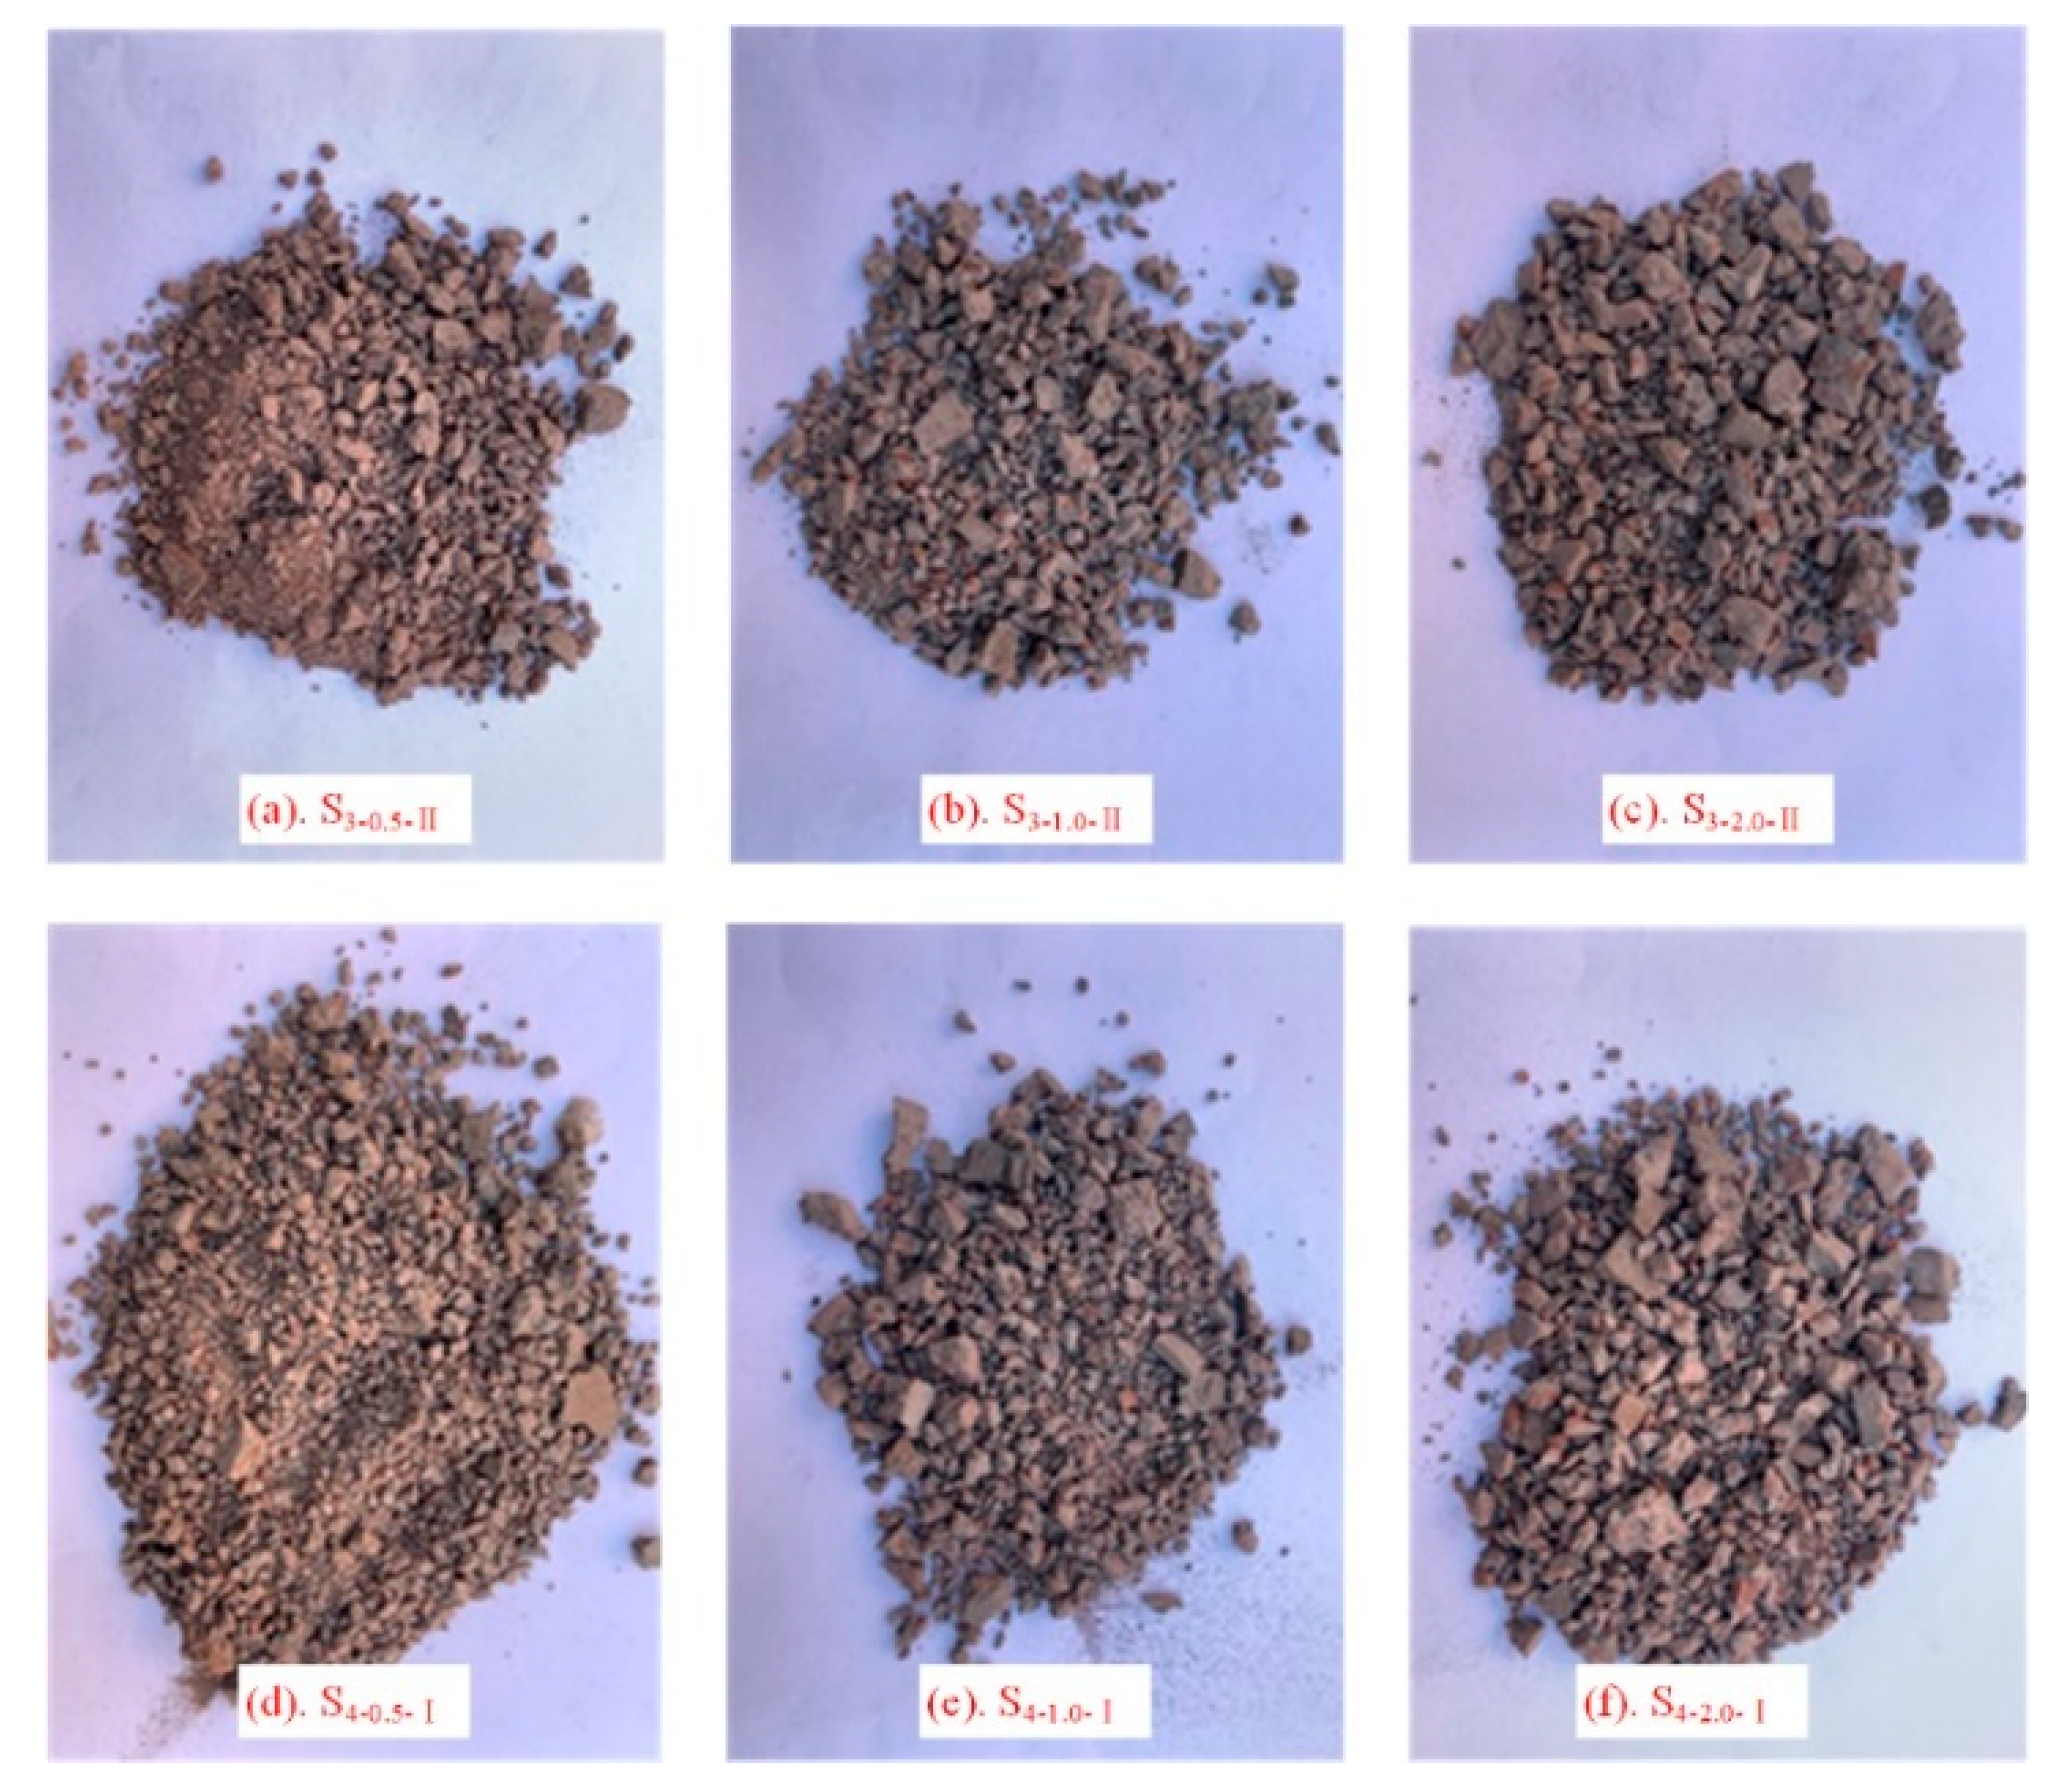
Under the dynamic impact in the SHPB apparatus, the cemented rock samples broke into granular particles. The fractal behavior of cemented rock samples can effectively reflect the fracture characteristics under the dynamic stress, which is an important basis for the instability mechanism of cemented rock strata. As shown in Figure 8, the cemented rock samples exhibited a high degree of fragmentation. Nevertheless, intuitively describing the fragmentation degree of cemented rock samples through fragments is challenging. Therefore, we classified the fragments and analyzed their fractal characteristics to determine the fragmentation degree of the cemented rock samples. After sieving and weighing the fragments, the fractal laws for the cemented rock samples were obtained.
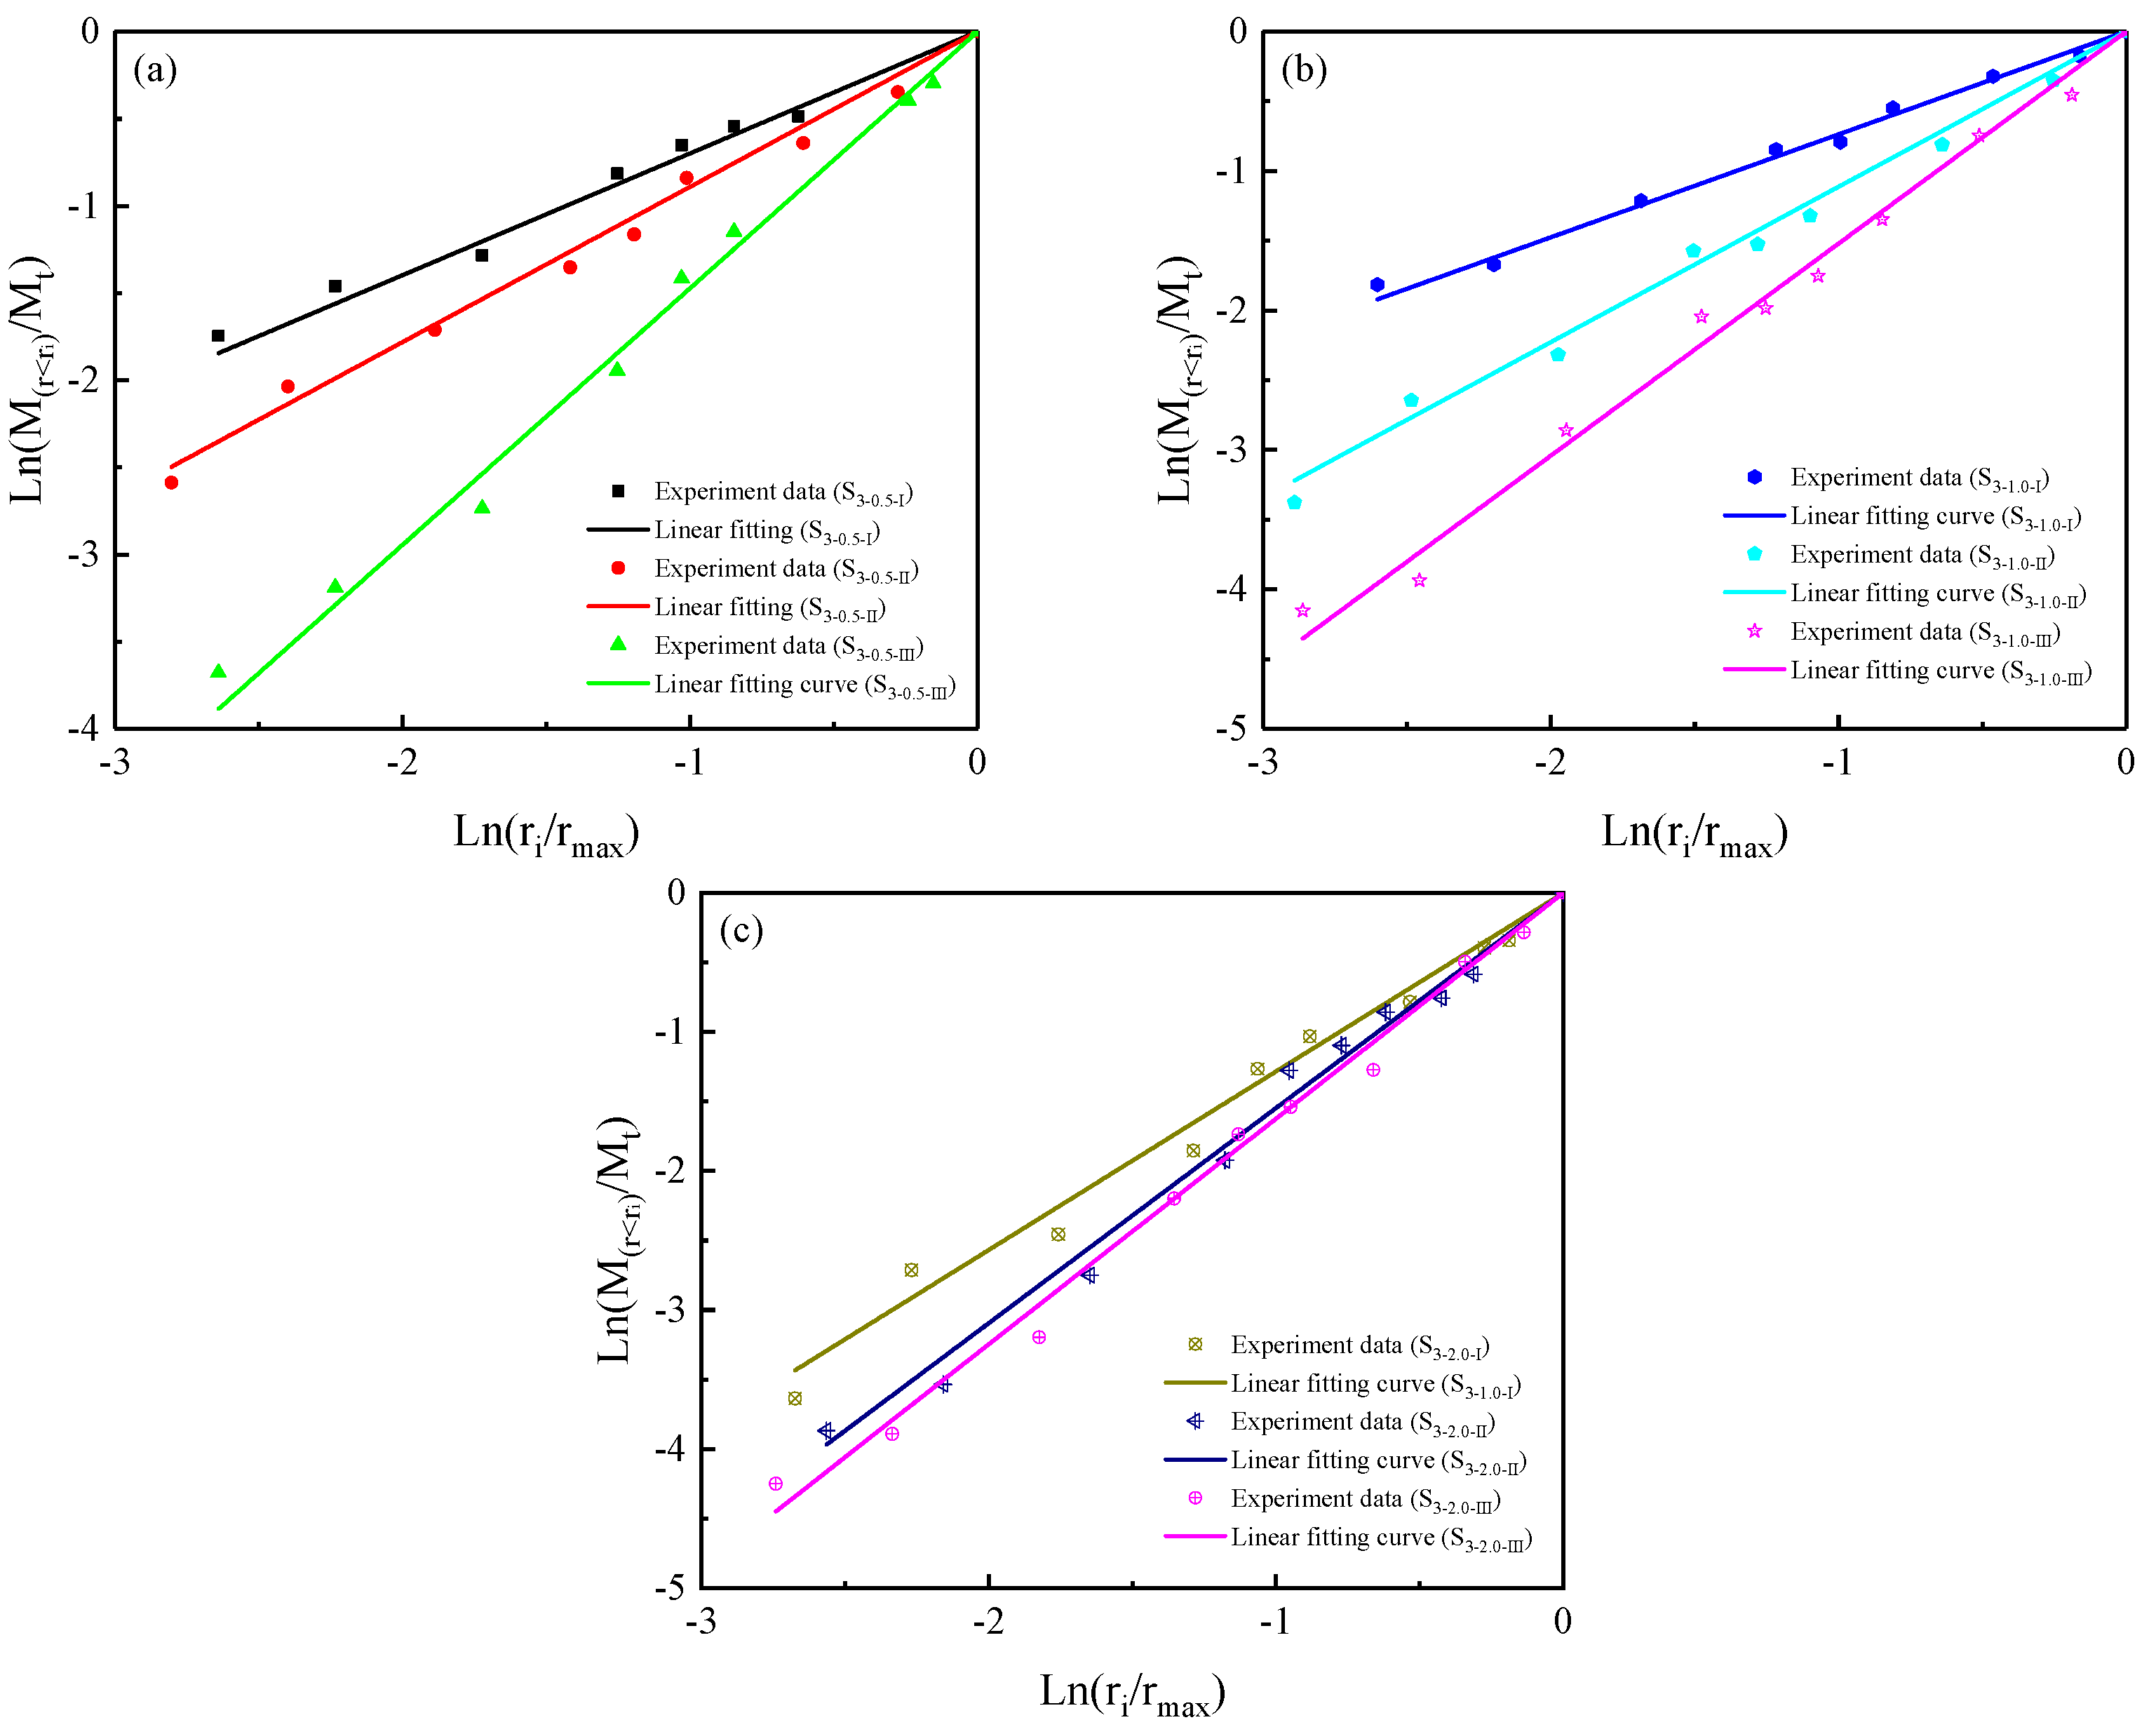
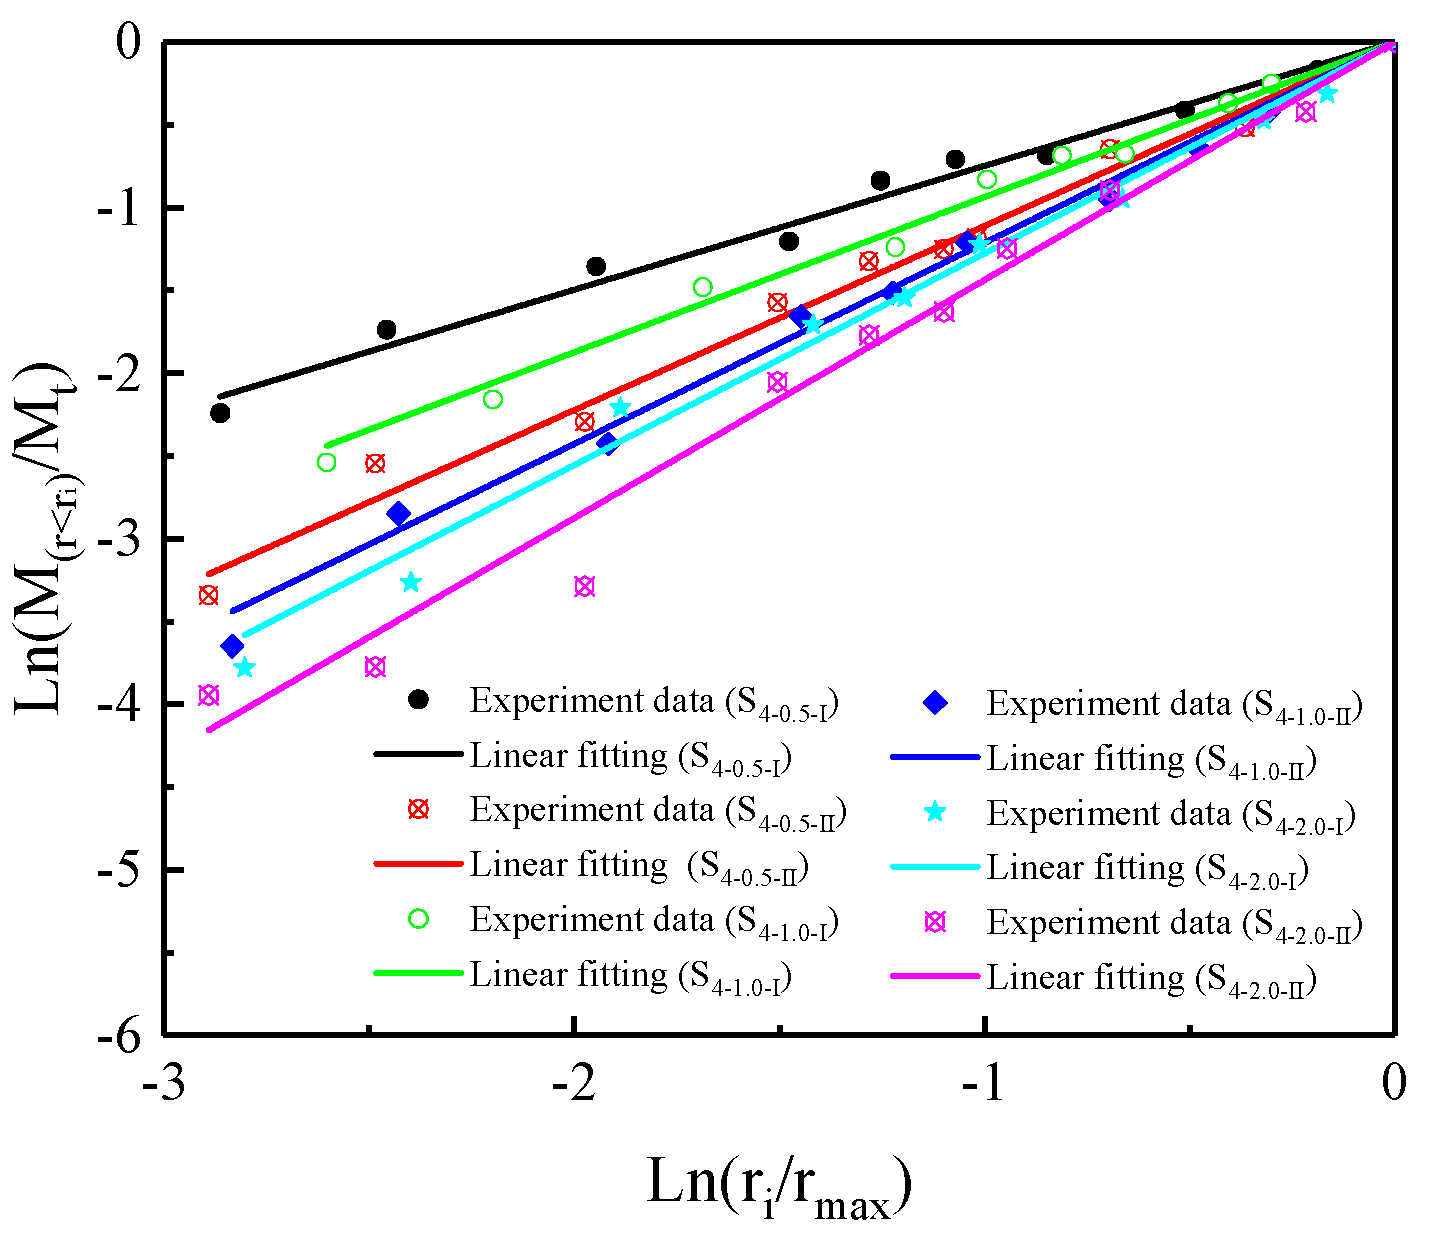
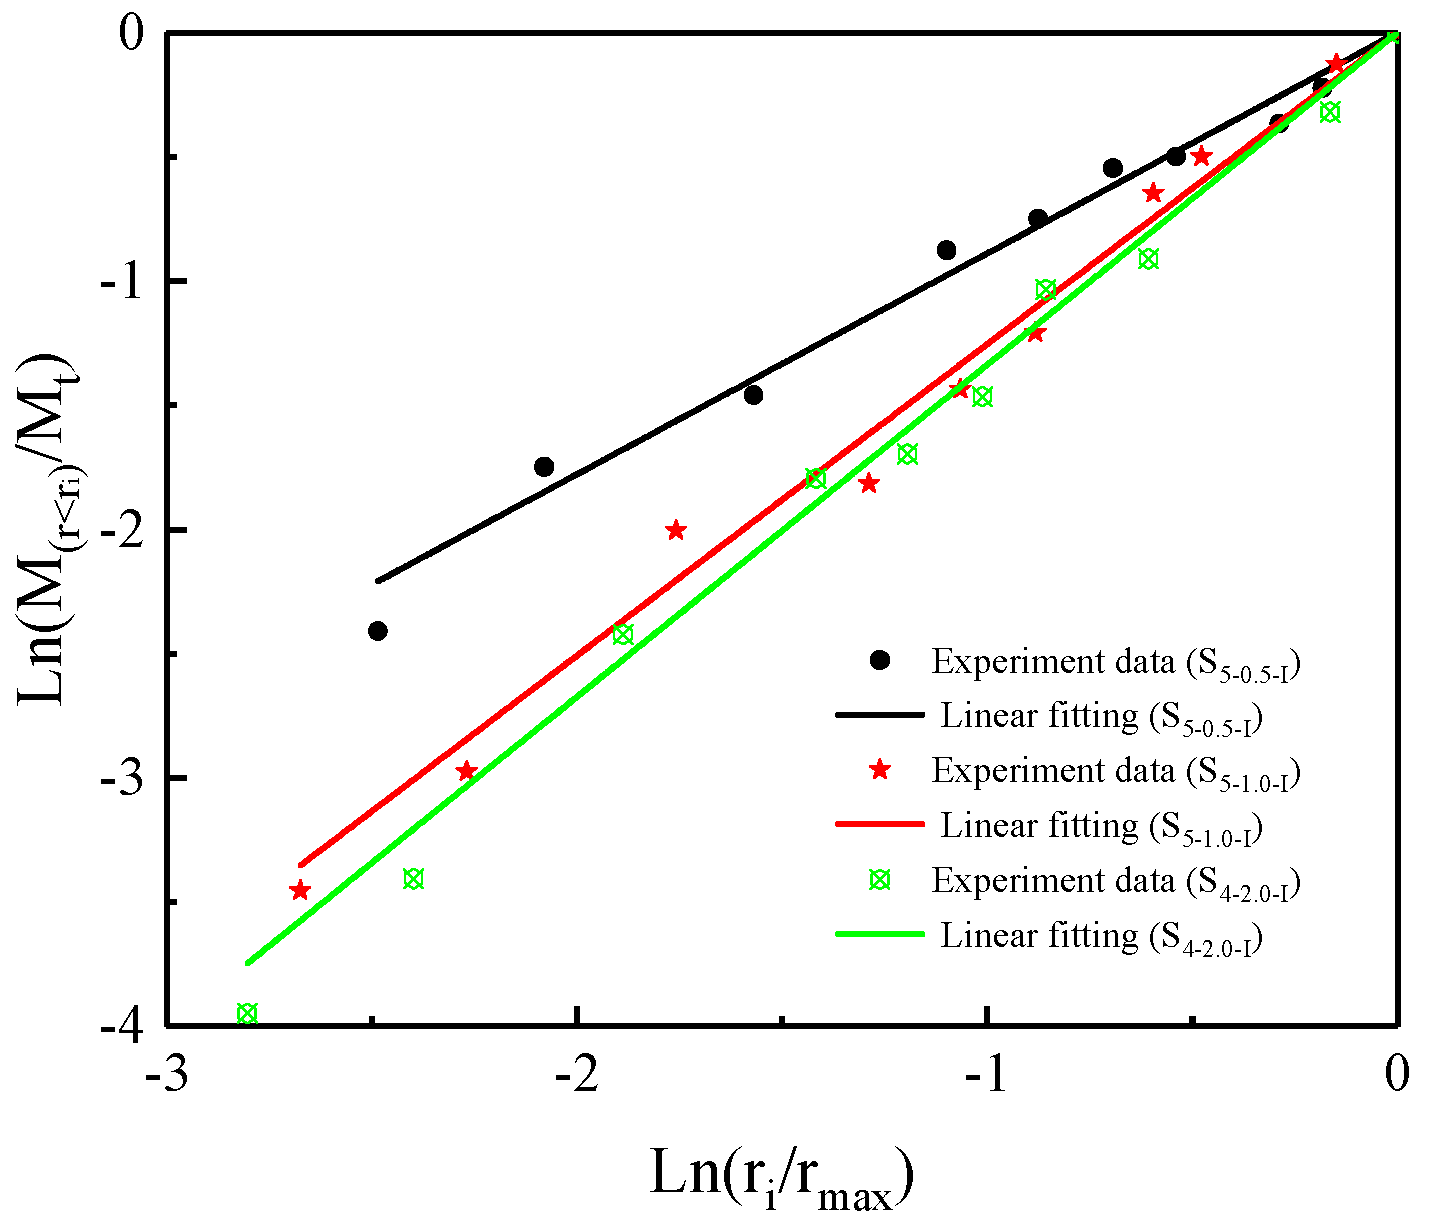
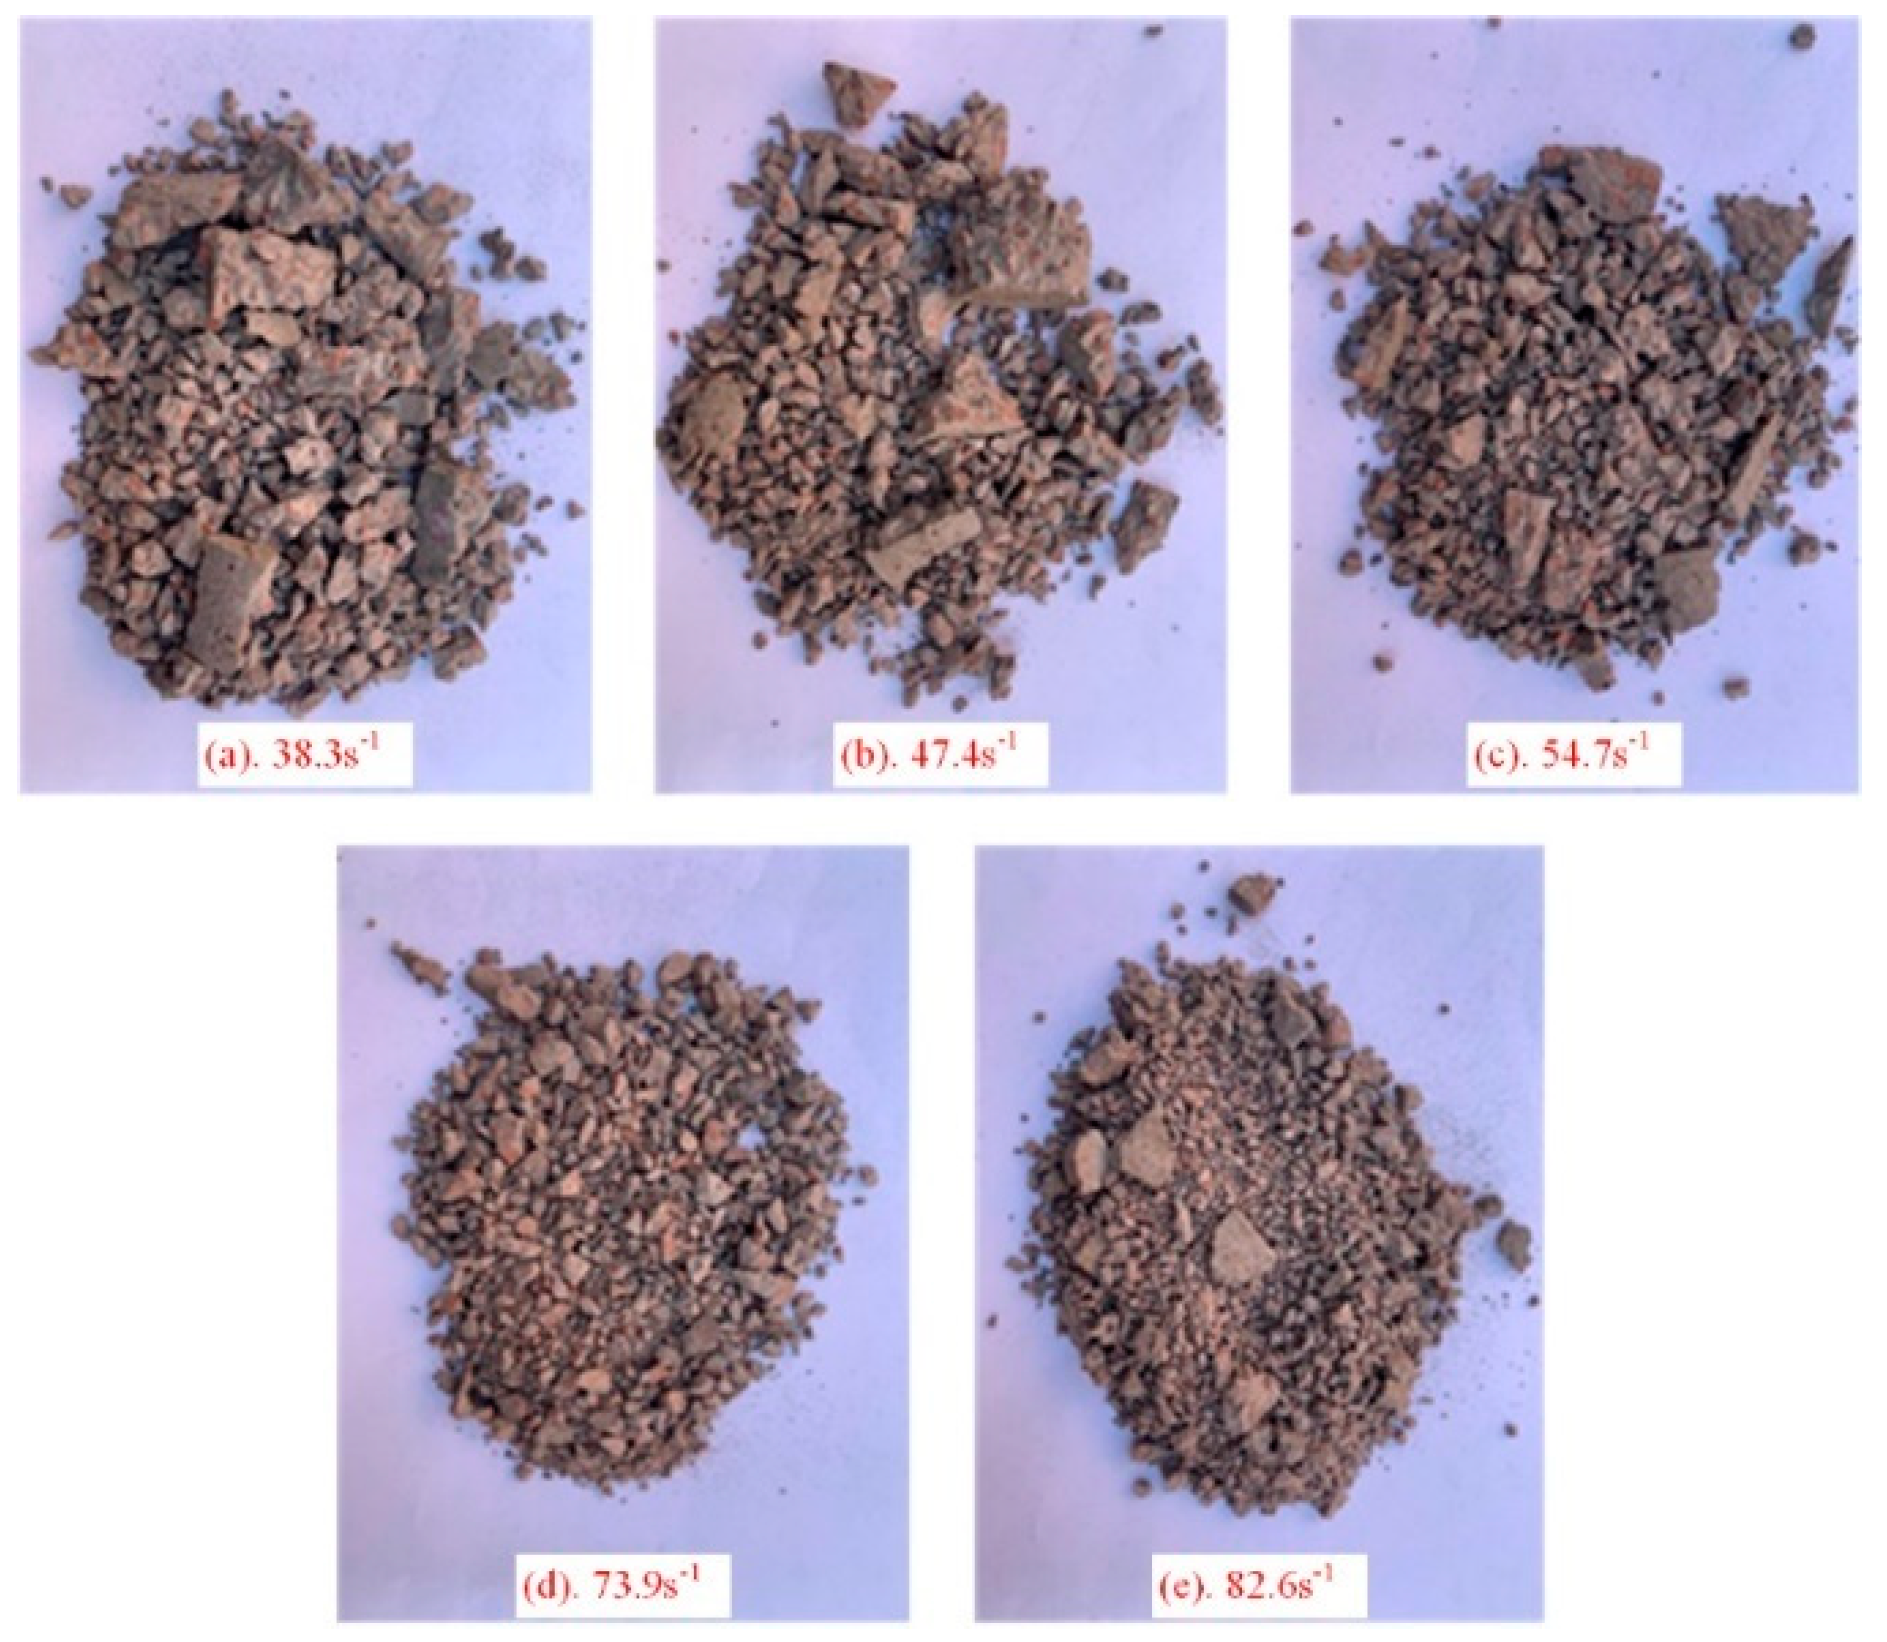
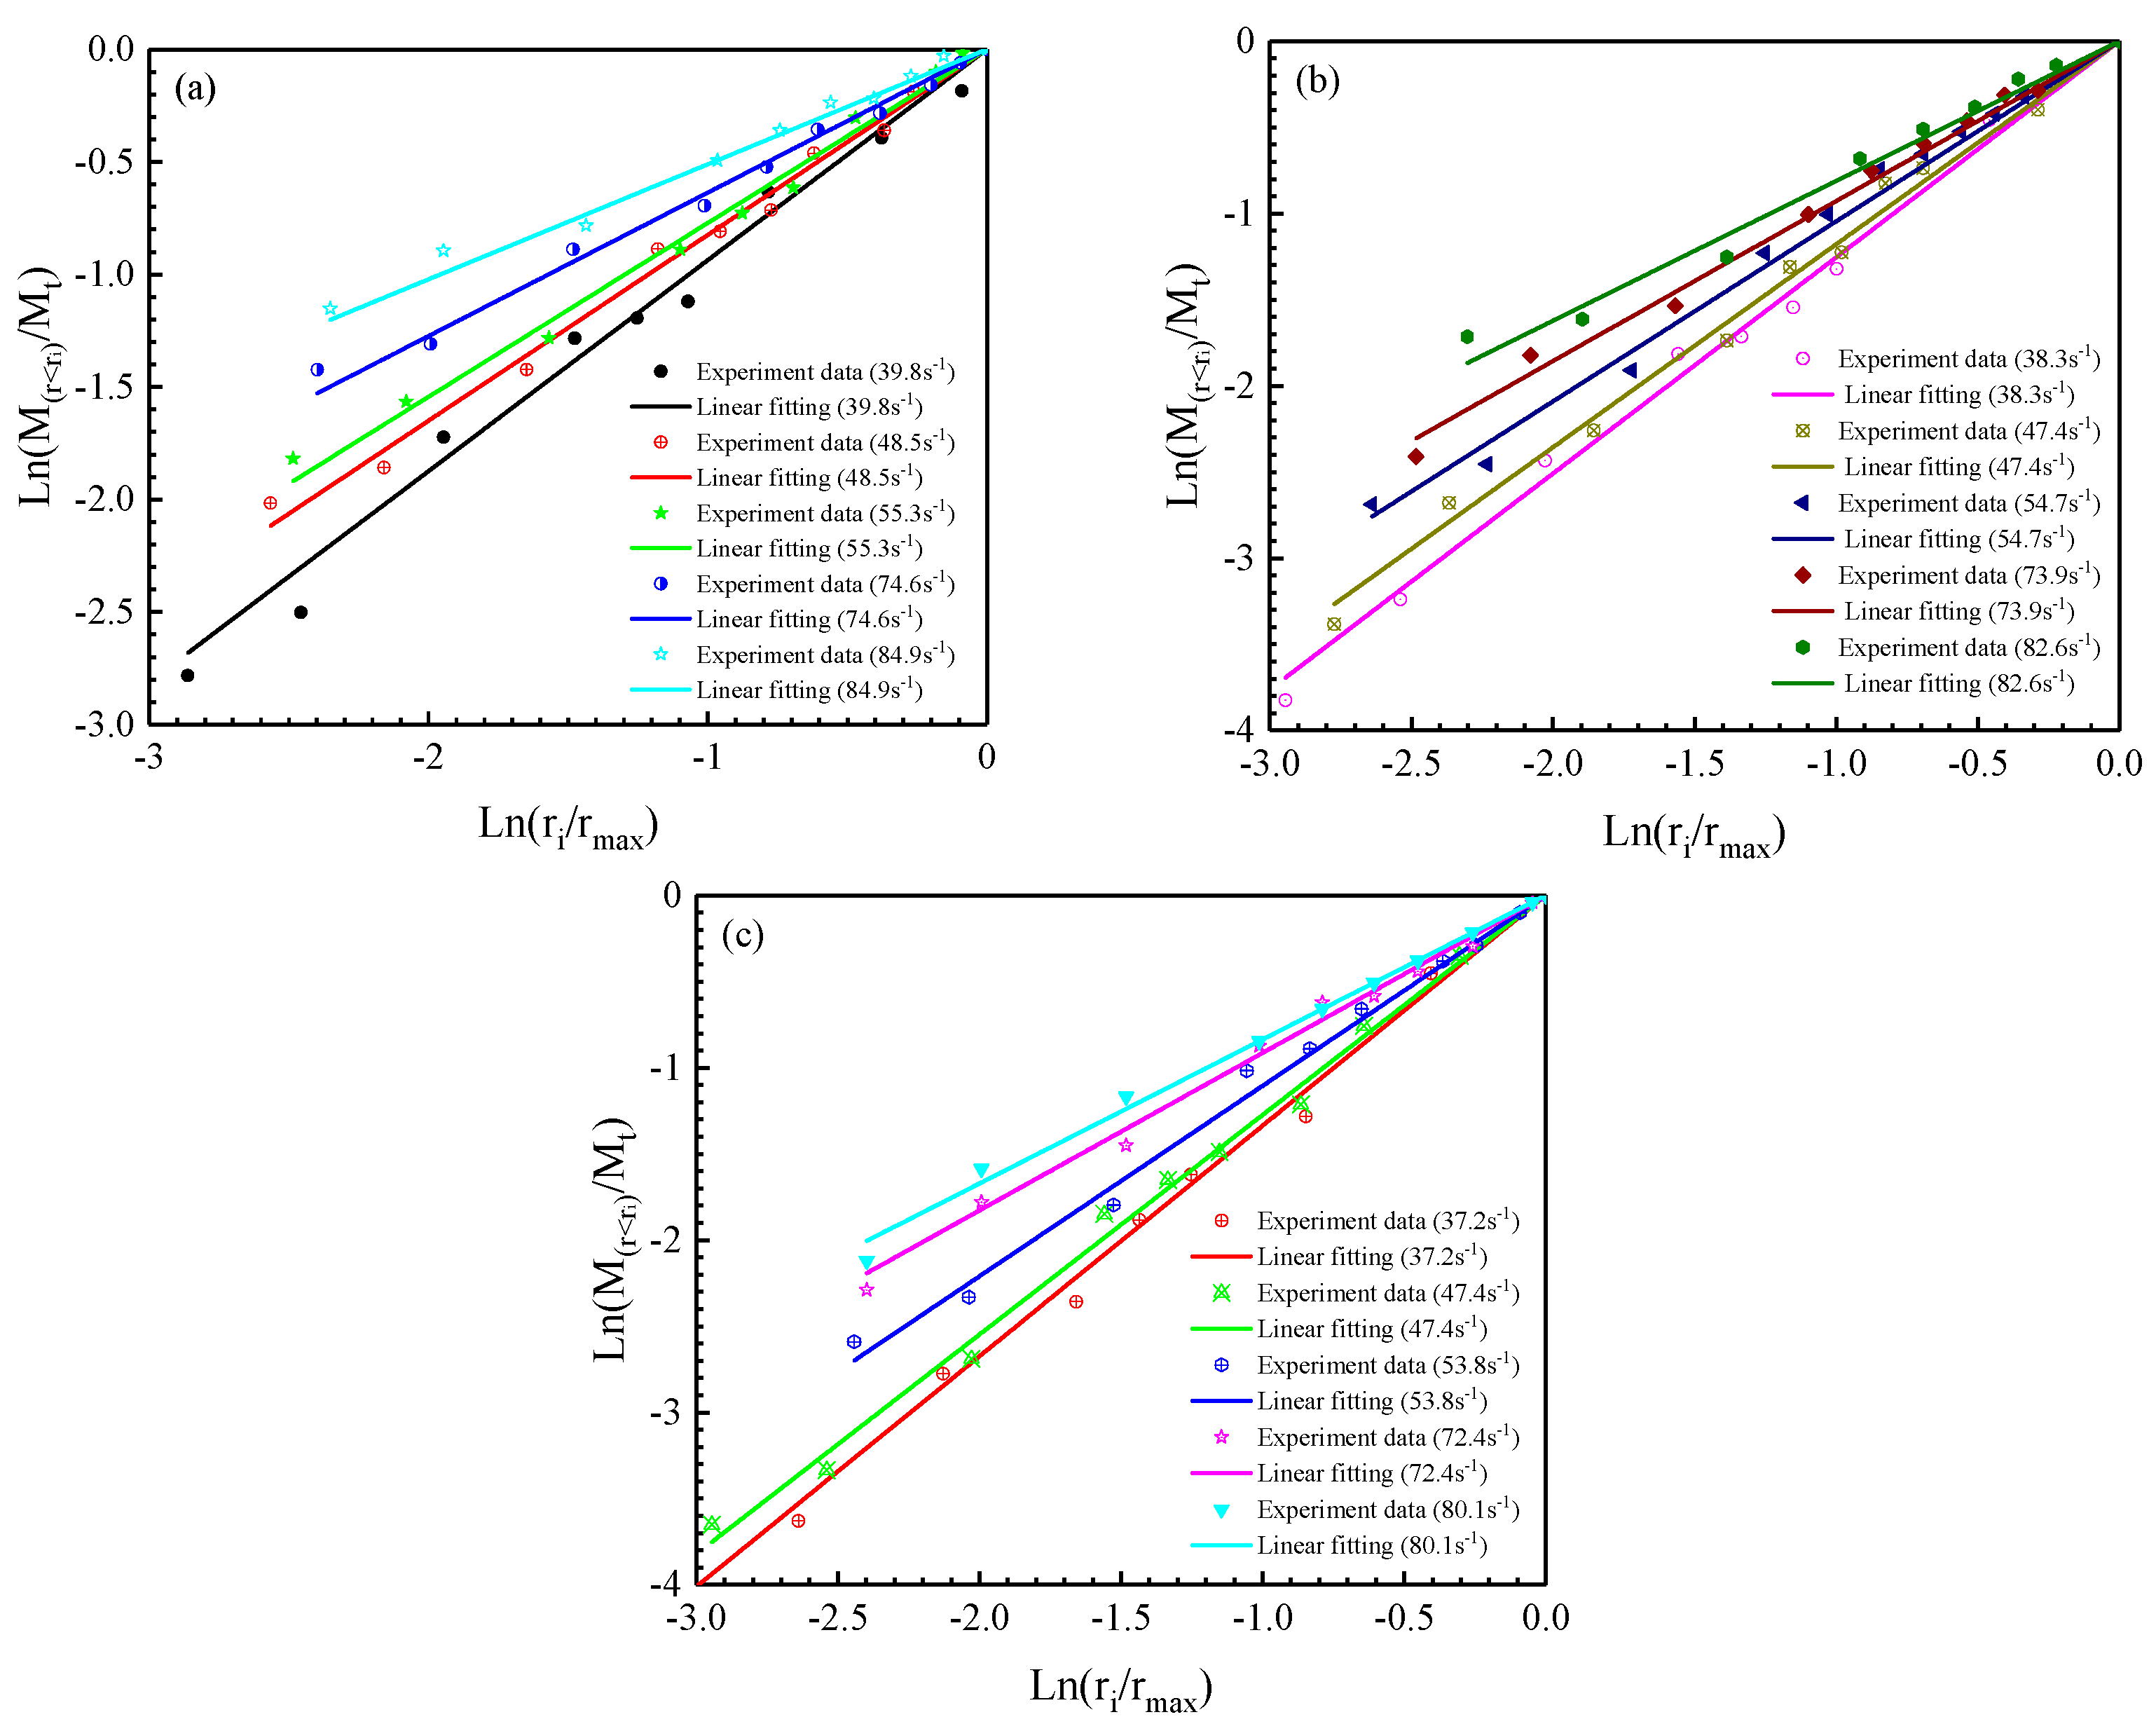
Figure 9, Figure 10 and Figure 11 show the fractal laws describing the fragments from the S3, S4 and S5 series of cemented rock samples, respectively. Table 2 lists the linear fitting formulas and their R2 values for the fragments from different PSD samples; the R2 of all curves is greater than 0.9, indicating that the fragments exhibit obvious fractal characteristics after dynamic impact. When considering the effect of strain rate on the fragmentation degree, the fragment size decreases with the increase in strain rate, as shown in Figure 12. Figure 13 shows the fractal laws of the S5 series, and Table 3 lists the linear fitting formulas and goodness-of-fit (R2) for the fragments under different strain rates. The goodness-of-fit of the linear fitting formulas is credible, which suggests that the fractal phenomenon is a universal law under different strain rates.

4.3. Variation of Breakage Ratio of Cemented Rock Samples

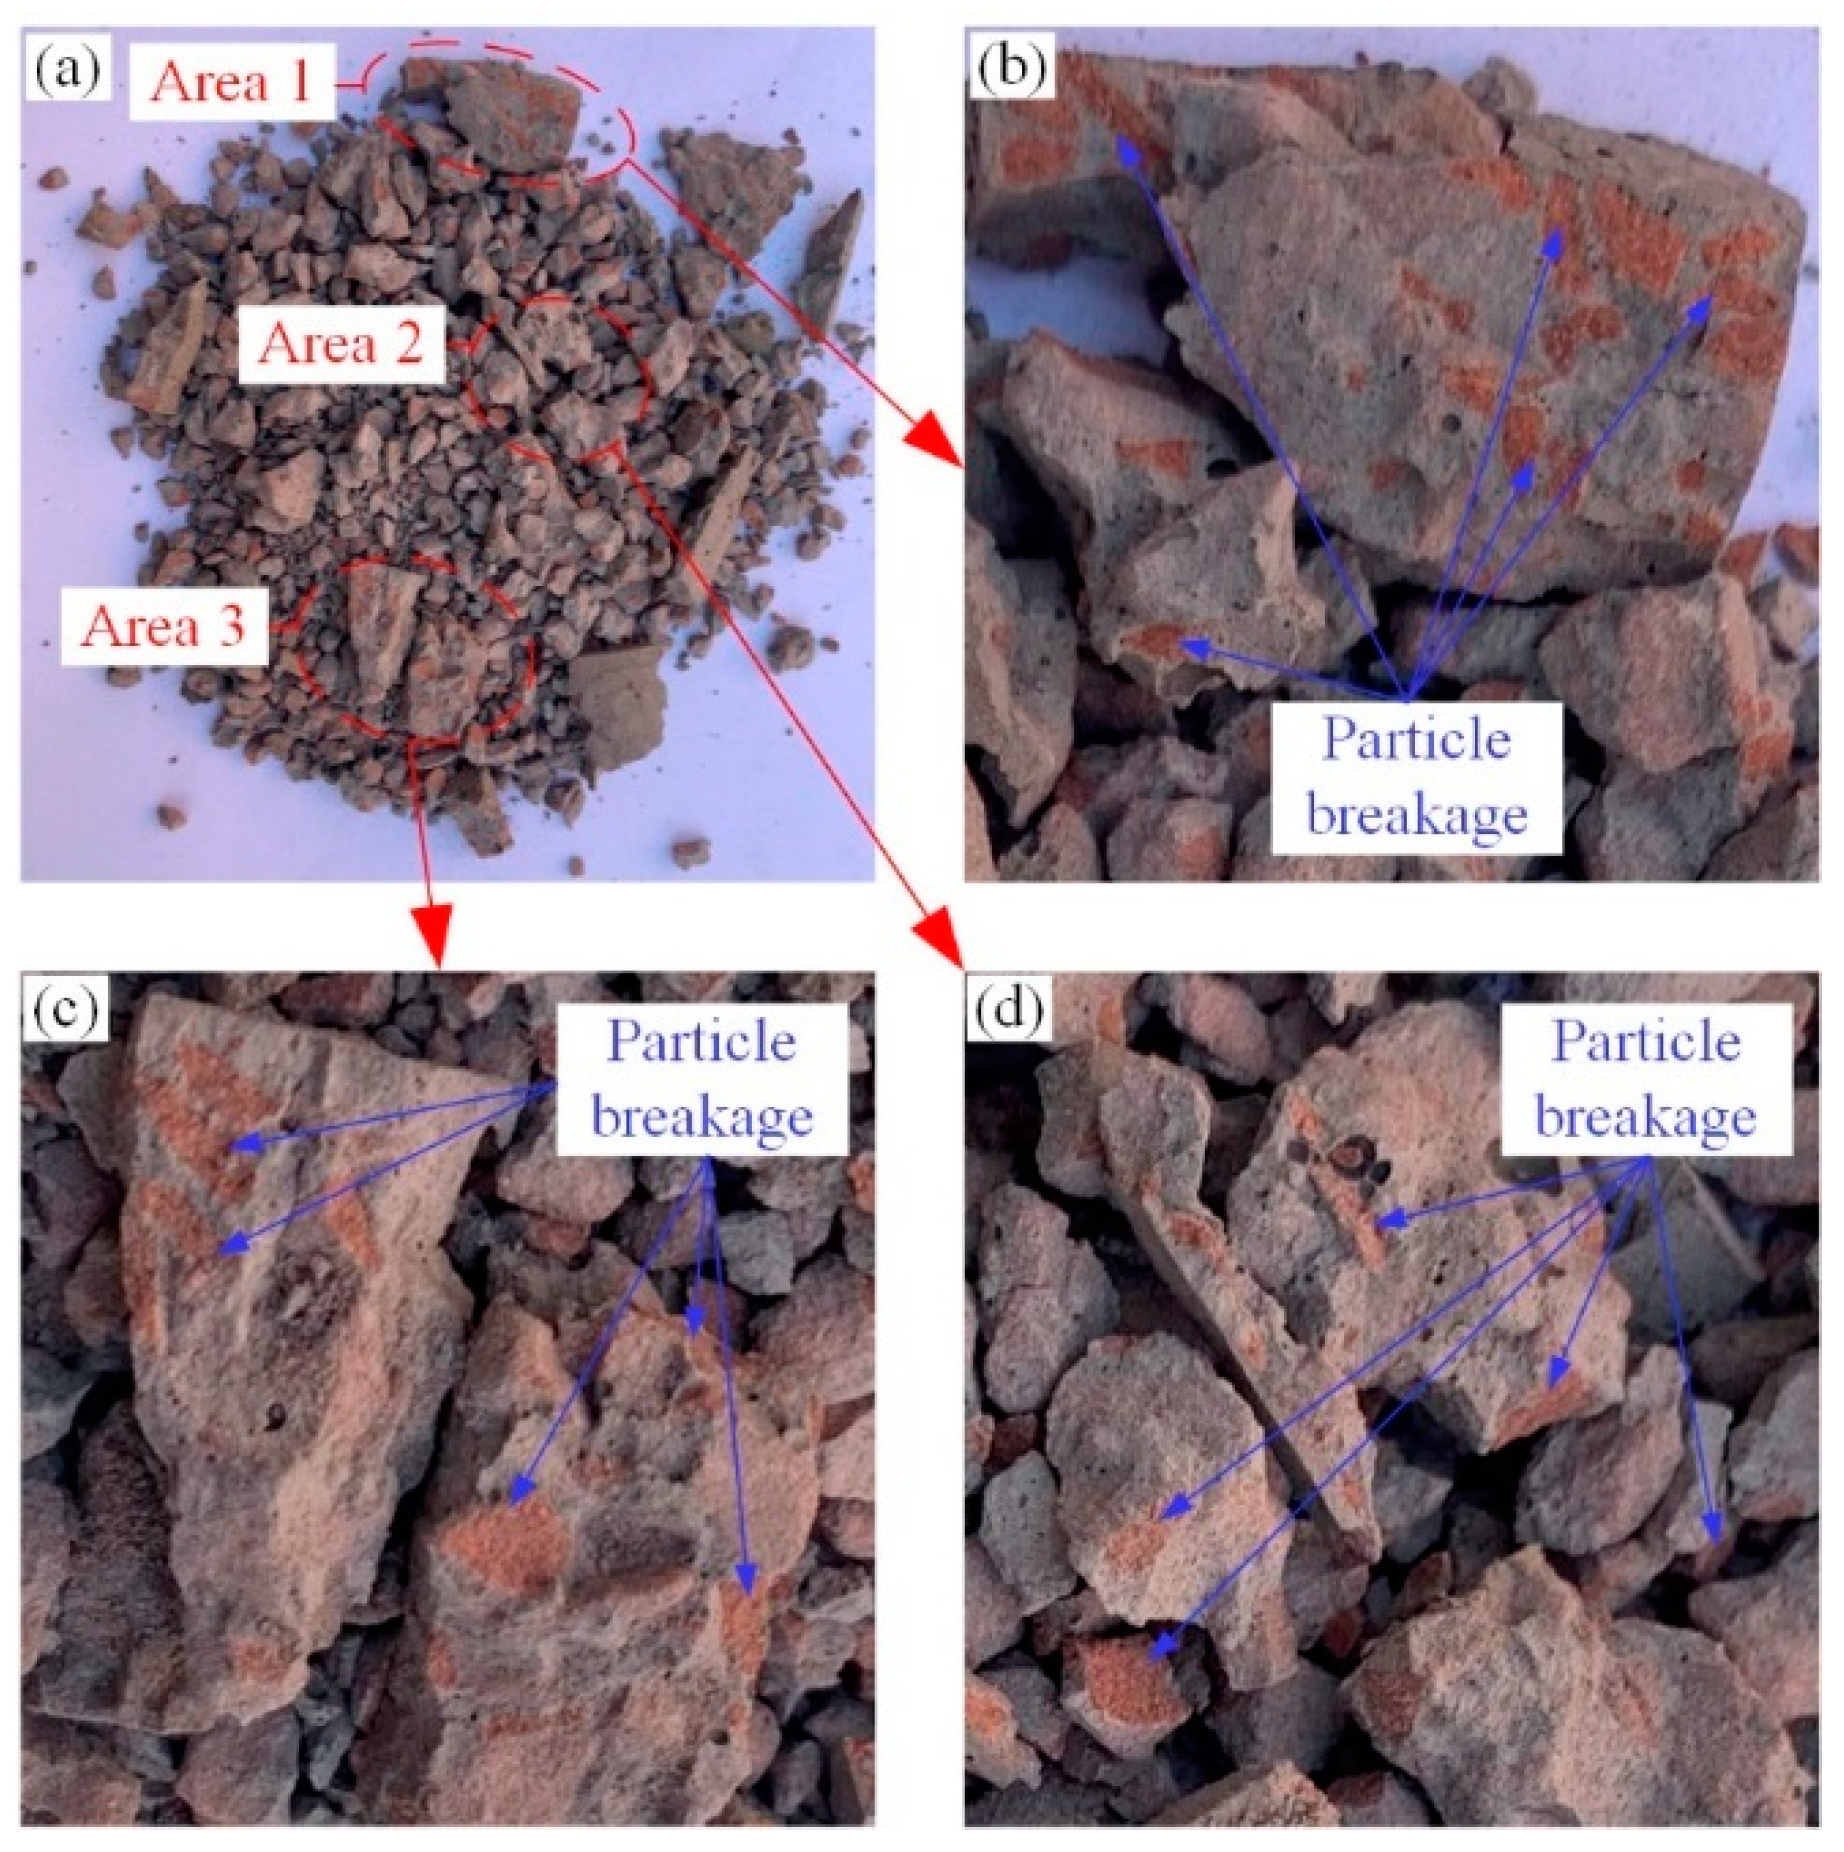
After the broken rock particles are cemented and reshaped, an integral structure has been formed. Dynamic impact damages not only the cementation structure between rock particles but also the rock particles themselves [43]. As shown in Figure 14, many breakages occur in the individual rock particles, which implies that rock particle breakage is a common behavior during dynamic impact. Breakage ratio is a method applied for calculation of the particle broken of cemented rock samples, which is of great significance for investigating the secondary broken of cemented rock samples. Therefore, it is necessary to explore the breakage law of cemented rock samples.
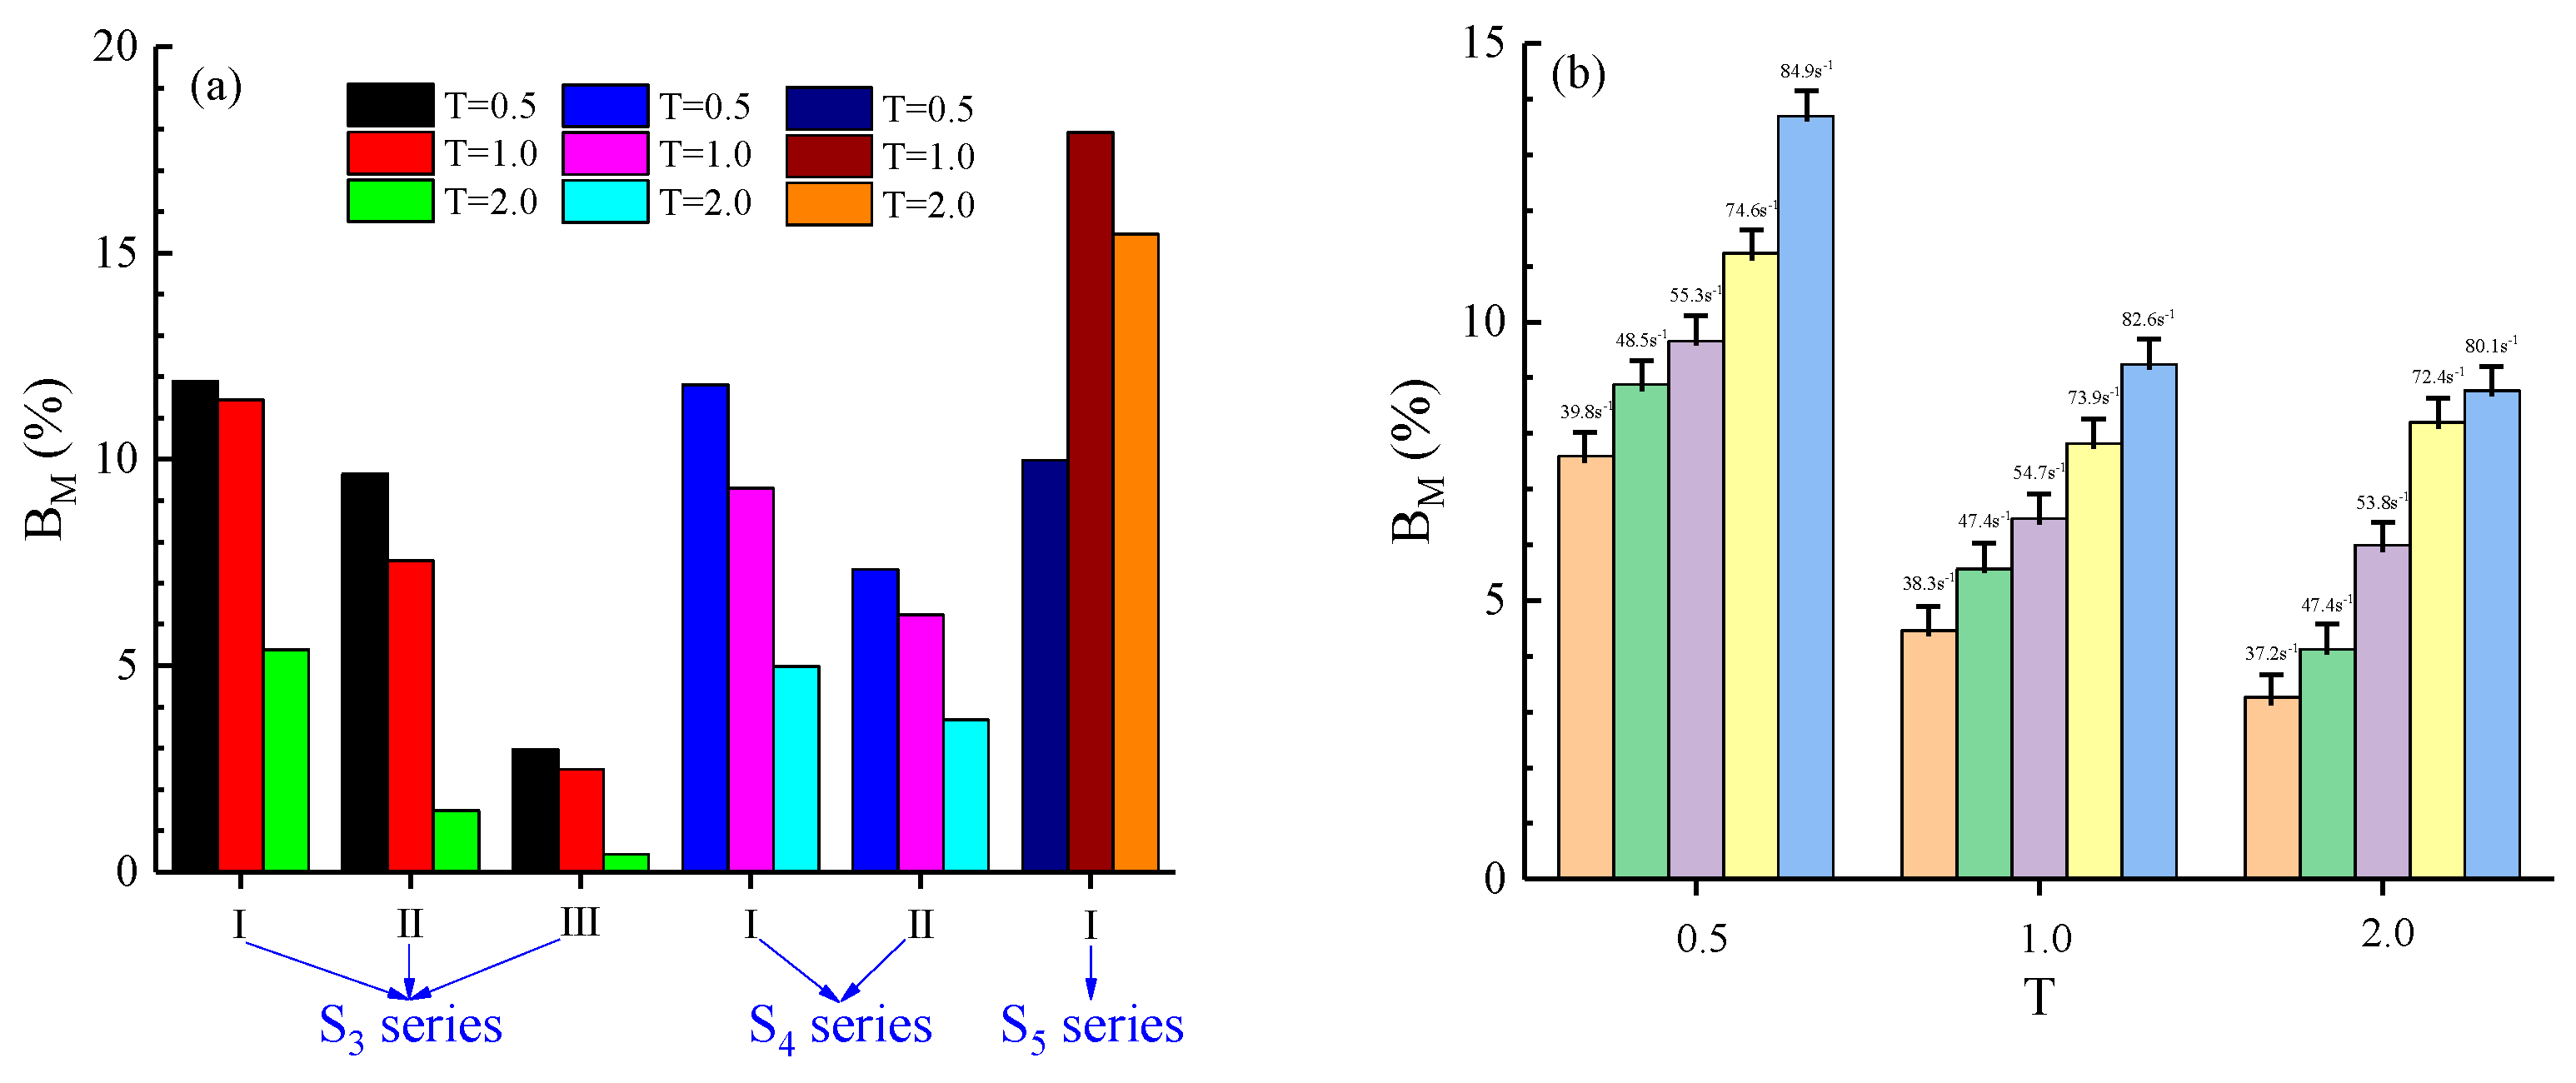
The breakage ratio was calculated using Equation (8) and the results are shown in Figure 15. As for the effect of PSD on breakage behavior, the breakage ratio BM (indicating a change in the PSD) appears to decrease with an increase in the Talbot index in the S3 and S4 series of cemented rock samples, except for the S5 series of cemented rock samples (as shown in Figure 15a). A high Talbot index corresponds to more large rock particles in the cemented rock sample, which verifies that large particles contribute to the formation of the solid structure of the cemented rock sample. As for the effect of strain rate on breakage behavior, BM obviously increases with an increase in strain rate (as shown in Figure 15b).

5. Discussion

5.1. Effects of PSD and Strain Rate on Dynamic Strength

5.1.1. Effect of PSD on Dynamic Strength

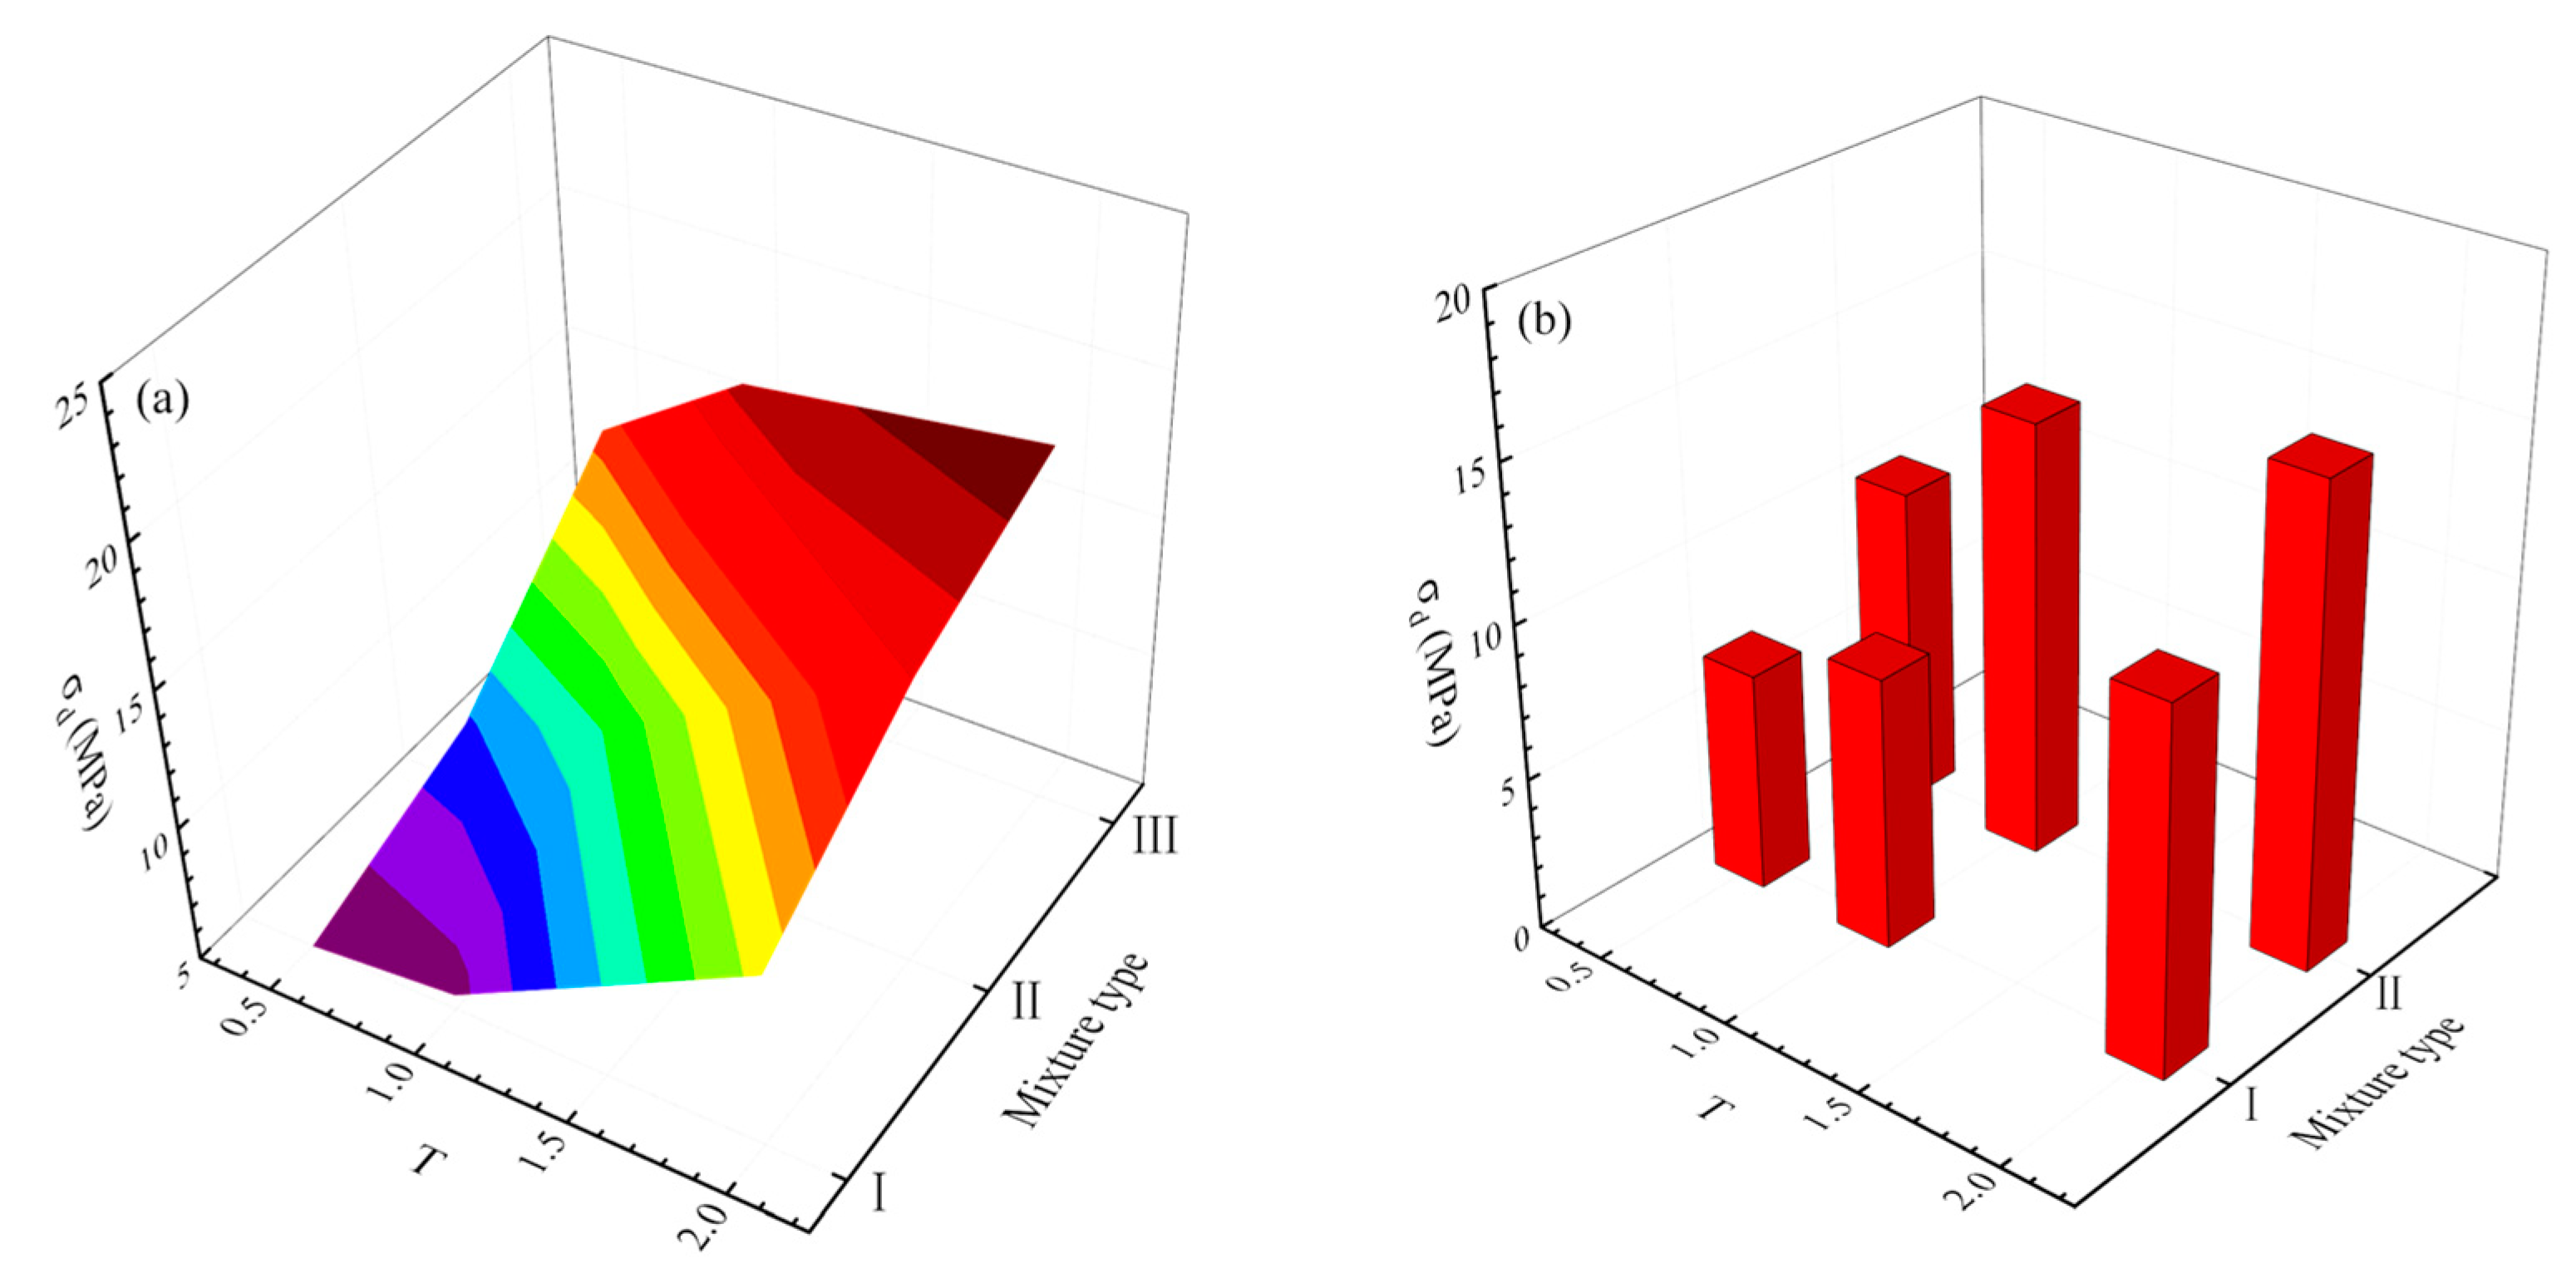
From the test results in Section 4.1, the PSD has a remarkable influence on the dynamic strength of cemented rock samples. Figure 16a shows the dynamic strength variation of the S3 series with the PSD, which indicates that the dynamic strength increases with an increase in both the Talbot index and mixture type; these indicate cemented rock samples containing more large rock particles, which can create dynamic strength. This behavior is also seen in the S4 and S5 series (Figure 16b,c).

5.1.2. Effect of Strain Rate on Dynamic Strength

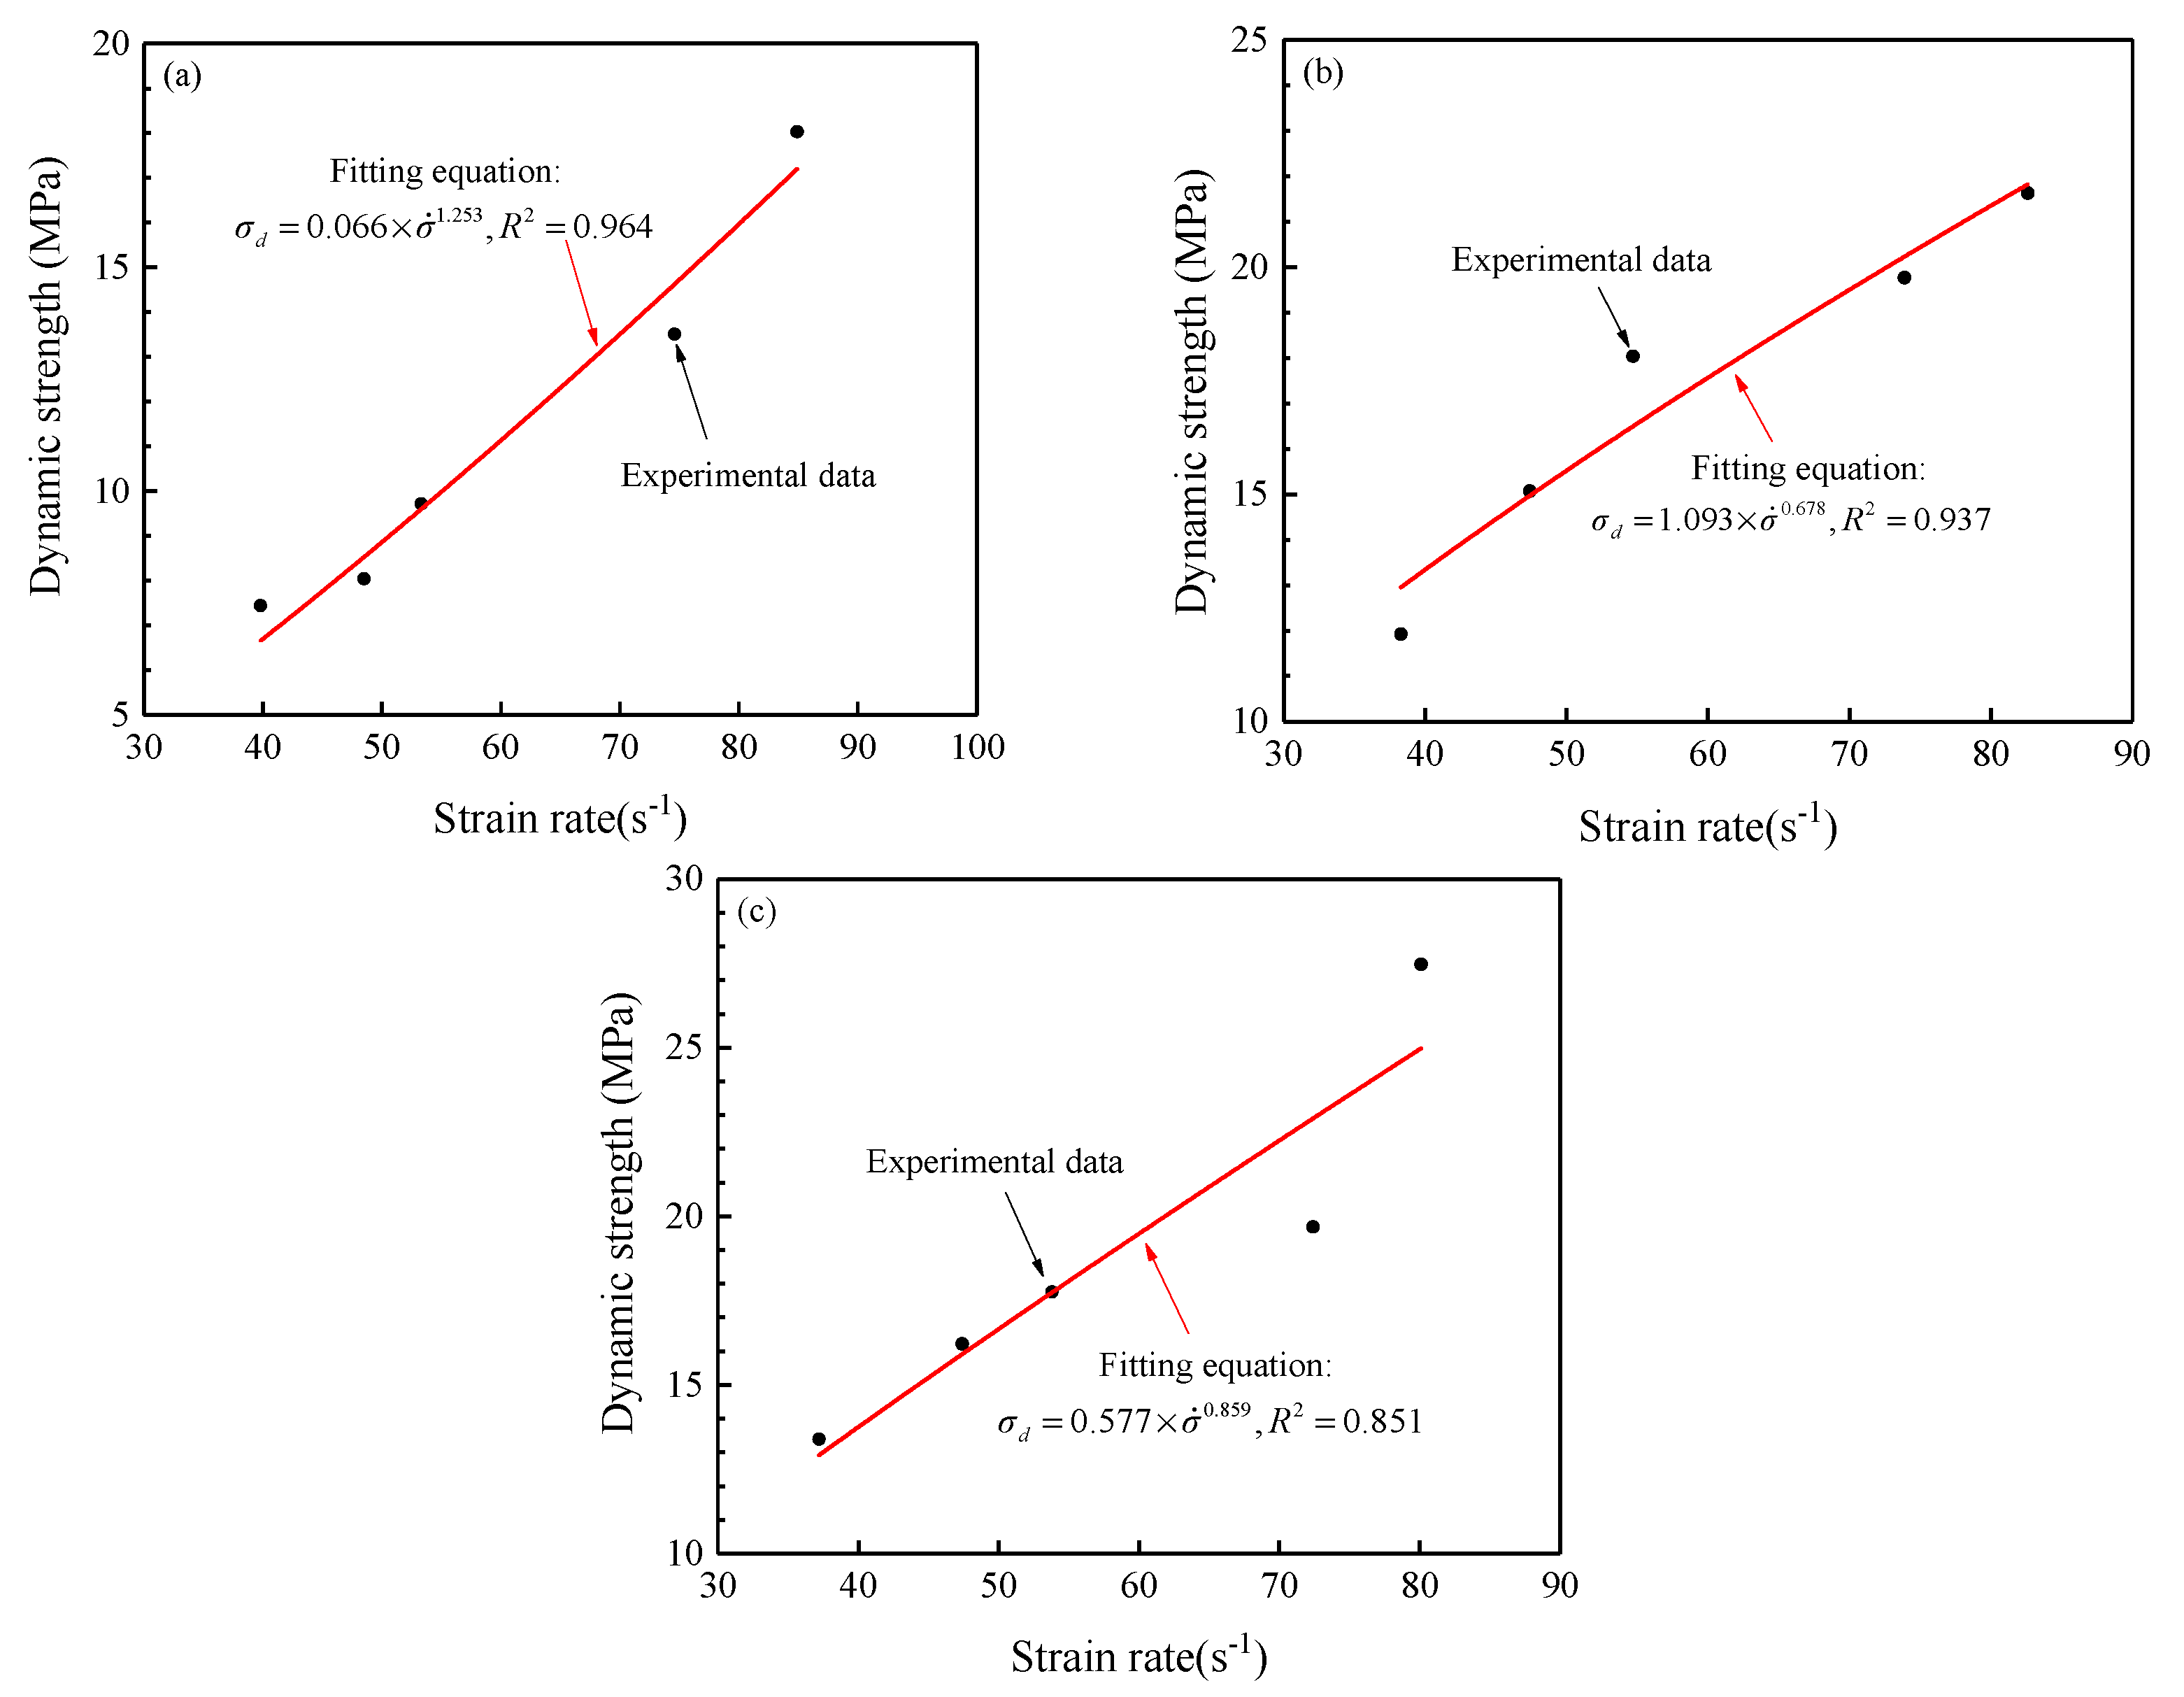
Under the action of dynamic impact, the dynamic strength of the rock material follows the rate effect [44]. Figure 17 shows the variation of dynamic strength with strain rate in the S5 series of cemented rock samples; Figure 17a–c corresponds to the different Talbot indices (T = 0.5, 1.0 and 2.0) that denote different PSDs. The dynamic strength and strain rate in the experimental data are well fitted by the power function.

5.2. Effects of PSD and Strain Rate on Fractal Characteristics

5.2.1. Effects of PSD on Fractal Dimension

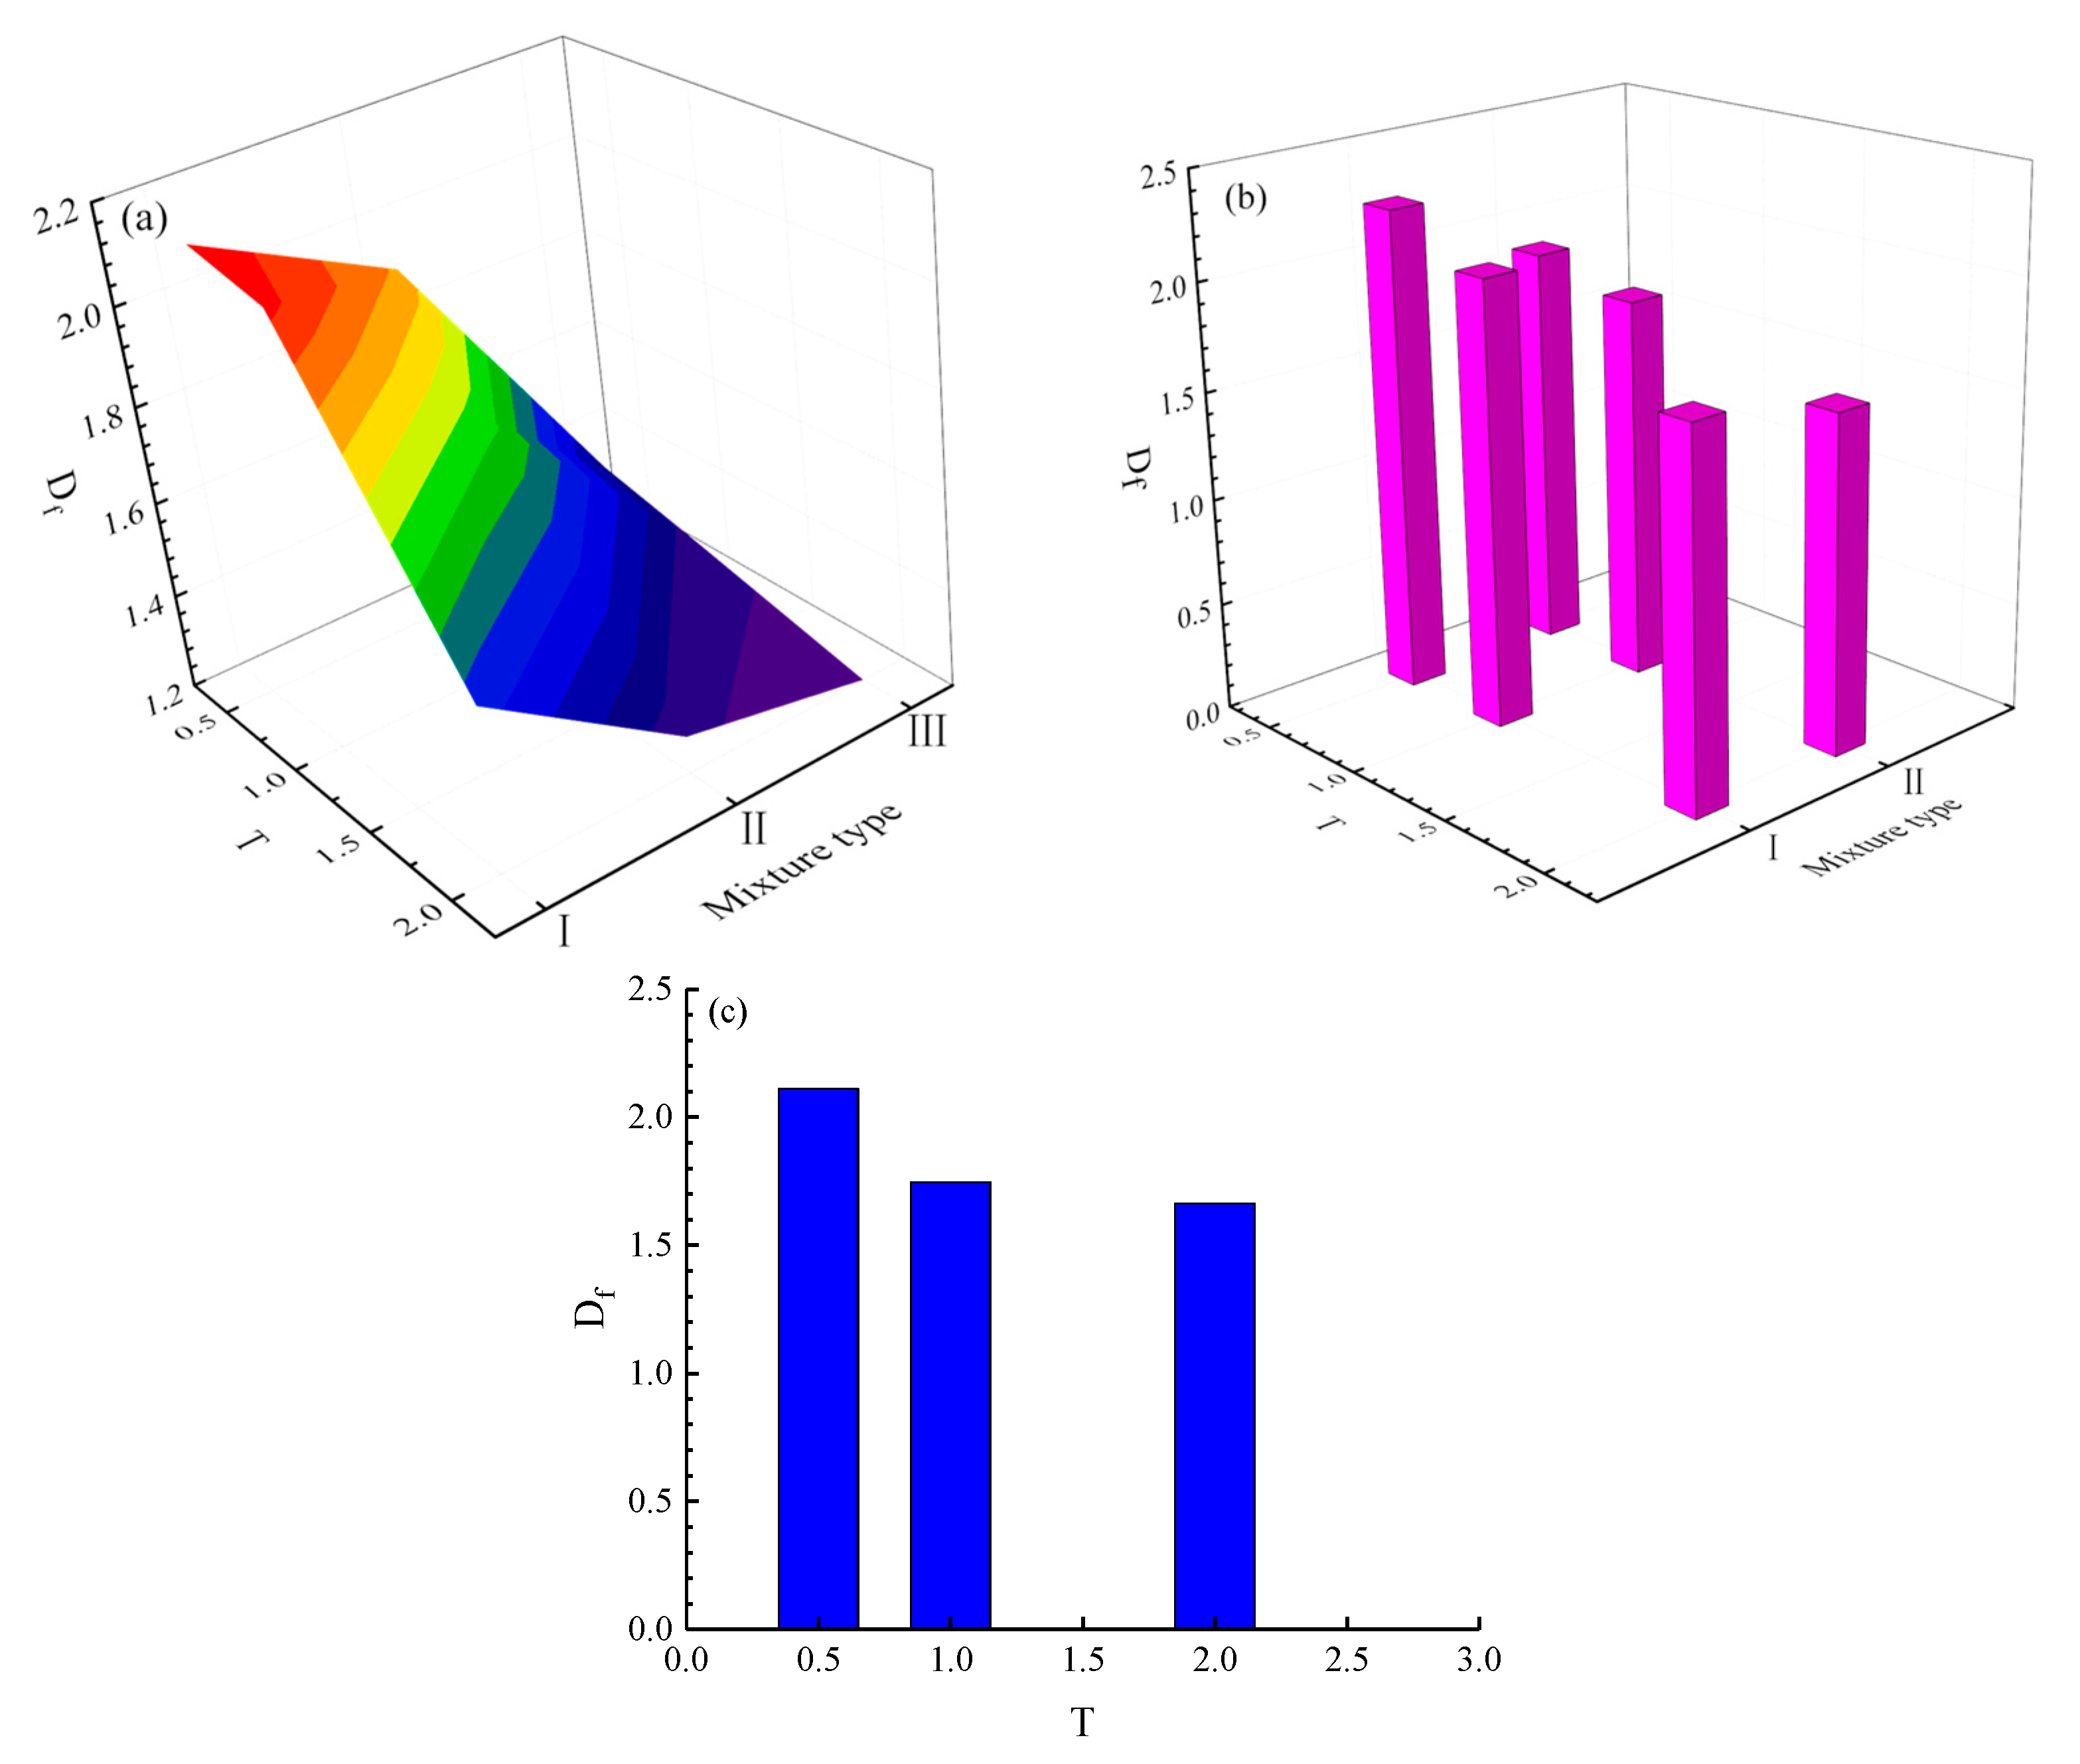
Figure 18a shows the variation of the fragmentation fractal dimension with PSD of the S3 series of cemented rock samples, indicating that the fractal dimension decreases with an increase in the Talbot index and mixture type. Figure 18b,c show the fractal dimension variation of the S4 and S5 series of cemented rock samples, and the variation law is consistent with that of the S3 series of cemented rock samples. Compared with the strength variation, the fractal dimension variation shows an opposite response to the PSD effect.

5.2.2. Effect of Strain Rate on Fractal Dimension

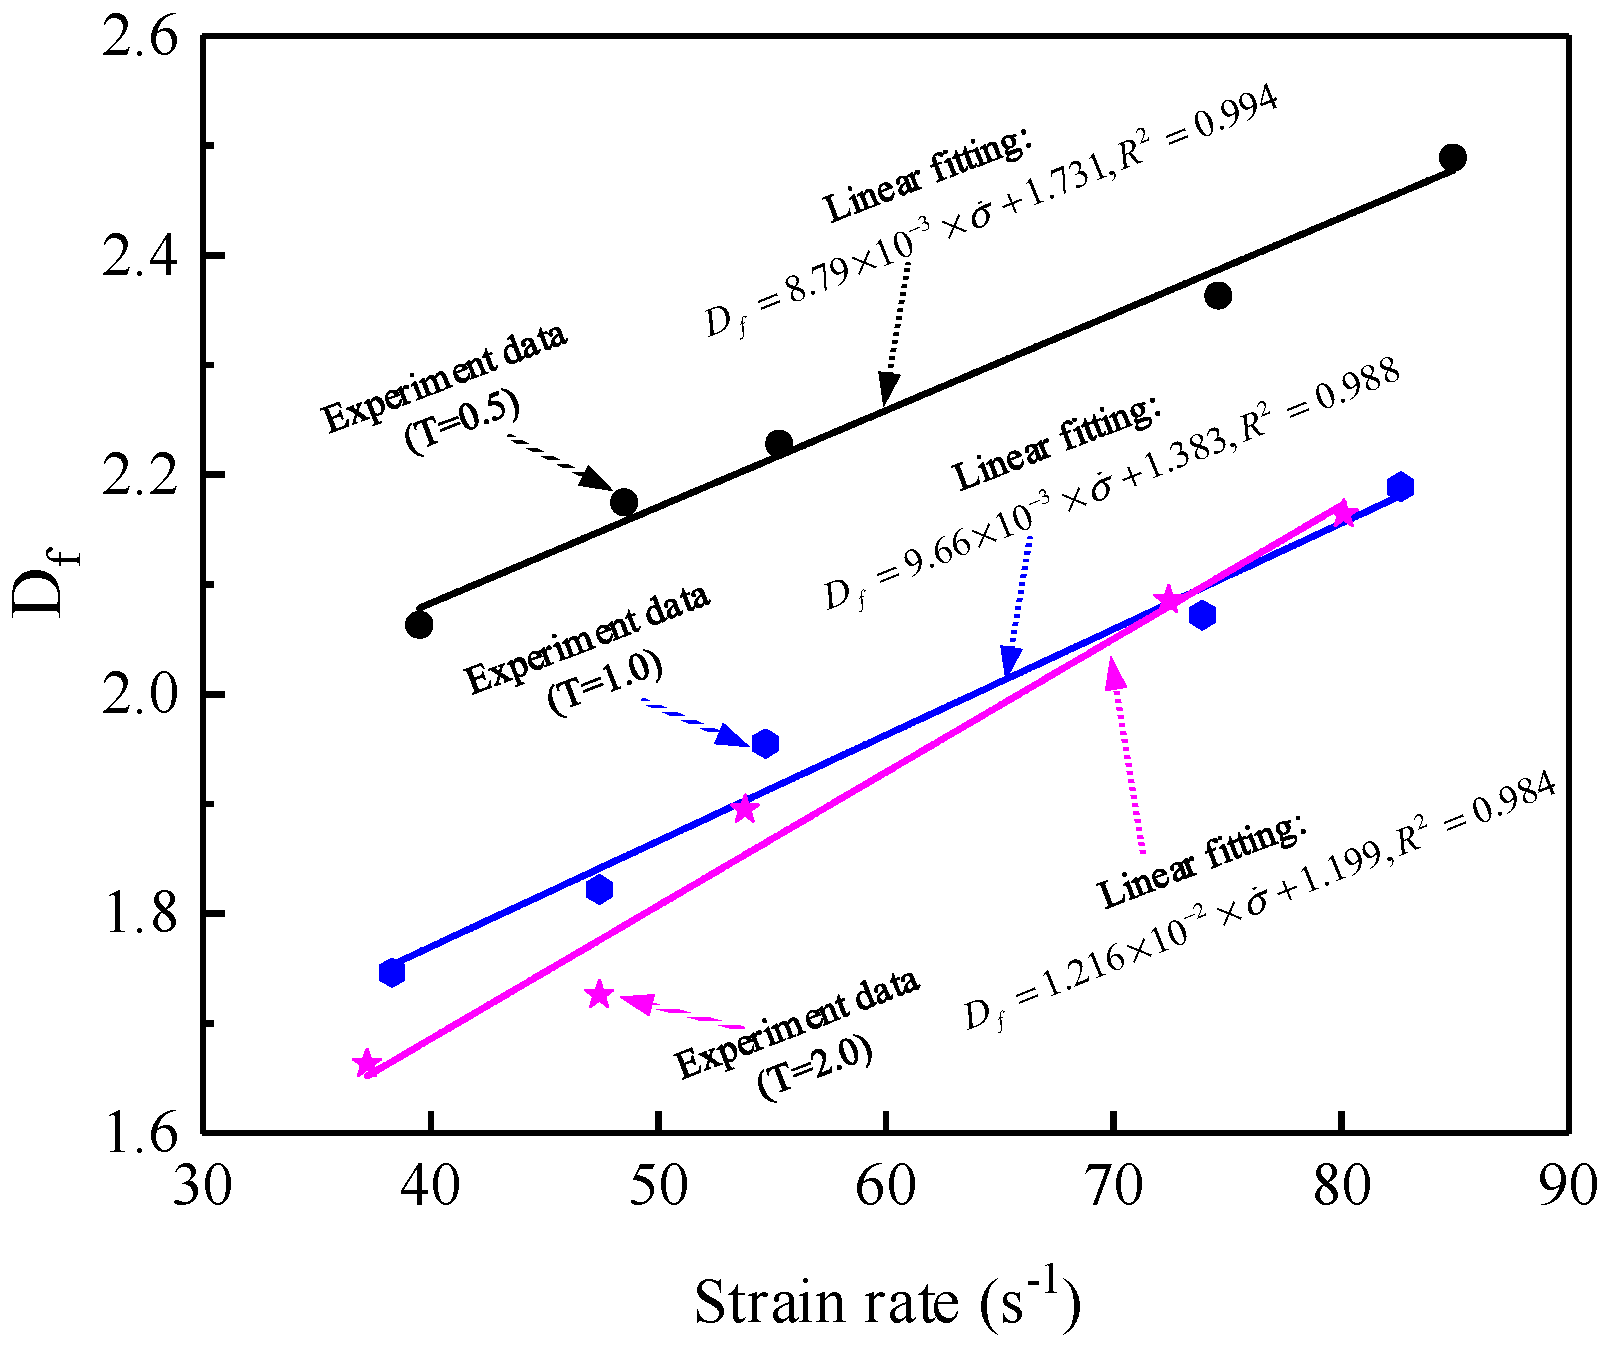
In the experimental data, the fractal dimension is seen to increase with strain rate. Linear fitting functions can describe the relationship between the strain rate and the fractal dimension of fragmentation products from cemented rock samples. As shown in Figure 19, the goodness of fit is relatively high for the three types of Talbot index, which suggests the validity of these linear fittings.

5.3. Relationship between Dynamic Strength and Fractal Dimension

5.3.1. Relationship between Crush Ratio and Fractal Dimension

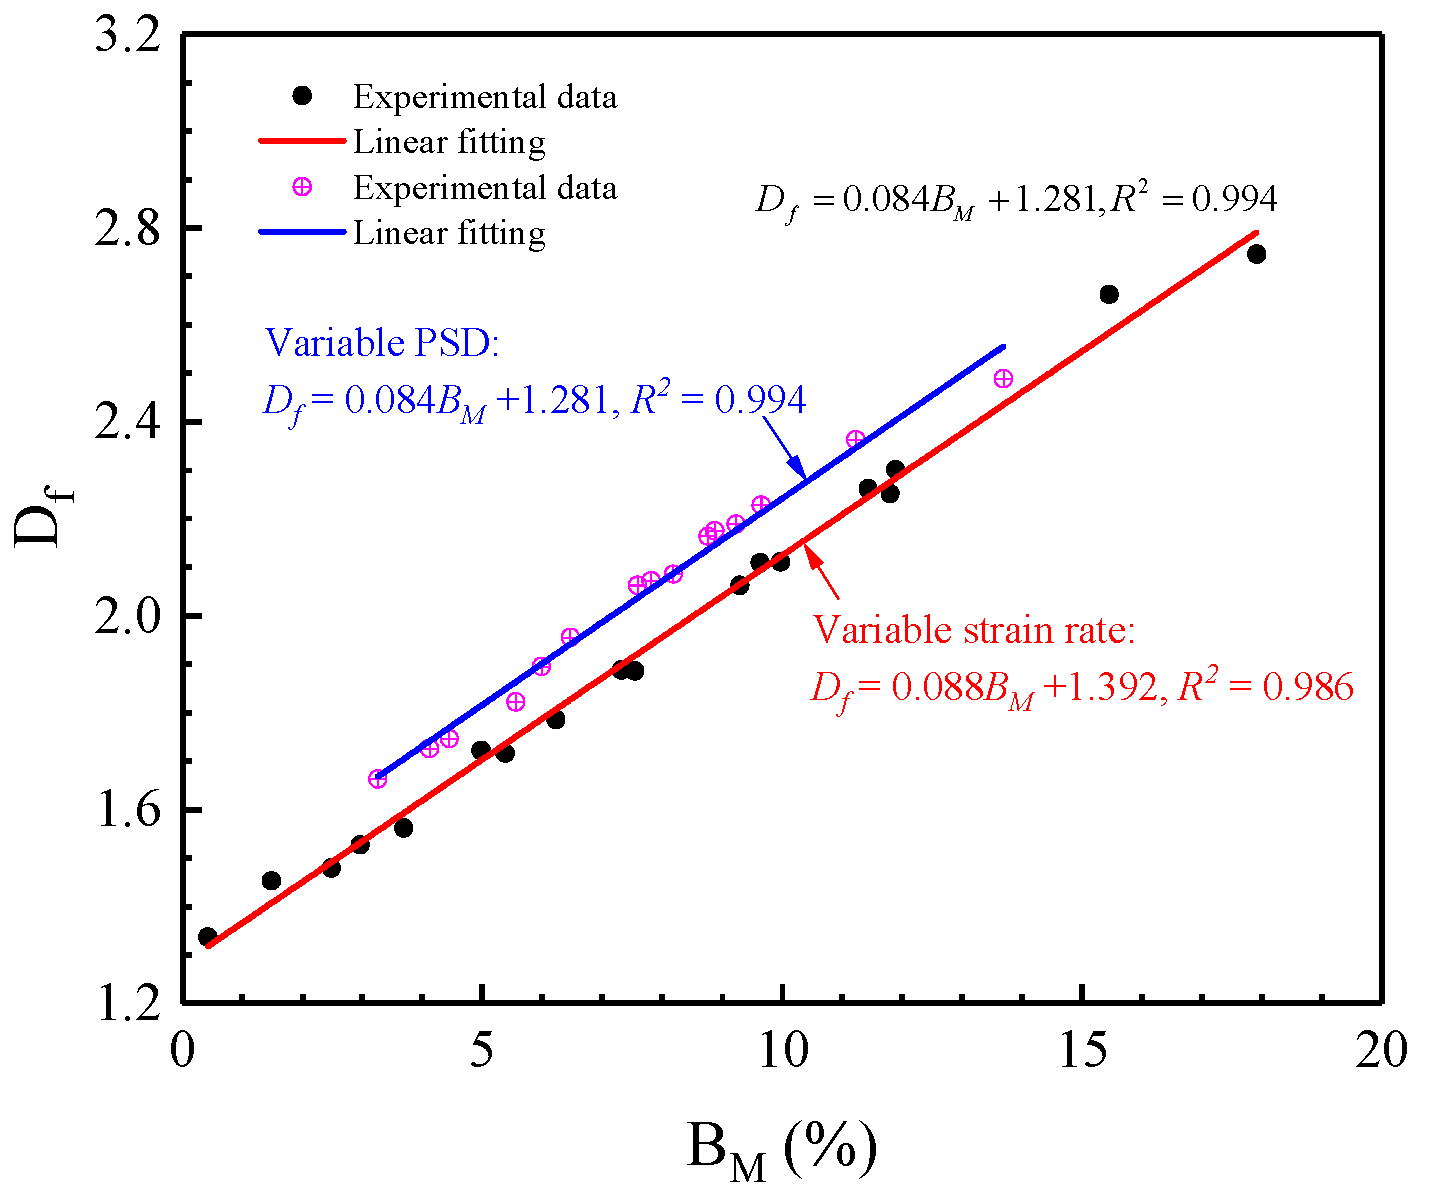
The breakage ratio reflects the change in the size distribution of rock particles following the dynamic impact, which can comprehensively reflect the breakage of the original rock particle itself and the breakage between the rock particles and cement. The fractal dimension directly reflects the relationship between the fragment mass and fragment size of cemented rock samples. Therefore, both are related to the breaking characteristics of cemented rock samples. For variations in either the sample PSDs or the strain rate, the fractal dimension of fragmentation products increases with the breakage ratio (Figure 20). It is found that the fractal dimension and breakage ratio are well fitted by linear functions. It is noteworthy that the slopes of the two fitted curves are equal. This indicates that neither the change in the internal structure of the cemented rock sample nor the change in the external dynamic load conditions will change this linear relationship, which further shows that the breakage ratio and fractal dimension are intrinsically linked and not affected by other factors.

5.3.2. Relationship between Dynamic Strength and Fractal Dimension

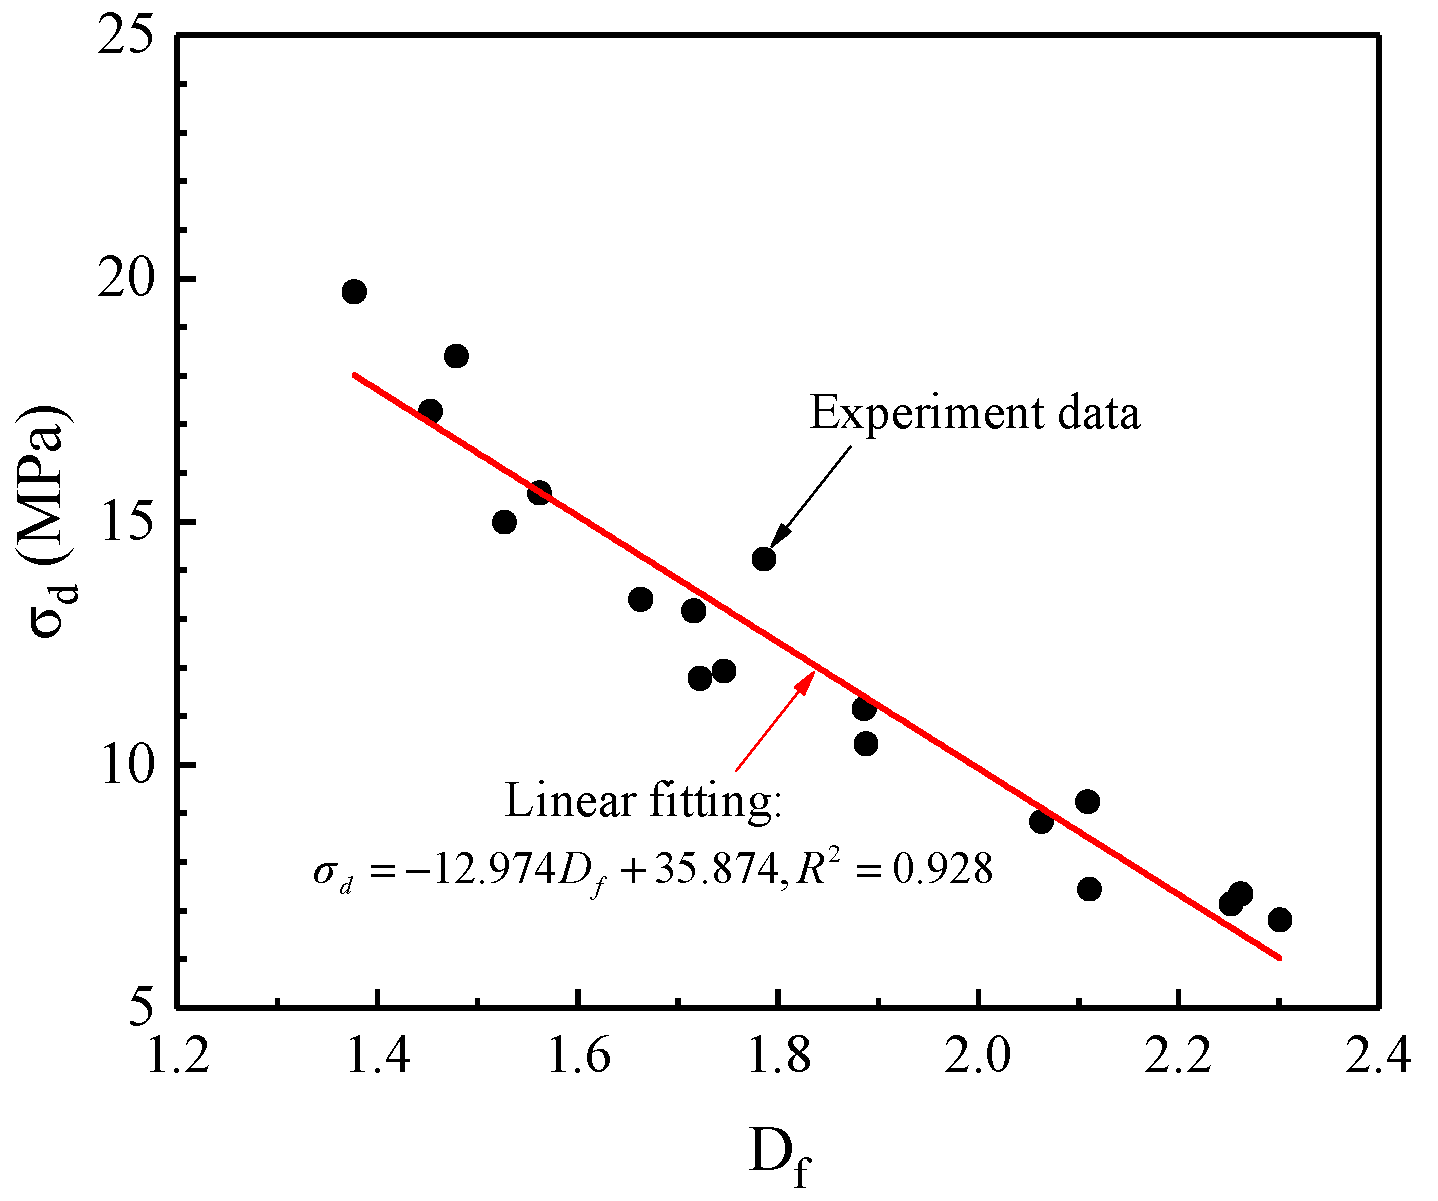
Figure 21 shows the effect of the PSD on the relation between dynamic strength and fractal dimension; the experimental data (Table 2) show that the dynamic strength decreases as the fractal dimension increases. When the strain rate remains unchanged and only the PSD of the cemented rock sample is changed, the fractal dimension is negatively correlated with the dynamic strength, as measured by linear fitting. This phenomenon indicates that when the external dynamic load conditions remain unchanged, the change in the internal structure mainly affects the dynamic strength and fractal characteristics of cemented rock samples. The change in the PSD mainly causes a change in the proportion of large particles, which directly determines the dynamic strength. The crushing degree of the cemented rock sample with a high strength was small, corresponding to a low fractal dimension. Therefore, there is a negative linear correlation between the dynamic strength and the fractal dimension.
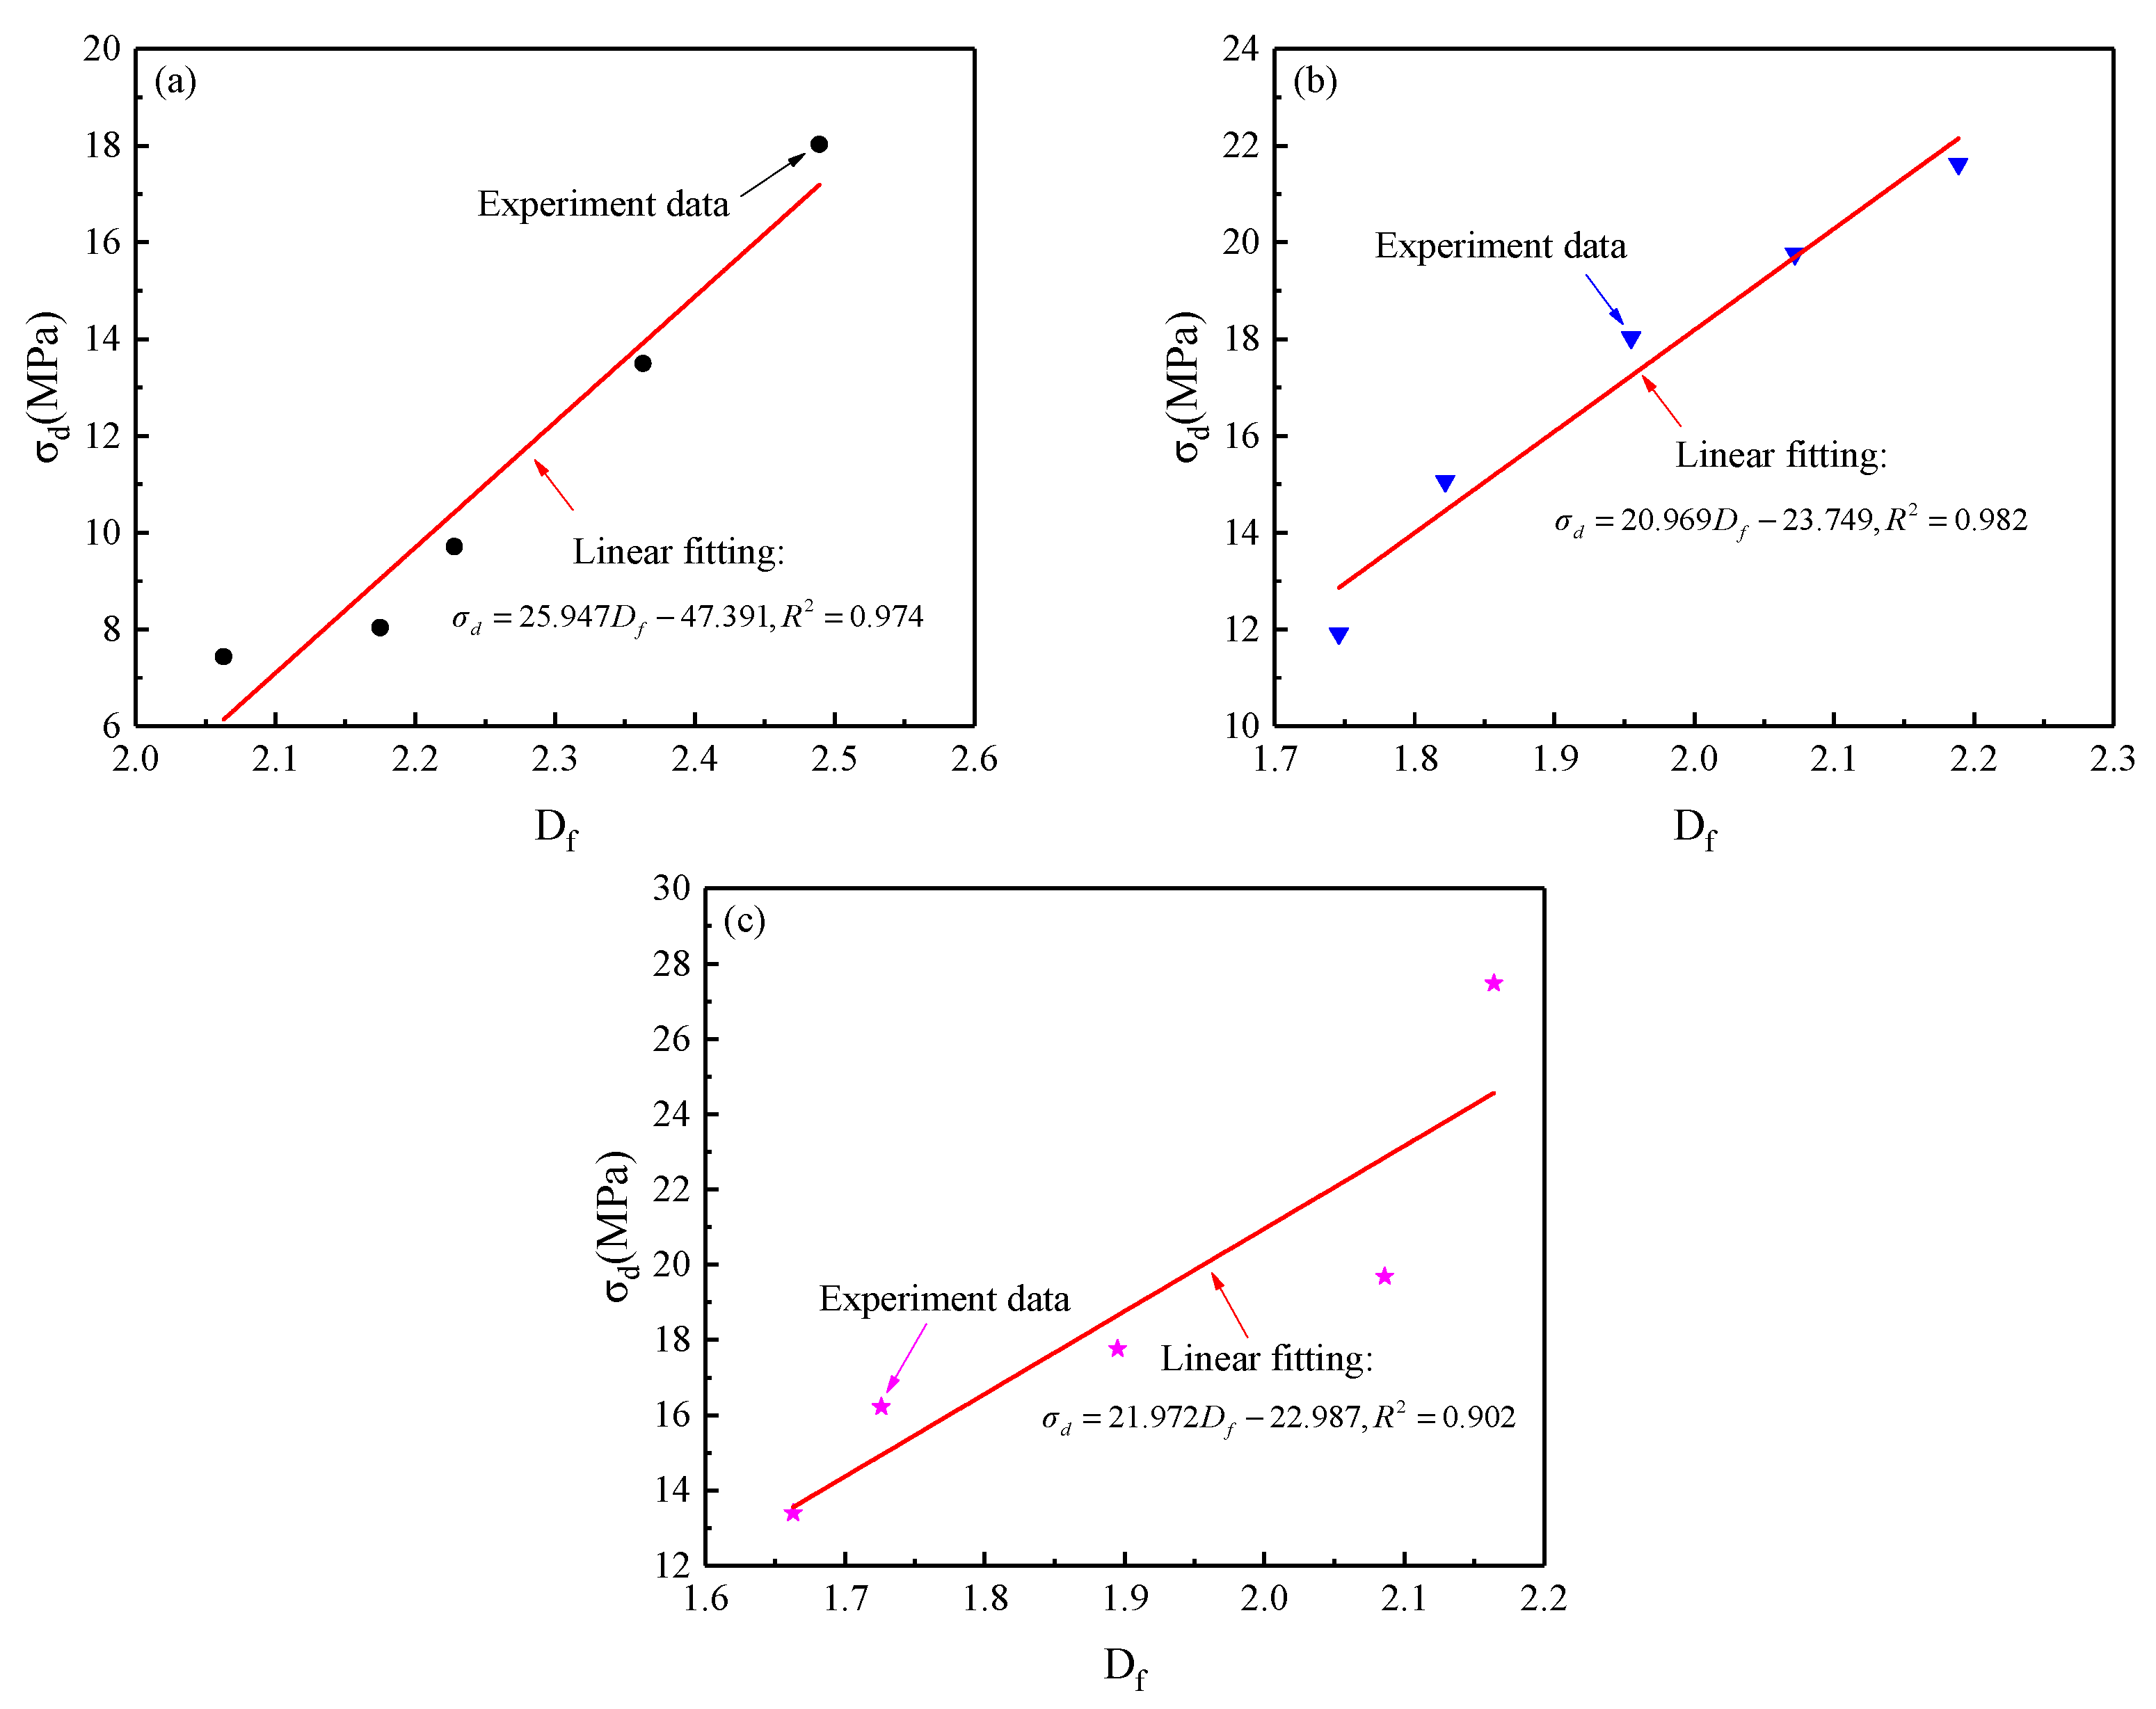
Figure 22 shows the effect of strain rate on the relation between dynamic strength and the fractal dimension for samples with different Talbot indices; the experimental data (Table 3) show that the dynamic strength increases with increasing fractal dimension for sample sets with different Talbot indices (as shown in Figure 22a–c). When the PSD remains unchanged and only the strain rate is changed, the fractal dimension is positively correlated with the dynamic strength, as seen through linear fitting. This phenomenon indicates that for the same values of the PSD, the strain rate directly determines the dynamic strength and fractal characteristics of the cemented rock sample, with both exhibiting the same response characteristics as the strain rate effect. Therefore, a positive linear correlation exists between dynamic strength and fractal dimension.

6. Conclusions

This study focuses on the dynamic mechanics and fractal characteristics of fault-cemented rock strata. The broken rock particles were reshaped to obtain cemented rock samples with variable particle size distributions, and split Hopkinson pressure bar dynamic impact tests were carried out on the cemented rock samples under different strain rates. The following conclusions were drawn.
(1) The stress–strain curves show that the dynamic stress first increases and then decreases with increasing strain. This indicates that plastic deformation occurs because of the porous structure of the cemented rock sample. Therefore, the stress nonlinearly changes with strain through the entire dynamic stress–strain curve. The cemented rock sample with a high Talbot index and mixture type contains more large particles, and its dynamic strength increases gradually. A power function effectively describes the relationship between the strain rate and the dynamic strength for various Talbot indices.
(2) By analyzing the relationship between fragment mass and fragment size, it is found that the fragments of cemented rock samples follow obvious fractal laws after dynamic impact. The breakage of cemented rock samples includes the breakage of the original rock particle itself and the breakage between the rock particles and cementations. The fractal dimension and breakage ratio both decrease with the increase in mixture type and the Talbot index but increase with the increase in strain rate. It is worth noting that the breakage ratio and fractal dimension have a linear relationship regardless of the PSD or strain rate.
(3) The PSD and strain rate effects influence the internal structure of the cemented rock sample and the response to an external load, respectively. The relationship between the dynamic strength and fractal dimension has different response laws for the PSD and strain rate effects. The dynamic strength is linearly related to the fractal dimension in a negative sense under differences in PSD but linearly related positively to the fractal dimension under differences in strain rate.

Author Contributions

J.W. is responsible for the experimental part, data processing and the paper writing; L.H. and X.L. are responsible for the conceptualization and article review; H.L. and Y.W. are responsible for experimental setup and part of data processing. All authors have read and agreed to the published version of the manuscript.

Funding

The study was supported by the National Natural Science Foundation of China (Grant Nos. 51904335, 51927808 and 52174098). The authors would like to acknowledge the editor and anonymous reviewers for their valuable comments for the improvement of this paper.

Institutional Review Board Statement

Not applicable.

Informed Consent Statement

Not applicable.

Data Availability Statement

The data presented in this study are available on request from the corresponding author.

Conflicts of Interest

The authors declare no conflict of interest.

References

  1. Islam, M.R.; Shinjo, R. Mining-induced fault reactivation associated with the main conveyor belt roadway and safety of the Barapukuria Coal Mine in Bangladesh: Constraints from BEM simulations. Int. J. Coal Geol. 2009, 79, 115–130. [Google Scholar] [CrossRef]
  2. Wang, H.; Xue, S.; Shi, R.; Jiang, Y.; Gong, W.; Mao, L. Investigation of Fault Displacement Evolution During Extraction in Longwall Panel in an Underground Coal Mine. Rock Mech. Rock Eng. 2020, 53, 1809–1826. [Google Scholar] [CrossRef]
  3. Ma, D.; Kong, S.; Li, Z.; Zhang, Q.; Wang, Z.; Zhou, Z. Effect of wetting-drying cycle on hydraulic and mechanical properties of cemented paste backfill of the recycled solid wastes. Chemosphere 2021, 282, 131163. [Google Scholar] [CrossRef] [PubMed]
  4. Wang, Z.; Li, W.; Chen, J. Application of Various Nonlinear Models to Predict the Uniaxial Compressive Strength of Weakly Cemented Jurassic Rocks. Nat. Resour. Res. 2022, 31, 371–384. [Google Scholar] [CrossRef]
  5. Demirdag, S. Effects of freezing-thawing and thermal shock cycles on physical and mechanical properties of filled and unfilled travertines. Constr. Build. Mater. 2013, 47, 1395–1401. [Google Scholar] [CrossRef]
  6. Yin, Q.; Jing, H.; Su, H.; Zhao, H. Experimental Study on Mechanical Properties and Anchorage Performances of Rock Mass in the Fault Fracture Zone. Int. J. Geomech. 2018, 18, 04018067. [Google Scholar] [CrossRef]
  7. Zhu, W.; Hughes, J.J.; Bicanic, N.; Pearce, C.J. Nanoindentation mapping of mechanical properties of cement paste and natural rocks. Mater. Charact. 2007, 58, 1189–1198. [Google Scholar] [CrossRef]
  8. Huang, L.; Guo, Y.; Li, X. Failure characteristics of shale after being subjected to high temperatures under uniaxial compression. Bull. Eng. Geol. Environ. 2021, 81, 33. [Google Scholar] [CrossRef]
  9. Wang, J.; Ma, D.; Li, Z.; Huang, Y.; Du, F. Experimental investigation of damage evolution and failure criterion on hollow cylindrical rock samples with different bore diameters. Eng. Fract. Mech. 2022, 260, 108182. [Google Scholar] [CrossRef]
  10. Fu, J.-X.; Song, W.-D.; Tan, Y.-Y. Study on Microstructural Evolution and Strength Growth and Fracture Mechanism of Cemented Paste Backfill. Adv. Mater. Sci. Eng. 2016, 2016, 8792817. [Google Scholar] [CrossRef] [Green Version]
  11. Fall, M.; Benzaazoua, M.; Ouellet, S. Experimental characterization of the influence of tailings fineness and density on the quality of cemented paste backfill. Miner. Eng. 2005, 18, 41–44. [Google Scholar] [CrossRef]
  12. Jiang, H.; Fall, M. Yield stress and strength of saline cemented tailings materials in sub-zero environments: Slag-paste backfill. J. Sustain. Cem.-Based Mater. 2017, 6, 314–331. [Google Scholar] [CrossRef]
  13. Xu, W.-b.; Liu, B.; Wu, W.-l. Strength and deformation behaviors of cemented tailings backfill under triaxial compression. J. Cent. South Univ. 2020, 27, 3531–3543. [Google Scholar] [CrossRef]
  14. Weilv, W.; Xu, W.; Jianpin, Z. Effect of inclined interface angle on shear strength and deformation response of cemented paste backfill-rock under triaxial compression. Constr. Build. Mater. 2021, 279, 122478. [Google Scholar] [CrossRef]
  15. Yu, X.; Kemeny, J.; Li, J.; Song, W.; Tan, Y. 3D Observations of Fracturing in Rock-Backfill Composite Specimens Under Triaxial Loading. Rock Mech. Rock Eng. 2021, 54, 6009–6022. [Google Scholar] [CrossRef]
  16. Yin, S.; Wu, A.; Hu, K.; Wang, Y.; Zhang, Y. The effect of solid components on the rheological and mechanical properties of cemented paste backfill. Miner. Eng. 2012, 35, 61–66. [Google Scholar] [CrossRef]
  17. Fang, K.; Fall, M. Chemically Induced Changes in the Shear Behaviour of Interface Between Rock and Tailings Backfill Undergoing Cementation. Rock Mech. Rock Eng. 2019, 52, 3047–3062. [Google Scholar] [CrossRef]
  18. Zhou, N.; Zhang, J.; Ouyang, S.; Deng, X.; Dong, C.; Du, E. Feasibility study and performance optimization of sand-based cemented paste backfill materials. J. Clean. Prod. 2020, 259, 120798. [Google Scholar] [CrossRef]
  19. Zhou, X.; Hu, S.; Zhang, G.; Li, J.; Xuan, D.; Gao, W. Experimental investigation and mathematical strength model study on the mechanical properties of cemented paste backfill. Constr. Build. Mater. 2019, 226, 524–533. [Google Scholar] [CrossRef]
  20. Lu, G.; Fall, M. Modeling Postblasting Stress and Pore Pressure Distribution in Hydrating Fill Mass at an Early Age. Int. J. Geomech. 2018, 18, 04018090. [Google Scholar] [CrossRef]
  21. Liu, Z.-y.; Gan, D.-q.; Gan, Z. Dynamic regimes of cemented backfill at early-age. J. Cent. South Univ. 2021, 28, 2079–2090. [Google Scholar] [CrossRef]
  22. Dikonda, R.K.; Mbonimpa, M.; Belem, T. Specific Mixing Energy of Cemented Paste Backfill, Part II: Influence on the Rheological and Mechanical Properties and Practical Applications. Minerals 2021, 11, 1159. [Google Scholar] [CrossRef]
  23. Cao, S.; Yilmaz, E.; Song, W.; Yilmaz, E.; Xue, G. Loading rate effect on uniaxial compressive strength behavior and acoustic emission properties of cemented tailings backfill. Constr. Build. Mater. 2019, 213, 313–324. [Google Scholar] [CrossRef]
  24. Wu, Y.; Huang, L.; Li, X.; Guo, Y.; Liu, H.; Wang, J. Effects of Strain Rate and Temperature on Physical Mechanical Properties and Energy Dissipation Features of Granite. Mathematics 2022, 10, 1521. [Google Scholar] [CrossRef]
  25. Cao, S.; Xue, G.; Song, W.; Teng, Q. Strain rate effect on dynamic mechanical properties and microstructure of cemented tailings composites. Constr. Build. Mater. 2020, 247, 118537. [Google Scholar] [CrossRef]
  26. Tan, Y.-y.; Yu, X.; Elmo, D.; Xu, L.-h.; Song, W.-d. Experimental study on dynamic mechanical property of cemented tailings backfill under SHPB impact loading. Int. J. Miner. Metall. Mater. 2019, 26, 404–416. [Google Scholar] [CrossRef]
  27. Xue, G.; Yilmaz, E.; Feng, G.; Cao, S.; Sun, L. Reinforcement effect of polypropylene fiber on dynamic properties of cemented tailings backfill under SHPB impact loading. Constr. Build. Mater. 2021, 279, 122417. [Google Scholar] [CrossRef]
  28. Yang, L.; Xu, W.; Yilmaz, E.; Wang, Q.; Qiu, J. A combined experimental and numerical study on the triaxial and dynamic compression behavior of cemented tailings backfill. Eng. Struct. 2020, 219, 110957. [Google Scholar] [CrossRef]
  29. Xu, S.; Suorineni, F.T.; Li, K.; Li, Y. Evaluation of the strength and ultrasonic properties of foam-cemented paste backfill. Int. J. Min. Reclam. Environ. 2017, 31, 544–557. [Google Scholar] [CrossRef]
  30. Chen, X.; Shi, X.; Zhou, J.; Li, E.; Qiu, P.; Gou, Y. High strain rate compressive strength behavior of cemented paste backfill using split Hopkinson pressure bar. Int. J. Min. Sci. Technol. 2021, 31, 387–399. [Google Scholar] [CrossRef]
  31. Nasir, O.; Fall, M. Shear behaviour of cemented pastefill-rock interfaces. Eng. Geol. 2008, 101, 146–153. [Google Scholar] [CrossRef]
  32. Zheng, D.; Song, W.; Cao, S.; Li, J.; Sun, L. Investigation on Dynamical Mechanics, Energy Dissipation, and Microstructural Characteristics of Cemented Tailings Backfill under SHPB Tests. Minerals 2021, 11, 542. [Google Scholar] [CrossRef]
  33. Wang, C.-l.; Ren, Z.-z.; Huo, Z.-k.; Zheng, Y.-c.; Tian, X.-p.; Zhang, K.-f.; Zhao, G.-f. Properties and hydration characteristics of mine cemented paste backfill material containing secondary smelting water-granulated nickel slag. Alex. Eng. J. 2021, 60, 4961–4971. [Google Scholar] [CrossRef]
  34. Wu, J.; Yin, Q.; Gao, Y.; Meng, B.; Jing, H. Particle size distribution of aggregates effects on mesoscopic structural evolution of cemented waste rock backfill. Environ. Sci. Pollut. Res. 2021, 28, 16589–16601. [Google Scholar] [CrossRef]
  35. Liu, H.; Zhang, J.; Zhou, N.; Guo, Y.; Li, B.; Yan, H.; Deng, X. Investigation of spatial stratified heterogeneity of cemented paste backfill characteristics in construction demolition waste recycled aggregates. J. Clean. Prod. 2020, 249, 119332. [Google Scholar] [CrossRef]
  36. Ma, D.; Duan, H.; Li, X.; Li, Z.; Zhou, Z.; Li, T. Effects of seepage-induced erosion on nonlinear hydraulic properties of broken red sandstones. Tunn. Undergr. Space Technol. 2019, 91, 102993. [Google Scholar] [CrossRef]
  37. Li, X.B.; Lok, T.S.; Zhao, J. Dynamic Characteristics of Granite Subjected to Intermediate Loading Rate. Rock Mech. Rock Eng. 2005, 38, 21–39. [Google Scholar] [CrossRef]
  38. Li, X.; Zhou, T.; Li, D. Dynamic Strength and Fracturing Behavior of Single-Flawed Prismatic Marble Specimens Under Impact Loading with a Split-Hopkinson Pressure Bar. Rock Mech. Rock Eng. 2017, 50, 29–44. [Google Scholar] [CrossRef]
  39. Turcotte, D.L. Fractals and fragmentation. J. Geophys. Res. Solid Earth 1986, 91, 1921–1926. [Google Scholar] [CrossRef]
  40. Deng, Y.; Chen, M.; Jin, Y.; Zou, D. Theoretical analysis and experimental research on the energy dissipation of rock crushing based on fractal theory. J. Nat. Gas Sci. Eng. 2016, 33, 231–239. [Google Scholar] [CrossRef] [Green Version]
  41. Li, X.; Zhou, T.; Li, D.; Wang, Z. Experimental and Numerical Investigations on Feasibility and Validity of Prismatic Rock Specimen in SHPB. Shock. Vib. 2016, 2016, 7198980. [Google Scholar] [CrossRef] [Green Version]
  42. Li, X.; Gu, H.; Tao, M.; Peng, K.; Cao, W.; Li, Q. Failure characteristics and meso-deterioration mechanism of pre-stressed coal subjected to different dynamic loads. Theor. Appl. Fract. Mech. 2021, 115, 103061. [Google Scholar] [CrossRef]
  43. Huang, L.-q.; Wang, J.; Momeni, A.; Wang, S.-f. Spalling fracture mechanism of granite subjected to dynamic tensile loading. Trans. Nonferrous Met. Soc. China 2021, 31, 2116–2127. [Google Scholar] [CrossRef]
  44. Li, X.; Zou, Y.; Zhou, Z. Numerical Simulation of the Rock SHPB Test with a Special Shape Striker Based on the Discrete Element Method. Rock Mech. Rock Eng. 2014, 47, 1693–1709. [Google Scholar] [CrossRef]
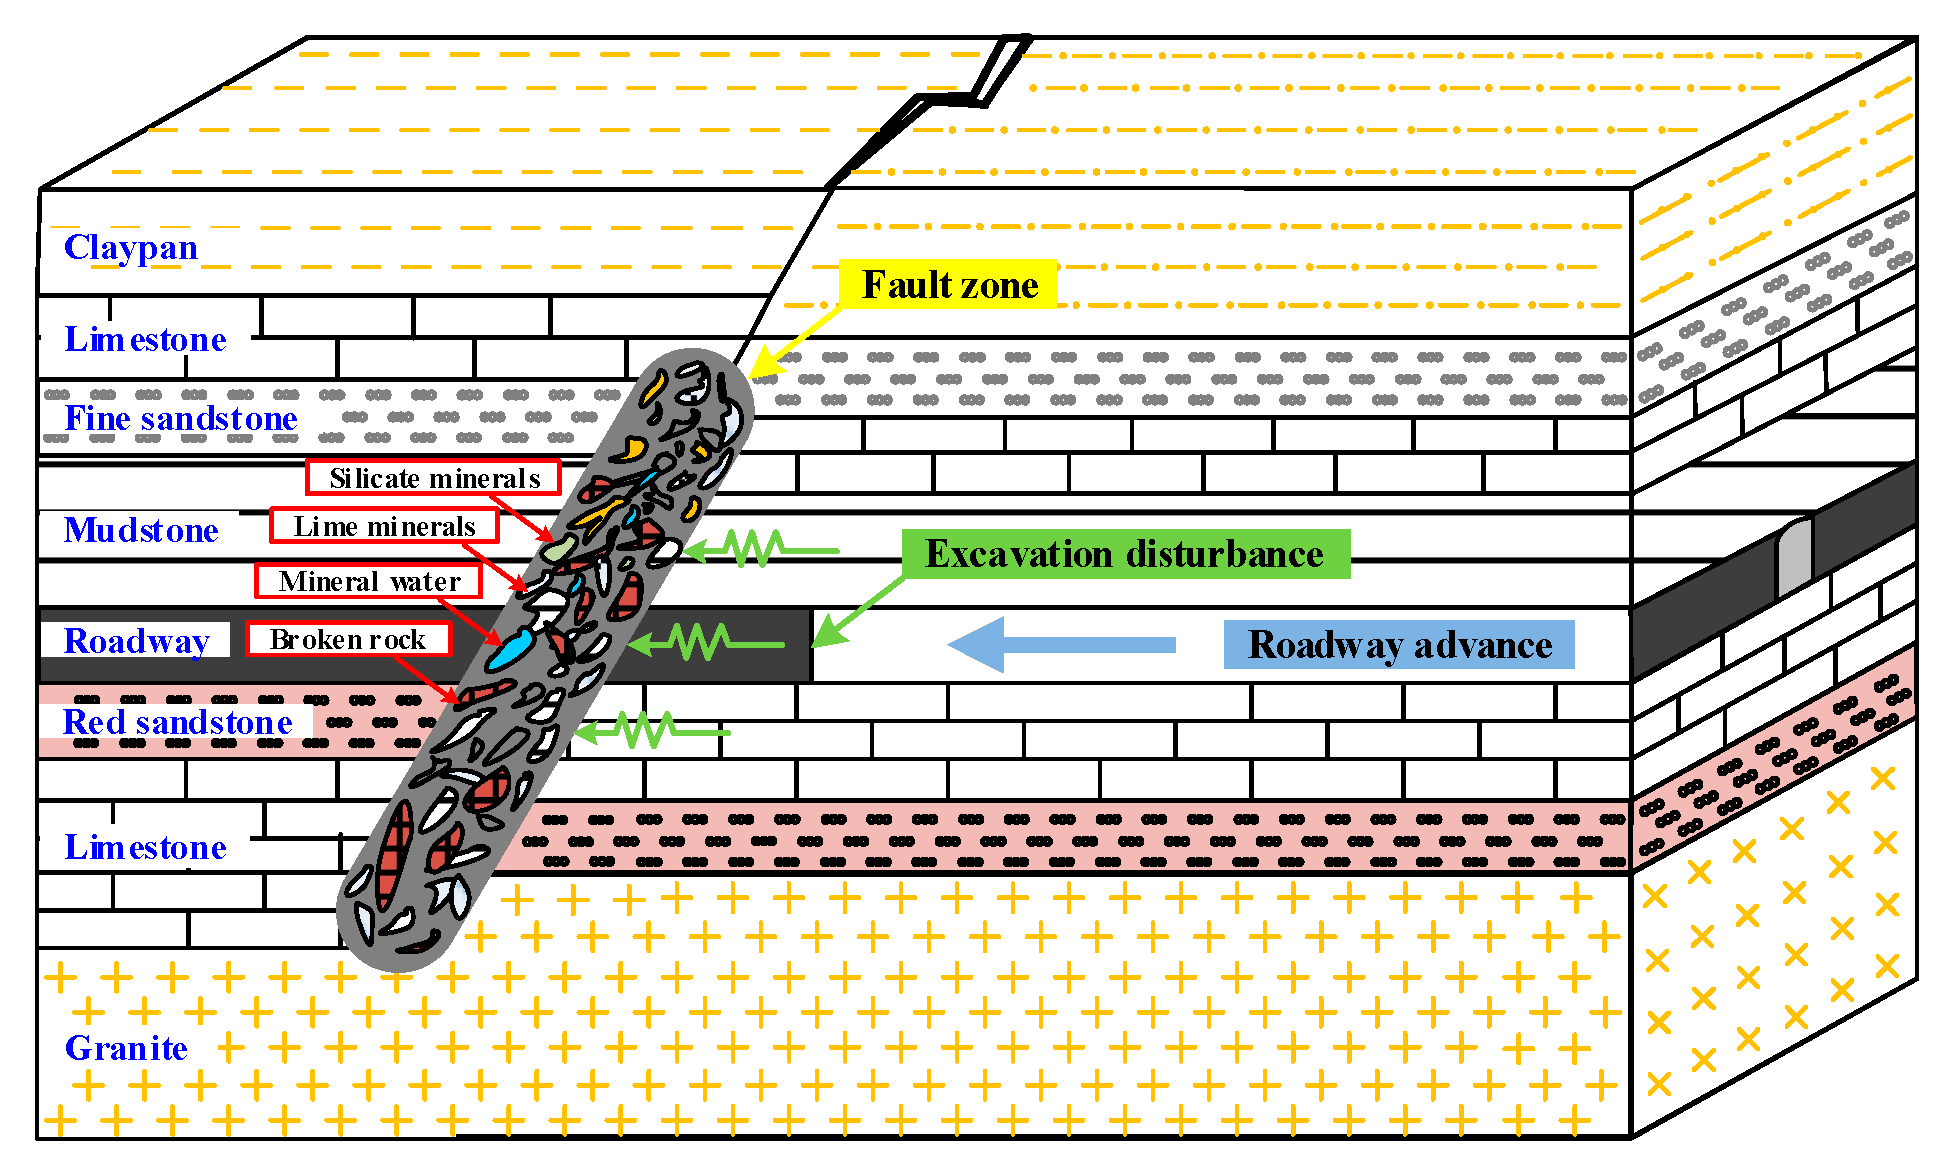
Figure 1. Cemented rock strata in fault zone: excavation for a roadway is shown, with an example of possible adjacent layering.
Mathematics 10 02078 g001
Figure 2. Sample preparation process (ae): Sieved red sandstone particles; maximum sizes in each group are 2, 3, 5, 8 and 10 mm. (f) Cementation material. (g) Specimen molds. (h) Samples for strength tests: diameter, 50 mm; height, 25 mm.
Mathematics 10 02078 g002
Figure 3. Particle size distribution (PSD) in cemented rock samples. (a) S3 series (3 component rock mixture); (b) S4 series (4 components); (c) S5 series (5 components). Mass percentages are cumulative, showing total mass below the indicated size.
Mathematics 10 02078 g003
Figure 4. Testing system: (a) equipment layout; (b) apparatus schematic.
Mathematics 10 02078 g004
Figure 5. Stress equilibrium diagram.
Mathematics 10 02078 g005
Figure 6. Dynamic stress–strain curves for different PSDs: (a) S3 series; (b) S4 series; (c) S5 series.
Mathematics 10 02078 g006
Figure 7. Dynamic stress–strain curves of S5 series samples (i.e., 5 particle size components) under different strain rates. Talbot indices for the particle size distributions are: (a) T = 0.5; (b) T = 1.0; (c) T = 2.0.
Mathematics 10 02078 g007
Figure 8. Failure and fractal nature of impact fragments of cemented rock samples for different PSDs. Original samples had Talbot indices 0.5, 1.0, and 2.0. 3-component samples.
Mathematics 10 02078 g008
Figure 9. Fractal characteristics of fragments from S3 series samples: (a) T = 0.5; (b) T = 1.0; (c) T = 2.0.
Mathematics 10 02078 g009
Figure 10. Fractal characteristics of fragments from S4 series samples.
Mathematics 10 02078 g010
Figure 11. Fractal characteristics of fragments from S5 series samples.
Mathematics 10 02078 g011
Figure 12. Failure and fractal nature of S5–1.0-I cemented rock samples under different strain rates.
Mathematics 10 02078 g012
Figure 13. Fractal characteristics of S5 series samples fragments under different strain rates: (a) T = 0.5; (b) T = 1.0; (c) T = 2.0.
Mathematics 10 02078 g013
Figure 14. Breakage behavior of rock particles: (a) broken sample after dynamic impact; (b) area 1; (c) area 2; (d) area 3.
Mathematics 10 02078 g014
Figure 15. Breakage ratio BM of cemented rock samples: (a) various PSD; (b) various strain rates.
Mathematics 10 02078 g015
Figure 16. Dynamic strength dependence on PSD (Talbot Index) and component mixture type: (a) S3 series; (b) S4 series; (c) S5 series.
Mathematics 10 02078 g016aMathematics 10 02078 g016b
Figure 17. Dynamic strength dependence on strain rate in the S5 series samples with different particle size distributions: Talbot indices (a) T = 0.5; (b) T = 1.0; (c) T = 2.0.
Mathematics 10 02078 g017
Figure 18. Dependence of the fragmentation fractal dimension on the particle size distribution (Talbot Index) and component mixture type: (a) Series 3; (b) Series 4; (c) Series 5.
Mathematics 10 02078 g018
Figure 19. Dependence of fractal dimension on strain state in the S5 series samples. Particle size distributions are represented by Talbot indices T = 0.5, 1.0, and 2.0.
Mathematics 10 02078 g019
Figure 20. Relationship between breakage ratio and fractal dimension following fragmentation. Breakage ratio BM indicates change in PSD of original rock particles. Blue curve arises from samples having different initial PSDs; red curve is from different strain rates being applied.
Mathematics 10 02078 g020
Figure 21. Relation between dynamic strength and fractal dimension following fragmentation. Constant strain rate is used, while samples have different PSDs––based on Table 2.
Mathematics 10 02078 g021
Figure 22. Relation between dynamic strength and fractal dimension: effect of strain rate. (a) T = 0.5; (b) T = 1.0; (c) T = 2.0.
Mathematics 10 02078 g022
Table 1. Experimental design for different particle size distributions (PSDs).
Sample
Number
Talbot
Index T
Particle Mass (g)Total
Mass (g)
0–2 mm2–3 mm3–5 mm5–8 mm8–10 mm
S3–0.5-I0.544.279.9515.78//70.00
S3–0.5-II/42.8712.4714.66/70.00
S3–0.5-III//49.5013.117.3970.00
S3–1.0-I1.028.0014.0028.00//70.00
S3–1.0-II/26.2517.5026.25/70.00
S3–1.0-III//35.0021.0014.0070.00
S3–2.0-I2.011.2014.0044.80//70.00
S3–2.0-II/9.8417.5042.66/70.00
S3–2.0-III//17.5027.3025.2070.00
S4–0.5-I0.535.007.8712.4714.66/70.00
S4–0.5-II/38.3411.1613.117.3970.00
S4–1.0-I1.017.508.7517.5026.25/70.00
S4–1.0-II/21.0014.0021.0014.0070.00
S4–2.0-I2.04.385.4717.5042.65/70.00
S4–2.0-II/6.3011.2027.3025.2070.00
S5–0.5-I0.531.307.0411.1613.117.3970.00
S5–1.0-I1.014.007.0014.0021.0014.0070.00
S5–2.0-I2.02.803.5011.2027.3025.2070.00
Table 2. Fractal fitting of cemented rock samples with different PSDs.
Sample No.Linear Fitting FormulaR2
S3–0.5-I L n ( M ( r < r i ) / M t ) = 0.699 L n ( r i / r max ) + 2.311 × 10 3 0.901
S3–0.5-II L n ( M ( r < r i ) / M t ) = 0.891 L n ( r i / r max ) + 3.456 × 10 4 0.913
S3–0.5-III L n ( M ( r < r i ) / M t ) = 1.473 L n ( r i / r max ) + 3.124 × 10 4 0.924
S3–1.0-I L n ( M ( r < r i ) / M t ) = 0.738 L n ( r i / r max ) + 4.747 × 10 4 0.935
S3–1.0-II L n ( M ( r < r i ) / M t ) = 1.114 L n ( r i / r max ) + 3.698 × 10 3 0.927
S3–1.0-III L n ( M ( r < r i ) / M t ) = 1.521 L n ( r i / r max ) + 7.845 × 10 4 0.906
S3–2.0-I L n ( M ( r < r i ) / M t ) = 1.284 L n ( r i / r max ) + 9.874 × 10 4 0.918
S3–2.0-II L n ( M ( r < r i ) / M t ) = 1.547 L n ( r i / r max ) + 2.311 × 10 3 0.904
S3–2.0-III L n ( M ( r < r i ) / M t ) = 1.623 L n ( r i / r max ) + 9.456 × 10 5 0.911
S4–0.5-I L n ( M ( r < r i ) / M t ) = 0.748 L n ( r i / r max ) + 6.235 × 10 4 0.935
S4–0.5-II L n ( M ( r < r i ) / M t ) = 1.112 L n ( r i / r max ) + 7.112 × 10 5 0.907
S4–1.0-I L n ( M ( r < r i ) / M t ) = 0.937 L n ( r i / r max ) + 4.789 × 10 4 0.929
S4–1.0-II L n ( M ( r < r i ) / M t ) = 1.214 L n ( r i / r max ) + 6.341 × 10 4 0.956
S4–2.0-I L n ( M ( r < r i ) / M t ) = 1.278 L n ( r i / r max ) + 6.231 × 10 5 0.919
S4–2.0-II L n ( M ( r < r i ) / M t ) = 1.438 L n ( r i / r max ) + 5.587 × 10 4 0.922
S5–0.5-I L n ( M ( r < r i ) / M t ) = 0.889 L n ( r i / r max ) + 7.654 × 10 4 0.914
S5–1.0-I L n ( M ( r < r i ) / M t ) = 1.254 L n ( r i / r max ) + 4.478 × 10 5 0.903
S5–2.0-I L n ( M ( r < r i ) / M t ) = 1.337 L n ( r i / r max ) + 6.214 × 10 4 0.917
Table 3. Fractal fitting of cemented rock samples with different strain rates.
Sample No.Strain RateLinear Fitting FormulaR2
S5–0.5-I39.5 s−1 L n ( M ( r < r i ) / M t ) = 0.937 L n ( r i / r max ) + 4.799 × 10 3 0.934
48.5 s−1 L n ( M ( r < r i ) / M t ) = 0.825 L n ( r i / r max ) + 7.245 × 10 4 0.921
55.3 s−1 L n ( M ( r < r i ) / M t ) = 0.772 L n ( r i / r max ) + 5.719 × 10 4 0.925
74.6 s−1 L n ( M ( r < r i ) / M t ) = 0.637 L n ( r i / r max ) + 8.742 × 10 5 0.902
84.9 s−1 L n ( M ( r < r i ) / M t ) = 0.511 L n ( r i / r max ) + 2.171 × 10 3 0.945
S5–1.0-I38.3 s−1 L n ( M ( r < r i ) / M t ) = 1.254 L n ( r i / r max ) + 8.445 × 10 4 0.925
47.4 s−1 L n ( M ( r < r i ) / M t ) = 1.178 L n ( r i / r max ) + 9.824 × 10 5 0.931
54.7 s−1 L n ( M ( r < r i ) / M t ) = 1.045 L n ( r i / r max ) + 6.631 × 10 3 0.951
73.9 s−1 L n ( M ( r < r i ) / M t ) = 0.928 L n ( r i / r max ) + 7.741 × 10 4 0.916
82.6 s−1 L n ( M ( r < r i ) / M t ) = 0.811 L n ( r i / r max ) + 1.123 × 10 3 0.912
S5–2.0-I37.2 s−1 L n ( M ( r < r i ) / M t ) = 1.337 L n ( r i / r max ) + 3.214 × 10 4 0.925
47.4 s−1 L n ( M ( r < r i ) / M t ) = 1.274 L n ( r i / r max ) + 6.321 × 10 4 0.933
53.8 s−1 L n ( M ( r < r i ) / M t ) = 1.105 L n ( r i / r max ) + 6.341 × 10 5 0.904
72.4 s−1 L n ( M ( r < r i ) / M t ) = 0.914 L n ( r i / r max ) + 6.539 × 10 4 0.926
80.1 s−1 L n ( M ( r < r i ) / M t ) = 0.836 L n ( r i / r max ) + 5.117 × 10 2 0.938
Publisher’s Note: MDPI stays neutral with regard to jurisdictional claims in published maps and institutional affiliations.