
Multi-Scale Tumor Localization Based on Priori Guidance-Based Segmentation Method for Osteosarcoma MRI Images


Abstract
:1. Introduction
- (1)
- The raw MRI images were processed using a priori generative algorithm. The prior generation can learn the key features of the image and make full use of the high-level features to provide clues for the final prediction. It avoids the severe degradation of model performance caused by directly using MRI raw image features.
- (2)
- We used preprocessing such as image normalization and removal of isolated bright spots to eliminate the interference of invalid areas and reduce resource waste.
- (3)
- This paper proposed a prior-guided-based MRI image segmentation method for osteosarcoma (PESNet), which adds a priori generation and feature enrichment network to effectively improve the localization accuracy and segmentation accuracy of multi-scale tumors.
- (4)
- The datasets used in this experiment were all from more than 200 real samples from the Second Xiangya Hospital. The results showed that the proposed segmentation method outperforms other methods. The prediction results of the model can be used as an auxiliary basis for doctors’ clinical diagnoses and improve the accuracy of diagnosis.
2. Related Works
3. Methods
3.1. Few-Shot
3.2. Image Segmentation of Osteosarcoma
- (1)
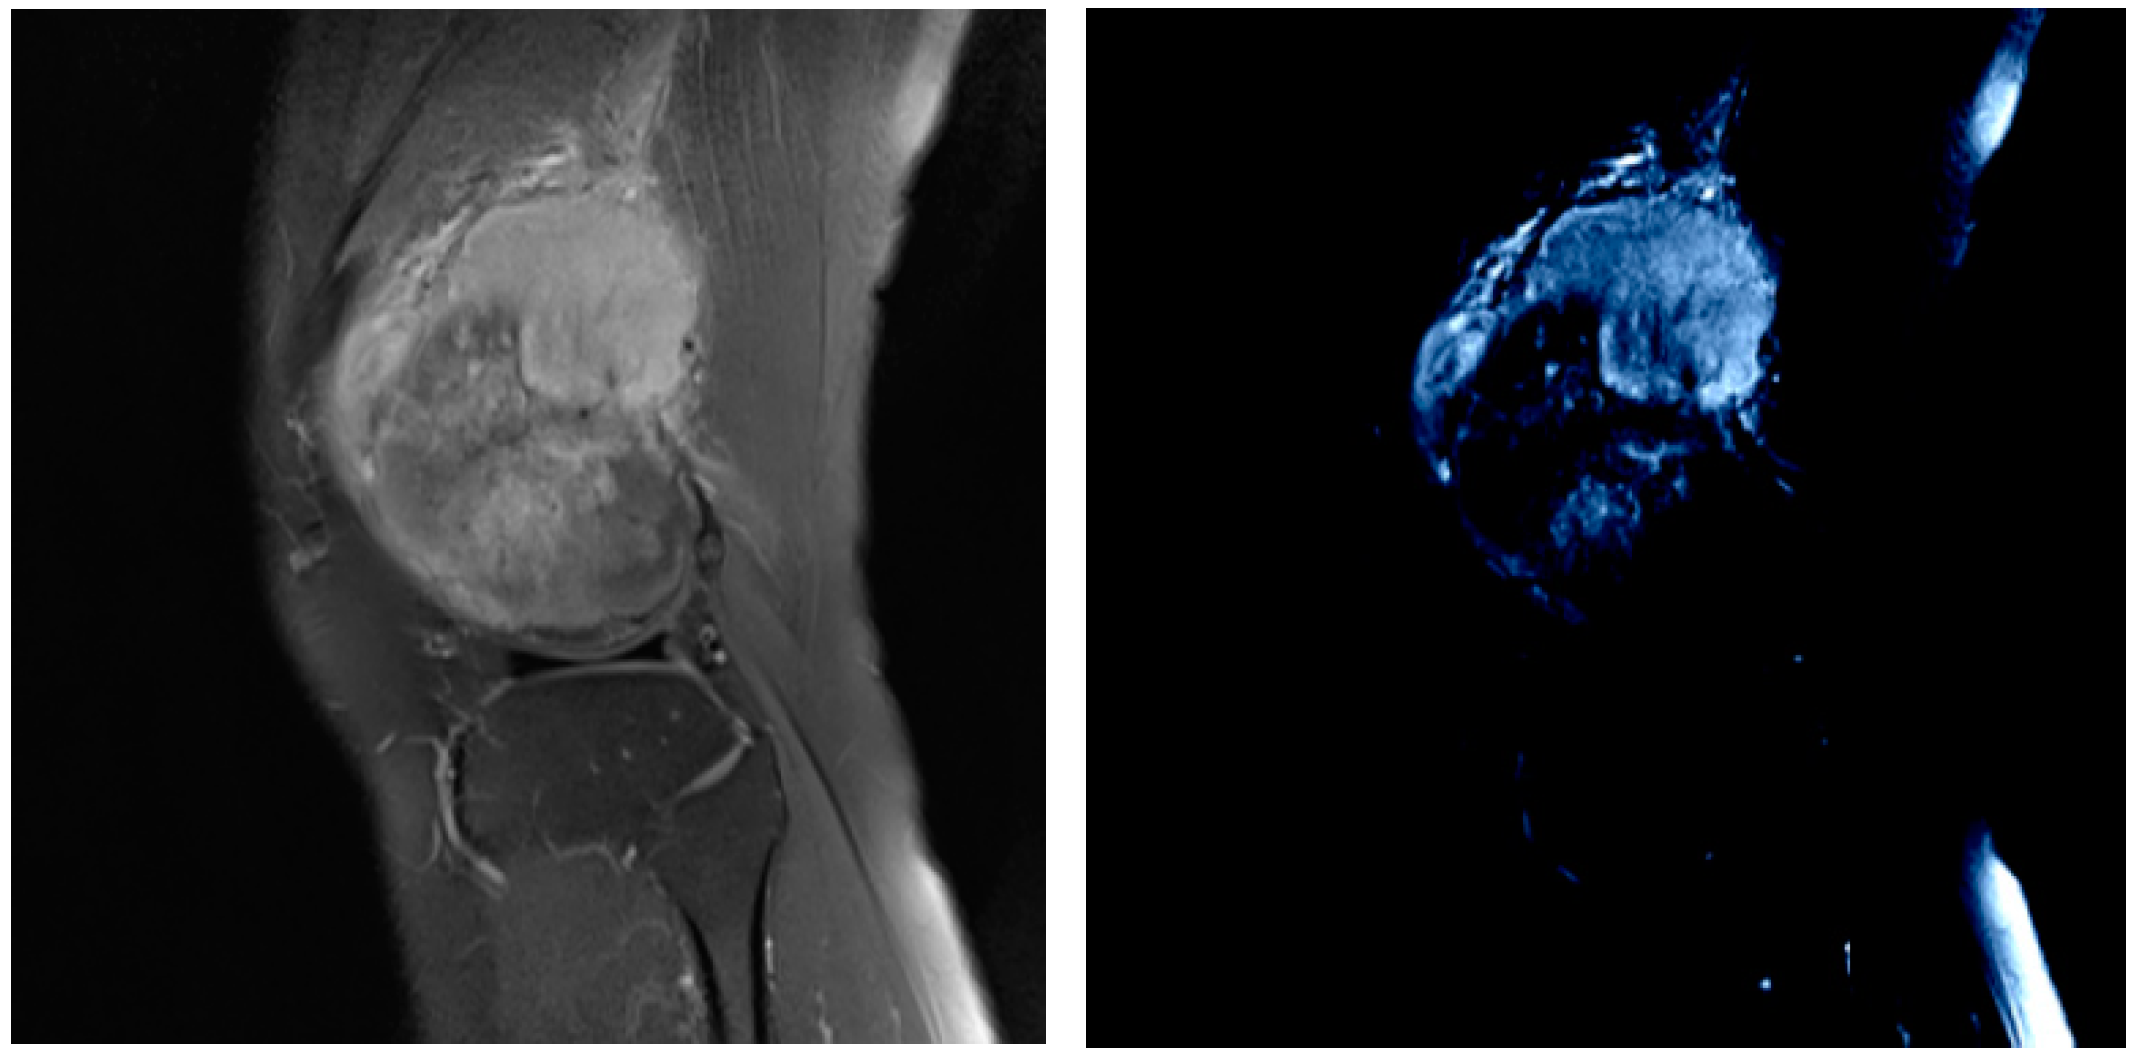
- Prior Generation. In contrast to the adverse effects of high-level features on the performance of few-shot segmentation, prior segmentation frameworks use these features to provide semantic cues for the final prediction. We performed prior generation processing on MRI images of osteosarcoma to reduce the interference of invalid active segmentation regions on the final prediction, thereby improving the efficiency of image processing.
- (2)
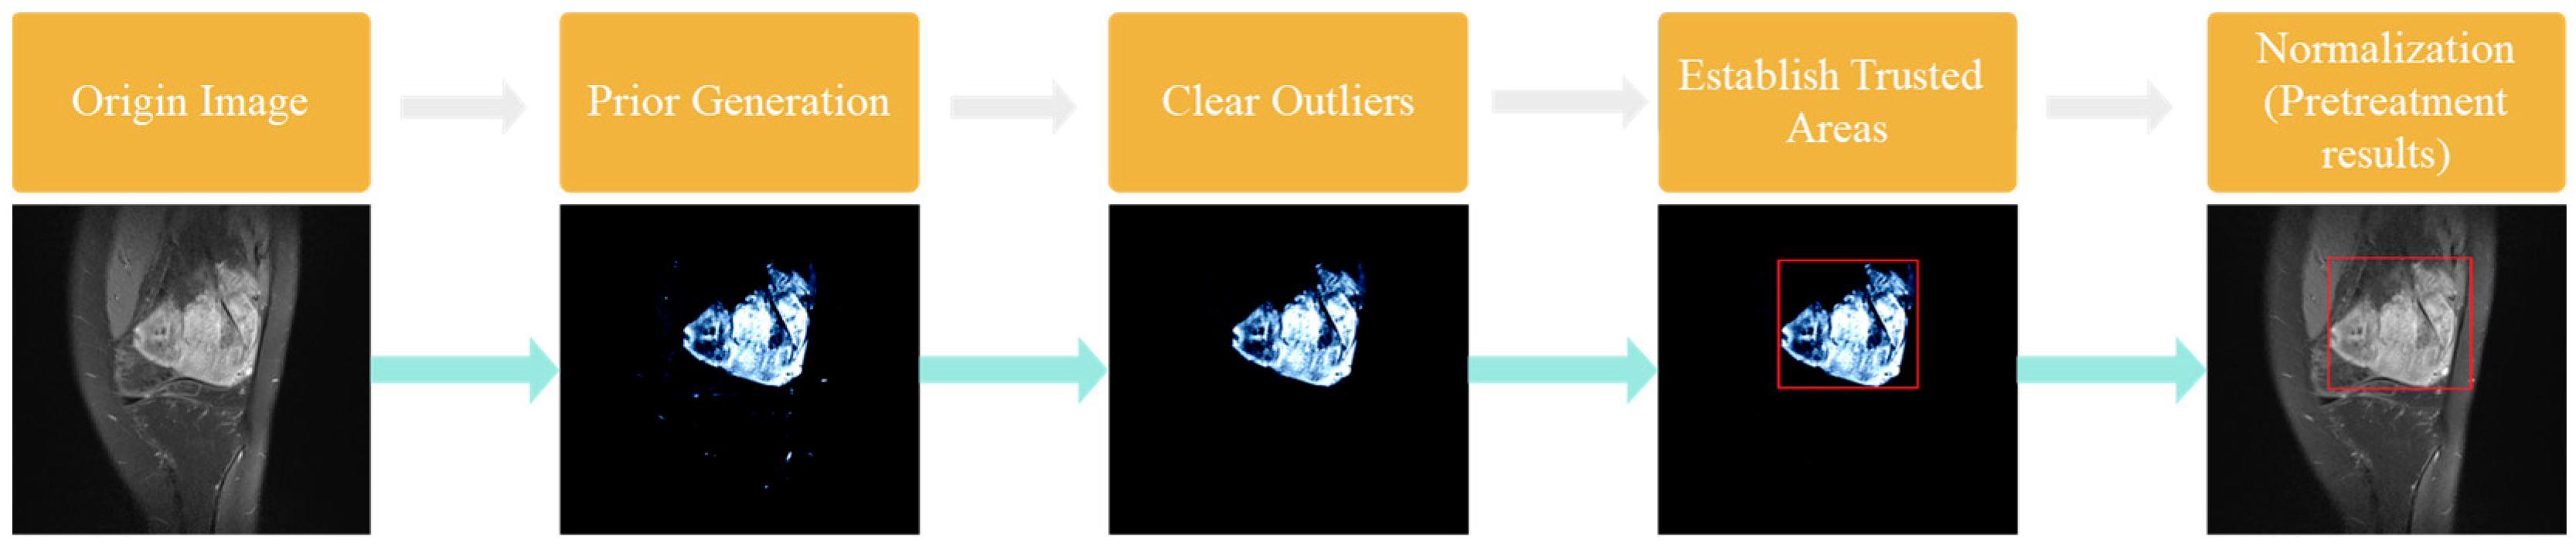
- Pretreatment. We further preprocessed the MRI image generated after prior generation, and processed the mask and prior generation results respectively by deleting isolated highlights and the normalization algorithm to speed up model training and save computing resources.
- (3)
- Image analysis and segmentation. The segmentation model in this paper is a feature enrichment network based on prior guidance. When training the model, the MRI image of osteosarcoma and its preprocessed mask were input into the network to confirm loss function, and the error segmentation rate of the osteosarcoma image was reduced through repeated training.
3.2.1. Prior Generation
3.2.2. Data Preprocessing
- (1)
- Delete isolated highlights
- (2)
- Determine the trusted region
- (3)
- Normalization
3.2.3. Image Analysis and Segmentation
- (1)
- Inter-source enrichment: It mainly maps osteosarcoma MRI images to different scales, and then interacts with the query, support features, and prior masks of the model.
- (2)
- Inter-scale interaction: It mainly transfers information between some features of different scales.
- (3)
- Information concentration: It combines features of different scales, eventually generating refined query features, providing a basis for determining the final region and location of the tumor query features.
4. Experiments and Results
4.1. The Evaluation Index
4.2. Training Strategy
4.3. Segmentation Effect Evaluation
5. Conclusions
Author Contributions
Funding
Institutional Review Board Statement
Informed Consent Statement
Data Availability Statement
Conflicts of Interest
References
- Gill, J.; Gorlick, R. Advancing therapy for osteosarcoma. Nat. Rev. Clin. Oncol. 2021, 18, 609–624. [Google Scholar] [CrossRef] [PubMed]
- Ouyang, T.; Yang, S.; Gou, F.; Dai, Z.; Wu, J. Rethinking U-Net from an Attention Perspective with Transformers for Osteosarcoma MRI Image Segmentation. Comput. Intell. Neurosci. 2022, 2022, 7973404. [Google Scholar] [CrossRef]
- Nie, X.; Fu, W.; Li, C.; Lu, L.; Li, W. Primary extraskeletal osteosarcoma of sigmoid mesocolon: A case report and a review of the literature. World J. Surg. Oncol. 2021, 19, 267. [Google Scholar] [CrossRef] [PubMed]
- Yu, G.; Chen, Z.; Wu, J.; Tan, Y. Medical decision support system for cancer treatment in precision medicine in developing countries. Expert Syst. Appl. 2021, 186, 115725. [Google Scholar] [CrossRef]
- Mazumder, D. A novel approach to IoT based health status monitoring of COVID-19 patient. In Proceedings of the International Conference on Science & Contemporary Technologies (ICSCT), Dhaka, Bangladesh, 5–7 August 2021; pp. 1–4. [Google Scholar] [CrossRef]
- Wu, J.; Gou, F.; Tan, Y. A staging auxiliary diagnosis model for non-small cell lung cancer based the on intelligent medical system. Comput. Math. Methods Med. 2021, 2021, 6654946. [Google Scholar] [CrossRef]
- Cui, R.; Chen, Z.; Wu, J.; Tan, Y.; Yu, G. A Multiprocessing Scheme for PET Image Pre-Screening, Noise Reduction, Segmentation and Lesion Partitioning. IEEE J. Biomed. Health Inform. 2020, 25, 1699–1711. [Google Scholar] [CrossRef]
- Zhan, X.; Long, H.; Gou, F.; Duan, X.; Kong, G.; Wu, J. A Convolutional Neural Network-Based Intelligent Medical System with Sensors for Assistive Diagnosis and Decision-Making in Non-Small Cell Lung Cancer. Sensors 2021, 21, 7996. [Google Scholar] [CrossRef]
- Wang, M.; Pan, C.; Ray, P.K. Technology Entrepreneurship in Developing Countries: Role of Telepresence Robots in Healthcare. IEEE Eng. Manag. Rev. 2021, 49, 20–26. [Google Scholar] [CrossRef]
- Wu, J.; Xia, J.; Gou, F. Information transmission mode and IoT community reconstruction based on user influence in opportunistic social networks. Peer-to-Peer Netw. Appl. 2022, 15, 1398–1416. [Google Scholar] [CrossRef]
- Chu, L.-H.; Lai, H.-C.; Liao, Y.-T. Ovarian mucinous cystadenoma with a mural nodule of osteosarcoma: A case report. Taiwan. J. Obstet. Gynecol. 2021, 60, 136–138. [Google Scholar] [CrossRef]
- Zhuang, Q.; Dai, Z.; Wu, J. Deep Active Learning Framework for Lymph Node Metastasis Prediction in Medical Support System. Comput. Intell. Neurosci. 2022, 2022, 4601696. [Google Scholar] [CrossRef] [PubMed]
- Demofonti, A.; Carpino, G.; Zollo, L.; Johnson, M.J. Affordable Robotics for Upper Limb Stroke Rehabilitation in Developing Countries: A Systematic Review. IEEE Trans. Med. Robot. Bionics 2021, 3, 11–20. [Google Scholar] [CrossRef]
- Gou, F.; Wu, J. Message Transmission Strategy Based on Recurrent Neural Network and Attention Mechanism in IoT System. J. Circ. Syst. Comput. 2022, 31, 2250126. [Google Scholar] [CrossRef]
- Li, L.; Gou, F.; Wu, J. Modified Data Delivery Strategy Based on Stochastic Block Model and Community Detection in Opportunistic Social Networks. Wirel. Commun. Mob. Comput. 2022, 2022, 5067849. [Google Scholar] [CrossRef]
- Chang, L.; Wu, J.; Moustafa, N.; Bashir, A.K.; Yu, K. AI-Driven Synthetic Biology for Non-Small Cell Lung Cancer Drug Effectiveness-Cost Analysis in Intelligent Assisted Medical Systems. IEEE J. Biomed. Health Inform. 2021, 1–12. [Google Scholar] [CrossRef] [PubMed]
- Hedström, M.; Skolin, I.; von Essen, L. Distressing and positive experiences and important aspects of care for adolescents treated for cancer. Adolescent and nurse perceptions. Eur. J. Oncol. Nurs. 2004, 8, 6–17. [Google Scholar] [CrossRef]
- Georgeanu, V.; Mamuleanu, M.-L.; Selisteanu, D. Convolutional Neural Networks for Automated Detection and Classification of Bone Tumors in Magnetic Resonance Imaging. In Proceedings of the 2021 IEEE International Conference on Artificial Intelligence, Robotics, and Communication (ICAIRC), Fuzhou, China, 25–27 June 2021; pp. 5–7. [Google Scholar] [CrossRef]
- Yu, G.; Chen, Z.; Wu, J.; Tan, Y. A diagnostic prediction framework on auxiliary medical system for breast cancer in developing countries. Knowl.-Based Syst. 2021, 232, 107459. [Google Scholar] [CrossRef]
- Pang, S.; Pang, C.; Zhao, L.; Chen, Y.; Su, Z.; Zhou, Y.; Huang, M.; Yang, W.; Lu, H.; Feng, Q. SpineParseNet: Spine Parsing for Volumetric MR Image by a Two-Stage Segmentation Framework with Semantic Image Representation. IEEE Trans. Med. Imaging 2020, 40, 262–273. [Google Scholar] [CrossRef]
- Gu, R.; Wang, G.; Song, T.; Huang, R.; Aertsen, M.; Deprest, J.; Ourselin, S.; Vercauteren, T.; Zhang, S. CA-Net: Comprehensive Attention Convolutional Neural Networks for Explainable Medical Image Segmentation. IEEE Trans. Med. Imaging 2020, 40, 699–711. [Google Scholar] [CrossRef]
- Wu, J.; Chen, Z.; Zhao, M. An efficient data packet iteration and transmission algorithm in opportunistic social networks. J. Ambient Intell. Humaniz. Comput. 2019, 11, 3141–3153. [Google Scholar] [CrossRef]
- Chen, L.; Bentley, P.; Mori, K.; Misawa, K.; Fujiwara, M.; Rueckert, D. DRINet for Medical Image Segmentation. IEEE Trans. Med. Imaging 2018, 37, 2453–2462. [Google Scholar] [CrossRef] [PubMed]
- Oksuz, I.; Clough, J.R.; Ruijsink, B.; Anton, E.P.; Bustin, A.; Cruz, G.; Prieto, C.; King, A.P.; Schnabel, J.A. Deep Learning-Based Detection and Correction of Cardiac MR Motion Artefacts During Reconstruction for High-Quality Segmentation. IEEE Trans. Med. Imaging 2020, 39, 4001–4010. [Google Scholar] [CrossRef] [PubMed]
- Tian, X.; Yan, L.; Jiang, L.; Xiang, G.; Li, G.; Zhu, L.; Wu, J. Comparative transcriptome analysis of leaf, stem, and root tissues of Semiliquidambar cathayensis reveals candidate genes involved in terpenoid biosynthesis. Mol. Biol. Rep. 2022. [Google Scholar] [CrossRef] [PubMed]
- Gou, F.; Wu, J. Triad link prediction method based on the evolutionary analysis with IoT in opportunistic social networks. Comput. Commun. 2021, 181, 143–155. [Google Scholar] [CrossRef]
- Wu, J.; Chang, L.; Yu, G. Effective Data Decision-Making and Transmission System Based on Mobile Health for Chronic Disease Management in the Elderly. IEEE Syst. J. 2020, 15, 5537–5548. [Google Scholar] [CrossRef]
- Gao, W.; Veeresha, P.; Cattani, C.; Baishya, C.; Baskonus, H.M. Modified Predictor–Corrector Method for the Numerical Solution of a Fractional-Order SIR Model with 2019-nCoV. Fractal Fract. 2022, 6, 92. [Google Scholar] [CrossRef]
- Srinivasa, K.; Baskonus, H.M.; Guerrero Sánchez, Y. Numerical Solutions of the Mathematical Models on the Digestive System and COVID-19 Pandemic by Hermite Wavelet Technique. Symmetry 2021, 13, 2428. [Google Scholar] [CrossRef]
- Gao, W.; Baskonus, H.M. Deeper investigation of modified epidemiological computer virus model containing the Caputo operator. Chaos Solitons Fractals 2022, 158, 112050. [Google Scholar] [CrossRef]
- Veeresha, P.; Ilhan, E.; Prakasha, D.; Baskonus, H.M.; Gao, W. Regarding on the fractional mathematical model of Tumour invasion and metastasis. Comput. Model. Eng. Sci. 2021, 127, 1013–1036. [Google Scholar] [CrossRef]
- Shen, T.; Wang, Y. Medical image segmentation based on improved watershed algorithm. In Proceedings of the 2018 IEEE 3rd Advanced Information Technology, Electronic and Automation Control Conference (IAEAC), Chongqing, China, 12–14 October 2018; pp. 1695–1698. [Google Scholar] [CrossRef]
- Sanaat, A.; Shiri, I.; Arabi, H.; Mainta, I.; Nkoulou, R.; Zaidi, H. Whole-body PET Image Synthesis from Low-Dose Images Using Cycle-consistent Generative Adversarial Networks. In Proceedings of the 2020 IEEE Nuclear Science Symposium and Medical Imaging Conference (NSS/MIC), Boston, MA, USA, 31 October–7 November 2020; pp. 1–3. [Google Scholar] [CrossRef]
- Panayides, A.S.; Amini, A.; Filipovic, N.D.; Sharma, A.; Tsaftaris, S.A.; Young, A.A.; Foran, D.J.; Do, N.V.; Golemati, S.; Kurc, T.; et al. AI in Medical Imaging Informatics: Current Challenges and Future Directions. IEEE J. Biomed. Health Inform. 2020, 24, 1837–1857. [Google Scholar] [CrossRef]
- Duan, J.; Bello, G.; Schlemper, J.; Bai, W.; Dawes, T.J.W.; Biffi, C.; de Marvao, A.; Doumoud, G.; O’Regan, D.P.; Rueckert, D. Automatic 3D Bi-Ventricular Segmentation of Cardiac Images by a Shape-Refined Multi-Task Deep Learning Approach. IEEE Trans. Med. Imaging 2019, 38, 2151–2164. [Google Scholar] [CrossRef] [PubMed]
- Aganj, I.; Fischl, B. Multi-Atlas Image Soft Segmentation via Computation of the Expected Label Value. IEEE Trans. Med. Imaging 2021, 40, 1702–1710. [Google Scholar] [CrossRef] [PubMed]
- Xu, Y.; Xu, K.; Wan, J.; Xiong, Z.; Li, Y. Research on Particle Filter Tracking Method Based on Kalman Filter. In Proceedings of the 2018 2nd IEEE Advanced Information Management, Communicates, Electronic and Automation Control Conference (IMCEC), Xi’an, China, 25–27 May 2018; pp. 1564–1568. [Google Scholar] [CrossRef]
- Corli, A.; Malaguti, L.; Sovrano, E. Wavefront Solutions to Reaction-Convection Equations with Perona-Malik Diffusion. J. Differ. Equ. 2022, 308, 474–506. [Google Scholar] [CrossRef]
- Jafari, M.; Auer, D.; Francis, S.; Garibaldi, J.; Chen, X. DRU-Net: An Efficient Deep Convolutional Neural Network for Medical Image Segmentation. In Proceedings of the 2020 IEEE 17th International Symposium on Biomedical Imaging (ISBI), Iowa City, IA, USA, 3–7 April 2020; pp. 1144–1148. [Google Scholar] [CrossRef]
- Zhang, W.; Jia, J.; Zhang, J.; Ding, Y.; Zhang, J.; Lu, K.; Mao, S. Pyrolysis and Combustion Characteristics of Typical Waste Thermal Insulation Materials. Sci. Total Environ. 2022, 834, 155484. [Google Scholar] [CrossRef]
- Nasor, M.; Obaid, W. Segmentation of osteosarcoma in MRI images by K-means clustering, Chan-Vese segmentation, and iterative Gaussian filtering. IET Image Process. 2020, 15, 1310–1318. [Google Scholar] [CrossRef]
- Ho, D.J.; Agaram, N.P.; Schüffler, P.J.; Vanderbilt, C.M.; Jean, M.-H.; Hameed, M.R.; Fuchs, T.J. Deep interactive learning: An efficient labeling approach for deep learning-based osteosarcoma treatment response assessment. arXiv 2020, arXiv:2007.01383. [Google Scholar]
- Huang, W.-B.; Wen, D.; Yan, Y.; Yuan, M.; Wang, K. Multi-target osteosarcoma MRI recognition with texture context features based on CRF. In Proceedings of the 2016 International Joint Conference on Neural Networks (IJCNN), Vancouver, BC, Canada, 24–29 July 2016; pp. 3978–3983. [Google Scholar]
- Pang, S.; Feng, Q.; Lu, Z.; Jiang, J.; Zhao, L.; Lin, L.; Li, X.; Lian, T.; Huang, M.; Yang, W. Hippocampus Segmentation Based on Iterative Local Linear Mapping with Representative and Local Structure-Preserved Feature Embedding. IEEE Trans. Med. Imaging 2019, 38, 2271–2280. [Google Scholar] [CrossRef]
- Jin, J.; Song, M.H.; Kim, S.D.; Jin, D. Mask R-CNN Models to Purify Medical Images of Training Sets. In Proceedings of the 2021 International Conference on e-Health and Bioengineering (EHB), Iasi, Romania, 18–19 November 2021; pp. 1–4. [Google Scholar] [CrossRef]
- Chen, S.; Hu, G.; Sun, J. Medical Image Segmentation Based on 3D U-net. In Proceedings of the 2020 19th International Symposium on Distributed Computing and Applications for Business Engineering and Science (DCABES), Xuzhou, China, 16–19 October 2020; pp. 130–133. [Google Scholar] [CrossRef]
- Wu, J.; Gou, F.; Tian, X. Disease Control and Prevention in Rare Plants Based on the Dominant Population Selection Method in Opportunistic Social Networks. Comput. Intell. Neurosci. 2022, 2022, 1489988. [Google Scholar] [CrossRef]
- Shen, Y.; Gou, F.; Wu, J. Node Screening Method Based on Federated Learning with IoT in Opportunistic Social Networks. Mathematics 2022, 10, 1669. [Google Scholar] [CrossRef]
- Yu, G.; Wu, J. Efficacy prediction based on attribute and multi-source data collaborative for auxiliary medical system in developing countries. Neural Comput. Appl. 2022, 34, 5497–5512. [Google Scholar] [CrossRef]
- Chen, T.; Hu, X.; Xiao, J.; Zhang, G.; Ruan, H. Canet: Context-Aware Loss for Descriptor Learning. In Proceedings of the ICASSP 2021—2021 IEEE International Conference on Acoustics, Speech and Signal Processing (ICASSP), Toronto, ON, Canada, 6–11 June 2021; pp. 2760–2764. [Google Scholar] [CrossRef]
- Deng, Y.; Gou, F.; Wu, J. Hybrid data transmission scheme based on source node centrality and community reconstruction in opportunistic social networks. Peer-to-Peer Netw. Appl. 2021, 14, 3460–3472. [Google Scholar] [CrossRef]
- Wu, J.; Gou, F.; Xiong, W.; Zhou, X. A Reputation Value-Based Task-Sharing Strategy in Opportunistic Complex Social Networks. Complexity 2021, 2021, 8554351. [Google Scholar] [CrossRef]
- Wu, J.; Tian, X.; Tan, Y. Hospital evaluation mechanism based on mobile health for IoT system in social networks. Comput. Biol. Med. 2019, 109, 138–147. [Google Scholar] [CrossRef] [PubMed]
- Liu, F.; Gou, F.; Wu, J. An Attention-Preserving Network-Based Method for Assisted Segmentation of Osteosarcoma MRI Images. Mathematics 2022, 10, 1665. [Google Scholar] [CrossRef]
- Wu, J.; Yang, S.; Gou, F.; Zhou, Z.; Xie, P.; Xu, N.; Dai, Z. Intelligent Segmentation Medical Assistance System for MRI Images of osteosarcoma in Developing Countries. Comput. Math. Methods Med. 2022, 2022, 6654946. [Google Scholar] [CrossRef]
- Shen, Y.; Gou, F.; Dai, Z. Osteosarcoma MRI Image-Assisted Segmentation System Base on Guided Aggregated Bilateral Network. Mathematics 2022, 10, 1090. [Google Scholar] [CrossRef]
- Wu, J.; Zhuang, Q.; Tan, Y. Auxiliary medical decision system for prostate cancer based on ensemble method. Comput. Math. Methods Med. 2020, 2020, 6509596. [Google Scholar] [CrossRef]
- Huang, L.; Xia, W.; Zhang, B.; Qiu, B.; Gao, X. MSFCN-multiple supervised fully convolutional networks for the osteosarcoma segmentation of CT images. Comput. Methods Programs Biomed. 2017, 143, 67–74. [Google Scholar] [CrossRef]
- Zhang, R.; Huang, L.; Xia, W.; Zhang, B.; Qiu, B.; Gao, X. Multiple supervised residual network for osteosarcoma segmentation in CT images. Comput. Med. Imaging Graph. 2018, 63, 1–8. [Google Scholar] [CrossRef]
- Long, J.; Shelhamer, E.; Darrell, T. Fully convolutional networks for semantic segmentation. In Proceedings of the IEEE Conference on Computer Vision and Pattern Recognition, Boston, MA, USA, 7–12 June 2015; pp. 3431–3440. [Google Scholar]
- Lin, T.Y.; Dollár, P.; Girshick, R.; He, K.; Hariharan, B.; Belongie, S. Feature pyramid networks for object detection. In Proceedings of the IEEE Conference on Computer Vision and Pattern Recognition, Honolulu, HI, USA, 21–26 July 2017; pp. 2117–2125. [Google Scholar] [CrossRef] [Green Version]
- Ronneberger, O.; Fischer, P.; Brox, T. U-net: Convolutional networks for biomedical image segmentation. In MICCAI 2015, Proceedings of the International Conference on Medical Image Computing and Computer-Assisted Intervention, Munich, Germany, 5–9 October 2015; Springer: Cham, Switzerland, 2015; pp. 234–241. [Google Scholar] [CrossRef] [Green Version]


| Symbol | Paraphrase |
|---|---|
| si | The i-th support set |
| qi | The i-th query set |
| S, Q | Origin data set |
| IQ | The query image |
| Cn | The unknown class |
| Ct | The test class |
| A = {IQ, MQ} | Query sample set |
| MQ | Query the Mask of the set |
| XQ, XS | Original query feature |
| B = [B1, B2, ..., Bn] | Average n different space sizes of the pool |
| XQFEM | Subquery feature |
| L1i | Loss value |
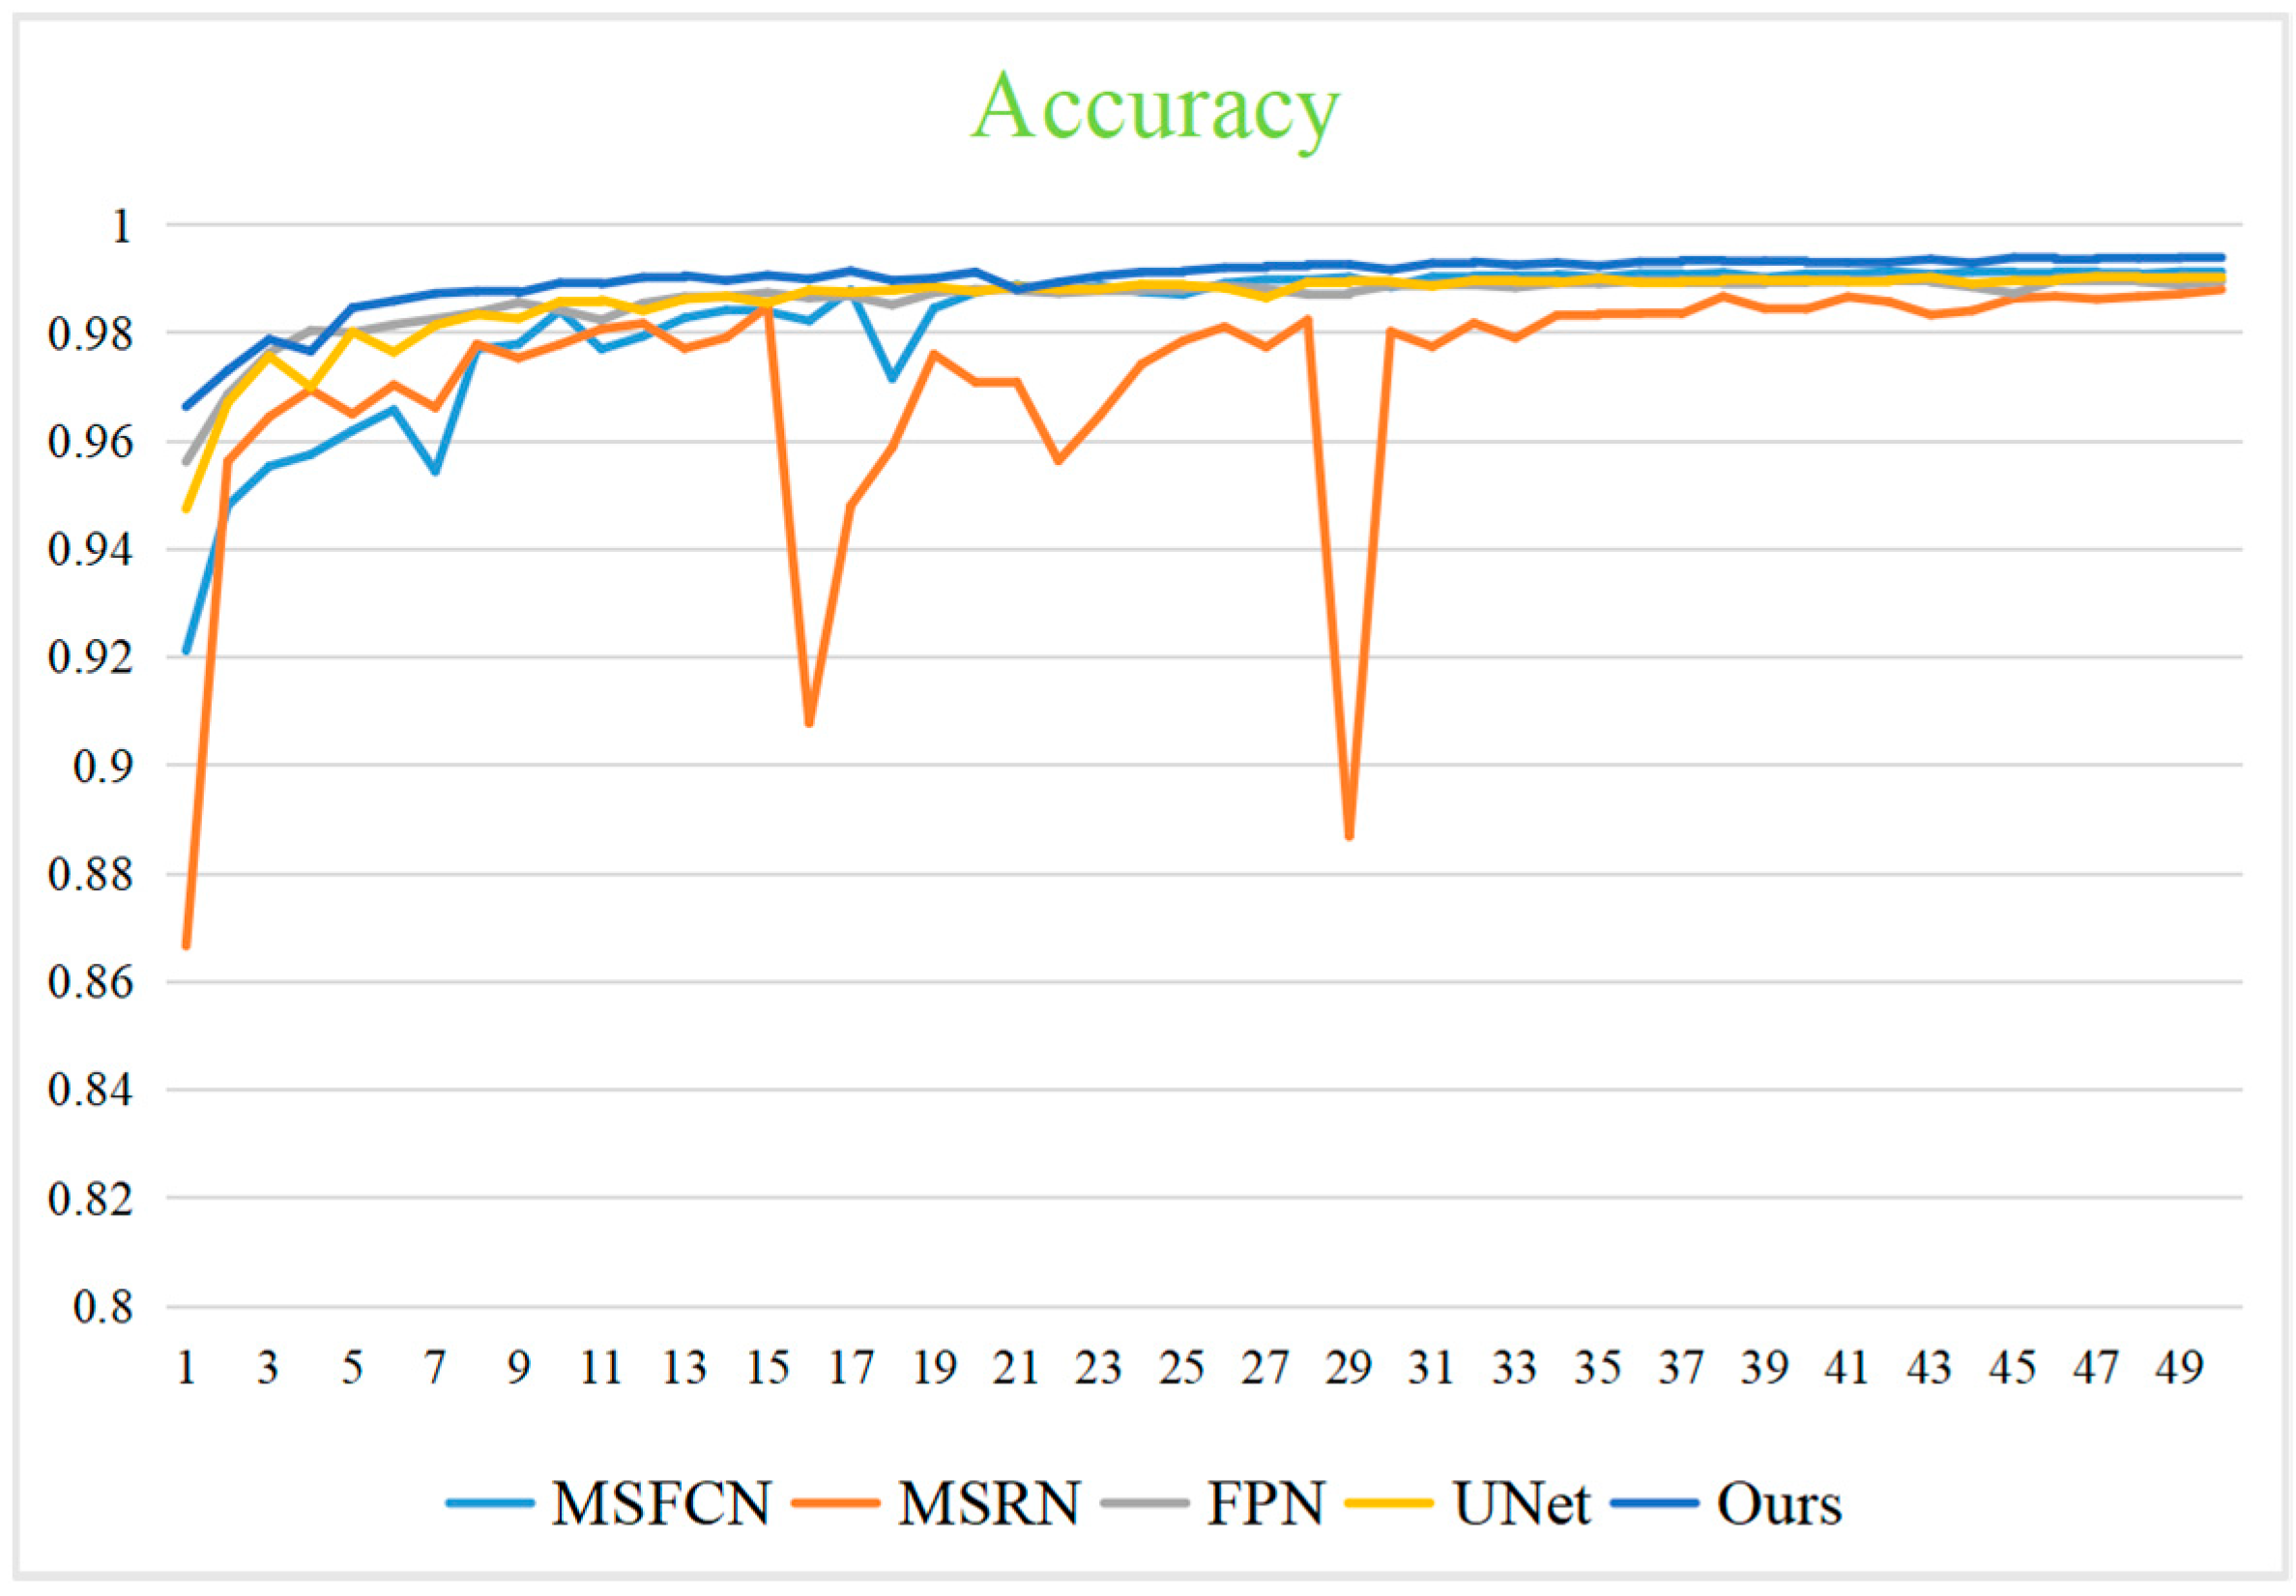
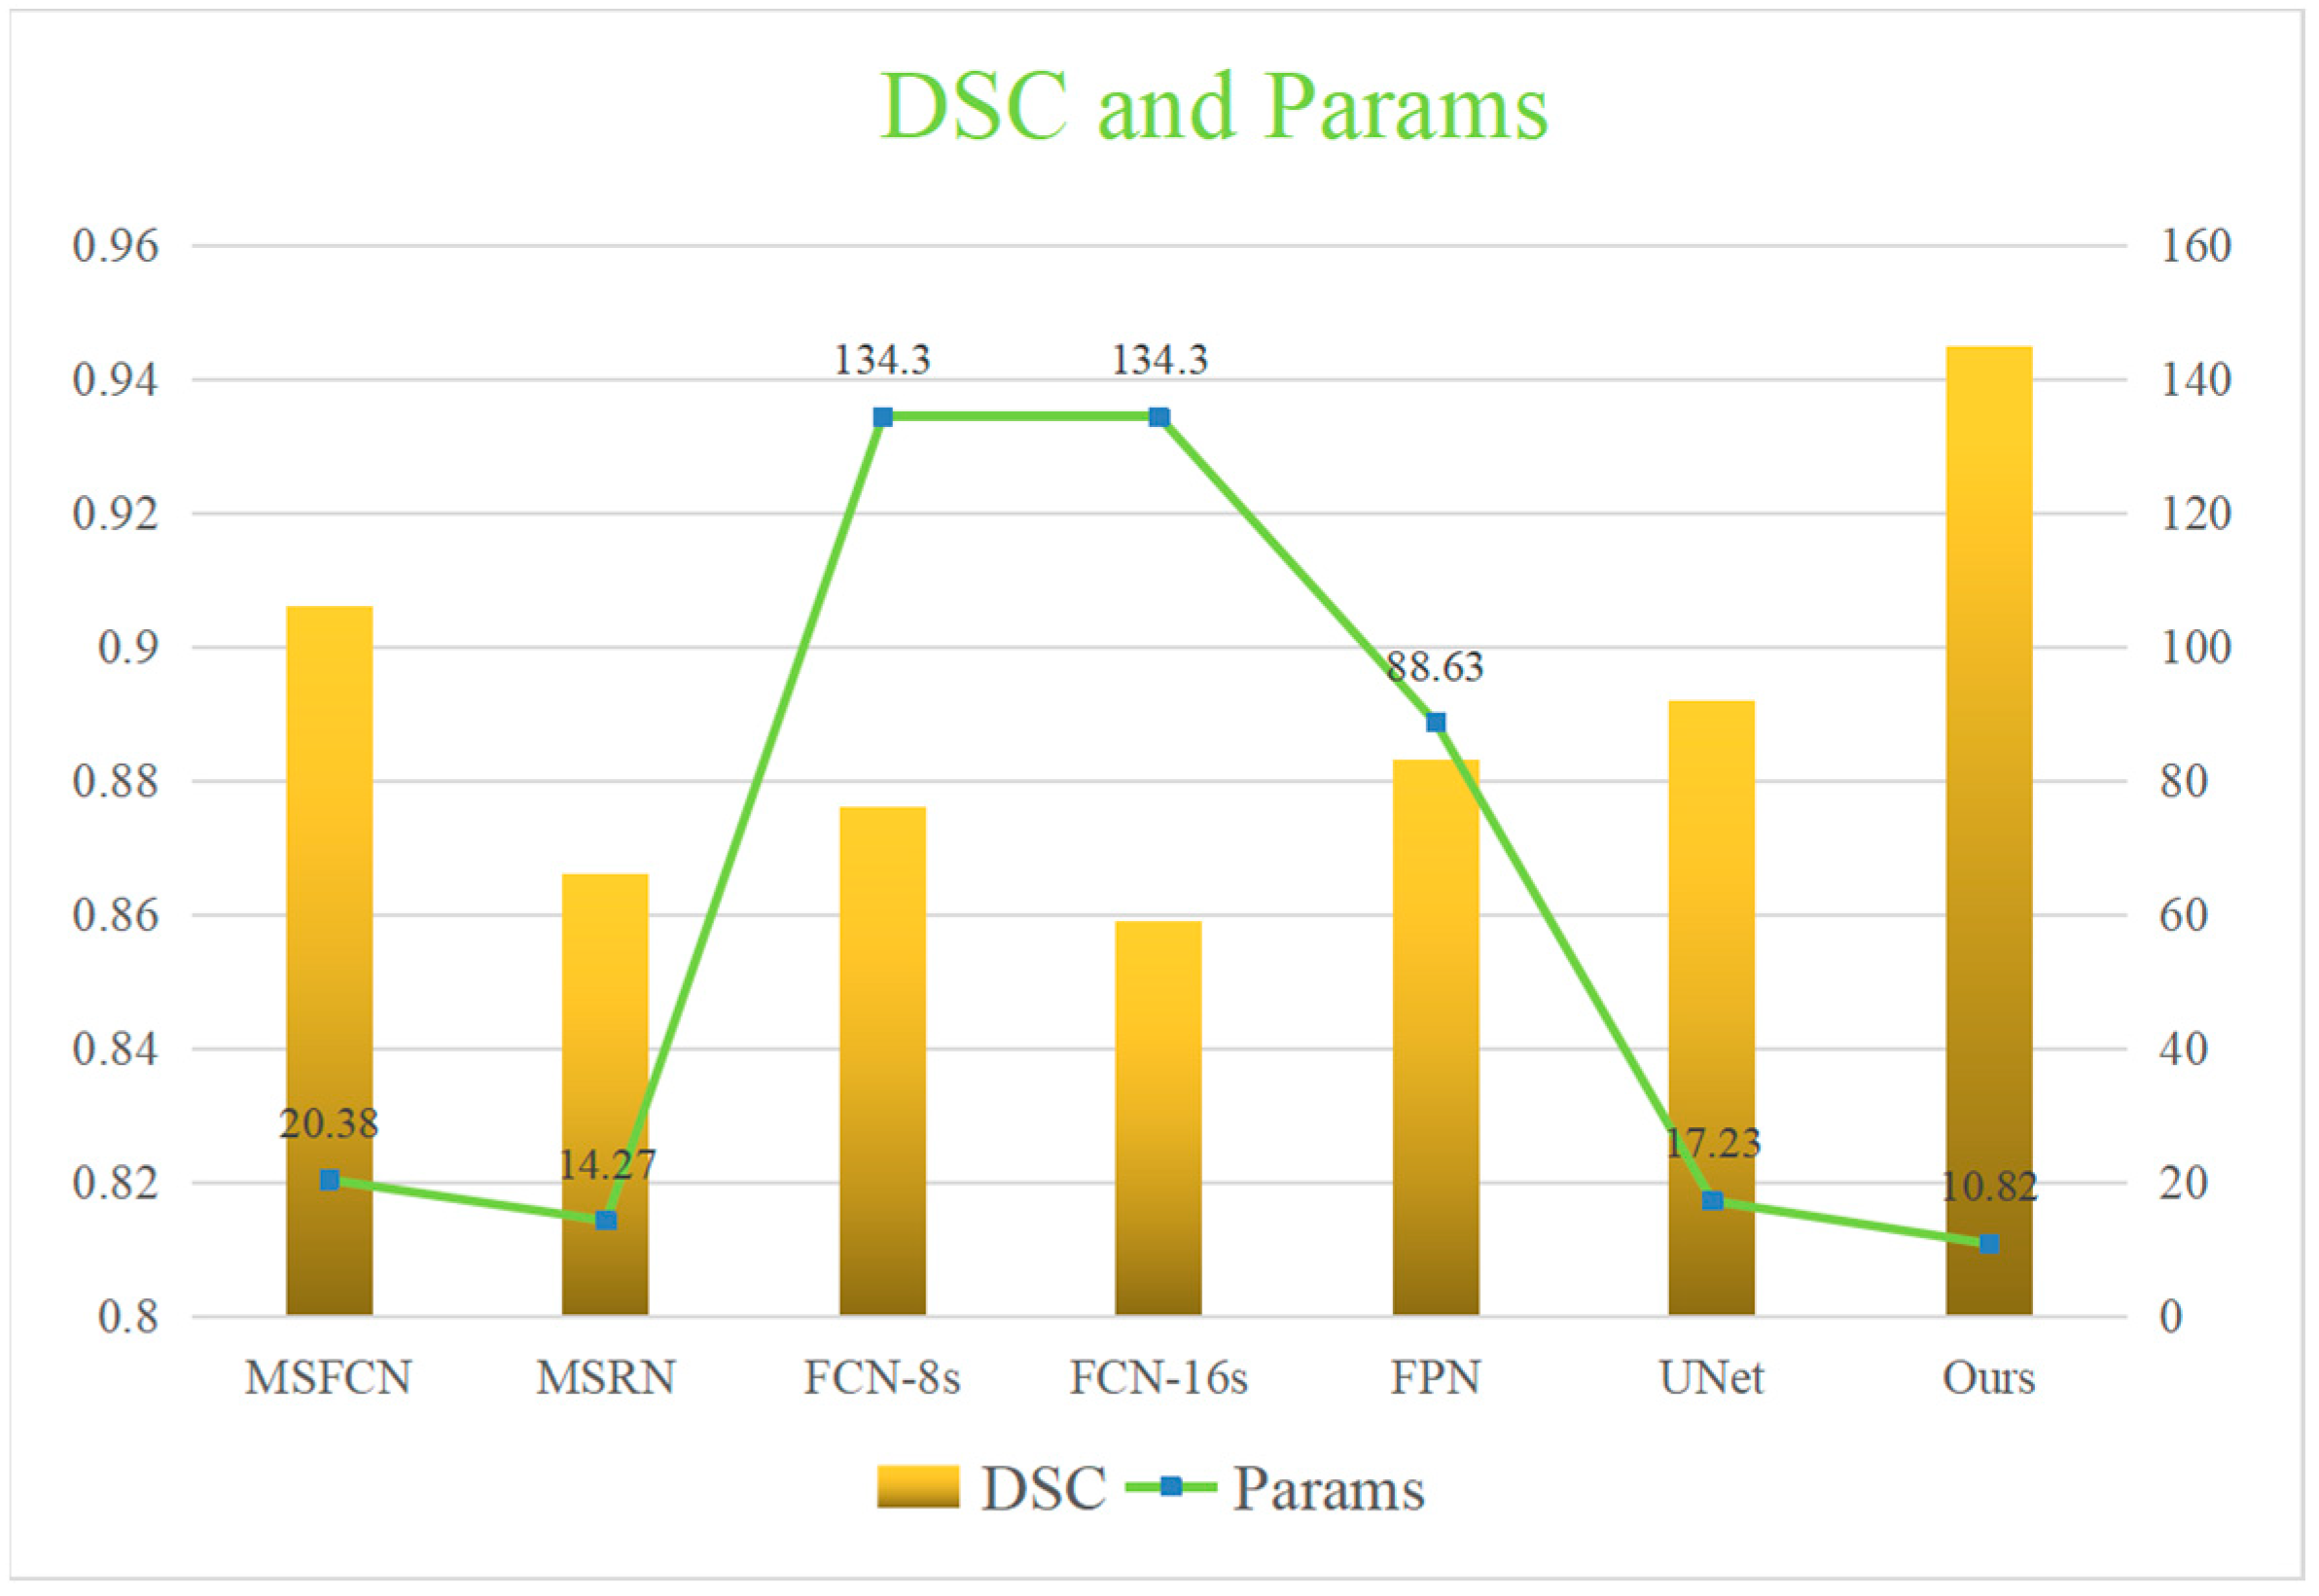
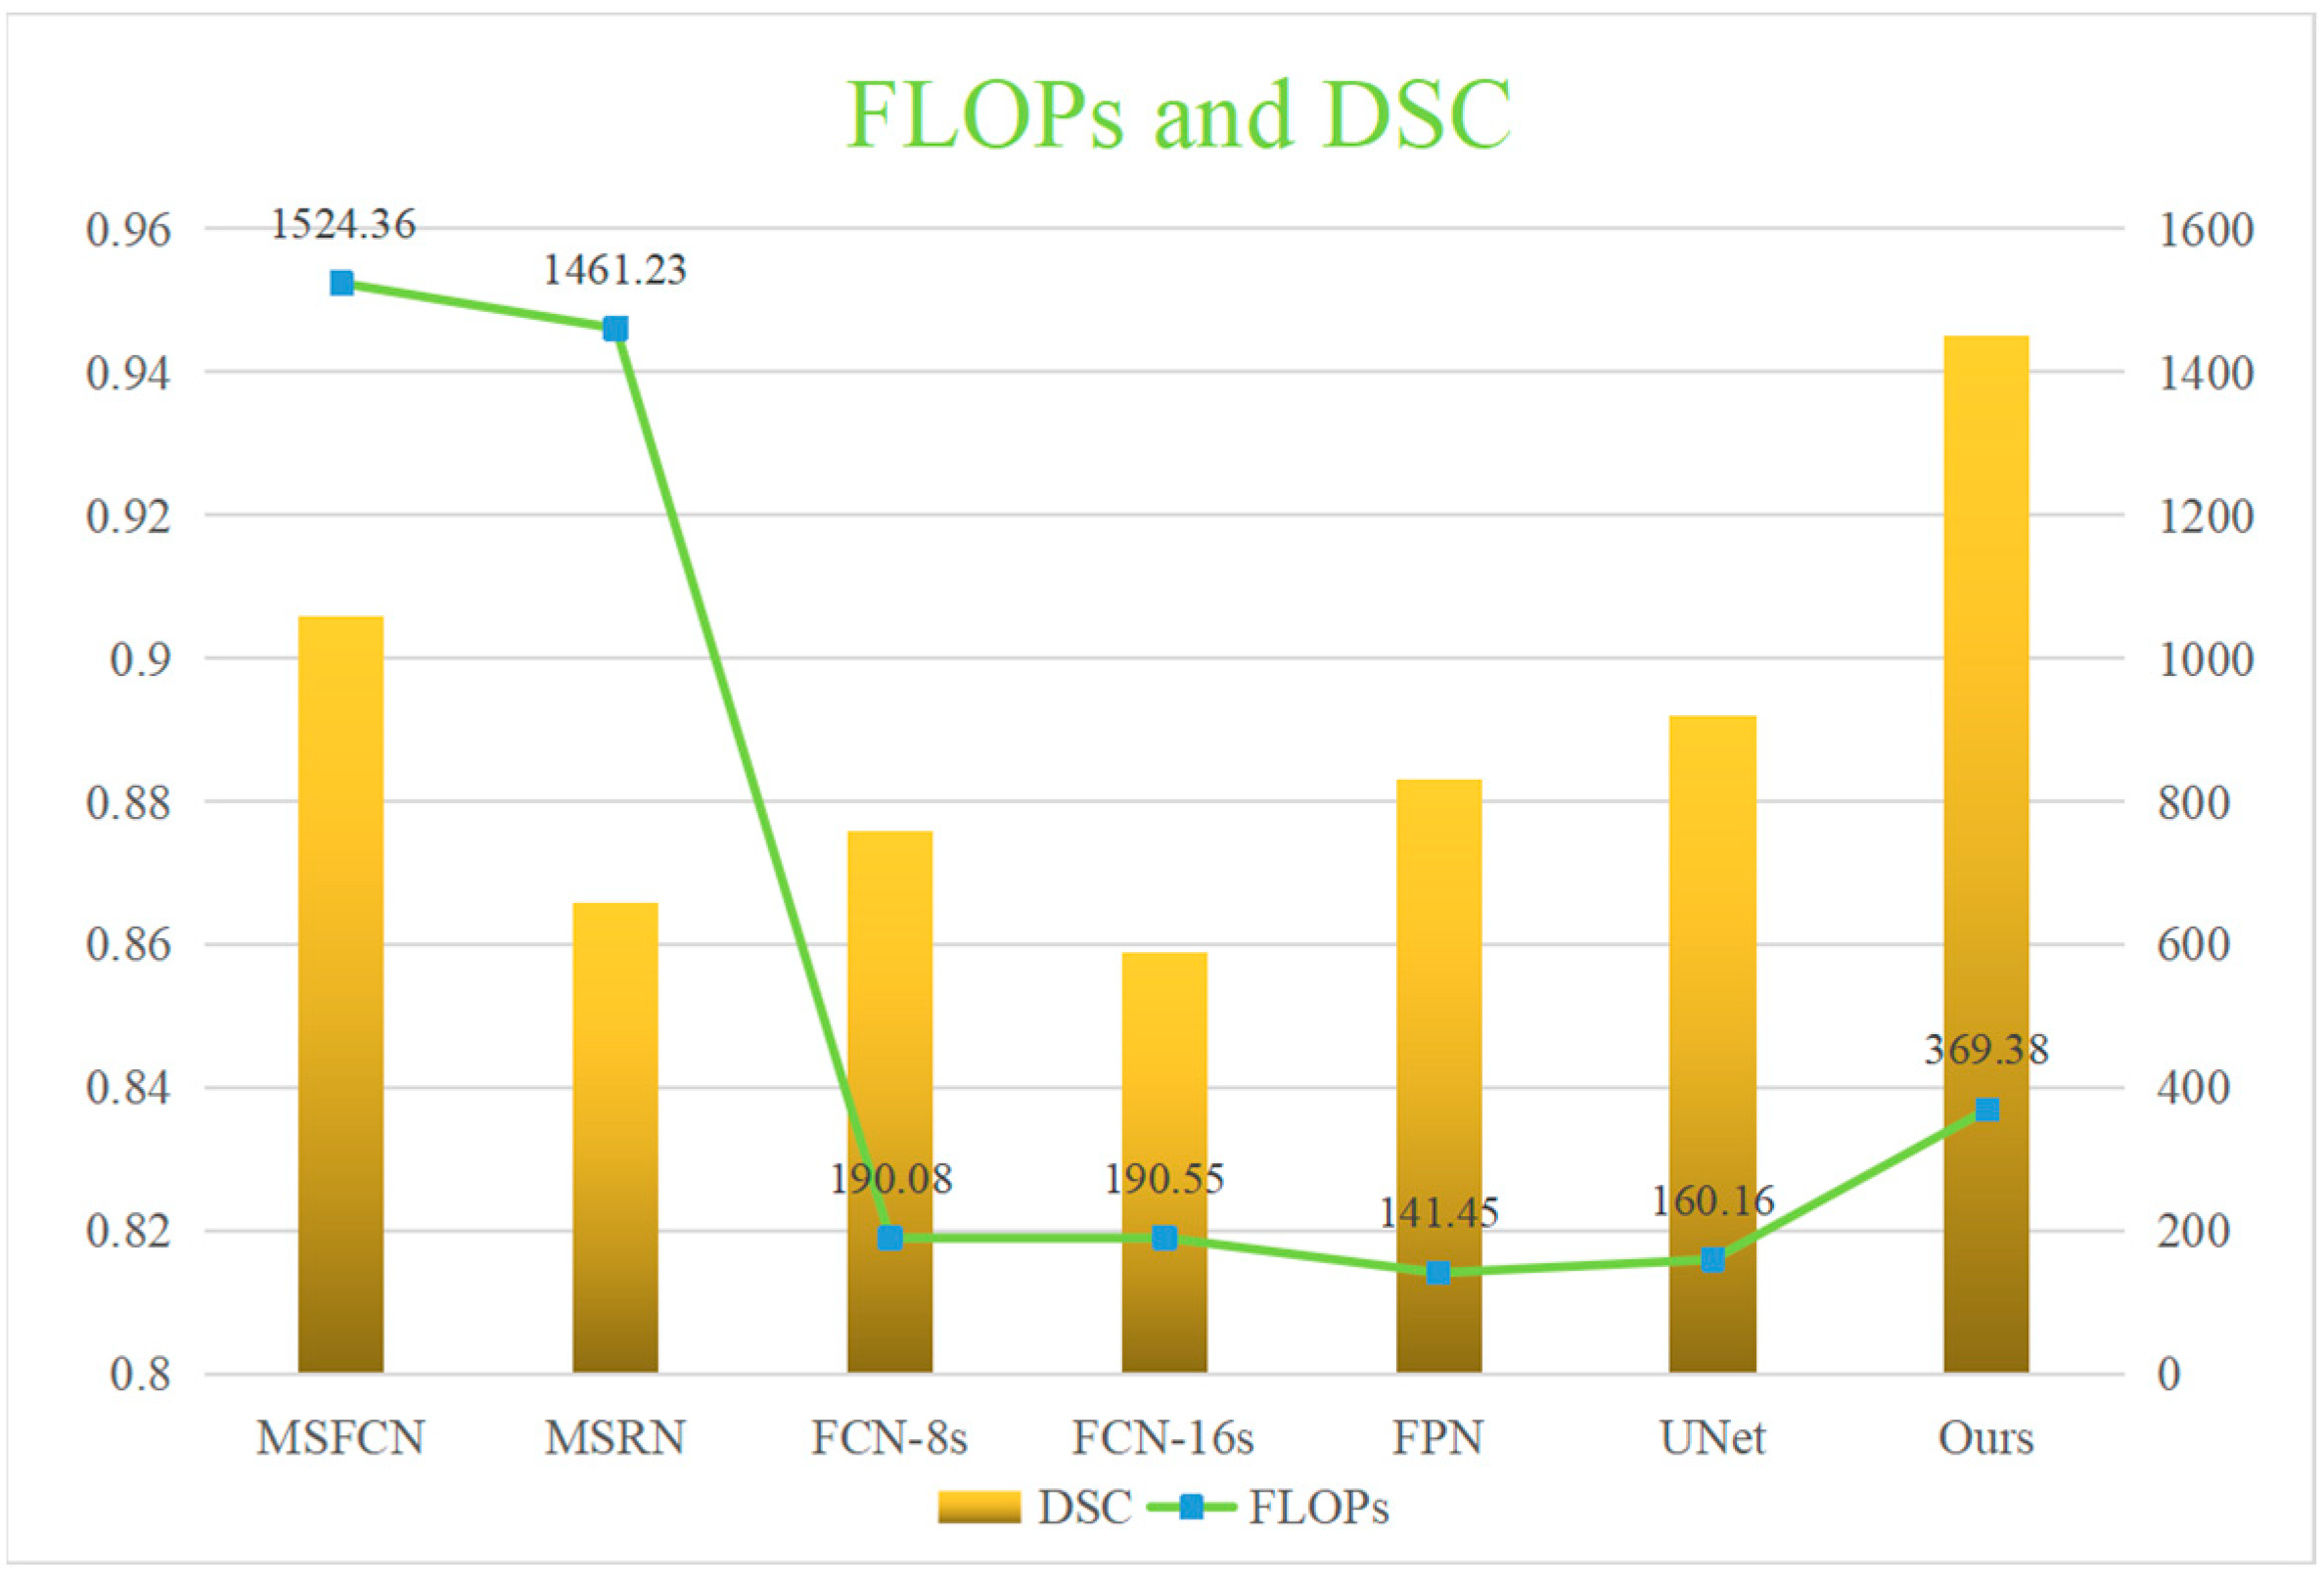
| Model | Acc | Pre | Re | F1 | IOU | HM | DSC | Params | FLOPs |
|---|---|---|---|---|---|---|---|---|---|
| MSFCN | 0.992 | 0.881 | 0.936 | 0.906 | 0.874 | 0.170 | 0.906 | 20.38M | 1524.3G |
| MSRN | 0.988 | 0.839 | 0.902 | 0.866 | 0.887 | 0.229 | 0.866 | 14.27M | 1461.2G |
| FCN-8s | 0.974 | 0.941 | 0.873 | 0.901 | 0.772 | 0.203 | 0.876 | 134.3M | 190.08G |
| FCN-16s | 0.990 | 0.922 | 0.882 | 0.900 | 0.824 | 0.326 | 0.859 | 134.3M | 190.55G |
| FPN | 0.989 | 0.919 | 0.924 | 0.921 | 0.852 | 0.186 | 0.883 | 88.63M | 141.45G |
| UNet | 0.991 | 0.918 | 0.929 | 0.924 | 0.867 | 0.100 | 0.892 | 17.26M | 160.16G |
| Ours | 0.995 | 0.940 | 0.945 | 0.945 | 0.898 | 0.102 | 0.945 | 10.82M | 369.38G |
Publisher’s Note: MDPI stays neutral with regard to jurisdictional claims in published maps and institutional affiliations. |
© 2022 by the authors. Licensee MDPI, Basel, Switzerland. This article is an open access article distributed under the terms and conditions of the Creative Commons Attribution (CC BY) license (https://creativecommons.org/licenses/by/4.0/).
Share and Cite
Lv, B.; Liu, F.; Gou, F.; Wu, J. Multi-Scale Tumor Localization Based on Priori Guidance-Based Segmentation Method for Osteosarcoma MRI Images. Mathematics 2022, 10, 2099. https://doi.org/10.3390/math10122099
Lv B, Liu F, Gou F, Wu J. Multi-Scale Tumor Localization Based on Priori Guidance-Based Segmentation Method for Osteosarcoma MRI Images. Mathematics. 2022; 10(12):2099. https://doi.org/10.3390/math10122099
Chicago/Turabian StyleLv, Baolong, Feng Liu, Fangfang Gou, and Jia Wu. 2022. "Multi-Scale Tumor Localization Based on Priori Guidance-Based Segmentation Method for Osteosarcoma MRI Images" Mathematics 10, no. 12: 2099. https://doi.org/10.3390/math10122099
APA StyleLv, B., Liu, F., Gou, F., & Wu, J. (2022). Multi-Scale Tumor Localization Based on Priori Guidance-Based Segmentation Method for Osteosarcoma MRI Images. Mathematics, 10(12), 2099. https://doi.org/10.3390/math10122099