Abstract
Fitts’ law is used as a performance measurement metric in human–computer interactions. The original formulation implied that movement time was identical for movements with the same value of the index of difficulty under varied movement amplitude and target width. An experiment was designed to test this implication. The result indicates that movement time is related to the index of difficulty when the amplitude is constant. Nowadays, most of the icons in applications are represented as two-dimensional targets. An object of equal width and height is a particular case of a two-dimensional target. This target area could be a factor in a Fitts task and impact the movement time, number of errors, and perceived difficulty. Therefore, the area could replace the target width in the formulation of the index of difficulty. The modified index of difficulty is easy to implement without the complexity of post-calculation. Researchers can design the index of difficulty before the empirical test. This research proposes a modified index of difficulty by varying the target’s area and applying the square-root movement time model simultaneously, which results in an excellent performance with a higher R-square and satisfies the residual normality robustly than the traditional formulation of Fitts’ law.
Keywords:
Fitts’ law; information theory; SQRT_MT model; psychological factor; two-dimensional target shape MSC:
62B10; 94A15
1. Introduction
Fitts’ law has been a successful and broadly applied tool to evaluate human performance in operating specific devices since Card’s work [1]. In the original Fitts task, the target was a long strip, and the movement of the task could be a reciprocal [2] or a discrete movement [3]. Two identical targets were located parallel to a movement amplitude (A) in front of the participants. Participants moved the pointing device above a horizontal line from right to left or left to right. The short side of the stripe was in the direction of movement, and the long side was perpendicular to the movement direction. We call the length of the short side the width (W) and the length of the long side the height (H) of a target. The height was always much greater than the width in the Fitts paradigm. The amplitude and the width of the target derive a particular index of difficulty (ID) in the Fitts paradigm, which was based on the information theory. Fitts claimed that the movement time (MT) from a start point to hitting the target was proportional to the index of difficulty [2].
Extending the Fitts paradigm, researchers investigated the effects of height [4,5] and target location [6]. Accot and Zhai [5] called this new type of Fitts task, wherein the width is the only constraint to the movement (H >> W), the one-dimensional (1D) model. In addition, when the height perpendicular to the movement direction is also a constraint to the movement (H ≤ W), the target is two-dimensional (2D). MacKenzie and Boxton studied the targets presented at an angle to the horizontal line; this situation is also called a two-dimensional task [6]. One concerns the dimensions of the target; the other concerns the dimension of the movement. Hoffmann et al. [7] provided an excellent definition of one-, two-, and three-dimensional targets if the limitation of movement performance is in the direction of movement, perpendicular to the movement, and at the proper depth at the target location.
In the current research, we adopt the definition of the dimension of movement by [7]. For the dimension of the target, we choose the meaning by [6]; when the width is the only constraint to the movement (H >> W), it is a 1D target. In contrast, the target is two-dimensional (2D) when the height perpendicular to the movement direction is also a constraint to the movement (H ≤ W). Figure 1 illustrates the 1D and 2D targets; the 2D targets are the equilateral triangle, diamond, circle, and square, all with equal height and width. Murata and Iwase [8] and Cha and Myung [9] defined the condition of the start point and the target not being on the transverse or frontal plane simultaneously as a 3D movement. This study defines the tapping task as a one-dimensional movement when the targets (or the start position and the target) are on the line parallel to the X-axis of a plane and which plane is parallel to the transverse or frontal plane. Otherwise, the targets are not on the line parallel to the X-axis; the tapping is a two-dimensional movement. When a movement is neither one-dimensional nor two-dimensional, it is a three-dimensional movement with the targets in the different depths of a human. Accordingly, this research classifies Fitts’ original paradigm as a one-dimensional movement in a one-dimensional target (1D1D) task. Studies on 1D2D [10], 2D2D [6], and 3D2D [8,9] tasks can be found in the literature.
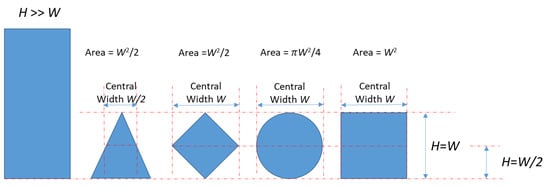
Figure 1.
The 1D and 2D targets. The rectangular target is a 1D target with a height greater than its width. The 2D targets are shapes with equal height and width. However, the central width that crosses the half-height (H = W/2) might not be the same.
The Canon model of Fitts’ law is a regression formula derived from empirical data. It regulates the relationship between the dependent variable (MT) and the independent variable (ID) with two parameters, the intercept (a) and slope (b):
The ID has various definitions; the two most popular ones were applied in this research. They are as follows:
The W is the width of the used target, and the A is the distance (amplitude) between the two targets.
Meyer et al. [10] investigated the Fitts task by optimizing the sub-movement during the operation. They thought the phenomenon in Fitts’ law regulates people’s speed–accuracy tradeoff policy in a movement. People move as fast as possible across the amplitude and approach the target in the first stage. Then they slow down and adjust their movement based on visual feedback to hit the target accurately in the second stage. Due to the movement being along the target width, the size of that width dominates the magnitude of the tradeoff in time duration. With a larger width, less tradeoff time is needed to hit the target precisely. Another relationship between the movement time and the index of difficulty was proposed in the form of power law [10].
Therefore, there is insufficient satisfaction in the statistical principles, like the lack-of-fit or residual normality test, in the information theory-based formula and the power law [10]. The Canon model using Fitts’ data in 1-oz and 1-lb stylus tapping tasks [2] fails in the lack-of-fit and the residual normality test [11]. Fitts claimed that MT is only related to ID [2]. Also, the Canon model implies that MT is a constant for the same ID value composed of varied A and W. However, our previous 1D1D study showed that Fitts’ law should be considered to underlie a constant amplitude. Different empirical formulations should be developed when a study demands more than one movement amplitude [11]. In this manner, the not well-fitted cases in IDFitts make the residual violate the normality assumption.
In our previous research, an SQRT_MT model, fusing findings from physics, psychology, and physiology, was proposed as an option to the Canon model [11].
The SQRT_MT model has been shown to have a higher R-square, lower prediction sum of squares (PRESS), satisfactions in residual normality, and lack-of-fit test robustly in 1D1D movement compared to the Canon model and the power-law in the historical data in [2] and experimental data in [11].
With the ubiquity of computers and mobile devices in daily life, the icons of applications may have many reasons to be shaped as rectangles, squares, ellipses, or other shapes [12]. Grossman’s work illustrated the non-rectangular interface in daily life [13]. The state-of-the-art programming languages also have a drawing tool capable of producing various graphic-user-interface design shapes (Figure 2). In the range of 2D targets, objects of equal width and height are in a particular class [5]. Most studies in this class have employed square or circular targets [14]. Figure 2 also presents the most frequent icon shapes in real life: equilateral triangle, round, and square. Consequently, this research chose the three shapes as the treatments. Furthermore, the diamond shape applied by Seikh and Hoffmann [15] was taken for comparison.

Figure 2.
The shaped icons in modern electronic devices. On the left are the circular widgets in the Android smartphone. On the center are square widgets in the Windows system. They appear to have arbitrary shapes until indicated by the mouse cursor. Finally, on the right is a universal remote controller with buttons of equal height and width in real life.
However, the effect of a 2D target is seldom investigated in the literature. The area restrained by equal width and height is utilized unequally in different shapes. Therefore, the magnitude of width in the movement direction is no longer the primary factor that impacts people’s speed-accuracy tradeoff. Sheikh and Hoffmann’s work might be the first research on this issue [15]. They posteriorly calculated the standard deviation of the hits on the target in the movement direction to define a new effective width for each shape. Grossman et al. [13] applied a probabilistic Fitts’ law model to study 10 arbitrary shapes. These shapes included a complex mixture of a convex and concave graph, like a star. A traditional formula like Equations (2) or (3) was not recommended for such a complex shape. According to three varied target center definitions, Grossman’s model also needs posterior calculation for the probabilistic index of difficulty from a bivariate normal density function of endpoints’ coordination. Although the R-square is superior in the Canon model in both studies after using their specific IDs, the posterior calculation of the endpoints is time-consuming and complicated. In advance, the researchers do not know the calculated difficulties of the shape targets in their studies. Therefore, the shapes in daily life applications are convex, like the illustration in Figure 2; the current research is limited to the convex shape target applying Fitts’ law.
This study was inspired by Sheikh and Hoffmann’s work [15], which was the first research about the geometric shape of the target on the effect of movement time. The information-theory-based formula for the geometric shape of targets did not perform excellently as in the traditional Fitts paradigm. Figures showed that the relationship between the movement time and the index of difficulty was not linear as expected. Moreover, it was evident that the different shapes with the same IDFitts value significantly differed in the movement time (Figure 1 and Figure 4 in [15]). The reported R-square was only 0.919 and 0.918 in Experiments 1 and 2 of their research. Sheikh and Hoffmann concluded that the effective width of the target varied with the shape and used a bivariate-normal distribution to predict the shape’s effect accurately. The endpoint desperation related to the geometrical center was recorded to calculate the deviation in the direction of movement and perpendicular to the direction of movement. They proposed a modified IDFitts applying the standard deviation in the direction of motion (called IDSDH) and perpendicular to the direction of movement (called IDSDV) instead of the target width (W) in Equation (2). By applying IDSDH, the R-square was increased to 0.962 and 0.963 for Experiments 1 and 2, respectively.
Despite the improved performance of the modified ID in the endpoint distribution proposed in [15], there is still space to improve the R-square. Furthermore, the inconvenience in the data collection of the endpoints and the post-calculation of the standard deviation might discourage the researchers from applying the proposal. Therefore, the first motivation of this study is to extend the success of the SQRT_MT model in the Fitts paradigm [11]. The second motivation is to develop an easy-to-use ID contrast to the post-calculation ID for the 2D geometric shapes. Then, we expect the SQRT_MT model with the particular ID could be applied in the geometric shape of the target to conquer the mentioned cons, like the model fitting adequacy insufficiently and the complicated post-calculation in ID.
In our pilot study using the data in [15], we found a strong relationship between the movement time and the area of the geometric shape. The first purpose of this research was to show that the area of a shape of equal width and height is a factor that impacts the prediction formula of movement time. The second purpose is that the area of a 2D shape affects the perceived difficulty in 1D2D movement. In this research, we hypothesized that the magnitude of the area might be a proper factor instead of the target width, as it impacts people’s speed-accuracy tradeoff policy when shapes are of equal width and height.
Consequently, researchers can use the target’s area instead of the width in the logarithmic term. Thus, we propose an optional IDarea for Fitts’ law in this specific 1D2D class. The ID could be in the Fitts or the Shannon form.
Here, area, in the logarithmic term, is the geometric area of the target shape. Finally, we extend the SQRT_MT model from 1D1D to 1D2D movement. Thus, the IDs in Equations (1) and (4) could be IDFitts, IDShannon, IDarea_Fitts, or IDarea_Shannon. The third purpose was to extend our work in a 1D1D task to validate that MT is related to IDFitts when the amplitude is constant but not mixing the varied amplitudes with the same IDFitts value in a 1D2D task.
Since the distance between targets (amplitude) was a constant of 320 mm for all conditions in Sheikh and Hoffmann’s work [15], their data cannot be applied in the pilot study to testify to this research’s third purpose. There were two similar experiments in Sheikh and Hoffmann [15]. The difference between the two experiments was the 2D target shapes they applied. Experiment 1 used rectangle, square, circle, and diamond shapes. One more equal width and height target, an equilateral triangle, was involved in Experiment 2. Nevertheless, the rectangular target’s data were excluded in the pilot study since it was a 1D target, not the 2D target that is the focus of this research. A modified ID (IDSDH) in Sheikh and Hoffmann [15] was also applied in the pilot study to compare the performance of various IDs in the Canon and the SQRT_MT models.
Although the width and the height of the 2D shapes might be the same, people could perceive the difficulty of a tapping task with different shapes varied intuitionally. Chan and Hoffmann applied the subjective assessment of difficulty for an ongoing visual movement [16]. Participants’ self-reported evaluation is a popular method in psychophysical research. The Borg CR-10 scale [17] is an easy-to-use and prevalent questionnaire in Psychologysics, which might be applied in a 1D2D Fitts task to assist the objective measurement of movement time.
2. Materials and Methods
Twelve students (six males and six females) served as the participants. They were 27.3 ± 2.4 (mean ± standard deviation) years old and 165.8 ± 6.9 cm in height. All of them are right-handed with no upper arm injury history.
A 24-inch full-HD-resolution projected capacitive touch monitor (model: Nextech NTSP240) and an active capacitive stylus (model: PenPower Pencil Pro) were applied in the experiment. The experimenter developed specific software to show the targets and record hit positions and duration between two hits. The hitting outliers were removed by a conservative and straightforward rule proposed by Zhai et al. [18].
The environmental setting and the procedure were the same as in our previous study. The touch monitor showed the two shape targets horizontally after the experiment was initiated. The screen was located on a 66 cm high desk and angled backward; the top edge of the screen was 35 cm from the desktop in the vertical direction, and the bottom edge of the screen was 34 cm from the desk edge near the participant. Participants sat on a chair and adjusted the seat height until they felt comfortable operating the apparatus. Participants sat before the screen as regular daily activity and continually moved the stylus to hit the two targets reciprocally. Every participant had to hit the target 25 times in each treatment. The same four target shapes in [15] were applied: equilateral triangle, diamond, circle, and square. To validate the third purpose of this research, three distance settings were used (A) in [11], 256, 512, and 1024 device-independent pixels between the two targets. One device-independent pixel is equal to a square with 0.265 mm in width. A wide range of the indexes of difficulty, 2, 3, 4, 5, and 6, defined by Equation (2) in [11], was utilized in this study. The width of the target is determined by the movement amplitude and the index of difficulty. Each target’s height is the same as its width.
The target shape, the movement amplitude, and the index of difficulty are cross-design factors. Each participant conducted his/her treatments in different random order. After 25 treatments are finished, he/she could have a rest of 5 minutes or until he/she feels a recovery from the fatigue. When he/she completed each treatment, every participant evaluated the perceived difficulty by a subjective difficulty scale. This study applied the Borg CR-10 scale [17] to assess the perceived difficulty. However, the original scale was enlarged from 0 to 100 (multiplied by 10) but kept the scale description to the responded point.
The dependent variables in this study were the mean movement time (unit: milliseconds) and the participant’s perceived difficulty. To achieve the first purpose of this study, we would like to show that tasks with the same IDFitts values in varying amplitudes, called ID(A), are not identical in the mean movement time. Fifteen planned prior contrasts by Dunn-Šidák simultaneous test could validate the hypothesis [19]. They are:
This hypothesis was extended to the effect of perceived difficulty. After we validated our first purpose, the IDFitts was broken down to the amplitude (A) and the target width (W) as factors of an exploring study. Another factor of the exploring analysis was the geometric shape of the applied target. If the factor was significant in the ANOVA, Tukey pairwise post-hoc test was applied in the exploring analysis. All the hypothesis and model adequacy tests were performed with a significant level set at 5%.
For the second purpose of this study, we would like to show that the area of a shape of equal width and height is a factor that impacts people’s speed–accuracy tradeoff policy. If the second hypothesis were valid, the proposed IDarea would perform better than other IDs in the fitted regression formulation for predicting the mean movement time. The proper formulation would be judged by the satisfaction of the essential assumptions in a simple linear regression and the performance of the quality indexes.
The lack-of-fit test is the diagnostic tool for adequately fitting a regression model. The Anderson–Darling test [20] is used to test if a sample of data came from a population with a specific distribution. We applied this method to validate the essential assumption, the residual normality requirement, in a simple linear regression formula. An excellent linear regression formulation must pass both tests simultaneously.
Besides the R-square, this study applied the PRESS/SSE ratio as another quality index. Both PRESS and SSE could be used to evaluate the fitting quality of a regression model. However, the unit of the dependent variable in the Canon and the SQRT_MT model is different. The PRESS and SSE of the two models cannot be compared directly. Therefore, the PRESS/SSE ratio is a normalized metric with a unit free that could conquer the issue.
3. Results
3.1. A Pilot Study Using Sheikh and Hoffmann’s Data
Table 1 presents the simple linear regression analysis using the data from Sheikh and Hoffmann [10]. All the models’ residuals passed the normality test, for none of the AD-test’s p-values (>0.05) were significant. The models using IDFitts or IDShannon also adequately fitted the observations, for the lack-of-fit tests (>0.05) were insignificant. Therefore, the area or the calculated effective width differed for each shape. There was no repetition in IDarea_Fitts, IDarea_Shannon, or IDSDH that made the lack-of-fit test not available (NA). Therefore, the PRESS is a better choice for the quality index of model selection. However, in the Canon model, the unit is the time domain, and in the SQRT_MT model, it is the square root of the time domain. The PRESS between the two models could not be compared directly. Nevertheless, the PRESS is always more prominent than the sum square of error (SSE). Thus, the normalized ratio, the PRESS/SSE, is always more than one, and it was applied to compare the performances of the Canon and the SQRT_MT models. The PRESS/SSE ratio in Experiments 1 and 2, which ranged from 1.48 to 1.78 in 10 models, approached one. The R-squares for IDarea_Shannon, IDarea_Fitts, IDSDH, IDShannon, and IDFitts were from high to low in the Canon or the SQRT_MT model. For the Canon model, the highest R-square was 0.9859 with IDarea_Shannon. The R-squares in the SQRT_MT models were 0.9881 and 0.9828 with IDarea_Shannon and IDarea_Fitts, respectively. The two IDarea improved the R-square by about 4% more than did the two corresponding non-IDarea in both the Canon and the SQRT_MT models.

Table 1.
Regression analysis of 2D target shapes data in Experiment 1 of Sheikh and Hoffmann [15]. IDarea_Shannon had the best R-square in both the Canon and SQRT_MT models.
Table 2 shows the simple regression analysis of Experiment 2. The results were like those of Experiment 1. All the models satisfied the residual normality assumption, for the p-values were insignificant. Also, the lack-of-fit test showed that the models with IDFitts and IDShannon fitted the observations adequately. Additionally, the PRESS/SSE ratio ranged from 1.34 to 1.40, so they were close to one. IDarea_Shannon was again the highest for the R-square in both the Canon and the SQRT_MT models. The IDarea_Shannon in the SQRT_MT model had the highest R-square of 0.9910. That of IDarea_Fitts was the second-highest, by only a tiny difference. Again, the two IDarea improved the R-square by about 4% more than the two corresponding non-IDarea in both the Canon and SQRT_MT models.
Table 2.
Regression analysis of 2D target shapes data in Experiment 2 of Sheikh and Hoffmann [15]. IDarea_Shannon had the best R-square in both the Cannon and the SQRT_MT models.
In short, IDarea_Shannon had the best performance in both the Canon and the SQRT_MT models across two experiments, and robustly so. Such a result partially verified this study’s two purposes. However, there was only a single amplitude, 320 mm, in Sheikh and Hoffmann’s work [15]; therefore, we aimed to validate purpose one with more amplitudes to show by experiment that movement time is not determined entirely by IDFitts and investigate the effect of target shape on misses.
3.2. Experiment Results for Mean Movement Time
All the interactions between factors are insignificant for the movement time and the perceived difficulty in this study; the succeeded analysis of variance reports the main effects only. Table 3 shows the 15 planned contrasts corresponding to the first hypothesis of this research. Ten out of fifteen contrasts differed significantly. Not all the MTs in pairs with the same IDFitts values were identical. Fitts’ argument that MT is only related to the IDFitts, was not supported by our result. When the IDFitts was equal to two or three, the MT significantly differed at various amplitudes. However, the relationship of MT with identical IDFitts values but different amplitudes became complicated when the IDFitts was more than three. Some contrasts were not significantly different. For example, the longer amplitude would increase the MT, and the larger target width might reduce the MT. However, the effects of the changes in amplitude and target width might not be in equilibrium. Such a result complicates explaining the causal relationship between movement time and IDFitts value.
Table 3.
Dunn–Šidák simultaneous test for the planned contrasts (individual confidence level = 99.66%), indicating that most tasks with the same ID do not have identical MT.
Since the a priori test rejected the null hypothesis of the first purpose of this research, then to compensate for the inability of ID(A) to explain movement time reasonably, we entered the target width, the movement amplitude, and the target shape as factors in the analysis of variance (ANOVA). All the factors were significant, with p-values of less than 0.001. The F statistics were F(2,22) = 54.77, F(6,66) = 22.74, and F(3,33) = 16.57 for amplitude, width, and shape, respectively. Table 4 shows the post-hoc analysis for all levels on target width. All the levels were significantly different, and movement time increased with decreases in target width.
Table 4.
Tukey post-hoc analysis for W and MT. MT was negatively related to W.
Table 5 shows the post-hoc analysis of movement amplitude, which had results like target width. Again, all three amplitudes had significant differences in movement time, with a longer amplitude indicating more movement time.
Table 5.
Tukey post-hoc analysis for A and MT. MT was positively related to A.
Regarding the effect of target shape, the results of the post-hoc analysis are shown in Table 6. The movement times between the equilateral triangle and diamond did not differ significantly. The equilateral triangle required the longest movement time, followed by, in descending order, diamond, circle, and square. The equilateral triangle, diamond, circle, and square differed in geometric area, increasing from small to large in the order listed. This result implies that movement time was related to the geometric areas of these targets of equal width and height.
Table 6.
Tukey post-hoc analysis for shape and MT. The longest MT was the equilateral triangle and the shortest that of the square.
In short, replacing ID(A) with A and W in the ANOVA generated direct results on movement time. The benefits of this approach will be described in the discussion section.
3.3. Experiment Results for Perceived Difficulty
It is not surprising that the effect of ID(A) on the participant’s perceived difficulty was also confusing. Table 7 shows similar chaos in movement time and errors. Consequently, we used the target’s width, the movement amplitude, and the target’s shape as the factors to conduct ANOVA on the perceived difficulty. All the factors were significant, with p-values of less than 0.001. The F-values were F(2,22) = 14.94 for A, F(6,66) = 67.39 for W, and F(3,33) = 22.82 for shape.
Table 7.
Dunn–Šidák simultaneous test for the planned contrasts (individual confidence level = 99.66%), indicating that most tasks with the same ID do not have identical perceived difficulty.
Table 8 shows the post-hoc analysis for the target’s width. All the levels were significantly different except for 128 and 256 pixels. The perceived difficulty decreased as the target’s width increased.
Table 8.
Tukey post-hoc analysis for the W in the perceived difficulty. The perceived difficulty was negatively related to W. A smaller W was associated with greater perceived difficulty.
Table 9 shows the post-hoc analysis of the movement amplitude and participants’ perceived difficulty. All three amplitudes were significantly different from one another. The longer the movement amplitude, the more difficulty the participants perceived.
Table 9.
Tukey post-hoc analysis for A and perceived difficulty. The perceived difficulty was positively related to A. A shorter A was associated with lower perceived difficulty.
Table 10 shows the effect of the target’s shape on the perceived difficulty. The equilateral triangle and the diamond, the diamond and the circle, and the circle and the square had identical difficulties. Moreover, the shapes’ order of difficulty from high to low was the same for movement time and error number. This result implies that the perceived difficulty is also related to the geometric area of the target again.
Table 10.
Tukey post-hoc analysis for shape and perceived difficulty. The greatest difficulty was that of the equilateral triangle, and the least, that of the square.
In summary, the post-hoc analysis results for the movement time, the error number, and the participants’ perceived difficulty were consistent. However, the target’s width had a negative relationship with the dependent variables, and the amplitude positively correlated with the dependent variables. Additionally, the order of the shapes’ effect was negatively related to their area.
3.4. Experiment Results for Regression Analysis
For the second purpose of this research, we extended the SQRT_MT model from 1D1D to 1D2D movement. Again, IDarea in Equations (5) and (6) was expected to outperform the other IDs. Table 11, Table 12 and Table 13 show the regression analysis results of movement amplitude for 256, 512, and 1024 pixels, respectively.
Table 11.
Regression analysis for the amplitude of 256 pixels. IDarea_Shannon had the best R-square and PRESS in both the Canon and the SQRT_MT models.
Table 12.
Regression analysis for the amplitude of 512 pixels. IDarea_Shannon had the best R-square and PRESS in both the Canon and SQRT_MT models.
Table 13.
Regression analysis for the amplitude of 1024 pixels. IDarea_Shannon had the best R-square and PRESS in both the Canon and SQRT_MT models.
Each table contains the coefficients of Equations (1) and (4), the R-square, the PRESS/SSE ratio, the lack-of-fit, and the p-value of the Anderson–Darling test for residuals normality in varied ID types. The results in each table are highly similar. The performance (higher R-square and less PRESS/SSE ratio) with IDarea is always better than that with non-IDarea, regardless of the amplitude or model type. The best ID type is always IDarea_Shannon across the model types and amplitudes. R-square for the same ID type is always higher in the SQRT_MT model than in the Canon model, except for A256/IDarea_Shannon (Table 11). In addition to the R-square and the PRESS/SSE ratio, the lack-of-fit test is another index of a regression model’s fitting quality. However, the index is only available for IDFitts or IDShannon. IDarea causes the experiment to lack repetition because the IDarea value varies among different shapes. All the conditions failed the lack-of-fit test (less than 0.05) except A512/SQRT_MT/IDShannon in Table 12 and A1024/SQRT_MT/IDShannon and A1024/Canon/IDShannon in Table 13
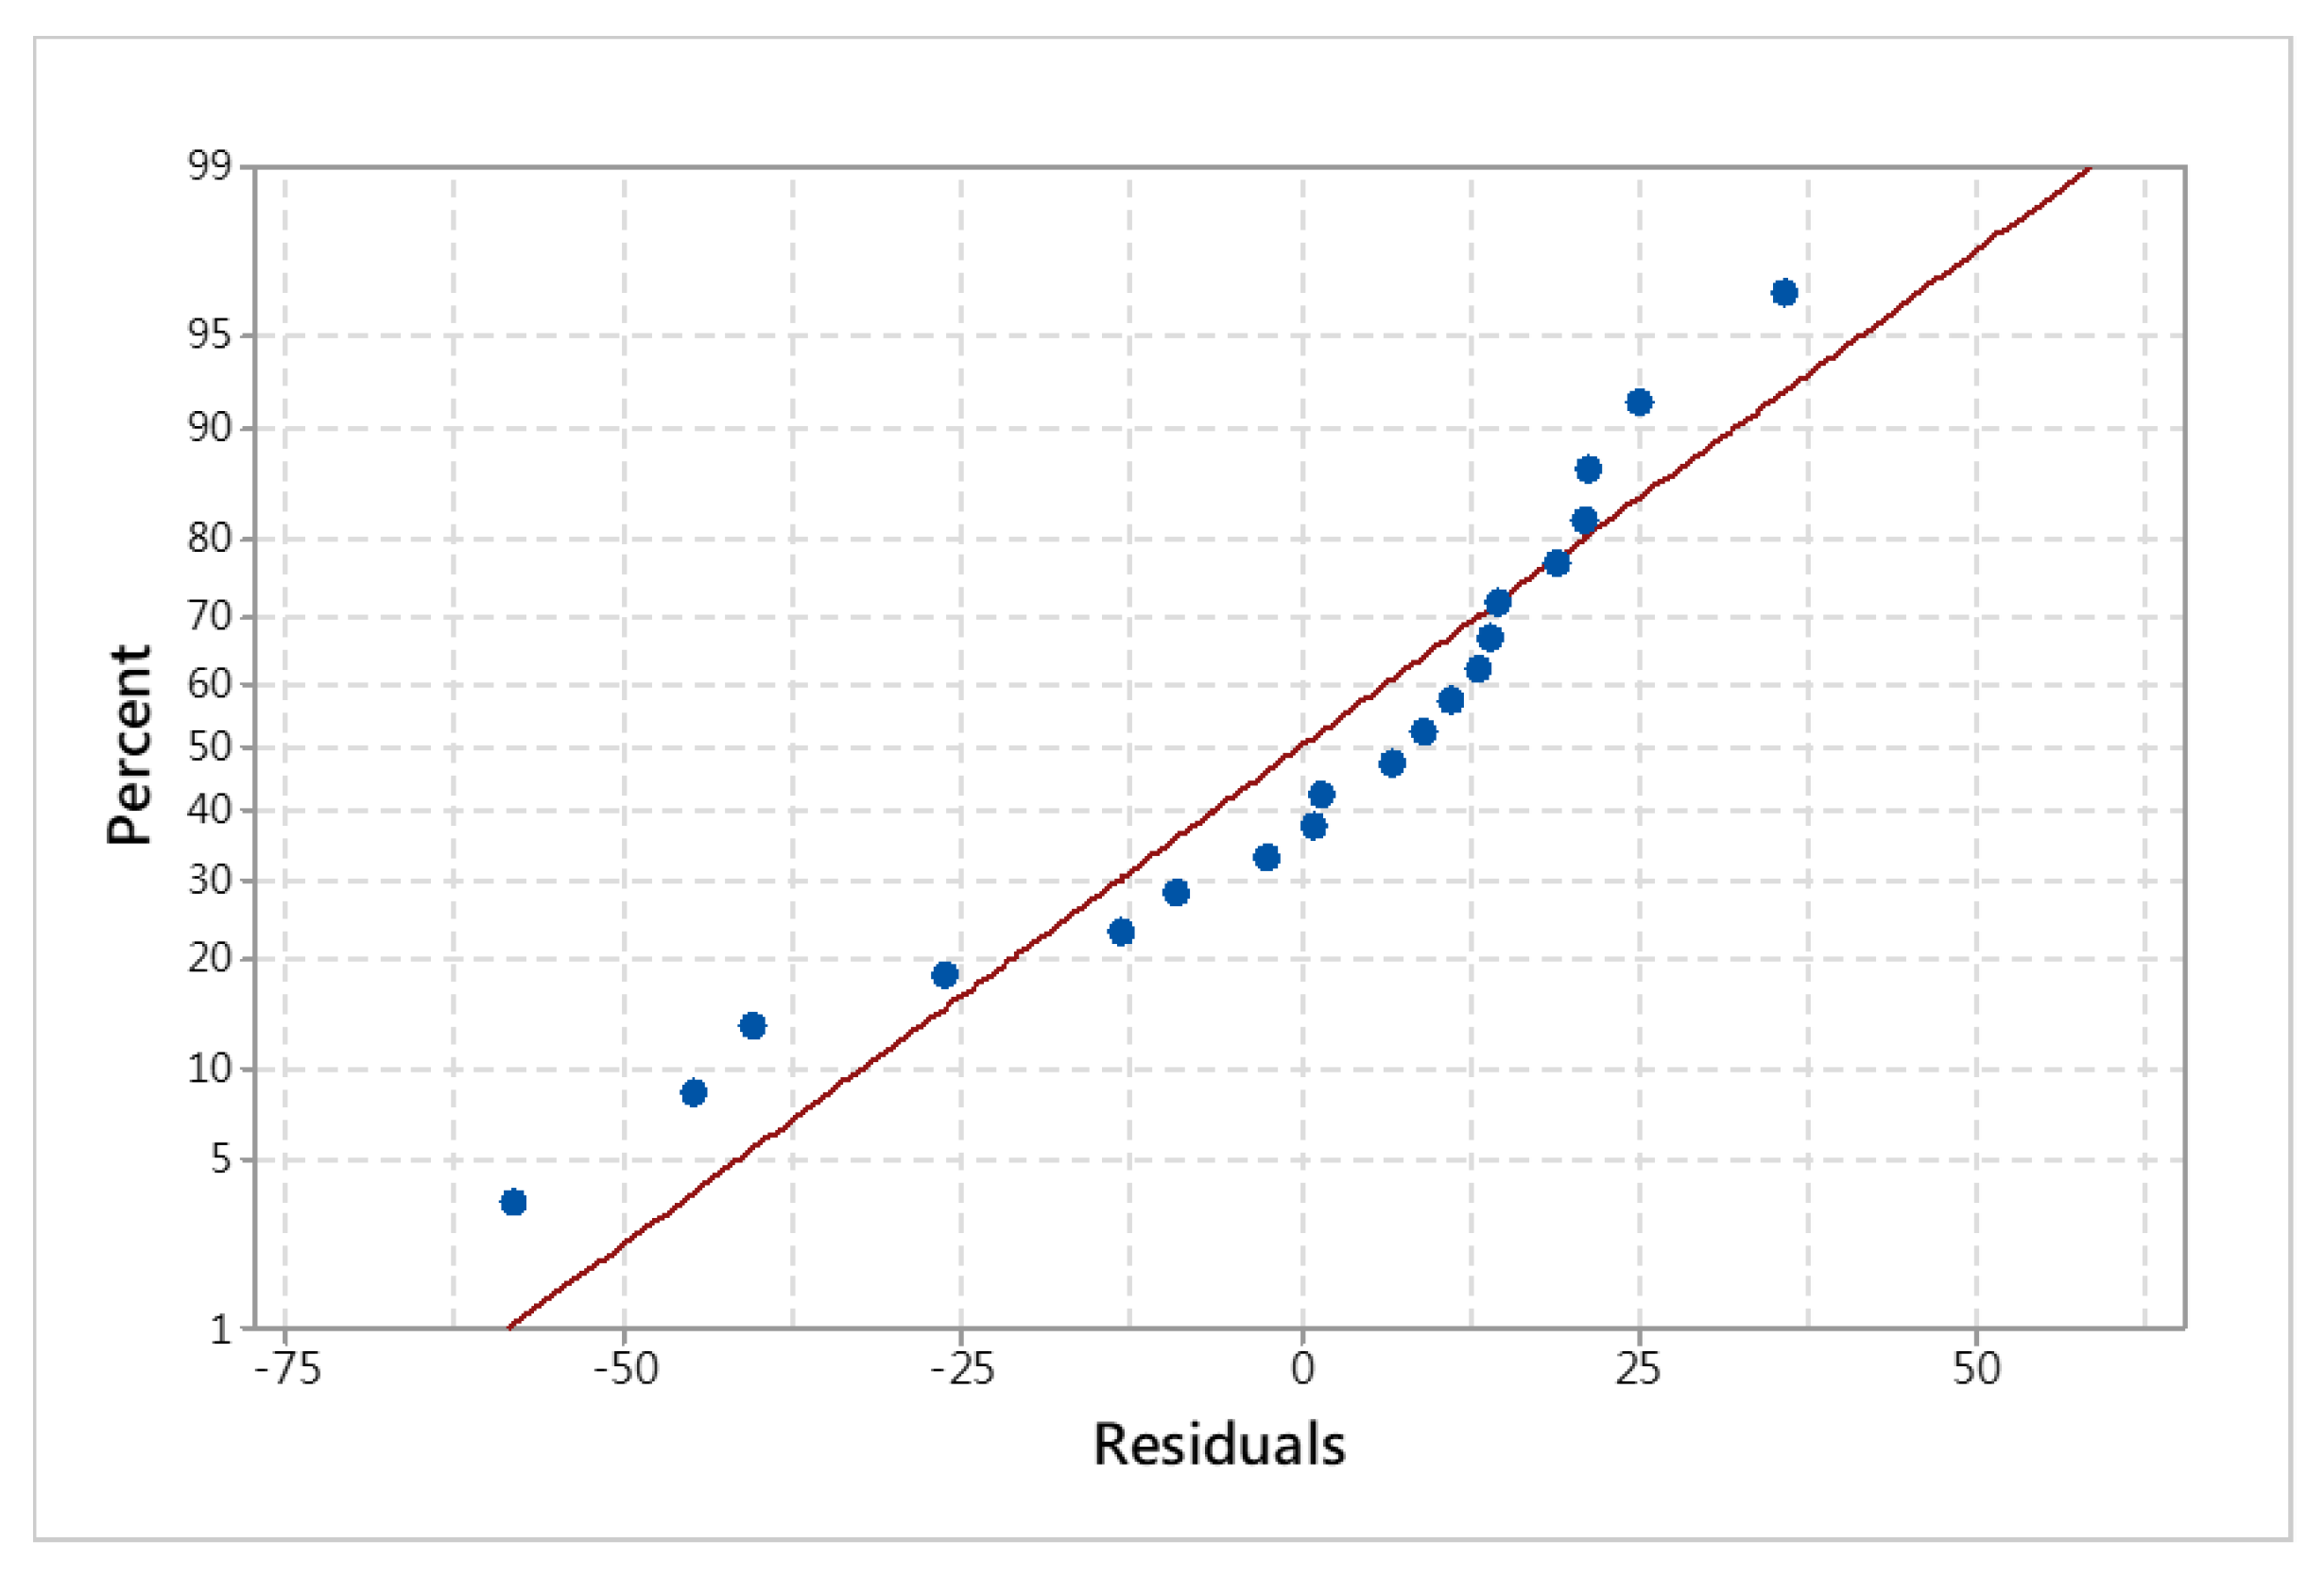
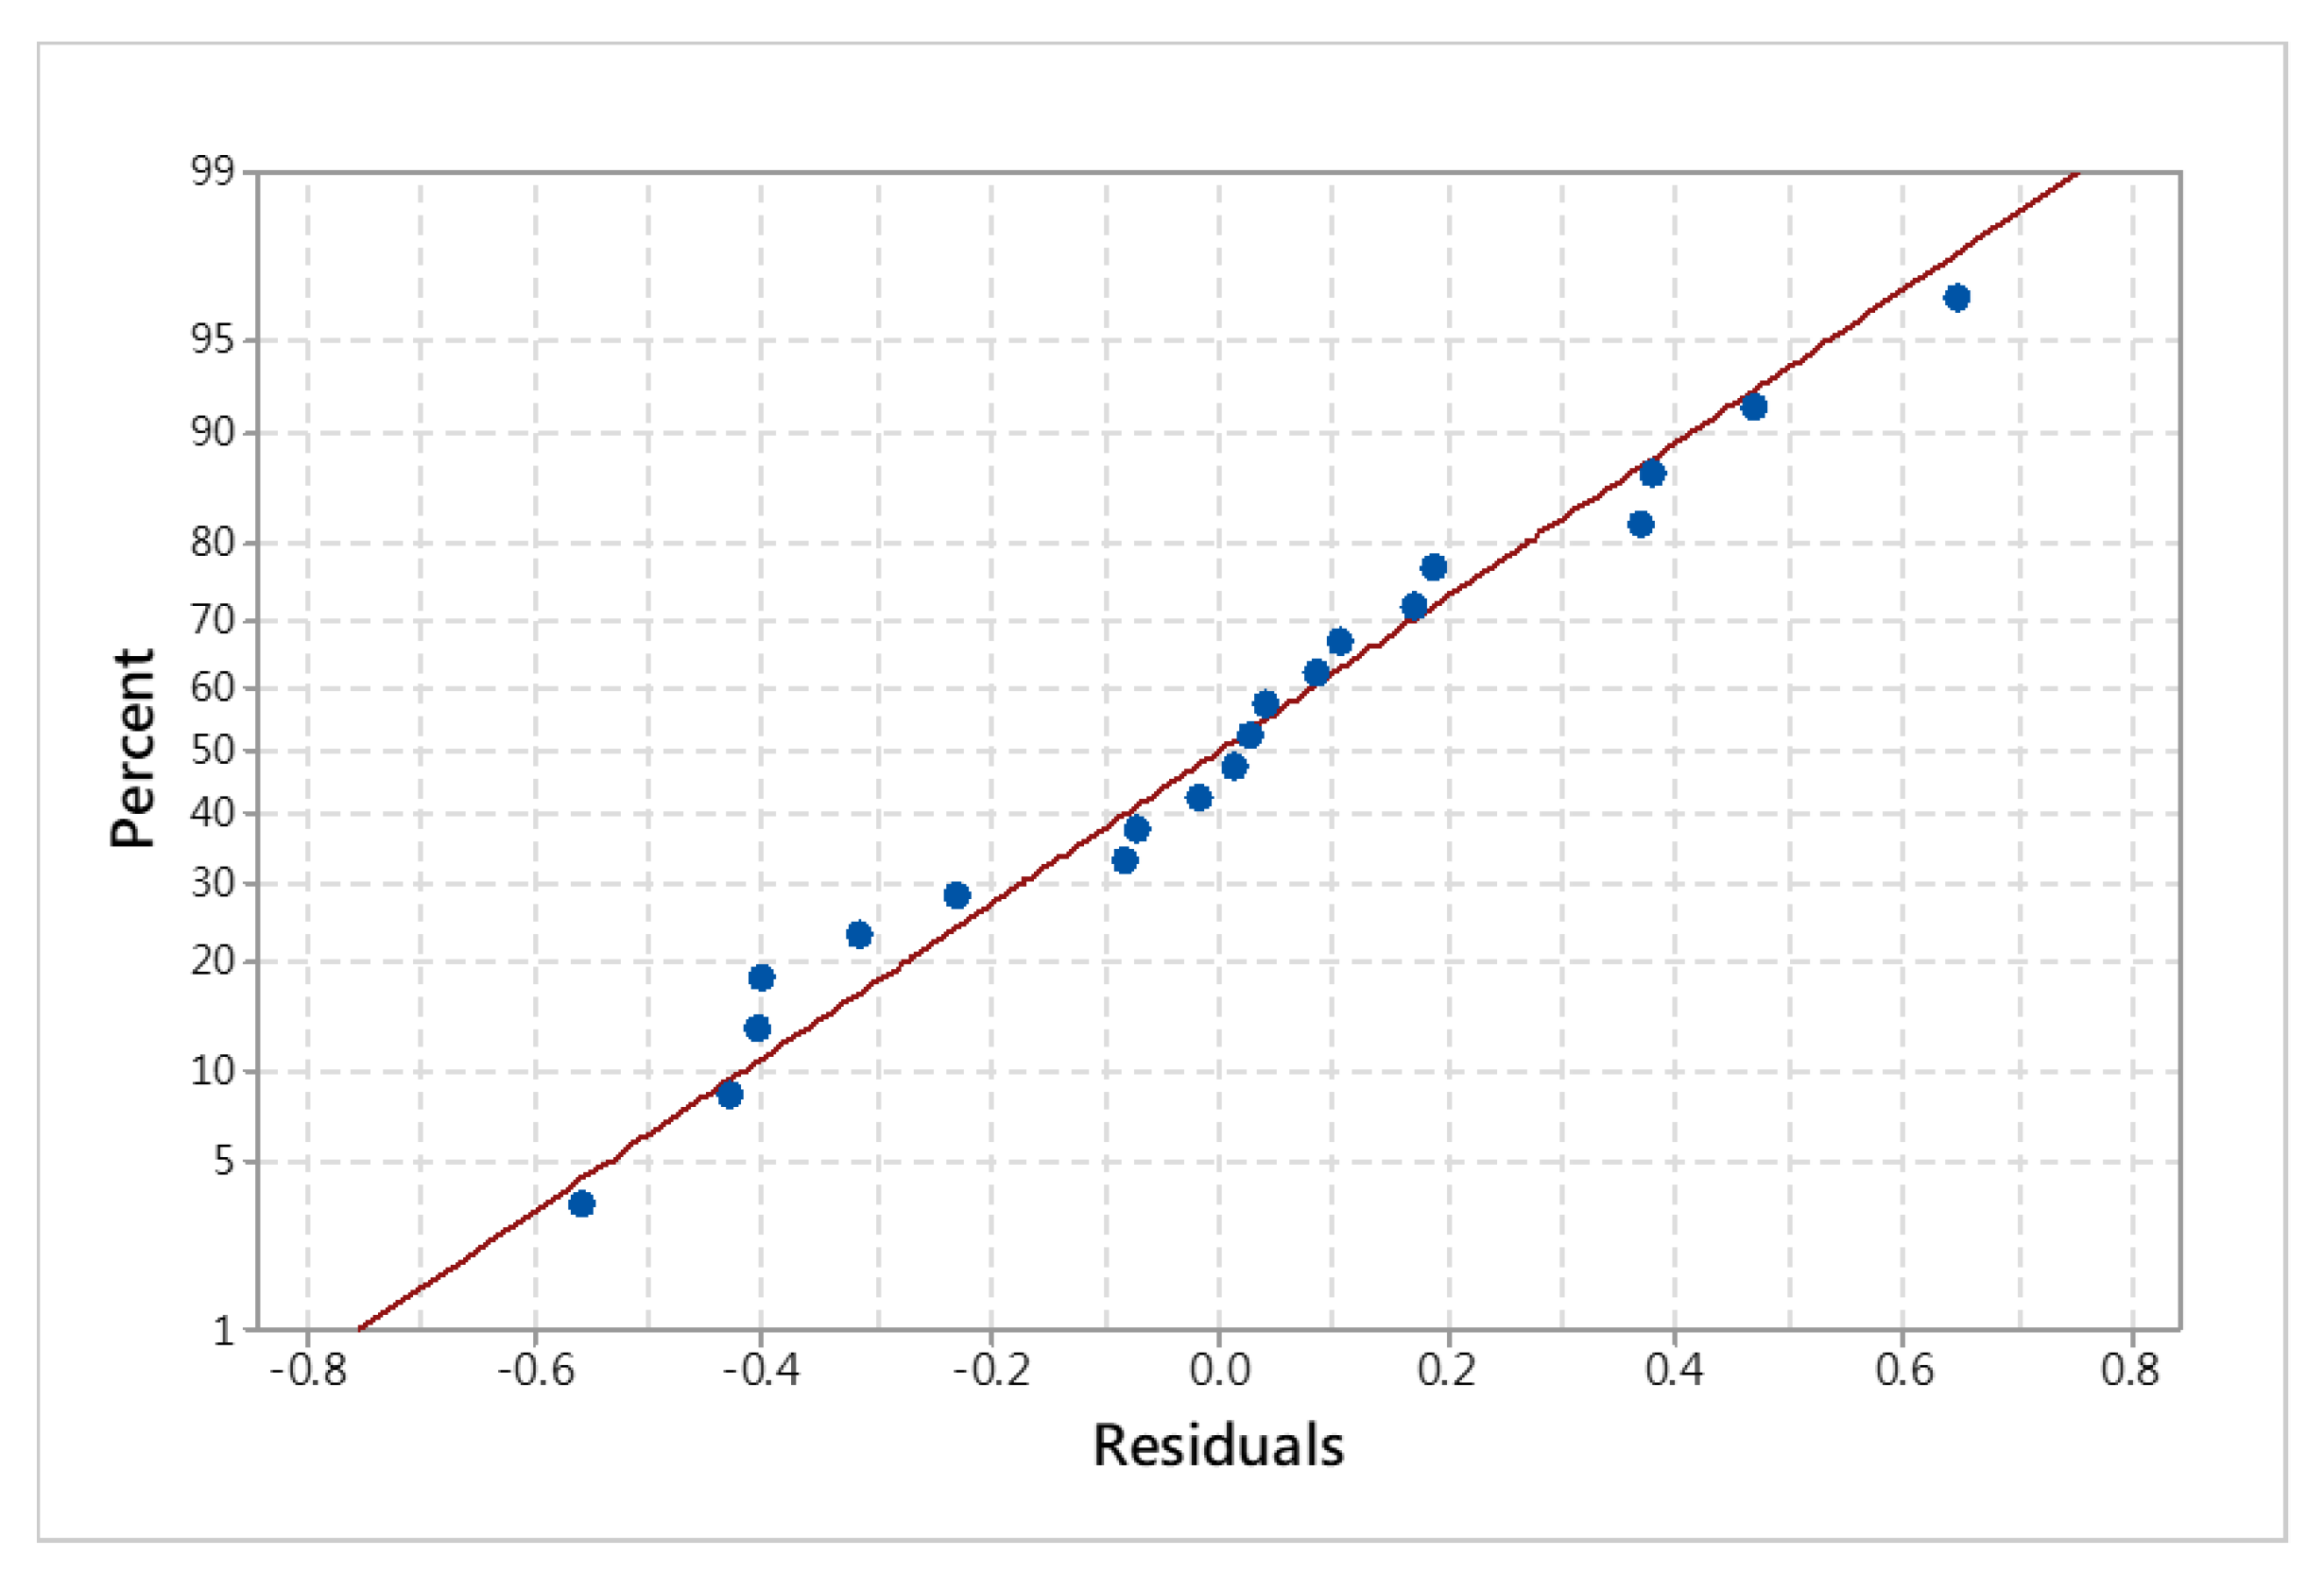
The effect of the lack-of-fit test is illustrated in Figure 3 and Figure 4. Figure 3 shows the worst case for the amplitude of 256 pixels and IDFitts in the Canon model. Oppositely, Figure 4 shows the excellence of the SQRT_MT model in the A1024/IDarea_Shannon condition. A more significant deviation from the line in Figure 3 implies the violation of residual normality. Oppositely, the residual error of the SQRT_MT model shows a compact fitting with the line in Figure 4.
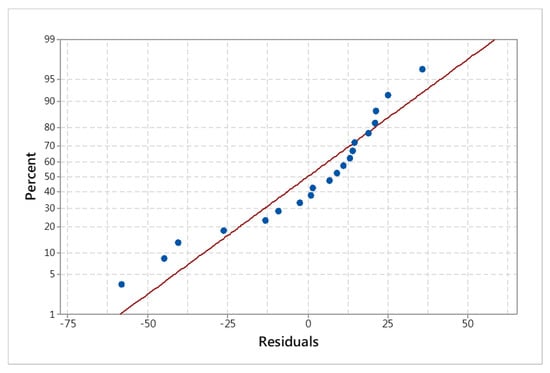
Figure 3.
The residual analysis for A256 and IDFitts in the Canon model shows poor fitting. The p-value, 0.035, was less than the criterion (α = 0.05).
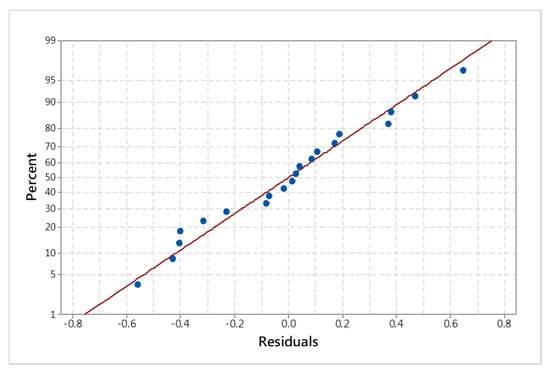
Figure 4.
The residual analysis for A1024 and IDarea_Shannon in the SQRT_MT model shows a good fit with the straight line. The p-value, 0.772, was higher than the criterion (α = 0.05).
4. Discussion
4.1. Purpose 1: The Area of the Geometric Target Is a Factor That Impacts the MT Prediction Accuracy
The pilot study of this research used the information from Sheikh and Hoffmann [15] in dropping the 1D rectangle data. The first reason was that a target of equal width and height was treated as a particular case of a 2D target [5]. Moreover, H/W = 1 seemed to be the boundary between the 1D and 2D targets, according to the results of Accot and Zhai [5]. Another reason was based on the outcome of the pilot study in this research. The R-square of Experiment 1, involving a rectangle, was reported to be 0.919 in the Canon model. The counterpart in Experiment 2 was 0.918. The R-squares for IDSDH were 0.962 and 0.963 in Experiments 1 and 2, respectively [15]. Compared with our pilot study excluding the 1D rectangular target, the R-squares of the Canon model were 0.9435 and 0.9280 for Experiments 1 and 2, respectively. The R-square of IDSDH improved to 0.9611 and 0.9780. The dropping of the 1D target contributed to the improved R-square.
The area was identified as a factor that impacts the performance of the prediction formula of movement time from two aspects. The first one was based on the improved R-square in our pilot study. While the area was applied instead of the width in the index of difficulty, the improvement of the R-square ranged from 3.71% to 5.27%. In the Canon model, IDarea_Fitts resulted in 0.9806 in R-square, which was 3.71% higher than IDFitts in Experiment 1 (Table 1). In Experiment 2, the R-square of IDarea_Fitts was 0.9684, 4.55% higher than IDFitts (Table 2). The same pattern occurred in the Shannon form. IDarea_Shannon achieved 0.9877 in R-square, more than 4.19% than IDShannon did in Experiment 1 (Table 1), and 0.9793 with 5.27% superior in Experiment 2 (Table 2). Similarly, IDarea accomplished more excellently than non-IDarea in the SQRT_MT model. The R-square of IDarea_Fitts was 0.9849/0.9835, which was 3.77%/4.37% higher than IDFitts in Experiments 1 and 2 (Table 1 and Table 2). Oppositely, the R-square of IDarea_Shannon was 0.9793, which increased by 5.27% than IDShannon in Experiment 1 (Table 1). In Experiment 2, IDarea_Shannon hit the highest R-square, 0.9903, a 4.81% increase from IDShannon (Table 2). The difference in the area form between the Canon and the SQRT_MT model was tiny, but the SQRT_MT model was superior to the Canon model robustly.
The second piece of evidence that supported the area of a geometric target impacts the movement time, which was the extended results of this research. From the illustration in Figure 1, the area of the applied shapes in this study is an equilateral triangle, diamond, circle, and square from small to large in sequence. The geometric shape was a significant factor in the movement time, as reported in Section 3.2. The result of a post-hoc test in Table 6 shows the movement time decreased with the area of the shape increased; they are equilateral triangle, diamond, circle, and square in sequence. However, the equilateral triangle and diamond were not significantly different since they were in the same group.
Besides, in the effect of ID type, R-square was consistently higher for IDarea than for non-IDarea in all models and amplitudes (Table 11, Table 12 and Table 13), which implies that IDarea is a better choice for a target of equal width and height. Considering IDarea in the SQRT_MT model, the mean movement times for different shapes could be estimated more precisely. R-square was the highest (0.9772, 0.9841, and 0.9850) for IDarea_Shannon with the SQRT_MT model at all amplitudes (256, 512, and 1024 pixels, respectively). Oppositely, IDFitts in the Canon model had the lowest R-square (0.9650, 0.9403, and 0.9081) at all amplitudes.
Notably, all the models passed the residual normality test except IDFitts in the Canon model, as shown in Table 11. Nine out of twelve formulations applying the traditional IDs, IDFitts, and IDShannon, listed in Table 11, Table 12 and Table 13, failed the lack-of-fit test. Figure 3 and Figure 4 illustrated the normality of the fitting residuals using IDFitts and IDarea_Shannon, respectively. The formula applying IDarea in Table 11, Table 12 and Table 13 demonstrated a stable satisfaction in the essential requirement of the regression analysis. These results imply that IDFitts and IDShannon might not be appropriate for a 1D2D Fitts’ task with a geometric target of equal width and height.
From the results in Table 11, Table 12 and Table 13, we could infer that the mean movement time in the SQRT_MT model adequately fits IDarea at a consistent amplitude from the high R-square, low PRESS/SSE ratio, and satisfied residual normality. The superiority of the SQRT_MT over the Canon model and IDarea_Fitts over IDarea_Shannon is consistent with the result of the pilot study. Such a result shows that area might be a factor that impacts the mean movement time in this specific circumstance.
4.2. Purpose 2: The Area of the Geometric Target Is a Factor That Impacts the Perceived Difficulty
Like the effect in movement time, the index of difficulty could not explain the perceived difficulty of a task. This research has 15 pairs of contrast with the same IDFitts value (Table 7). However, the result does not just render its literal meaning. Only two contrasts do not differ significantly. If the index of difficulty could represent “difficulty,” all the contrasts should be insignificant, or most were not. Following the result’s thread in Section 4.1, we hypothesized that the width and the amplitude confounded the index of difficulty. An ANOVA was conducted with the amplitude, the width, and the geometric shape as the independent variables, and the perceived difficulty was the dependent variable. Similar to the analysis of movement time, all the factors were significant. The post-hoc analysis was performed for further investigation.
To our expectation, both the width of a target and the amplitude between two targets impact the perceived difficulty. Almost the varied width of targets is perceived with different ease (Table 8). Generally, the wider the width is, the less difficulty is perceived. However, when the width is wide enough, like 128–256 pixels, participants felt no difference in the perceived difficulty. While the width is tremendous, 512 pixels, almost no difficulty is perceived (mean is 2.8). Participants could move as fast as possible to hit the target with little concern about hitting outside the target. Also, the definite discrepancy in the amplitudes reflects the precise cut of the perception. The size of the amplitude is positively related to the perceived difficulty (Table 9). Such results matched people’s cognition; a narrower width makes the target hit inaccurately because this movement demands precise control at the approaching stage. The tradeoff between the accuracy and the speed might reflect the perceived difficulty. A more prolonged movement requires larger force, which is achieved by actuating more muscles. More attention is paid to a long movement to control the hitting accurately.
Since there is no research investigating the perceived difficulty on the shape effect of a target in the literature, this is the first study to address this topic. From the analysis of variance, the geometric shape was a significant factor in the perceived difficulty. Table 10 shows the perceived difficulty decreases with the increase of the area of the targets due to the effect of movement time. However, the participants seemed to have better tolerance for the difficulty with a target area. The category of the post-hoc test was not as sharp in movement time. All the pairs with an adjacent size of the area were in the same category. Therefore, the visual effect of geometric shapes might influence participants’ perception of difficulty. The size of the area of targets in this study could be identified visually without hardship. Another potential reason is still related to the tradeoff between accuracy and speed. A smaller area might slow the moving rate similar to what the width of the target does. All the geometric shapes applied in this study have the same width. However, the size of the area is different, which might contribute to decelerating the moving speed at the approaching stage more than the width does. Namely, the influence of the area of a target on the perceived difficulty is valid.
4.3. Purpose 3: Fitts’ Law Should Be Applied with Varied ID under the Same Amplitude
Although the result of the pilot study showed that the IDarea performed better than the traditional IDFitts, the application of only one amplitude (320 mm) with three, four, five, and six indexes of difficulties [15] limits its validation of the second purpose of this research. More importantly, a low IDFitts value of less than six causes the upward curve [4,21,22], which was not considered in Sheikh and Hoffmann’s work [15]. Moreover, as the research guide of Fitts’ law [23] suggested, a broad range of the index of difficulty should be applied. Therefore, the upward curve phenomenon at the IDFitts value of less than three is still a challenge to the excellent result in our pilot study. Accordingly, this study extended Sheikh and Hoffmann’s work [15] with more amplitudes.
Fitts claimed that movement time was proportional to the index of difficulty [2]. Under such a declaration, all the contrasts of movement time with the same IDFitts value should be no different in this study. However, only 5 out of 15 contrasts were not significantly different (Table 3). The results of IDFitts values of four to six in Table 3 are difficult to explain; a confounding effect might have been caused by fusing A and W into IDFitts as claimed by Guiard [24]. These confusing results are consistent with what Lin and Cheng reported in a 1D1D task [11]. Table 4 and Table 5 show that each target width and amplitude between targets contribute to movement time at different levels. Lin and Cheng suggested that the prediction formula of movement time should be utilized only under the same amplitude with varied widths of targets [11]. Table 11, Table 12 and Table 13 follow their suggestion and represent the regression formula in three amplitudes with IDarea ranging from two to six to with excellent R-square, lack-of-fit, and residual normality. The superiority of R-square, lack-of-fit, and residual normality implies that the SQRT_MT model with IDarea conquers the defect of the upward curve in the Canon model. Consequently, the current study results remedy the gap of fewer IDs in the literature. Moreover, these achievements validate the extension of our previous work [11] that Fitts’ law should be applied under the same amplitude with varied widths of targets.
4.4. General Discussion
Table 14 shows the stereotype of the ID in a Fitts task. Generally, ID is positively related to the mean movement time and the perceived difficulty. However, our research investigated ID(A) profoundly and produced consistent results on the effect of ID(A) on the mean movement time (Table 3) and the subjectively perceived difficulty (Table 7). The results indicated that the dependent variables were not mostly identical for the same ID value but varying amplitude. The ID could not entirely explain the cause–effect relationship.
Table 14.
Main effects of ID for mean MT and perceived difficulty.
Instead of ID, the target’s width and the movement amplitude provide straightforward explanations for the dependent variables. A longer movement amplitude takes more movement time (Table 5) and makes it more challenging to finish a task (Table 13). All three movement amplitudes were significantly different in MT and perceived difficulty. In addition, a broader target is easy to hit fast (Table 4) and results in less perceived difficulty (Table 8). Varied target width contributes to MT significantly. However, the effect of target width might be replaced by the area of the target in the 1D2D. The reason is that the width is positively related to the area. Consequently, the effect of width could be involved in the effect of the area. This result might explain why using the area of a geometric target instead of its width in the index of difficulty, IDarea, performs better than non-IDarea in Fitts’ law.
Target shape had a consistent effect on the dependent variables. In the stated order, the equilateral triangle, diamond, circle, and square had negative relationships with the dependent variables, from high to low. The magnitude of the area of these geometric shapes is the same as this order (Figure 1), which implies the volume of the area in geometric shapes of equal width and height might determine the effects on the dependent variables. The larger the area is, the faster the target can be hit (Table 6) and the lower the perceived difficulty (Table 10).
An equilateral triangle and a diamond with the same area might explain their effects on MT in the same group. Interestingly, the perceived difficulty seemed to be affected by the area and the central width simultaneously. Therefore, participants might perceive the equilateral triangle and the diamond as having the same difficulty due to their identical volumes, but the central width determined the order. Oppositely, the diamond and the circle have the same central width, but the circle has a larger area. Therefore, their perceived difficulty does not differ significantly, but the diamond is a little more difficult than the circle. The same reason exists between the circle and the square.
Investigations into the effects of target shape are limited in the literature [15]. To the best of our knowledge, only one other work, by Grossman et al. [13], applied 10 arbitrary shapes. A probabilistic model with three varied IDprob was used to predict movement time. The R-squares were reported to be 0.93, 0.93, and 0.94 for the IDprob estimated from three different definitions for the center of shapes. Sheikh and Hoffmann’s IDSDH is the same concept of the effective index of difficulty (IDe) applying the effective width (We) proposed by Soukoreff and MacKenzie [23]. Thus, IDe cannot be determined in the design stage of a product or a system. Accot and Zhai [5] applied Sheikh and Hoffmann’s [15] data in the lp-norm model and found excellent R-squares of 0.959–0.994. Therefore, the lp-norm model might require three more post-calculation parameters. Estimating three extra parameters is complicated and thus not easy to calculate. Another disadvantage of post-calculation is that a researcher does not have any information about his design’s IDs before the empirical data is available. In contrast, the proposed IDarea does not need post-calculation and is easy to implement in the design phase. Researchers can design the desired value for their applications’ difficulty index in advance.
5. Conclusions
The major contribution of the current study is that the proposed modified IDarea applied in the SQRT_MT model represents a more precise cause–effect relationship with the movement time in a 1D2D task. On the other hand, most applications in a 1D2D Fitts task just applied the traditional formula Equations (1)–(3). Consequently, the current research contributes to filling the gap on this topic in the literature. Therefore, the results of the present study may be summarized as follows:
- The target’s shape might impact the movement time and the subjective difficulty in participants’ perceptions (Table 14). A square object with the largest area and central width is recommended in the design of an application with equal width and height of a target.
- The SQRT_MT model with the proposed IDarea is recommended for application in a 1D2D Fitts task with varied shapes in 2D targets. When the non-IDarea was applied, the lack-of-fit test was failed or poor. Therefore, using IDarea to satisfy the statistical principle is the primary advantage over non- IDarea.
Despite the SQRT_MT model with IDarea’s advantages, it does have some limitations. First, we assume that the researcher considers varied geometrical shapes in his application. Under such a circumstance, the proposed SQRT_MT model and IDarea in this research exhibit their benefits. On the other hand, if only one shape is utilized, any ID definition has the same effect on the regression formula. Thus, the traditional IDFitt or IDShanoon could work excellently. However, we must remember that the same non-IDarea value for different geometrical shapes is not an identical difficulty index inherently. Second, the geometrical shapes must be convex with equal width and height. A concave graph has more complicated effects on the perceived difficulty and the physical hitting constraints, which does not apply to our proposal.
More effort should be focused on 2D shapes, for most applications nowadays use 2D targets. However, the movement in real life is 2D or 3D. Future studies are suggested on extending the SQRT_MT model to 2D2D and 3D2D Fitts’ tasks. Also, the participants were young adults in this research. The researchers should remember this limitation when the product is designed for aged people. Age was identified as a factor impacting the performance of Fitts’ Paradigm [25]. Therefore, future research on a 1D2D movement for old persons is also recommended.
Author Contributions
Conceptualization, C.J.L. and C.-F.C.; methodology, C.-F.C.; software, C.-F.C.; validation, C.J.L. and C.-F.C.; formal analysis, C.-F.C.; investigation, C.J.L. and C.-F.C.; resources, C.J.L.; data curation, C.-F.C.; writing—original draft preparation, C.-F.C.; writing—review and editing, C.J.L.; visualization, C.-F.C.; supervision, C.J.L.; project administration, C.J.L. All authors have read and agreed to the published version of the manuscript.
Funding
This research received no external funding.
Institutional Review Board Statement
The study was conducted according to the Declaration of Helsinki guidelines and approved by the Ethics Committee of National Taiwan University.
Informed Consent Statement
Informed consent was obtained from all subjects involved in the study.
Acknowledgments
The authors would like to thank Yi-Chun Lin and Ching-Yu Lin for their assistance in recruiting the participants, conducting the experiment, and collecting raw data.
Conflicts of Interest
The authors declare no conflict of interest.
References
- Card, S.K.; English, W.K.; Burr, B.J. Evaluation of mouse, rate-controlled isometric joystick, step keys, and text keys for text selection on a CRT. Ergonomics 1978, 21, 601–613. [Google Scholar] [CrossRef]
- Fitts, P.M. The information capacity of the human motor system in controlling the amplitude of movement. J. Exp. Psychol. 1954, 47, 381. [Google Scholar] [CrossRef] [PubMed] [Green Version]
- Fitts, P.M.; Peterson, J.R. Information capacity of discrete motor responses. J. Exp. Psychol. 1964, 67, 103. [Google Scholar] [CrossRef] [PubMed]
- Hoffmann, E.R.; Sheikh, I.H. Effect of varying target height in a Fitts’ movement task. Ergonomics 1994, 37, 1071–1088. [Google Scholar] [CrossRef]
- Accot, J.; Zhai, S. Refining Fitts’ law models for bivariate pointing. In Proceedings of the SIGCHI Conference on Human Factors in Computing Systems, Ft. Lauderdale, FL, USA, 5–10 April 2003; pp. 193–200. [Google Scholar]
- MacKenzie, I.S.; Buxton, W. Extending Fitts’ law to two-dimensional tasks. In Proceedings of the SIGCHI Conference on Human Factors in Computing Systems, New York, NY, USA, 3–7 May 1992; pp. 219–226. [Google Scholar]
- Hoffmann, E.R.; Drury, C.G.; Romanowski, C.J. Performance in one-, two-and three-dimensional terminal aiming tasks. Ergonomics 2011, 54, 1175–1185. [Google Scholar] [CrossRef] [PubMed]
- Murata, A.; Iwase, H. Extending Fitts’ law to a three-dimensional pointing task. Hum. Mov. Sci. 2001, 20, 791–805. [Google Scholar] [CrossRef] [Green Version]
- Cha, Y.; Myung, R. Extended Fitts’ law for 3D pointing tasks using 3D target arrangements. Int. J. Ind. Ergon. 2013, 43, 350–355. [Google Scholar] [CrossRef]
- Meyer, D.E.; Abrams, R.A.; Kornblum, S.; Wright, C.E.; Keith Smith, J. Optimality in human motor performance: Ideal control of rapid aimed movements. Psychol. Rev. 1988, 95, 340. [Google Scholar] [CrossRef] [PubMed]
- Lin, C.J.; Cheng, C.-F. A New Approach to Modeling the Prediction of Movement Time. Mathematics 2021, 9, 1585. [Google Scholar] [CrossRef]
- Nathan, A. WPF 4.5 Unleashed; Sams Publishing: Carmel, IN, USA, 2013. [Google Scholar]
- Grossman, T.; Kong, N.; Balakrishnan, R. Modeling pointing at targets of arbitrary shapes. In Proceedings of the SIGCHI Conference on Human Factors in Computing Systems, San Jose, CA, USA, 28 April–3 May 2007; pp. 463–472. [Google Scholar]
- Jagacinski, R.J.; Monk, D.L. Fitts’ Law in Two dimensions with hand and head movements movements. J. Mot. Behav. 1985, 17, 77–95. [Google Scholar] [CrossRef] [PubMed]
- Sheikh, I.H.; Hoffmann, E.R. Effect of target shape on movement time in a Fitts task. Ergonomics 1994, 37, 1533–1547. [Google Scholar] [CrossRef] [PubMed]
- Chan, A.H.; Hoffmann, E.R. Subjective difficulty of movements with ongoing visual control. J. Mot. Behav. 2013, 45, 507–517. [Google Scholar] [CrossRef] [PubMed]
- Johansson, S.-E.; Borg, G. Perception of heavy work operations by tank truck drivers. Appl. Ergon. 1993, 24, 421–426. [Google Scholar] [CrossRef]
- Zhai, S.; Kong, J.; Ren, X. Speed–accuracy tradeoff in Fitts’ law tasks—on the equivalency of actual and nominal pointing precision. Int. J. Hum. Comput. Stud. 2004, 61, 823–856. [Google Scholar] [CrossRef]
- Kirk, R.E. Research strategies and the control of nuisance variables. In Experimental Design: Procedures for the Behavioral Sciences; SAGE: Ventura, CA, USA, 2013; pp. 1–30. [Google Scholar]
- Bower, K.M. Analysis of Variance (ANOVA) using MINITAB. Sci. Comput. Instrum. 2000, 17, 64–65. [Google Scholar]
- Sleimen-Malkoun, R.; Temprado, J.-J.; Huys, R.; Jirsa, V.; Berton, E. Is Fitts’ law continuous in discrete aiming? PLoS ONE 2012, 7, e41190. [Google Scholar] [CrossRef] [PubMed]
- Welford, A.T. The measurement of sensory-motor performance: Survey and reappraisal of twelve years’progress. Ergonomics 1960, 3, 189–230. [Google Scholar] [CrossRef]
- Soukoreff, R.W.; MacKenzie, I.S. Towards a standard for pointing device evaluation, perspectives on 27 years of Fitts’ law research in HCI. Int. J. Hum. Comput. Stud. 2004, 61, 751–789. [Google Scholar] [CrossRef]
- Guiard, Y. The problem of consistency in the design of Fitts’ law experiments: Consider either target distance and width or movement form and scale. In Proceedings of the SIGCHI Conference on Human Factors in Computing Systems, Boston, MA, USA, 8 April 2009; pp. 1809–1818. [Google Scholar]
- Welford, A.T.; Norris, A.; Shock, N. Speed and accuracy of movement and their changes with age. Acta Psychol. 1969, 30, 3–15. [Google Scholar] [CrossRef]


Publisher’s Note: MDPI stays neutral with regard to jurisdictional claims in published maps and institutional affiliations. |
© 2022 by the authors. Licensee MDPI, Basel, Switzerland. This article is an open access article distributed under the terms and conditions of the Creative Commons Attribution (CC BY) license (https://creativecommons.org/licenses/by/4.0/).