Abstract
Working capital management is one of the decisive factors in increasing business performance through the efficient use of current assets such as inventories, receivables, funds, and current liabilities. The primary aim is to identify how working capital management using a wide range of liquidity and activity indicators affects the corporate performance of transport companies broken down by company size into small, medium, large, and very large companies in Slovakia and the Czech Republic using multiple linear regression analysis with achieving competitive R-square as a relevant statistical metric compared to other models from previous research. Our research focuses on a different industry than the traditional production industry. Descriptive statistics show that more than half of the assets are impelled assets in the corporate finances of transport companies. We deal with the impact of working capital management on corporate performance, considering the corporate size. This output delivers specific findings for small, medium, large, and very large businesses separately. All multiple linear regression models for estimating corporate performance are proposed for transport companies in the Czech and Slovak Republics. The results show that liquidity has a negative impact, in contrast to activity indicators except for DPO, on corporate performance in Czech transport companies. On the other hand, Slovak small, medium, and large enterprises must effectively manage free cash and cash equivalents, too. However, activity indicators, except DRO for an aggregated group of large and very large enterprises, also harm business performance. These outputs are beneficial for business management and making relevant decisions to increase business performance, the models identify the strengths and weaknesses of working capital management. In general, this research helps to make specific decisions focused on receivables, inventory management, and cash management as part of working capital management.
MSC:
62P20; 91B02; 91B82
1. Introduction
Working capital management is one of the crucial aspects of effectively increasing business performance. Companies try to take effective action to increase business performance for a variety of reasons. Business performance is one of the key indicators in selecting and deciding on a profitable investment.
The primary aim of the paper is to identify how working capital management using a wide range of liquidity and activity indicators affects the corporate performance of transport companies broken down by company size into small, medium, large, and very large companies in Slovakia and the Czech Republic using multiple linear regression analysis with achieving competitive R-square as a relevant statistical metric compared to other models from previous research.
Our research focuses on the impact of working capital management described by a wide range of independent indicators on business performance. These findings lead to decision-making in management to increase business performance and effectiveness of working capital management with a focus on inventory management, receivables management, cash management, and liability management. Statistically significant indicators identify the relevant pillars in working capital management.
Working capital management is typical for manufacturing industries [,], but our research focuses on transport companies in two Central European countries such as Slovakia and the Czech Republic. Transport companies are an important pillar in the economy of any state because the transport of raw materials, goods, and people represent an impetus for economic growth. If transport companies are inefficient, the economy stagnates. In addition, the transport sector is chosen because descriptive statistics determine that the asset structure includes more than half of the current assets. These findings demonstrate that working capital management plays an important role in the transport sector in both countries.
This research includes a comprehensive approach to identifying significant indicators of working capital management. The initial set of independent indicators is collected from previous research. These indicators only describe working capital management, some previous research includes other indicators [,,]. The research differs from others because the outputs demonstrate theoretical and empirical knowledge for an atypical sector such as the transport sector. Many Czech and Slovak transport companies import/export products for strategic locations in Central Europe. In addition, the output contains specific findings for transport enterprises broken down by size into small, medium, large, and very large enterprises. In other words, our research considers the company size as a specific aspect of working capital management.
These results are beneficial for business management and making relevant decisions to increase business performance, the models identify the strengths and weaknesses of working capital management. This research helps to make specific decisions focused on receivables, inventory management, and cash management as part of working capital management to increase business performance. In addition, the output provides a new comprehensive approach to identifying statistically significant variables, removing outliers, and eliminating high multicollinearity for determining significant models with competitive R-square metrics compared to other research in this area using multiple linear regression analysis. Our research contributes to the development of current knowledge on working capital management, especially for specific transport sectors in Slovakia and the Czech Republic. The output helps to identify the strengths and potential threats to the future to effectively approach working capital management as an essential component for achieving synergies in business.
Finally, the paper consists of the introduction, theoretical background, research methodology, results, discussion, and conclusion. The literature review summarizes previous research on working capital management to determine potentially significant variables affecting business performance. The methodology describes the overall sample broken down by country and company size. In addition, financial and non-financial indicators are summarized based on theoretical and empirical knowledge of corporate finance. The overall process consists of several steps such as sample description using descriptive statistics and correlation, removal of outliers using Cook distance, identification of multicollinearity using VIF and CI, and propose of a multicriteria linear regression models for Slovak and Czech companies in the transport sector. The discussion argues about the results of our research with previous knowledge. These key findings bring new knowledge to academics and practitioners.
2. Literature Review
Working capital management is the management of current assets and current liabilities as one of the basic pillars in corporate finance to increase corporate performance. This managerial tool is an important part of decision-making in financial management for business success.
The bibliographic analysis demonstrates that the issues of working capital management and performance are dealt with by 67 outputs as scientific papers and contributions from proceedings based on the keywords as working capital management and profitability as part of the paper titles according to the Web of Science database. Figure 1 shows that these outputs are independent of previous outputs. As can be seen, most scientific outputs about working capital management are published before 2019.
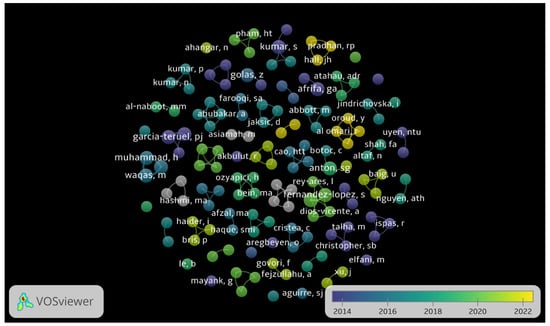
Figure 1.
Bibliographic analysis I.
Figure 2 analyzes the most frequent words found in the abstract according to the Web of Science database using VOSviewer 1.6.18 by Nees Jan van Eck and Ludo Waltman at Leiden University’s Centre for Science and Technology Studies (CWTS) in the Netherlands. As can be seen, the food industry, the manufacturing industry, the pharmaceutical industry, the automotive industry, and the food industry are typical industries for investigating working capital management and its impact on business performance. Moreover, the results show that this research is primarily focused on non-European countries such as Asian and Indian companies, in other words on small and medium-sized companies in emerging countries, but also Czech companies. This issue is based on a meta-analysis of the financial indicators for deciding on the optimal working capital management strategy.
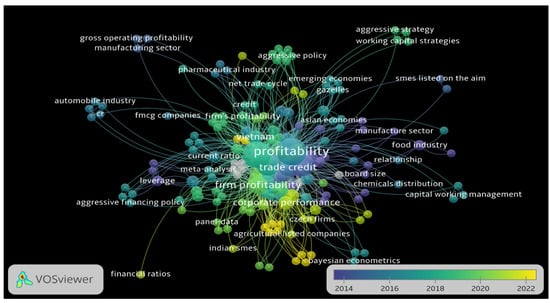
Figure 2.
Bibliographic analysis II.
The study on effective working capital management from South-eastern European countries such as Slovenia, Croatia, Montenegro, Serbia, Bosnia and Herzegovina, Romania, Bulgaria, North Macedonia, and Turkey demonstrates that days payable outstanding and cash conversion cycle have a significant negative impact on business performance compared to days receivable outstanding. This study recommends shortening the days receivable outstanding and cash conversion cycle []. However, Croatian IT companies are typical for a non-linear concave relationship between return on assets and working capital []. Most other indicators such as current ratio, current liabilities to total assets, and total liabilities to total capital affect the performance of food businesses in Serbia. This study extends previous research on the impact of effective working capital management on corporate performance. The results demonstrate that the debt level does not affect profitability []. Effective management of working capital represents an important pillar attribute with a direct impact on corporate survival, solvency, and performance [].
The research on effective working capital management in the Polish food sector has shown that large enterprises are the most efficient in terms of cash conversion cycle and profitability than others at the national level. Profitability is negatively correlated with the inventory cycle, accounts receivable cycle, and current liabilities cycle. The presented regression models explain 50–61% of the variability of the return on non-financial assets in small food companies, 26–40% of the variability in medium-sized food companies, and 29–34% of the variability in very large food companies []. Measuring efficiency uses a wide range of exogenous factors in the Indian manufacturing sector. The change in efficiency and the scale efficiency change is measured using data envelopment analysis (DEA) and the Malmquist index based on 1074 companies in the manufacturing sector from 2004 to 2013. The findings reveal that sales growth, profitability, debt ratio, and return on assets have an impact on the effectiveness of working capital management []. Working capital management is the current assets and liabilities management. The impact of corporate governance on WCM in companies listed on the Tehran Stock Exchange from 2008 to 2013 is analyzed according to various variables such as liabilities, cash conversion cycle, cash holdings, current ratio, and working capital management efficiency. The results prove that corporate governance plays a significant role in working capital management []. On the other hand, internal management damages the cash conversion cycle [].
The higher working capital threatens profitability, lower working capital threatens the company’s solvency []. The impact of working capital management on profitability in small and medium-sized enterprises in Nigeria using regression analysis based on 311 Nigerian SMEs from 2007 to 2013 demonstrates a statistically significant relationship between the account receivables period, cash holdings, and cash conversion efficiency on return on assets. Small and medium-sized enterprises should focus on optimizing receivables, payables, and cash to increase the company profitability []. The other research on working capital management on corporate performance based on nine banks on the Ghana Stock Exchange (GSE) shows that the independent variables except for the exception of size do not affect working capital management. The cash conversion cycle, financial assets/total assets, (interest received−interest receivedt−1)/interestt−1, and debt ratio have insignificant effects on working capital management []. The relationship between working capital management and the performance of small and medium-sized enterprises was analyzed in Croatia. Companies should avoid late payments to suppliers and increase inventory turnover []. Other Central European research on the impact of working capital management on profitability includes [,].
Our research analyses how working capital management using a wide range of liquidity and activity indicators affect the corporate performance of transport companies broken down by company size into small, medium, large, and very large companies in Slovakia and the Czech Republic using multiple linear regression analysis with achieving competitive R-square as a relevant statistical metric compared to other models from previous research. The partial aims are to determine the positive or negative impact of working capital management indicators on corporate performance and to identify differences between Slovak and Czech companies in the transport sector.
Based on previous research and expert knowledge on working capital management in corporate finance, hypotheses are formulated regarding the impact of selected indicators of liquidity and activity on the business performance of transport companies.
H1.
OPF has a statistically significant impact on corporate performance.
H2.
CAR has a statistically significant impact on corporate performance.
H3.
OPF has a statistically significant impact on corporate performance.
H4.
CAR has a statistically significant impact on corporate performance.
H5.
QUR has a statistically significant impact on corporate performance.
H6.
CUR has a statistically significant impact on corporate performance.
H7.
INT has a statistically significant impact on corporate performance.
H8.
ART has a statistically significant impact on corporate performance.
H9.
CAT has a statistically significant impact on corporate performance.
H10.
DIO has a statistically significant impact on corporate performance.
H11.
DCA has a statistically significant impact on corporate performance.
H12.
DRO has a statistically significant impact on corporate performance.
H13.
DPO has a statistically significant impact on corporate performance.
H14.
COC has a statistically significant impact on corporate performance.
H15.
CCC has a statistically significant impact on corporate performance.
H16.
CATA has a statistically significant impact on corporate performance.
H17.
COU has a statistically significant impact on corporate performance.
H18.
COM has a statistically significant impact on corporate performance.
Our research examines how the working capital management described by a wide range of independent indicators affects the business performance of transport companies broken down from the company size to small, medium, large, and very large companies in Slovakia and the Czech Republic. Descriptive statistics reveal that on average, current assets in a transport company account for more than half of the asset structure. The output demonstrates that working capital management should be part of every transport company. This research differs from previous ones because many researchers traditionally focus on manufacturing industries in developing countries. Our research focuses on the atypical industry as a transport sector in the countries of Central Europe. Transport companies are a major impetus for economic growth in every country. In addition, the research is based on a comprehensive methodology to identify significant variables from previous research from various authors with an impact on business performance. These indicators are partially eliminated due to high multicollinearity and the creation of specific models by multiple linear regression analysis. These models are specific to transport companies depending on the company size according to [].
3. Research Methodology
The paper analyzes the impact of working capital management on the performance of transport companies specifically on based selected independent variables describing liquidity and activity ratios as a part of working capital management. First, the association between independent variables and profitability from the point of view of company size (small, medium, large, and very large enterprises) was determined based on the classification in Table 1. Second, significant variables and statistical metrics of all regression models were compared to selected indicators of working capital management from the wide range of theoretical and empirical findings of relevant authors from previous research from all over the world using multiple linear regression analysis.

Table 1.
The classification of enterprises.
The overall process includes identifying independent variables and dependent variables based on theoretical and empirical knowledge from previous research as well as professional experience, describing the initial sample using descriptive statistics, analyzing the correlation between independent variables using correlation analysis, analyzing multicollinearity, removing outliers, and modelling business performance using independent variables based only on working capital management. These models were proposed based on a complex process using multiple linear regression analysis in the statistical-analytical program IBM SPSS Statistics Faculty Pack 28. The models consist of statistically significant quantitative and qualitative variables. In addition, an adj. R-square measured the proportion of the variability in the dependent variable about the origin explained by the regression.
3.1. Sample
The total sample comprised 1605 transport companies in the Czech and Slovak Republic in 2019. We used data for 2019 because financial statements were not affected by the worldwide COVID-19 pandemic. Table 2 shows the initial sample broken down by country and enterprise size according to Table 1. As can be seen, more than 60% of the enterprises were medium-sized enterprises. All these sub-samples were separate. These data were drawn from a comprehensive database of European companies from the Bureau van Dijk—A Moody’s Analytics Company [].
Table 2.
Total sample.
3.2. Variables
The corporate performance was expressed as return on assets (ROA), calculated as earnings before interest, tax, depreciation, and amortization (EBITDA) to total assets based on []. Table 3 summarizes financial and non-financial indicators based on a broader literature review from several authors and professional experience in corporate finance.
Table 3.
Independent variables. Source: [].
The bibliographic analysis showed that working capital management was more typical for the manufacturing sector than the transport sector. In other words, the research focus on working capital management in the transport sector is a gap in research offering new opportunities. The total dataset consists of 16 indicators. These indicators were mostly collected from previous research. Many of them were statistically significant in previous research. However, these indicators described working capital management in different sectors. The transport industry, like other industries, has specific characteristics, so we used a wide range of working capital management indicators to determine key indicators for the relevant focus on current asset and current liabilities management.
These indicators describe working capital management in corporate finance, focusing on liquidity and activity indicators. This summarization was based on several studies over the last 10 years. However, these studies were focused, primarily, on manufacturing industries. Many indicators are selected based on previous research (see Table 3). Moreover, the set of independent variables was extended by other quantitative and qualitative variables with a potential impact on business performance such as OPF, CAR, INT, ART, CAT, DCA, COC, CATA, COU, or COM. OPF (operating cash flow ratio) was the only indicator of cash flow. Every company needs to ensure enough cash to pay off obligations to its suppliers or creditors, this is one of the priorities of working capital management. However, a large amount of cash and cash equivalents can have a negative impact on business performance.
Working capital management represents not only a responsible approach to cash management, but also other current assets such as inventories, short-term receivables, and liabilities, therefore the total set of independent indicators also includes INT (inventory turnover), accounts receivable turnover (ART), and current liabilities turnover (CAT). On the other hand, DCA and COC are also included in the research. DCA (days current assets outstanding), like DIO (days inventory outstanding) and DRO (days receivable outstanding), are inverse turnover indicators. In addition, CATA expresses the share of current assets in total assets, this indicator represents the importance of current assets in corporate finances, we assume that with a higher volume of current assets, the importance of taking measures to achieve corporate profitability increases.
Finally, COU (country) and COM (company size) were selected because both countries differ from each other despite their long history together. One of the main factors was that the Slovak Republic is a member of the Eurozone. This attribute reduces business risk and exchange rate differences. Furthermore, the company size was also a factor influencing the enterprise’s performance. In general, larger businesses employ more qualified employees with extensive executive experience. Table 3 reveals shows all used indicators with calculation and positive/negative impact according to selected authors.
3.3. Regression Modeling
The comprehensive approach was applied for assessing corporate performance using selected independent variables of working capital management in various samples. The regression equation examines the association between business performance and working capital management through a multiple linear regression model. The regression model is a statistical method that estimates the relationship between one dependent variable and one or more independent variables (see Equation (1)). The stepwise method identifies statistically significant indicators in a regression model to propose the best function as opposed to the forward method.
where:
- ROA dependent variable,
- intercept,
- coefficients of the independent variables,
- independent variable,
- Ε error.
The linear regression model is based on a linear relationship between the dependent and the independent variables. One of the significant statistical metrics is the determination coefficient (R-squared) measuring how much of the variation in the outcome can be explained by the variation in the independent variables. However, an adjusted R-squared determines the explanatory power of regression models composing different numbers of predictors. The outliers are detected by Cook distance (see Equation (2)) before applying multiple linear regression analysis.
where:
- j-th fitted response value,
- j-th fitted response value, where the fit does not include observation i,
- number of regression coefficients,
- estimated variance from the fit based on all observations (mean squared error).
In addition, multicollinearity is identified by correlation matrix, variance inflation factor (VIF), and collinearity index (CI). VIF detects multicollinearity in the regression model (see Equation (3)). Multicollinearity cause unreliable and inaccurate results for the high correlation between independent variables.
where:
- R2 coefficient of determination.
VIF and CI identify multicollinearity between predictors for the suitable choice of independent variables. CI and VIF are calculated for all samples. CI is calculated from the eigenvalues identifies the dependency between several independent variables, too (see Equation (4)). CI above 15 detects multicollinearity, for example, thirty means very strong multicollinearity [].
where:
- conventional symbol for an Eigenvalue.
On the other hand, Durbin Watson’s statistics tests autocorrelation in the residuals from a regression model (see Equation (5)) ranging between zero and four. In general, result from one to three indicates there is no autocorrelation, result below one indicates positive autocorrelation, and result above three indicates negative autocorrelation [].
where:
- ei residuals,
- n number elements in the sample.
Finally, normal distribution, homoscedasticity, and linear relationship using scatterplots and partial regression plots are determined in the statistical-analytical program IBM SPSS 25.
4. Results
4.1. Financial Situation in the Transport Sector
Table 4 shows that Slovak companies achieve a low rate of return on assets in the transport sector, as the median ROA is only 0.14 (the mean is 0.15). In addition, many companies have a problem with the ability to pay short-term liabilities immediately because the median cash ratio (CAR) is only 0.14. On the other hand, the average cash ratio is more than one. These results show that there are significant differences between companies. Furthermore, 75% of companies achieve a cash ratio of less than 0.51. The company has almost three times less money on average than the sum of receivables and inventories (the average current ratio is 3.11). However, the median of the current ratio is eight times higher than the cash ratio. Some transport companies have more current assets than non-current assets. Descriptive statistics reveal that 3/4 of companies have less than 75% of assets in current assets. These results demonstrate that transport companies should focus on effective working capital management to increase business performance.
Table 4.
Descriptive statistics for transport companies in the Slovak Republic.
Table 5 reveals that Czech transport companies achieve a lower return on assets compared to Slovak companies based on median and mean. However, Czech companies are more solvent on the based ratio (CAR) in contrast to Slovak companies because the median is twice as high. In general, Czech companies are more solvent based on liquidity ratios. In addition, DPO shows better solvency, but companies pay their liabilities in more than 30 days (standard invoice maturity). On the other hand, Slovak companies achieve faster inventory turnover in contrast to receivables and payables turnover. In conclusion, the samples of Slovak and Czech transport companies contain extreme values based on skewness and kurtosis.
Table 5.
Descriptive statistics for transport companies in the Czech Republic.
4.2. Correlation Analysis
We use the total sample of Slovak and Czech transport companies separately for description analysis and correlation analysis. Table 6 shows the correlation between the independent indicators on the total sample of Slovak companies. The results show that CAT is statistically significantly correlated with all indicators except for DIO, DPO, and CCC. However, this ratio correlates moderately with all liquidity ratios. In addition, liquidity ratios are highly correlated. CAR is very strongly correlated with QUR and CUR. QUR and CUR, as also DPO and CCC are very strongly correlated (100%).
Table 6.
Correlation matrix of the financial variables for the Slovak companies.
Table 7 shows the correlation between the independent indicators based on a sample consisting of Czech enterprises. The results show comparable results to the correlations between the independent variables of Slovak enterprises. The liquidity ratios are statistically significantly correlated. This correlation is moderate to very strong depending on the selected pairs. In addition, Table 7 reveals that QUR and CUR achieve a very high correlation similar to the previous correlation matrix composed of independent indicators of Slovak companies. The total number of statistically dependent correlations is less than in the previous correlation matrix. The results demonstrate that DPO and CCC are as correlated as in the previous Table 6. The colorful highlight presents the degree of correlation between statistically significant pairs of independent indicators.
Table 7.
Correlation matrix of financial variables for the Czech companies.
4.3. Identifying Outliers
Table 8 and Table 9 show the final number of Slovak and Czech enterprises depending on the enterprise size in all samples. As can be seen, the total number of companies is removed for incomplete data on independent indicators from financial statements and outliers. The results show that the largest number of outliers is found in the sample of very large Slovak companies, small and medium-sized Slovak companies, but also small Czech companies based on Cook distance. SME and LVL are not aggregated samples. In other words, SMEs do not represent the sum of small and medium enterprises, and LVL does not represent the sum of large and very large enterprises.
Table 8.
The final sample of the Slovak companies in the transport sector.
Table 9.
The final sample of the Czech companies in the transport sector.
4.4. MLR Models
Table 10 shows the coefficients of all statistically significant variables in all proposed models explaining the company’s performance using indicators from working capital management in Slovakia. The results demonstrate that companies should have a minimum amount of cash and cash equivalents in their cash and bank accounts, as the cash ratio harms the ROA. This indicator is statistically significant in all models except the large and very large enterprise model. In other words, liquidity plays no role in managing working capital against business performance. Small and medium-sized enterprises need to focus on the turnover of short-term liabilities in total sales. Other indicators such as DCA, DRO, or DPO have a slight positive or negative impact on the return on assets. In addition, the companies with a larger share of current assets in total assets have increased business performance in addition to the model for small businesses, and large to very large enterprises. Moreover, the results show that the company size does not affect the corporate performance of Slovak transport companies.
Table 10.
Coefficients in models for the transport companies in the Slovak Republic.
Table 11 shows the coefficients are statistically significant for Czech enterprises broken down by size according to []. The results are different from Slovak companies. As can be seen, liquidity again harms the corporate performance of Czech companies. However, the cash ratio is a statistically significant variable only for large companies, unlike models for Slovak companies. Czech companies should focus not only on cash management but also on receivables and inventory management. CUR is a statistically significant variable for medium-sized enterprises, but also SME and LVL. The current liabilities turnover is also a statistically significant variable for LVL. Finally, another important indicator is current assets to total assets in all models except large and very large enterprise groups. Table 10 and Table 11 demonstrate detailed knowledge of the coefficients of statistically significant variables in all models (p < 0.05).
Table 11.
Coefficients in models for the transport companies in the Czech Republic.
Table 12 demonstrates the proposed models for Slovak companies depending on the company size according to []. As can be seen, the linear model for medium-sized companies explains the best variability based on the adjusted R-square. On the other hand, models for large enterprises, but also large and very large enterprises explain less than 40% of the variability. However, the results show that the variability is explained at about 40% regardless of the proposed model. Some independent variables are excluded for multicollinearity between independent variables in the modelling business performance based on indicators from working capital management. The liquidity ratios such as QUR and CUR are the most frequently excluded variables from the overall set of independent predictors. The results show that these variables were excluded in all models. CI demonstrates that multicollinearity reaches the recommended value of less than 15. Moreover, Table A2 (see Appendix B) demonstrates VIF for all samples in the Slovak Republic. All models are statistically significant. Unfortunately, models for small companies in the Czech Republic for a small number of observations are not designed.
Table 12.
Model summary for the transport companies in the Slovak Republic.
Table 13 provides the same metrics explaining the proposed models for Czech companies as in the previous Table 11. However, the model describing the business performance of small businesses in the Czech Republic due to the smaller sample as opposed to Slovak businesses is not proposed. As can be seen, the models explain less than 40% of the variability. The return on assets is best explained for large companies in the Czech Republic. The several independent variables are excluded for multicollinearity by CI. Moreover, Table A3 (see Appendix B) reveals VIF for all samples in the Czech Republic. QUR, CAR, and CUR are the most frequently excluded indicators. Durbin–Watson statistics identifies that the observations are not autocorrelated. All models are statistically significant. In other words, these models are suitable for estimating a company’s performance based on working capital management indicators.
Table 13.
Model summary for the Czech Republic.
5. Discussion
Table 14 shows a summary of the hypotheses tested using multiple linear regression analysis, broken down by company size and country. As can be seen, QUR, DIO, CCC, and company size (S_code, L_code, and VL_code) are not statistically significant for any size category in both countries. Other indicators are statistically significant in at least one of the regression functions. The results show that OPF and CATA have a positive impact on increasing corporate performance. On the other hand, CAR, CUR, DCA, DPO, and COC have a negative impact on return on assets (calculated EBITDA/total assets). However, ART and CAT have a different impact on corporate performance depending on size, with larger companies achieving a more positive impact from activity on performance than others. Finally, our results demonstrate expected effects on corporate performance with original expectations, the green color represents that our results confirmed the initial expectations, unlike the red color.
Table 14.
Hypothesis summary.
Our research is compared with findings from two previous research, focusing on working capital management in the Central European region [,]. This research as a dependent variable use EBIT to total assets or net income to total assets unlike EBITDA to total assets. This dependent variable is preferred because EBITDA as a profitability indicator is more suitable compared to several countries, namely the Slovak and Czech Republics. This research is extended by previous research by the business size broken down into small, medium, large, and very large businesses according to [] using the multiple linear regression analysis. The results show that all presented models are better than previous models created on a principle, other than the multiple linear regression analysis based on a comparison of R-square or adj. R-square. Our presented models are based on data from 2019 pre-pandemic compared to other datasets from the period of more than five years for limited access to multi-year data.
Table A1 (see Appendix A) compares different models explaining the company’s performance in the manufacturing or transport sector based on pooled regression analysis, static panel model with fixed effects, panel-corrected standard errors, and other models. As can be seen, the data on transport companies from the Czech and Slovak Republics depends on the company size used. The results show that the proposed models achieve excellent results compared to other models based on adjusted R-square.
Table 15 shows statistically significant indicators with the coefficient size and the impact on corporate performance, especially of Central European companies. These indicators do not create comparable models from [,]. Many of these indicators were not included in our research because these models do not achieve the relevant R-square statistical metrics explaining model variability. In addition, the dataset did contain data on absolute quantities of assets and liabilities, but not ratios. Our purpose was to use other indicators to create models with better results in terms of R-square, so this research is based on a wide range of independent indicators from previous research. Our results demonstrate that asset structure is an important factor influencing corporate performance. However, current assets to total assets are used than fixed assets to total assets in this research, these two indicators are complementary, and the sum is equal to 1. CATA has a positive impact on the performance in several models depending on the size in both countries, on the other hand, fixed assets to total assets harm profitability according to [].
Table 15.
Summarizing the results of previous research from Central Europe.
6. Conclusions
This research provides relevant knowledge on effective working capital management for increasing corporate performance in small, medium, large, and very large transport companies in Slovakia and the Czech Republic with a detailed analysis of the impact of working capital management on profitability ratio using a wide range of indicators describing the current assets and current liabilities management. Descriptive statistics show that current assets make up more than half of all assets in Slovak and Czech transport companies, so working capital management represents a major area in corporate finance. Our models show a coefficient size of statistically significant independent variables describing working capital management with its positive or negative impact on business performance. These results lead to relevant decisions in short-term receivables management, inventory management, cash management, but also short-term liability management.
The research output is beneficial for all management levels in the company and owners to identify important parts of working capital management to increase business performance, company value, and effectiveness of the transport company. The outcomes reveal that working capital management is quite different between small, medium, large, and very large companies in the Czech and Slovak Republics. These models consider the specific aspects of transport companies in both countries. In other words, multiple linear regression analysis identifies strengths and weaknesses in the transport sector. All models are proposed based on multicriteria linear regression with the selection of statistically significant indicators using the stepwise method. Moreover, these models are compared with each other and with other regional and accepted models for Central Europe. The results show that liquidity has a negative impact, in contrast to activity indicators except for DPO, on corporate performance in Czech transport companies. In addition, very large companies need to be more efficient in managing free cash and cash equivalents because more money reduces business performance. Finally, the volume of current assets plays a significant role in medium-sized transport companies, but also aggregated groups (SME and LVL) in the Czech transport sector. On the other hand, Slovak small, medium, and large enterprises must effectively manage free cash and cash equivalents, too. However, activity indicators, except DRO for an aggregated group of large and very large enterprises, also harm business performance. These findings demonstrate that working capital management in Slovak transport companies is not beneficial and has negative effects on corporate performance. The added value of the paper is to identify key aspects of working capital management such as cash management, receivables management, inventory management, and liability management as effective tools for increasing business performance.
Limitations. One of the main limitations of our research was the gap in the literature describing corporate performance in working capital management in Central Europe as opposed to other countries all over the world. These results provide a comprehensive overview of the selection of appropriate indicators for working capital management for transport companies. In addition, the small sample consisting of large enterprises in Slovakia and small enterprises in the Czech Republic is an obstacle to scientific research.
Future research. Future research may focus on evaluating business performance based on selected statistically significant indicators using data envelope analysis (DEA). These results will make it possible to compare Slovak and Czech companies in each group and identify the strengths and weaknesses of working capital management to achieve efficient use of resources in the company.
Funding
This research was funded by Grant System of University of Zilina No. 1/2021 (12821) and the project of FPEDAS, University of Zilina [1/KKMHI/2021].
Institutional Review Board Statement
Not applicable.
Informed Consent Statement
Not applicable.
Data Availability Statement
Not applicable.
Conflicts of Interest
The author declares no conflict of interest.
Appendix A
Table A1.
Summary.
Table A1.
Summary.
| [] | [] | Our Research | |||||||||||||||
|---|---|---|---|---|---|---|---|---|---|---|---|---|---|---|---|---|---|
| Total sample | 332 | 1163 | 18 | 188 | 141 | 22 | 207 | 161 | 70 | 369 | 93 | 4 | 437 | 105 | |||
| Company size | n/a | n/a | Small | Medium-sized | Large | Very Large | SME | LVL | Small | Medium-sized | Large | Very Large | SME | LVL | |||
| Industry sector | Manufacturing Automobile construction | n/a | transport | ||||||||||||||
| Country | Czech Republic | Albania, Belarus, Bosnia, and Herzegovina, Bulgaria, Croatia, Czech Republic, Estonia, Hungary, Kosovo, Latvia, Lithuania, Macedonia, Moldova, Montenegro, Poland, Romania, Serbia, Slovak Republic, Slovenia, Ukraine | Czech Republic | Slovak Republic | |||||||||||||
| Year | 2015–2019 | 2006–2015 | 2019 | ||||||||||||||
| Method | PRM | OLS | FE | RE | MLR | ||||||||||||
| Dependent variable | ROA | ROA | ROA | ||||||||||||||
| EBIT/TA | net income/TA | EBITDA/TA | |||||||||||||||
| R2 | 0.1215 | 0.307 | 0.118 | 0.301 | - | 0.338 | 0.389 | 0.331 | 0.334 | 0.345 | 0.473 | 0.449 | 0.403 | - | 0.424 | 0.367 | |
| Adj. R2 | 0.1170 | n/a | n/a | n/a | - | 0.323 | 0.379 | 0.297 | 0.318 | 0.328 | 0.432 | 0.441 | 0.383 | - | 0.417 | 0.347 | |
Note: fixed-effects model (FE), multiple linear regression (MLR), ordinary least-squares (OLS), pooled regression model (PRM), random effects models (RE).
Appendix B
Table A2.
VIF for the selected subsamples in the Slovak Republic.
Table A2.
VIF for the selected subsamples in the Slovak Republic.
| No. | Acronym | Independent Variable | Small | Medium-Sized | Large | Very Large | SME | LVL | ||||||
|---|---|---|---|---|---|---|---|---|---|---|---|---|---|---|
| Collinearity Statistics | ||||||||||||||
| Tolerance | VIF | Toleance | VIF | Toleance | VIF | Toleance | VIF | Toleance | VIF | Toleance | VIF | |||
| 1. | OPF | cash-flow/current liabilities | 0.309 | 3.234 | 0.544 | 1.839 | 0.618 | 1.619 | - | - | 0.453 | 2.206 | 0.893 | 1.119 |
| 2. | CAR | (cash and cash equivalent)/current liabilities | 0.510 | 1.962 | 0.590 | 1.694 | 0.718 | 1.394 | - | - | 0.552 | 1.813 | ||
| 3. | QUR | (current assets − stock)/current liabilities | - | - | ||||||||||
| 4. | CUR | current assets/current liabilities | - | - | ||||||||||
| 5. | INT | sales/stock | - | - | ||||||||||
| 6. | ART | sales/receivables | 0.897 | 1.115 | - | - | ||||||||
| 7. | CAT | sales/current liabilities | 0.480 | 2.082 | 0.534 | 1.872 | - | - | 0.580 | 1.723 | ||||
| 8. | DIO | (stock/sales) × 365 | - | - | ||||||||||
| 9. | DCA | (current assets/sales) × 365 | - | - | 0.941 | 1.063 | 0.727 | 1.376 | ||||||
| 10. | DRO | (receivables/sales) × 365 | - | - | 0.783 | 1.277 | ||||||||
| 11. | DPO | (current liabilities/sales) × 365 | 0.930 | 1.076 | - | - | ||||||||
| 12. | COC | days inventory outstanding + days receivable outstanding | - | - | ||||||||||
| 13. | CCC | conversation cycle − days payable outstanding | 0.974 | 1.027 | - | - | ||||||||
| 14. | CATA | current assets/total assets | 0.822 | 1.217 | 0.830 | 1.205 | - | - | 0.845 | 1.183 | ||||
Table A3.
VIF for the selected subsamples in the Czech Republic.
Table A3.
VIF for the selected subsamples in the Czech Republic.
| No. | Acronym | Independent Variable | Small | Medium-Sized | Large | Very Large | SME | LVL | ||||||
|---|---|---|---|---|---|---|---|---|---|---|---|---|---|---|
| Collinearity Statistics | ||||||||||||||
| Tolerance | VIF | Toleance | VIF | Toleance | VIF | Toleance | VIF | Toleance | VIF | Toleance | VIF | |||
| 1. | OPF | cash-flow/current liabilities | - | - | 0.492 | 2.031 | 0.909 | 1.100 | 0.429 | 2.328 | 0.348 | 2.871 | ||
| 2. | CAR | (cash and cash equivalent)/current liabilities | - | - | 0.909 | 1.100 | ||||||||
| 3. | QUR | (current assets − stock)/current liabilities | - | - | ||||||||||
| 4. | CUR | current assets/current liabilities | - | - | 0.373 | 2.683 | 0.354 | 2.827 | 0.498 | 2.006 | ||||
| 5. | INT | sales/stock | - | - | 1.000 | 1.000 | ||||||||
| 6. | ART | sales/receivables | - | - | 0.649 | 1.540 | 0.689 | 1.450 | ||||||
| 7. | CAT | sales/current liabilities | - | - | 0.618 | 1.617 | ||||||||
| 8. | DIO | (stock/sales) × 365 | - | - | ||||||||||
| 9. | DCA | (current assets/sales) × 365 | - | - | ||||||||||
| 10. | DRO | (receivables/sales) × 365 | - | - | ||||||||||
| 11. | DPO | (current liabilities/sales) × 365 | - | - | 0.920 | 1.087 | ||||||||
| 12. | COC | days inventory outstanding + days receivable outstanding | - | - | ||||||||||
| 13. | CCC | conversation cycle − days payable outstanding | - | - | ||||||||||
| 14. | CATA | current assets/total assets | - | - | 0.845 | 1.183 | 0.831 | 1.204 | 0.516 | 1.938 | ||||
References
- Gołaś, Z. Working Capital Management vs. Profitability of Milk Processing Companies. Sci. Pap. Ser. Manag. Econ. Eng. Agric. Rural. Dev. 2020, 20, 8. [Google Scholar]
- Gołaś, Z. Impact of Working Capital Management on Business Profitability: Evidence from the Polish Dairy Industry. Agric. Econ. 2020, 66, 278–285. [Google Scholar] [CrossRef]
- Arnaldi, A.; Nowak, B.; Roscigno, R.; Zhang, W. Working Capital Management and Profitability: Empirical Evidence. J. Bus. Manag. Econ. Res. 2021, 12, 1911–1917. [Google Scholar]
- Anna Bieniasz, A.B.; Zbigniew Gołaś, Z.G. The Influence of Working Capital Management on the Food Industry Enterprises Profitability. Contemp. Econ. 2011, 5, 68. [Google Scholar] [CrossRef] [Green Version]
- Gonçalves, T.; Gaio, C.; Robles, F. The Impact of Working Capital Management on Firm Profitability in Different Economic Cycles: Evidence from the United Kingdom. Econ. Bus. Lett. 2018, 7, 70. [Google Scholar] [CrossRef] [Green Version]
- Naumoski, A. The Impact of Working Capital Management on Profitability of the Listed Companies in Emerging European Countries. In Proceedings of the 13th RSEP International Conference on Business, Economics & Finance, Istanbul, Turkey, 11–13 June 2019. [Google Scholar]
- Korent, D.; Orsag, S. The Impact of Working Capital Management on Profitability of Croatian Software Companies. Zagreb Int. Rev. Econ. Bus. 2018, 21, 47–66. [Google Scholar] [CrossRef] [Green Version]
- Vuković, B.; Jakšić, D. The Effect of Working Capital Management on Profitability: Evidence from Southeast Europe. Ekon. Poljopr. 2019, 66, 159–172. [Google Scholar] [CrossRef]
- Shajar, S.N.; Farooqi, S.A. Impact of Working Capital Management on the Profitability of Automobile Industry in India-An Empirical Study of Selected Automobile Companies. Pac. Bus. Rev. Int. 2016, 8, 197–203. [Google Scholar]
- Goel, U.; Sharma, A.K. Analysing Efficiency Change in Working Capital Management Using Malmquist Productivity Index. J. Inf. Optim. Sci. 2015, 36, 595–616. [Google Scholar] [CrossRef]
- Jamalinesari, S.; Soheili, H. The Relationship between the Efficiency of Working Capital Management Companies and Corporate Rule in Tehran Stock Exchange. Procedia—Soc. Behav. Sci. 2015, 205, 499–504. [Google Scholar] [CrossRef] [Green Version]
- Fiador, V. Does Corporate Governance Influence the Efficiency of Working Capital Management of Listed Firms: Evidence from Ghana. AJEMS Afr. J. Econ. Manag. Stud. 2016, 7, 482–496. [Google Scholar] [CrossRef]
- Akbulut, R. An application to measure impact of working capital management on profitability in firms in manufacture sector quoted on ISE. Istanb. Univ. J. Sch. Bus. 2011, 40, 195–206. [Google Scholar]
- Tsagem, M.M.; Aripin, N.; Ishak, R. Analyzing the Impact of Working Capital Management on the Profitability of Nigerian SMEs. Adv. Sci. Lett. 2016, 22, 1439–1442. [Google Scholar] [CrossRef]
- Okyere-Kwakye, E.; Assampong, I.E.-; Nor, K.; Annan, E.M. Working Capital Management: A Casual Assessment of Its Effect on Organizations Profit. In Proceedings of the International Conference on Business and Economics, Jeju, Korea, 7–9 July 2016; pp. 449–451. [Google Scholar]
- Prsa, D. The Impact of Working Capital Management on the Profitability of Croatian Manufacturing SMEs. Ekon. Vjesn. 2020, 33, 371–382. [Google Scholar]
- Yousaf, M.; Bris, P.; Haider, I. Working Capital Management and Firm’s Profitability: Evidence from Czech Certified Firms from the EFQM Excellence Model. Cogent Econ. Finance 2021, 9, 1954318. [Google Scholar] [CrossRef]
- Boțoc, C.; Anton, S.G. Is Profitability Driven by Working Capital Management? Evidence for High-Growth Firms from Emerging Europe. J. Bus. Econ. Manag. 2017, 18, 1135–1155. [Google Scholar] [CrossRef] [Green Version]
- Bureau van Dijk. Moody’s Analytics Amadeus Database. Available online: https://amadeus.bvdinfo.com/version-2021517/home.serv?product=AmadeusNeo (accessed on 14 June 2021).
- Mazanec, J. The Impact of Working Capital Management on Corporate Performance in Small-Medium Enterprises in the Visegrad Group. Mathematics 2022, 10, 951. [Google Scholar] [CrossRef]
- Zimon, G.; Tarighi, H. Effects of the COVID-19 Global Crisis on the Working Capital Management Policy: Evidence from Poland. J. Risk Financ. Manag. 2021, 14, 169. [Google Scholar] [CrossRef]
- Heryán, T. Managers of Tourism Companies Can No Longer Expect Any Financial Support from Company Owners: Different Working Capital Management Due to the Global Financial Crisis. E+M Econ. Manag. 2020, 23, 50–59. [Google Scholar] [CrossRef]
- Yousaf, M.; Bris, P. Effects of Working Capital Management on Firm Performance: Evidence from the EFQM Certified Firms. Cogent Econ. Finance 2021, 9, 1958504. [Google Scholar] [CrossRef]
- Ren, T.; Liu, N.; Yang, H.; Xiao, Y.; Hu, Y. Working Capital Management and Firm Performance in China. ARA Asian Rev. Account. 2019, 27, 546–562. [Google Scholar] [CrossRef]
- Belsley, D.A.; Kuh, E.; Welsch, R.E. Regression Diagnostics: Identifying Influential Data and Sources of Collinearity; Wiley Series in Probability and Statistics; John Wiley & Sons, Inc.: Hoboken, NJ, USA, 1980; ISBN 978-0-471-72515-2. [Google Scholar]
- Suu, D.S.; Hao, N.Q.; Van, N.T.H. The Effect of Working Capital on Firm Performance New Evidences from Seafoods Companies in Vietnam. In Proceedings of the Finance and Performance of Firms in Science, Education and Practice, Zlín, Czech Republic, 26–27 April 2017; pp. 747–759. [Google Scholar]
Publisher’s Note: MDPI stays neutral with regard to jurisdictional claims in published maps and institutional affiliations. |
© 2022 by the author. Licensee MDPI, Basel, Switzerland. This article is an open access article distributed under the terms and conditions of the Creative Commons Attribution (CC BY) license (https://creativecommons.org/licenses/by/4.0/).