Article

Improving the Deeplabv3+ Model with Attention Mechanisms Applied to Eye Detection and Segmentation

1
School of Transportation, Fujian University of Technology, Fuzhou 350118, China
2
Intelligent Transportation System Research Center, Fujian University of Technology, Fuzhou 350118, China
3
Fujian Provincial Key Laboratory of Automotive Electronics and Electric Drive, Fujian University of Technology, Fuzhou 350118, China
4
Fujian Provincial Key Laboratory of Big Data Mining and Applications, School of Computer Science and Mathematics, Fujian University of Technology, Fuzhou 350118, China
5
School of Mechatronic Engineering, Guangzhou Polytechnic College, Guangzhou 510091, China
6
Fujian Provincial Key Laboratory of Information Processing and Intelligent Control, Minjiang University, Fuzhou 350108, China
*
Authors to whom correspondence should be addressed.
Mathematics 2022, 10(15), 2597; https://doi.org/10.3390/math10152597
Submission received: 31 May 2022 / Revised: 20 July 2022 / Accepted: 22 July 2022 / Published: 26 July 2022
(This article belongs to the Section Mathematics and Computer Science)

Abstract

:
Research on eye detection and segmentation is even more important with mask-wearing measures implemented during the COVID-19 pandemic. Thus, it is necessary to build an eye image detection and segmentation dataset (EIMDSD), including labels for detecting and segmenting. In this study, we established a dataset to reduce elaboration for chipping eye images and denoting labels. An improved DeepLabv3+ network architecture (IDLN) was also proposed for applying it to the benchmark segmentation datasets. The IDLN was modified by cascading convolutional block attention modules (CBAM) with MobileNetV2. Experiments were carried out to verify the effectiveness of the EIMDSD dataset in human eye image detection and segmentation with different deep learning models. The result shows that the IDLN model achieves the appropriate segmentation accuracy for both eye images, while the UNet and ISANet models show the best results for the left eye data and the right eye data among the tested models.

1. Introduction

The human eyes play an essential and critical role in face analysis and recognition [1] in which eye detection and eye image segmentation are processed. Detection and image segmentation require recognition of the eyes, estimation of the eye’s focus, eye tracking, and pupil detection as humans recognize changes in eye movement and attention [2] and obtain information from eye detection [3]. Characteristic information is revealed by eye tracking and helps recognize abnormal eye function [4]. Eye tracking technology allows various applications of the technology in education and industry with virtual reality technology [5] such as precise pupil positioning used in e-learning [6].
Various areas of research on eye detection have been thriving as eye detection has become increasingly important in diverse fields. Eye detection is carried out by positioning the boundary of the eyes in the image with iris recognition, eye tracking, and binocular vision. Eye detection is mainly used for face recognition and fatigue driving detection [7]. In eye detection, iris recognition requires information on location and scale of the eye. Thus, distinction between left and right eyes improves the efficiency of iris recognition [8].
In eye detection, it is necessary to distinguish the eyes’ positions according to the direction of the head. Thus, locating the elements on a face is important in eye detection [9]. However, face masks hinder recognizing the elements, which is a challenge for eye detection. With a face mask on, the symmetry of the left and right eyes to the nose is used to judge the direction of the driver’s head. In this case, it is necessary to identify the differences between the left and right eyes for the direction [10].
Eye detection precedes eye image segmentation, which is a binary classification of pixels in an image containing the eye area and the background. The number of pixels in the eye area is used to measure the degree of eye opening and extract feature information such as eye blinking frequency. The extracted information helps in physiological analysis of a person. In eye detection, the eye image database is essential. For example, datasets are used for eye focus estimation [11,12,13], eye tracking [14,15,16], studying the iris of the eye [17,18,19], and investigating the pupil [20,21,22].
For example, Figure 1 shows the sample images selected from the eye detection dataset (Figure 1a) and the chosen images from the eye segmentation dataset (Figure 1b). The dataset varies according to the scale, posture, illumination, skin color, occlusion, various natural indoor and outdoor lighting conditions, glasses, eye makeup, and different physiology (such as skin and eye colors). Thus, a dataset is required to serve as a benchmark for the evaluation of algorithms and models for eye detection in various situations. Then, deep learning models perform human eye detection based on the dataset.
An appropriate dataset is essential for eye detection and eye image segmentation, which leads this study to establish a new dataset. We validate the proposed dataset with different deep learning models which are used to test the dataset. The result is expected to contribute to the related studies as follows.
(1)
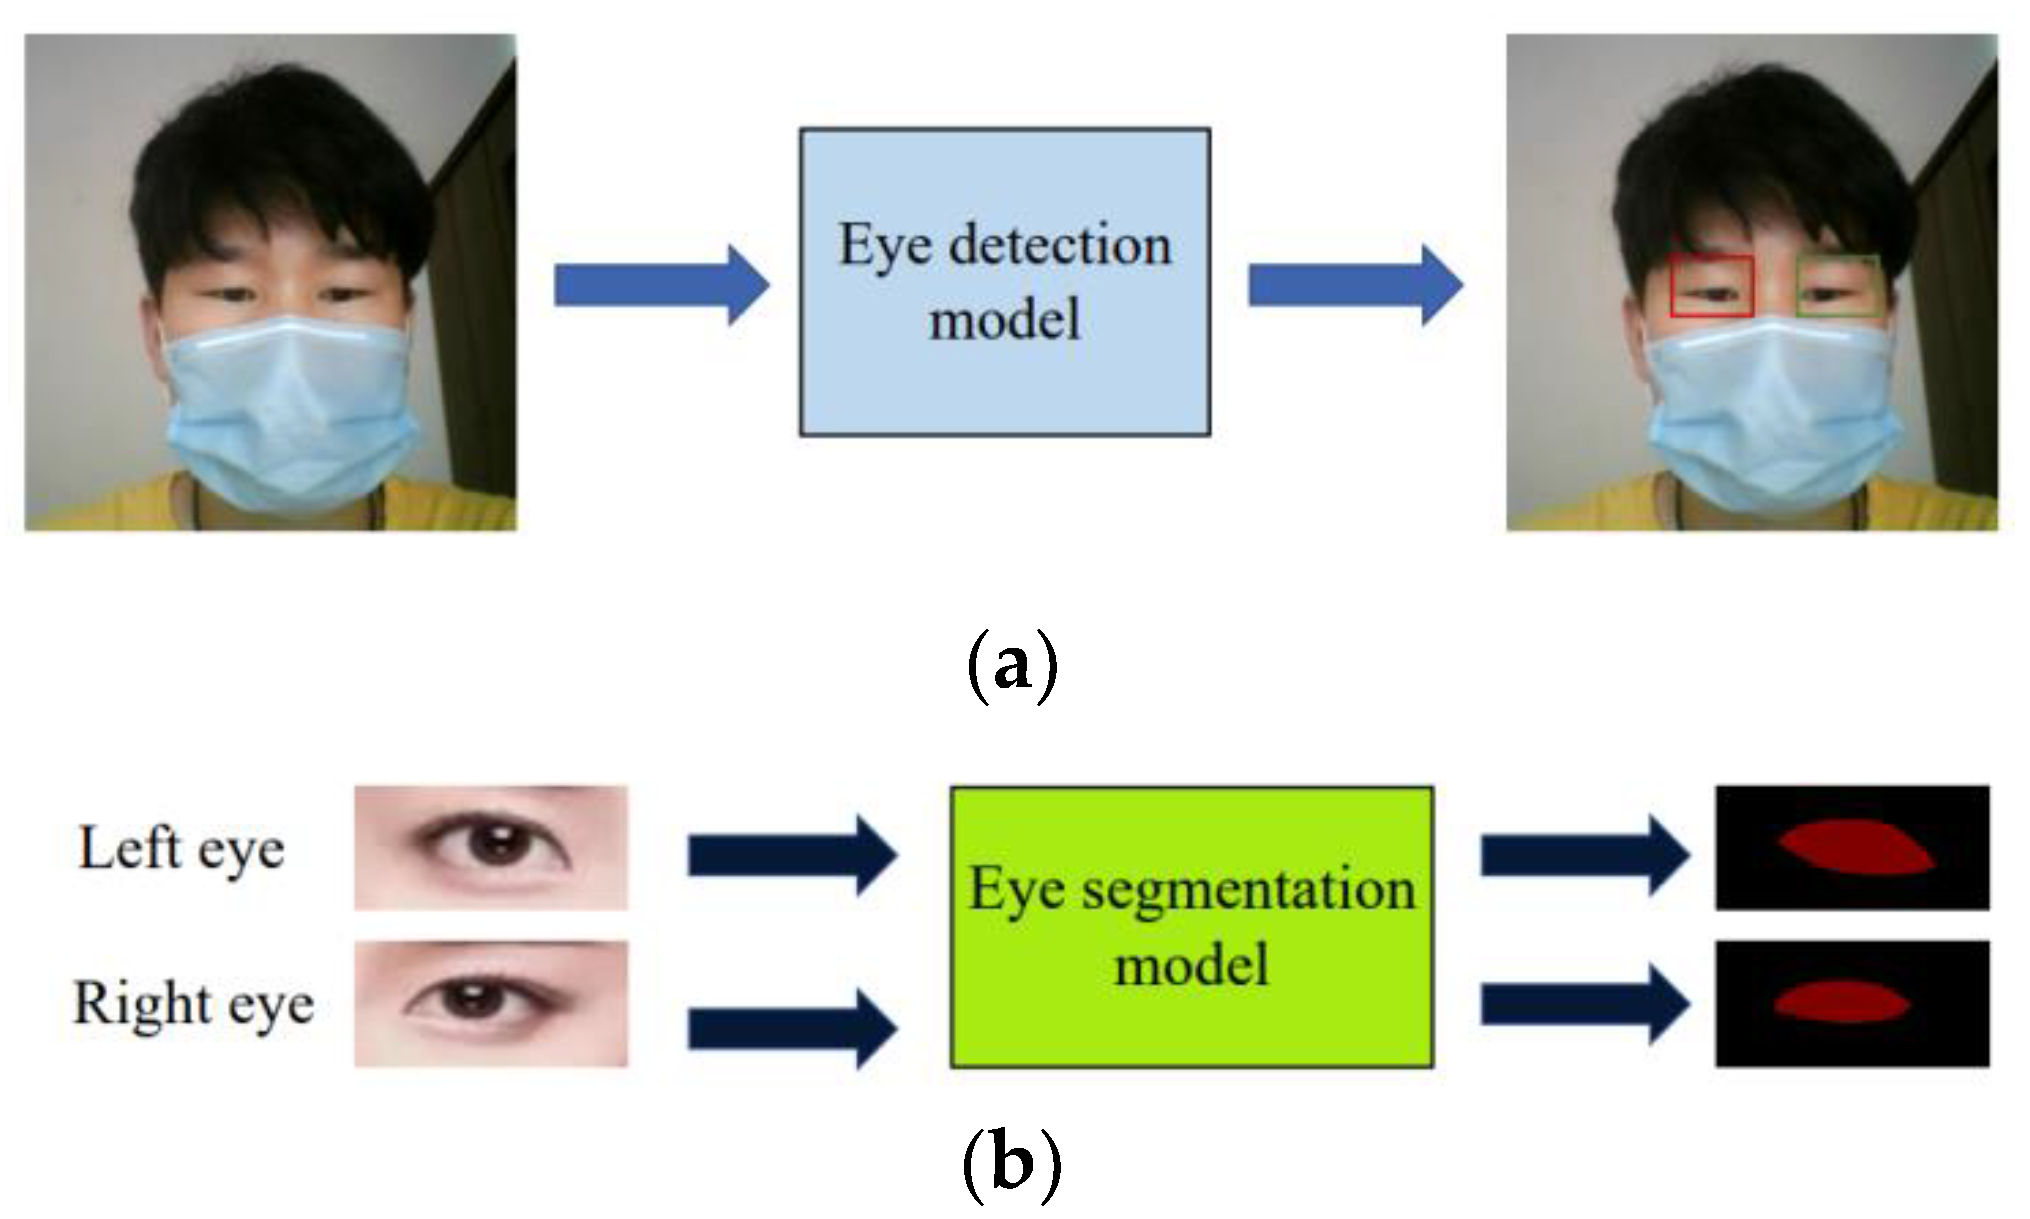
The proposed dataset (EIMDSD) allows more accurate eye detection and eye image segmentation. The dataset is used to establish different scenarios of detection and segmentation.
(2)
As deep learning models are used to evaluate the results of eye detection and eye region segmentation on the proposed dataset, the evaluation result helps select appropriate models for eye detection and eye image segmentation.
(3)
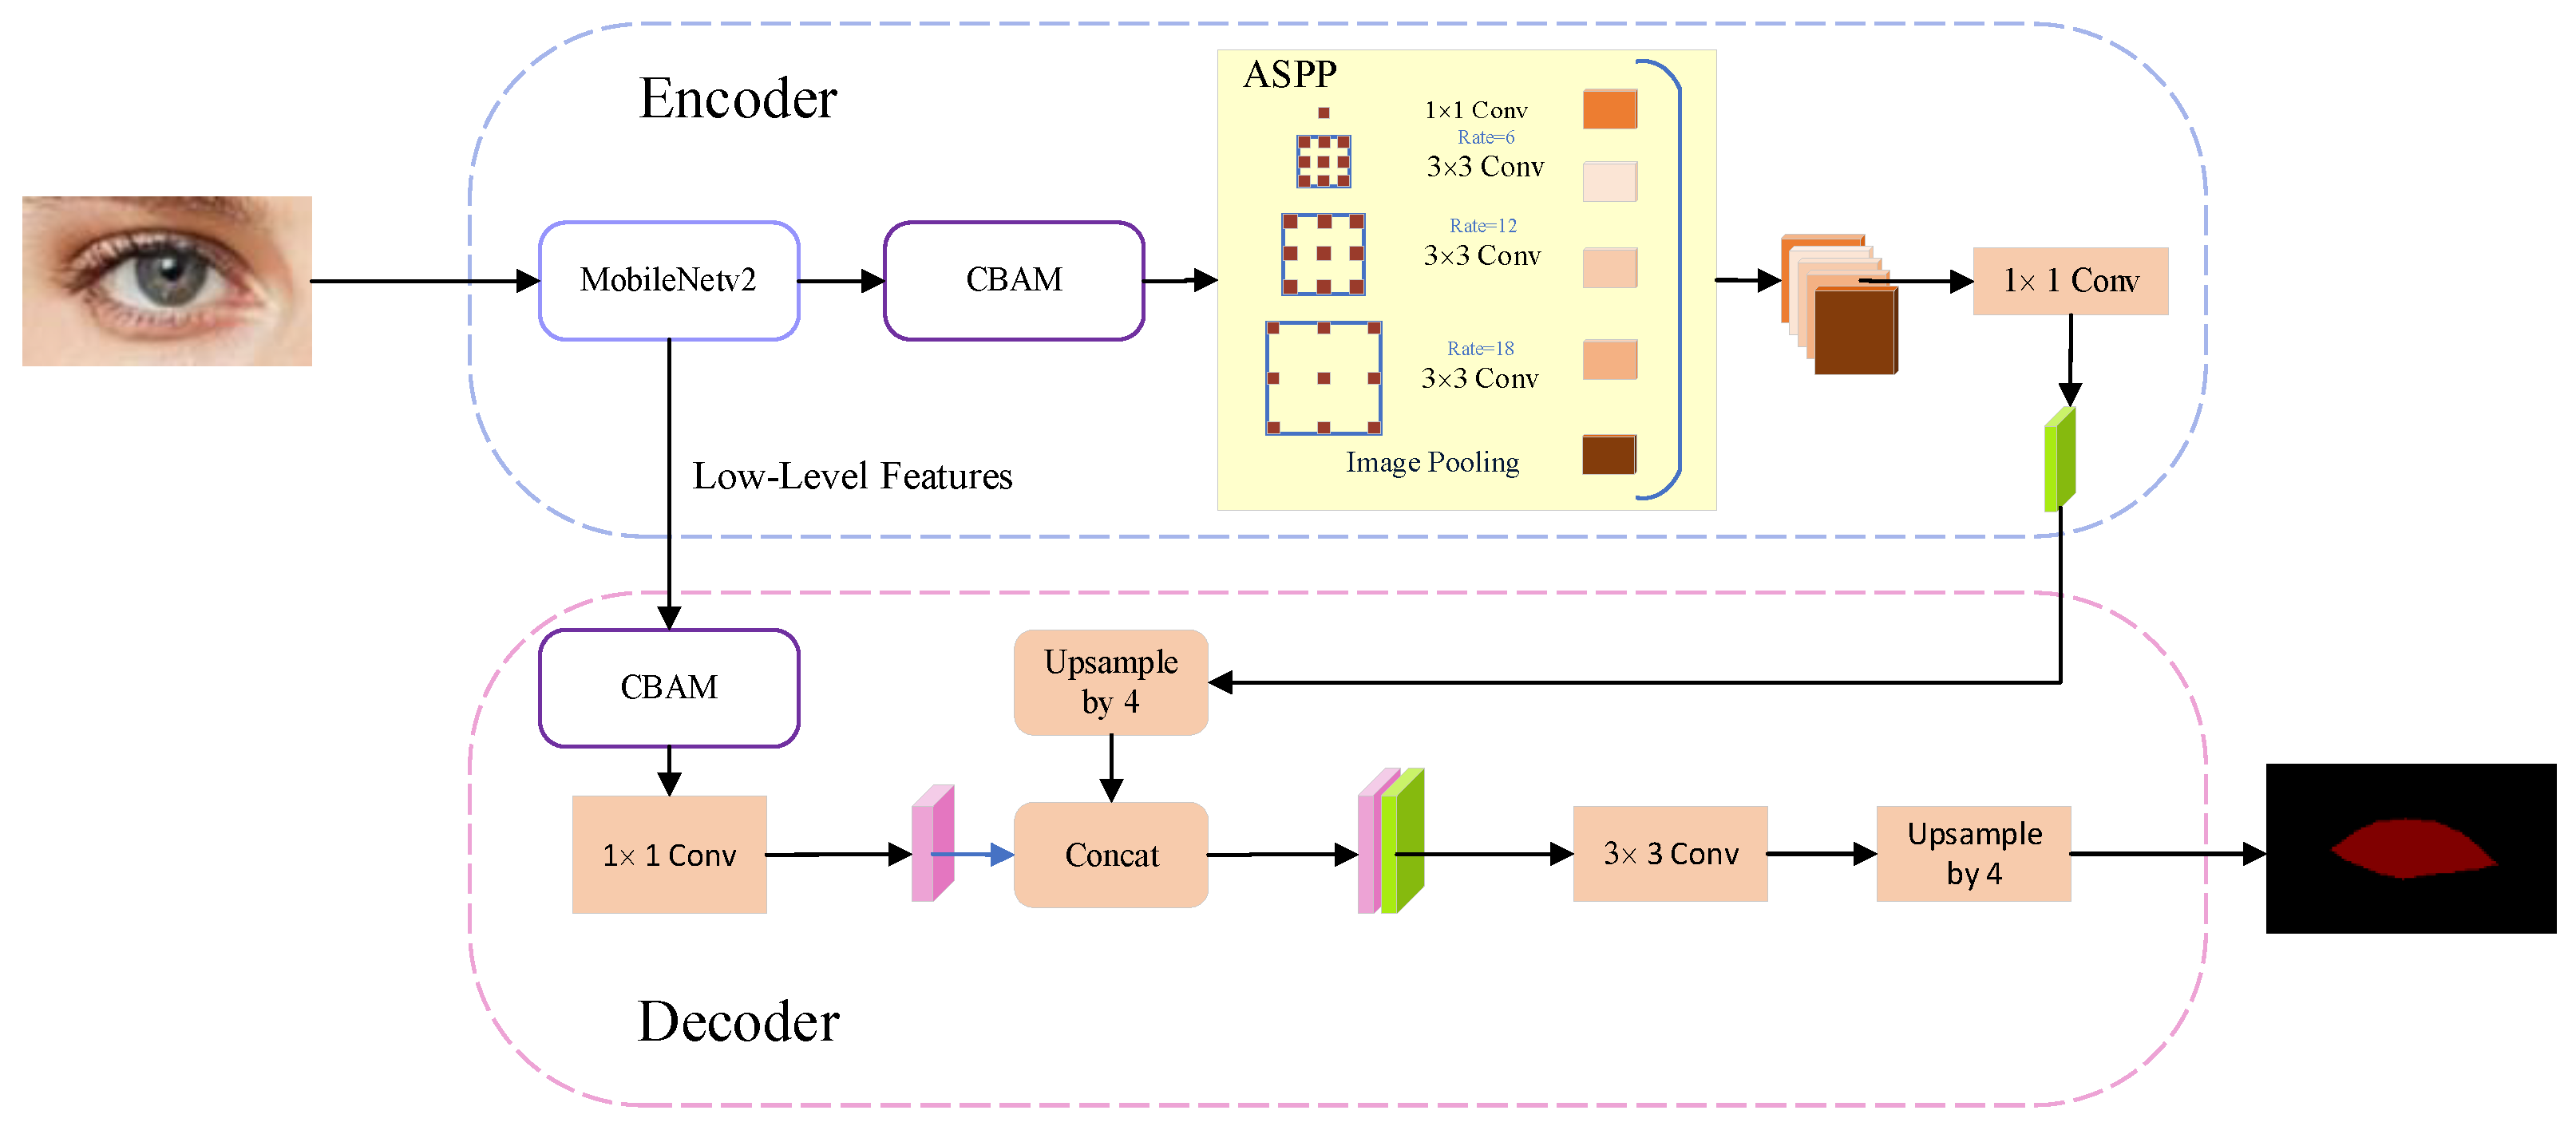
The improved DeepLabv3+ network architecture (IDLN) with the convolutional block attention module (CBAM) and the MobileNetV2 can replace the ResNet-101 network. The IDLN also achieves reliable segmentation performance.

2. Related Works

The proposed dataset is established based on existing datasets including Asia [17] and Ubiris [18,19] (for iris recognition), POG [16] and NVGaze [14] (for focusing of the eyes), and GIW [12] and BAY [23] (for eye movement types). In previous studies, GAN [24], 550 K [25], LPW [21], and Else [20] have also been used as they are related to the pupil and iris of the eye. The OpenEDS [15] is a large-scale dataset of eye images captured by the head-mounted display with two synchronized eye-facing cameras at a frame rate of 200 Hz under controlled illumination. The OpenEDS has labels for image segmentation pupil, iris, and sclera. However, eye detection is carried out in various illumination conditions. Therefore, labeling images of the eyes is necessary for eye detection and eye image segmentation with deep learning methods. However, as the labeling is time consuming, it is necessary to propose a dataset with the labels.
A digital image is segmented into multiple elements based on its characteristics. The objective is to simplify or change the image for meaningful and easy analysis. Semantic segmentation is carried out to assign a class label to each pixel of an image in a classification architecture. Instead of predicting an entire image, prediction for each pixel is performed to locate distinct features of an image. Since image segmentation is considered a pixel classification problem, common classification loss functions are used for a multiclass segmentation problem as a categorical cross-entropy problem.
A deep convolutional neural network (DCNN) is an architecture for classification application as shown in Figure 2. DCNNs utilize supervised learning called backpropagation for training model parameters from samples. DCNN is composed of multiple layers, such as convolution, pooling, and fully connected layers. The convolution and pooling layers are combined for feature extraction. The convolution layer is to detect features and create a set of weight matrices called kernels or filters for convolution operation on a feature matrix. A loss function is calculated in the last layer through a backpropagation algorithm to automatically and adaptively learn spatial hierarchies of the features. The last layer is implemented with a “softmax” activation, which returns an array of N probability scores (summing to 1). Each score is the probability that the current digit image belongs to one of the N digit classes.
In this study, eleven semantic segmentation models are used—ANN, BiSeNetV2, DANet, Fast-SCNN, FCN, ISANet, OCRNet, UNet, PSPNet, Deeplabv3, and Deeplabv3P.
  • Asymmetric Non-local Neural Networks (ANN) [26] for semantic segmentation have Asymmetric Pyramid Non-local Block (APNB) and Asymmetric Fusion Non-local Block (AFNB). The cross-entropy is the loss function of ANN.
  • Bilateral Segmentation Network (BiSeNet V2) [27] involves a detailed branch to capture low-level details and generate high-resolution feature representation and a semantic branch to obtain high-level semantic context. A Guided Aggregation Layer is to enhance mutual connections and fuses feature representations. Softmax loss is the loss function of BiSeNet V2.
  • Dual Attention Network (DANet) [28] adaptively integrates local features with global dependencies. Two types of attention modules on top of traditional dilated FCN are used to model the semantic interdependencies in spatial and channel dimensions, respectively. Multiple losses are added to the loss function.
  • Fast segmentation convolutional neural network (Fast-SCNN) [29] is an encoder-decoder framework for offline semantic image segmentation. The cross-entropy is the loss function of Fast-SCNN.
  • Fully Convolutional Networks (FCNs) [30] with downsampling and upsampling inside the network efficiently make a pixel-wise dense prediction for predicting a label for each pixel in an image. The per-pixel multinomial logistic loss is the loss function of FCN.
  • Interlaced Sparse Self-Attention (ISANet) for Semantic Segmentation [31] has two successive attention modules each of which is estimated with a sparse affinity matrix. The first and the second attention module is used to estimate the affinities within a subset of positions that have long and short spatial interval distances, respectively. The auxiliary loss is the loss function of ISANet.
  • Object-Contextual Representations (OCRNet) [32] for semantic segmentation characterizes a pixel by exploiting the representation of the corresponding object class. The object regions are learned under the supervision of ground-truth segmentation. The object region representation is computed by aggregating the representations of the pixels lying in the object region. The cross-entropy is the loss function of OCRNet.
  • Pyramid scene parsing network (PSPNet) [33] uses a CNN to obtain the feature map with the dilated network strategy to extract the feature map capability of global context information by different-region-based context aggregation through the pyramid pooling module. The softmax loss and auxiliary loss are the loss functions of PSPNet.
  • U-Net [34] is an architecture for semantic segmentation. It consists of a contracting path and an expansive path. The contracting path follows the typical architecture of a convolutional network. Every step in the expansive path consists of an upsampling of the feature map. The energy function is computed by a pixel-wise softmax over the final feature map combined with the cross entropy loss function.
  • DeepLab [35] eliminates several downsamplings in ResNet to maintain high resolution and utilizes convolutions with large dilations to enlarge receptive fields. The sum of cross-entropy terms is the loss function of DeepLab.
DeepLab has three versions—DeepLabv1 (2015 ICLR), DeepLabv2 (2018 TPAMI), and DeepLabv3. DeepLabv1 and DeepLabv2 use Atrous convolution and a fully Connected Conditional Random Field (CRF). DeepLabv2 uses ResNet and VGGNet, while DeepLabv1 only uses VGGNet. DeepLabv2 has one additional technology called Atrous Spatial Pyramid Pooling (ASPP), which is the main difference from DeepLabv1. DeepLabv3+ was invented by Google for semantic image segmentation. The backbone feature extraction network used by the DeepLabv3+ model is Xception. The issue is how to modify DeepLabv3+ with improved segmentation ability and the model lightweight maintained.

3. Methodology

3.1. Improvement of DeepLabv3+ Network Architecture

In this study, an improved DeepLabv3+ network architecture (IDLN) is proposed to achieve improved eye detection and segmentation while preserving the model’s lightweight. DeepLabv3+ network is a model for semantic image segmentation by space pyramid module and atrous spatial pyramid pooling (ASPP) [36,37]. It is known to be the most effective semantic segmentation algorithm [38,39]. DeepLabv3+ network has an encoder-decoder structure to obtain clear object boundaries by recovering spatial information and optimizing boundary segmentation. An encoder module is employed to reduce feature loss and capture higher-level semantic information, while the decoder module is used to extract details and recover spatial information.
A DeeplabV3+ model uses the residual neural network (ResNet) to extract the features of the input image. The DeepLabv3 architecture is computationally efficient as embedded with an augmented atrous spatial pyramid pooling l (ASPP) to prevent information loss. ASPP provides a semantic segmentation module for resampling a given feature layer at multiple rates before convolution and probes the original image with multiple filters that have complementary effective fields of view, thus capturing objects as well as useful image context at multiple scales. Rather than resampling features, the mapping is carried out by using multiple parallel atrous convolutional layers with different sampling rates. Deeplabv3+ encoding structure is composed of a bottleneck network and void space pyramid pooling module. The void space pyramid pooling module is connected to the end of the ResNet-101 network to obtain the semantic information of multiscale images. In decoding, 4-fold bilinear up-sampling is performed on the feature map output by the encoder network by merging the low-level feature information at the channel level. Then, the lost spatial information is restored during the downsampling process.
The performance of CNN models depends on the depth, width, and cardinality of their architectures. In addition to these factors, the attention of network architecture design needs to be investigated to improve the expressiveness of a model. Expressiveness is increased by an attention mechanism based on focusing on important features and suppressing unnecessary ones. To emphasize meaningful features in spatial and channel dimensions, we apply channel and spatial attention modules to decide what and where to pay attention in the dimensions.
The flow of information within a network is facilitated by emphasized or suppressed information. DeepLabv3+ network architecture improves the information flow by cascading the convolutional block attention module (CBAM) with the MobileNetV2 network which replaces the ResNet-101. As shown in Figure 3, a feature map is adaptively refined through the module (CBAM) in the encoder and decoder structures.
The MobileNetV2 network makes the IDLN light as it is small and has low latency to overcome the resource constraints of a variety of use cases. The core part of the MobileNetV2 is a depthwise separable convolution (DSC) paradigm that reduces the number of parameters for learning features, which is different from the standard convolution paradigm. The operation of the DSC paradigm comprises two parts: depthwise (DW) and pointwise (PW) convolution [40]. With a 3 × 3 convolution kernel and a large number of channels, DW convolution reduces the computational effort by approximately 9-fold less than normal convolution.
The convolutional block attention module (CBAM) [41] contains two sequential submodules: channel attention module (CAM) and spatial attention module (SAM). These modules are applied to sequential permutations to provide better results than parallel permutations. For the arrangement of sequential processes, channel priority is better than space priority. Channel attention means the weight on each channel to enhance specific channels’ learning, which improves the performance of a model. Spatial attention represents an attention mechanism/mask on a feature map or a single cross-sectional slice of a tensor.

3.2. Evaluation of the Dataset and the Model

The proposed dataset contains labels for eye detection and eye region segmentation and uses the architecture of the eye image detection and segmentation dataset (EIMDSD). The EIMDSD is designed to have various scales, poses, illuminations, skin colors, and occlusion factors. This variability allows deep learning models to be robust to natural environments and training for eye detection and segmentation. The EIMDSD is proposed for eye detection and segmentation of eye images and is downloaded from ‘https://github.com/tccnchsu/EIMDSD’ and accessed on 1 July 2022. The EIMDSD consists of eye detection dataset and eye segmentation dataset. The eye detection dataset is used to obtain the boundary of the eyes and the categories of the left and right eyes. The eye segmentation dataset provides segmentation labels for eye regions. The JPEG images folder is included in the EIMDSD with the annotations of the label files corresponding to the authentic images. Figure 4 presents the file path structure of the EIMDSD. The eye segmentation data are grouped into the left eye and right eye segmentation datasets, both of which have the original and corresponding labeled images.

3.3. Dataset and Data Collection

With a face mask on, Dlib’s 68 model does not recognize landmark points as the mask blocks the mouth. In this case, only human eye detection and segmentation are used for an identification algorithm. Therefore, an appropriate dataset is necessary for training a deep learning model for eye detection and eye segmentation. Figure 5 presents the process of eye detection and segmentation and eye detection.
The proposed dataset for eye detection includes eye images from face images of the WIDER FACE dataset [42] and the Wild East Asian Face Dataset (WEAFD) [43]. WEAFD images were collected and labeled into seven ethnic categories to explore the ethnic classification of East Asians. However, the two datasets do not provide labels for eye detection and segmentation [44,45,46]. In addition to the WEAFD images, more images were found on the internet, and 3000 images in total were collected in this study. The images had significant variances in the scale, posture, occlusion, expression, dress, and illumination. Such variance was expected to effectively enhance the robustness of the trained model. Figure 6 shows the examples of the images of the eyes in the dataset. The left eye was labeled as 0, and the right eye was labeled as 1. Cross-checking of the labels was performed to reduce labeling errors.
The images were segmented for eye focus, eye tracking, pupils, and iris. The data were created to develop a model for segmenting the elements in the eye images. Each element was labeled, then, for eye segmentation. The directory of the segmentation dataset is shown in Figure 7. The eye segmentation dataset consists of the left eye and the right eye and contains the original eye image and labeled images.
The images of the left and right eyes cropped from the original eye image are shown in Figure 8 as follows.
(1)
The characteristics of the left and right eyes were defined, and the images of the eyes were obtained from the images of WIDER, WEAFD, and other collected images. Approximately, 3000 images were collected.
(2)
The images were manually checked and cleaned up. Images with incorrect characteristics were removed to ensure correct segmentation. From the images that only showed one eye due to head orientation, we collected the images of one eye. The obtained dataset was thought to be appropriate for application.
Figure 9 shows the labeled left and right eye images in the dataset. Labeling fits the outer contours of the eyes and completely encloses the external shape. All images were checked for labels to reduce labeling errors and create an accurate dataset. In a total of 3000 eye images, we allocated 1500 for the left eyes and the right eyes equally.

3.4. Performance Indexes for Benchmark Evaluation

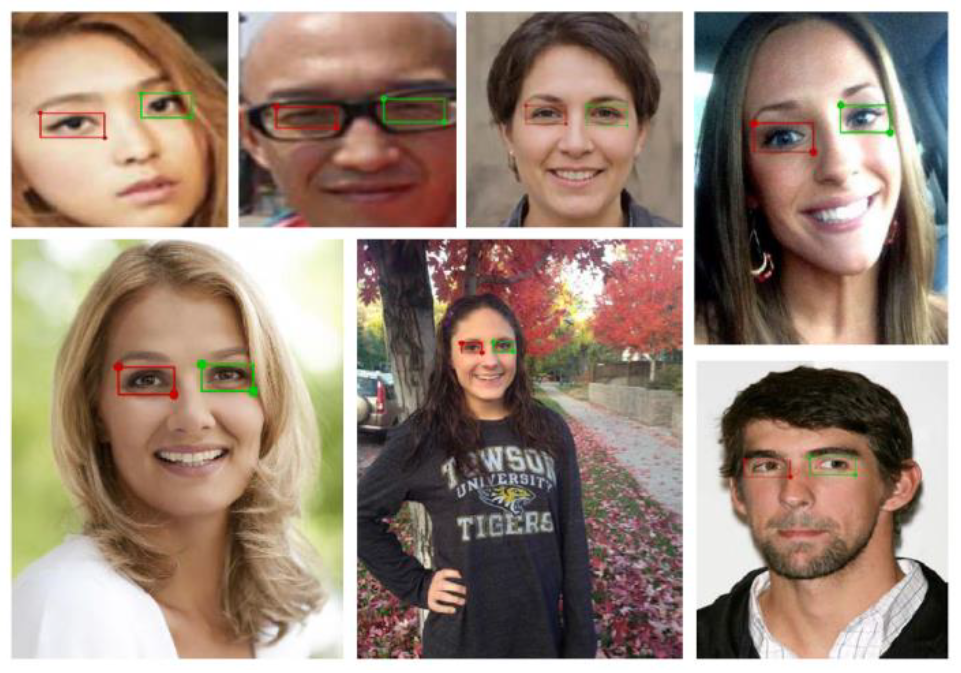
3.4.1. Performance Indexes of Detection

Different eye detection algorithms are used to assess the quality of the eye detection dataset. The validity of the dataset can be tested by completing eye detection tasks. To evaluate and compare the performance of eye detection models on the dataset, a unified evaluation standard was used. Evaluation indexes including precision, recall (sensitivity), precision–recall curves, and mean average precision (MAP) were used to evaluate the performance of the models.
Precision and recall are defined as Equations (1) and (2), respectively.
Precision = T p F p + T p
Recall = T p T p + F n
where T p (true positives) represents the number of positive cases correctly identified as positive cases, F p (false positives) represents the number of negative cases correctly identified as positive cases, and F n (false negatives) represents the number of positive instances incorrectly identified as negative samples. The MAP index is necessary to obtain the precision–recall curve and calculate the average precision (AP). The precision–recall curve represents the relationship between precision and recall. AP measures the effectiveness of the trained model. The AP calculation method adopts the 11-point scale in VOC2007 as shown in Equation (4). MAP is the average value of AP as shown in Equation (5) as a global performance index.
P M a x P r e c i s i o n R = max R ˇ R P ( R ˇ )
A P = 1 11 R 0 , 0.1 , , 1 P M a x P r e c i s i o n R
MAP = 1 Q R q Q R A P q
In Equation (3), P M a x P r e c i s i o n R is the maximum value when Recall R ˇ R , and Q R the number of categories including the left and the right eyes.

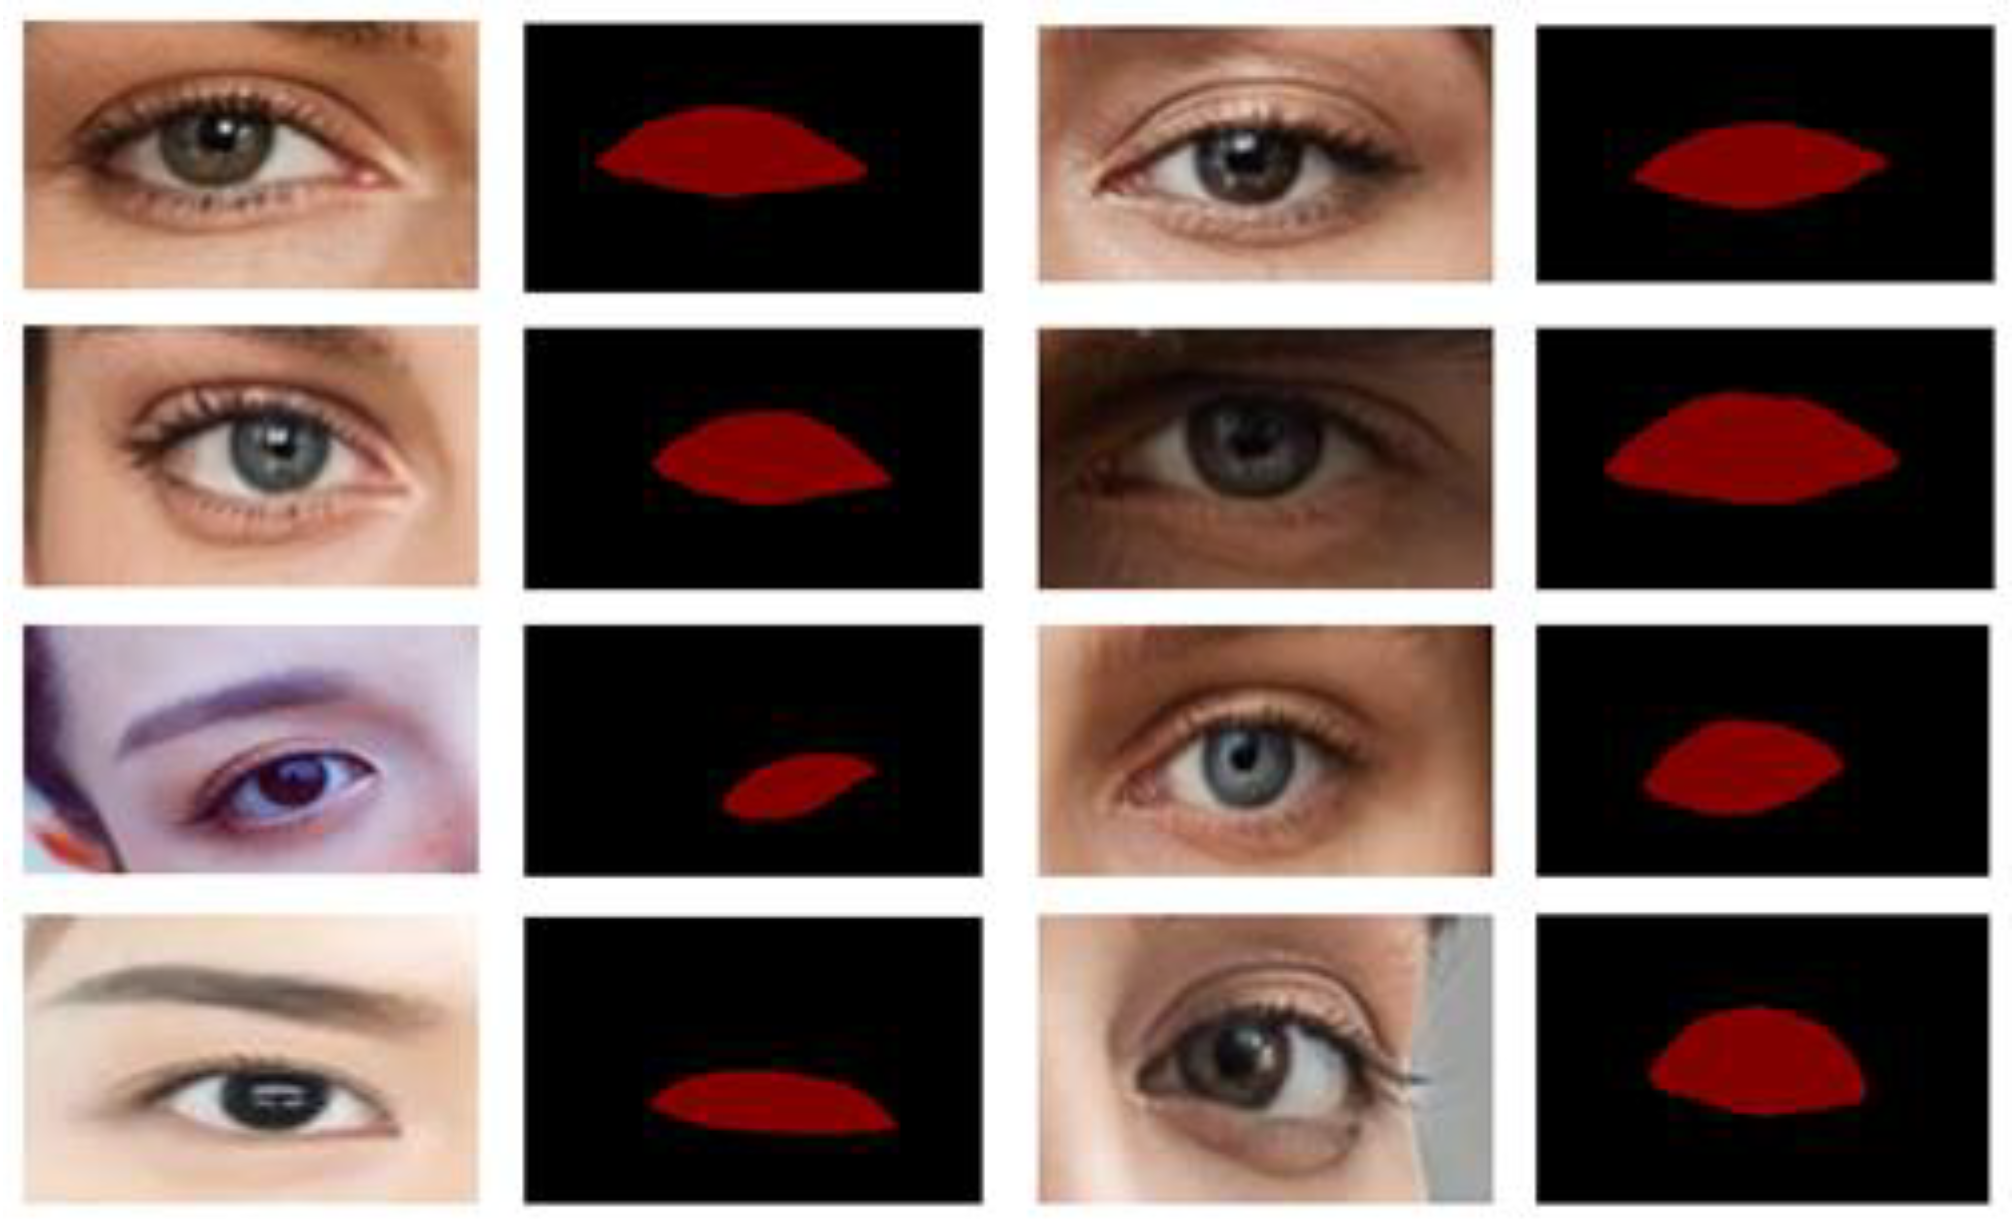
3.4.2. Performance Indexes of Image Segmentation

It is essential to evaluate the performance of the algorithms of image segmentation. For the evaluation of different performances, different evaluation indexes are necessary. Three evaluation indexes used in this study include mean intersection over union (MIoU), mean pixel accuracy (PA), and Kappa. MIoU is calculated with the mean of the intersection over union (IoU, Equation (6)) of the labeled region and the segmented ROI.
I o U = A B A B
where A denotes the labeled region and B is the segmented ROI. The value of the IoU is between 0 and 1. The intersection between A and B is small when the value is near 0. On the contrary, the value becomes near 1 when the intersection between the labeled region and the segmented ROI is larger. The equation of MIoU is
M I o U = i = 0 K I o U i K
where K denotes the total number of the categories of each ROI with its IoU. PA is calculated from the proportion of the number of correctly classified pixels divided by the total number of pixels of an image in the category of i and j. PA indicates the number of pixels that are correctly classified.
P A = i = 0 K p i i i = 0 K j = 0 K p i j
MPA is obtained as Equation (9) by dividing PA by K.
M P A = 1 K + 1 i = 0 K p i i j = 0 K p i j
Image segmentation is the task to classify and label each pixel into one category. Kappa is calculated from the confusion matrix that includes the number of true positive, false positive, false negative, and true negative. Kappa is used to evaluate the correspondence between the model prediction and the target label. The interval of Kappa is [−1, 1]. When the value approaches 1, better image segmentation is performed. Kappa is calculated as Equation (10).
K a p p a = p o p e 1 p e
where p o = T P / n , p o is the number divided by the number of the true positive cases, and p e is defined as follows.
p e = i = 0 K M i N i n 2
where K denotes the number of the categories, M i denotes the number of pixels classified in the i category, Ni is the number of the total pixels in the i category, and n 2 is the square of the total number of all pixels of an image.

4. Results and Discussion

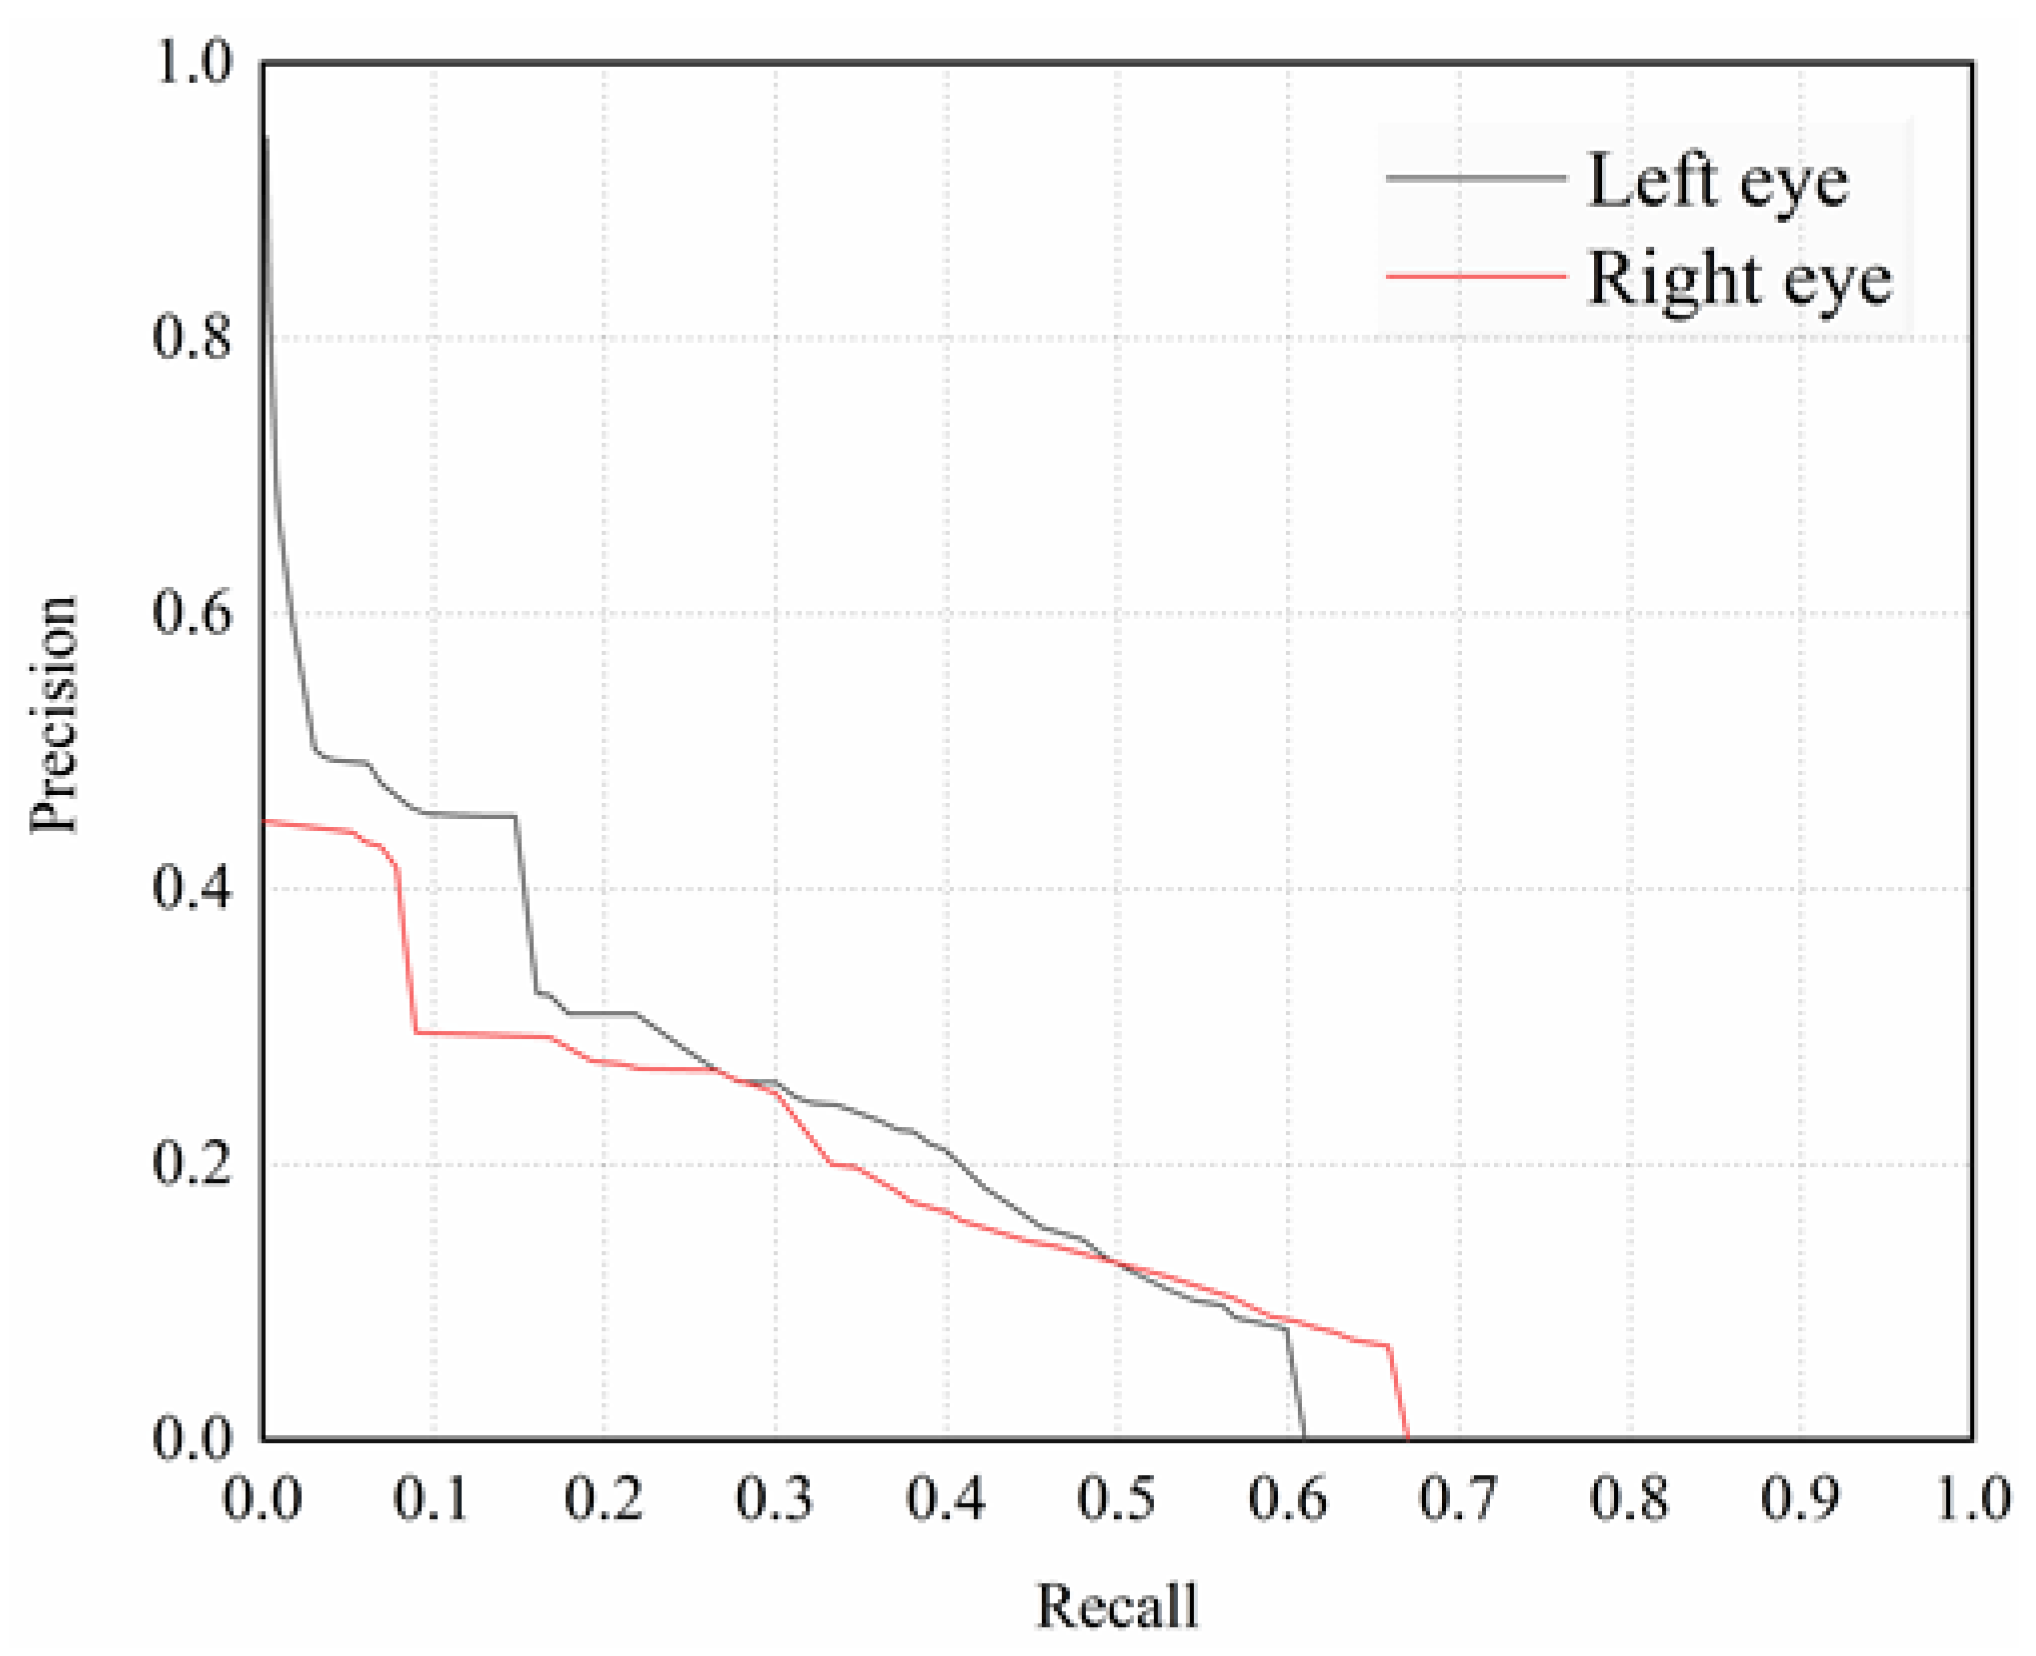
4.1. Model Evaluation in Eye Detection

YOLOv3 and Faster-RCNN were selected for evaluating the proposed dataset as they are fast and accurate in target detection. The models of YOLOv3 and Faster-RCNN were tested for locating the eyes and classifying the left and right eyes. By using the proposed dataset and evaluation indexes, the detection ability of the two models was compared to verify the validity of the dataset. the proportions of training data, verification data, and test data were 70, 20, and 10%, respectively.
Figure 10 shows the result of the evaluation performance of the YOLOv3 model. The precision is maintained at over 0.8 for the right eye and around 0.6 for the left eye till the recall reaches 0.6 and 0.8, respectively. These results verify the validity of the proposed dataset, with which the YOLOv3 model performed eye detection successfully. Figure 11 presents the performance of the Faster-RCNN model. While the recall increases, the precision decreases rapidly. This shows that the Faster-RCNN model is not as appropriate as the YOLov3 model. Given the training times (100 epochs) and learning rate (0.000125), the evaluation index of the YOLOv3 and Faster-RCNN models are shown in Table 1.
The YOLOv3 model shows an AP of 55.98 for the left eye and 63.67 for the right eye. The Faster-RCNN model shows an AP of 17.47 for the left eye and 14.88 for the right eye. The MAP of the YOLOv3 model is 59.825, while that of the Faster-RCNN model is 16.175. The performance of the YOLOv3 model in detecting eyes is better than that of the Faster R-CNN model in general. This result is caused by that the Faster R-CNN model is based on RPN 300 + VGG methods predictions. Mean Average Precision (mAP) is commonly used to analyze the performance of object detection and segmentation systems. An RPN is a fully convolutional network that simultaneously predicts object bounds and objectness scores at each position. The RPN are used by Fast R-CNN for detection. Since YOLOv3 is supposed to detect objects at multiple scales at each of the last three residual groups, a detection layer is attached to make object detection predictions.

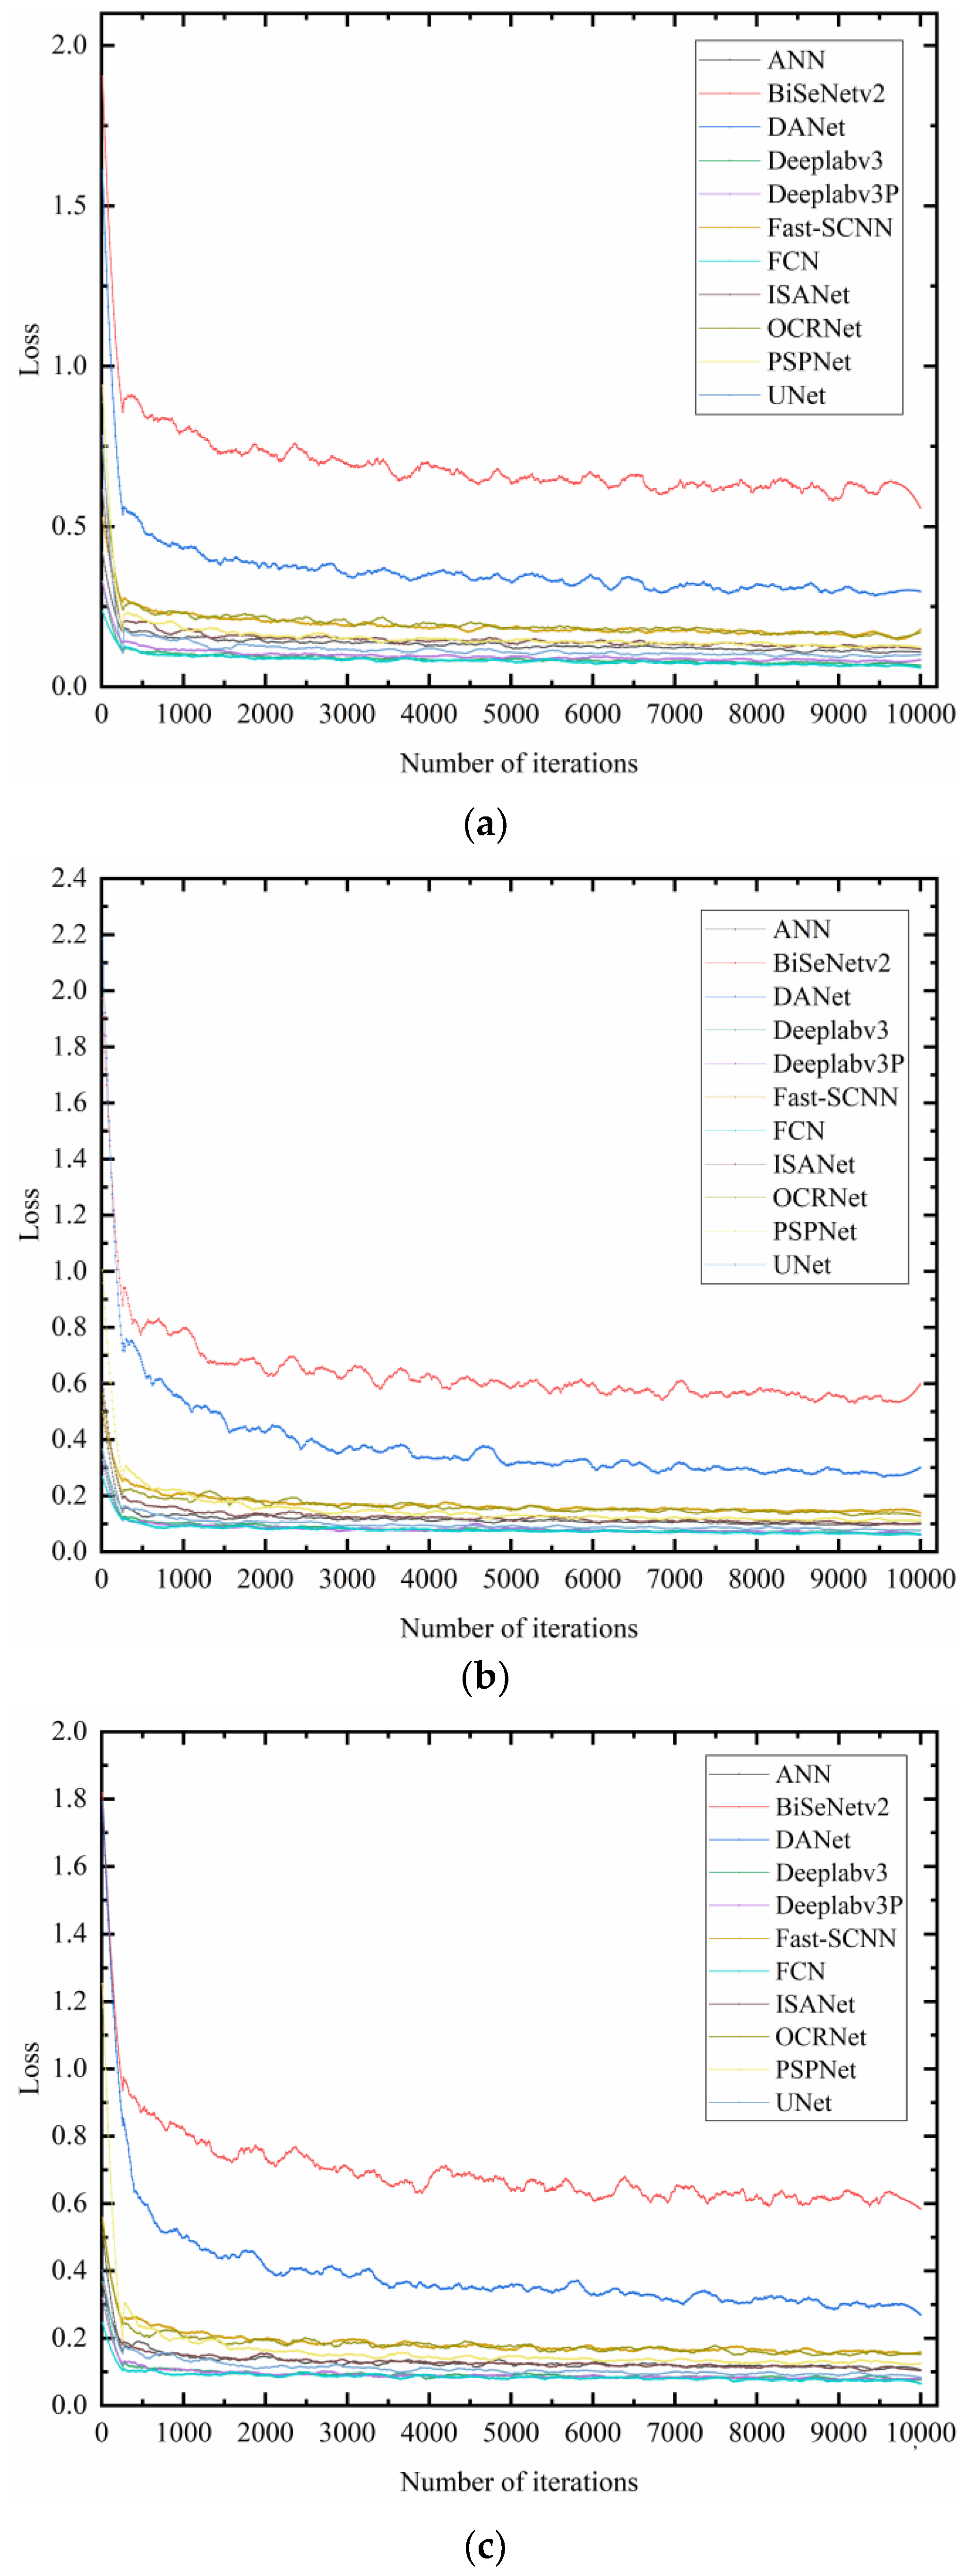
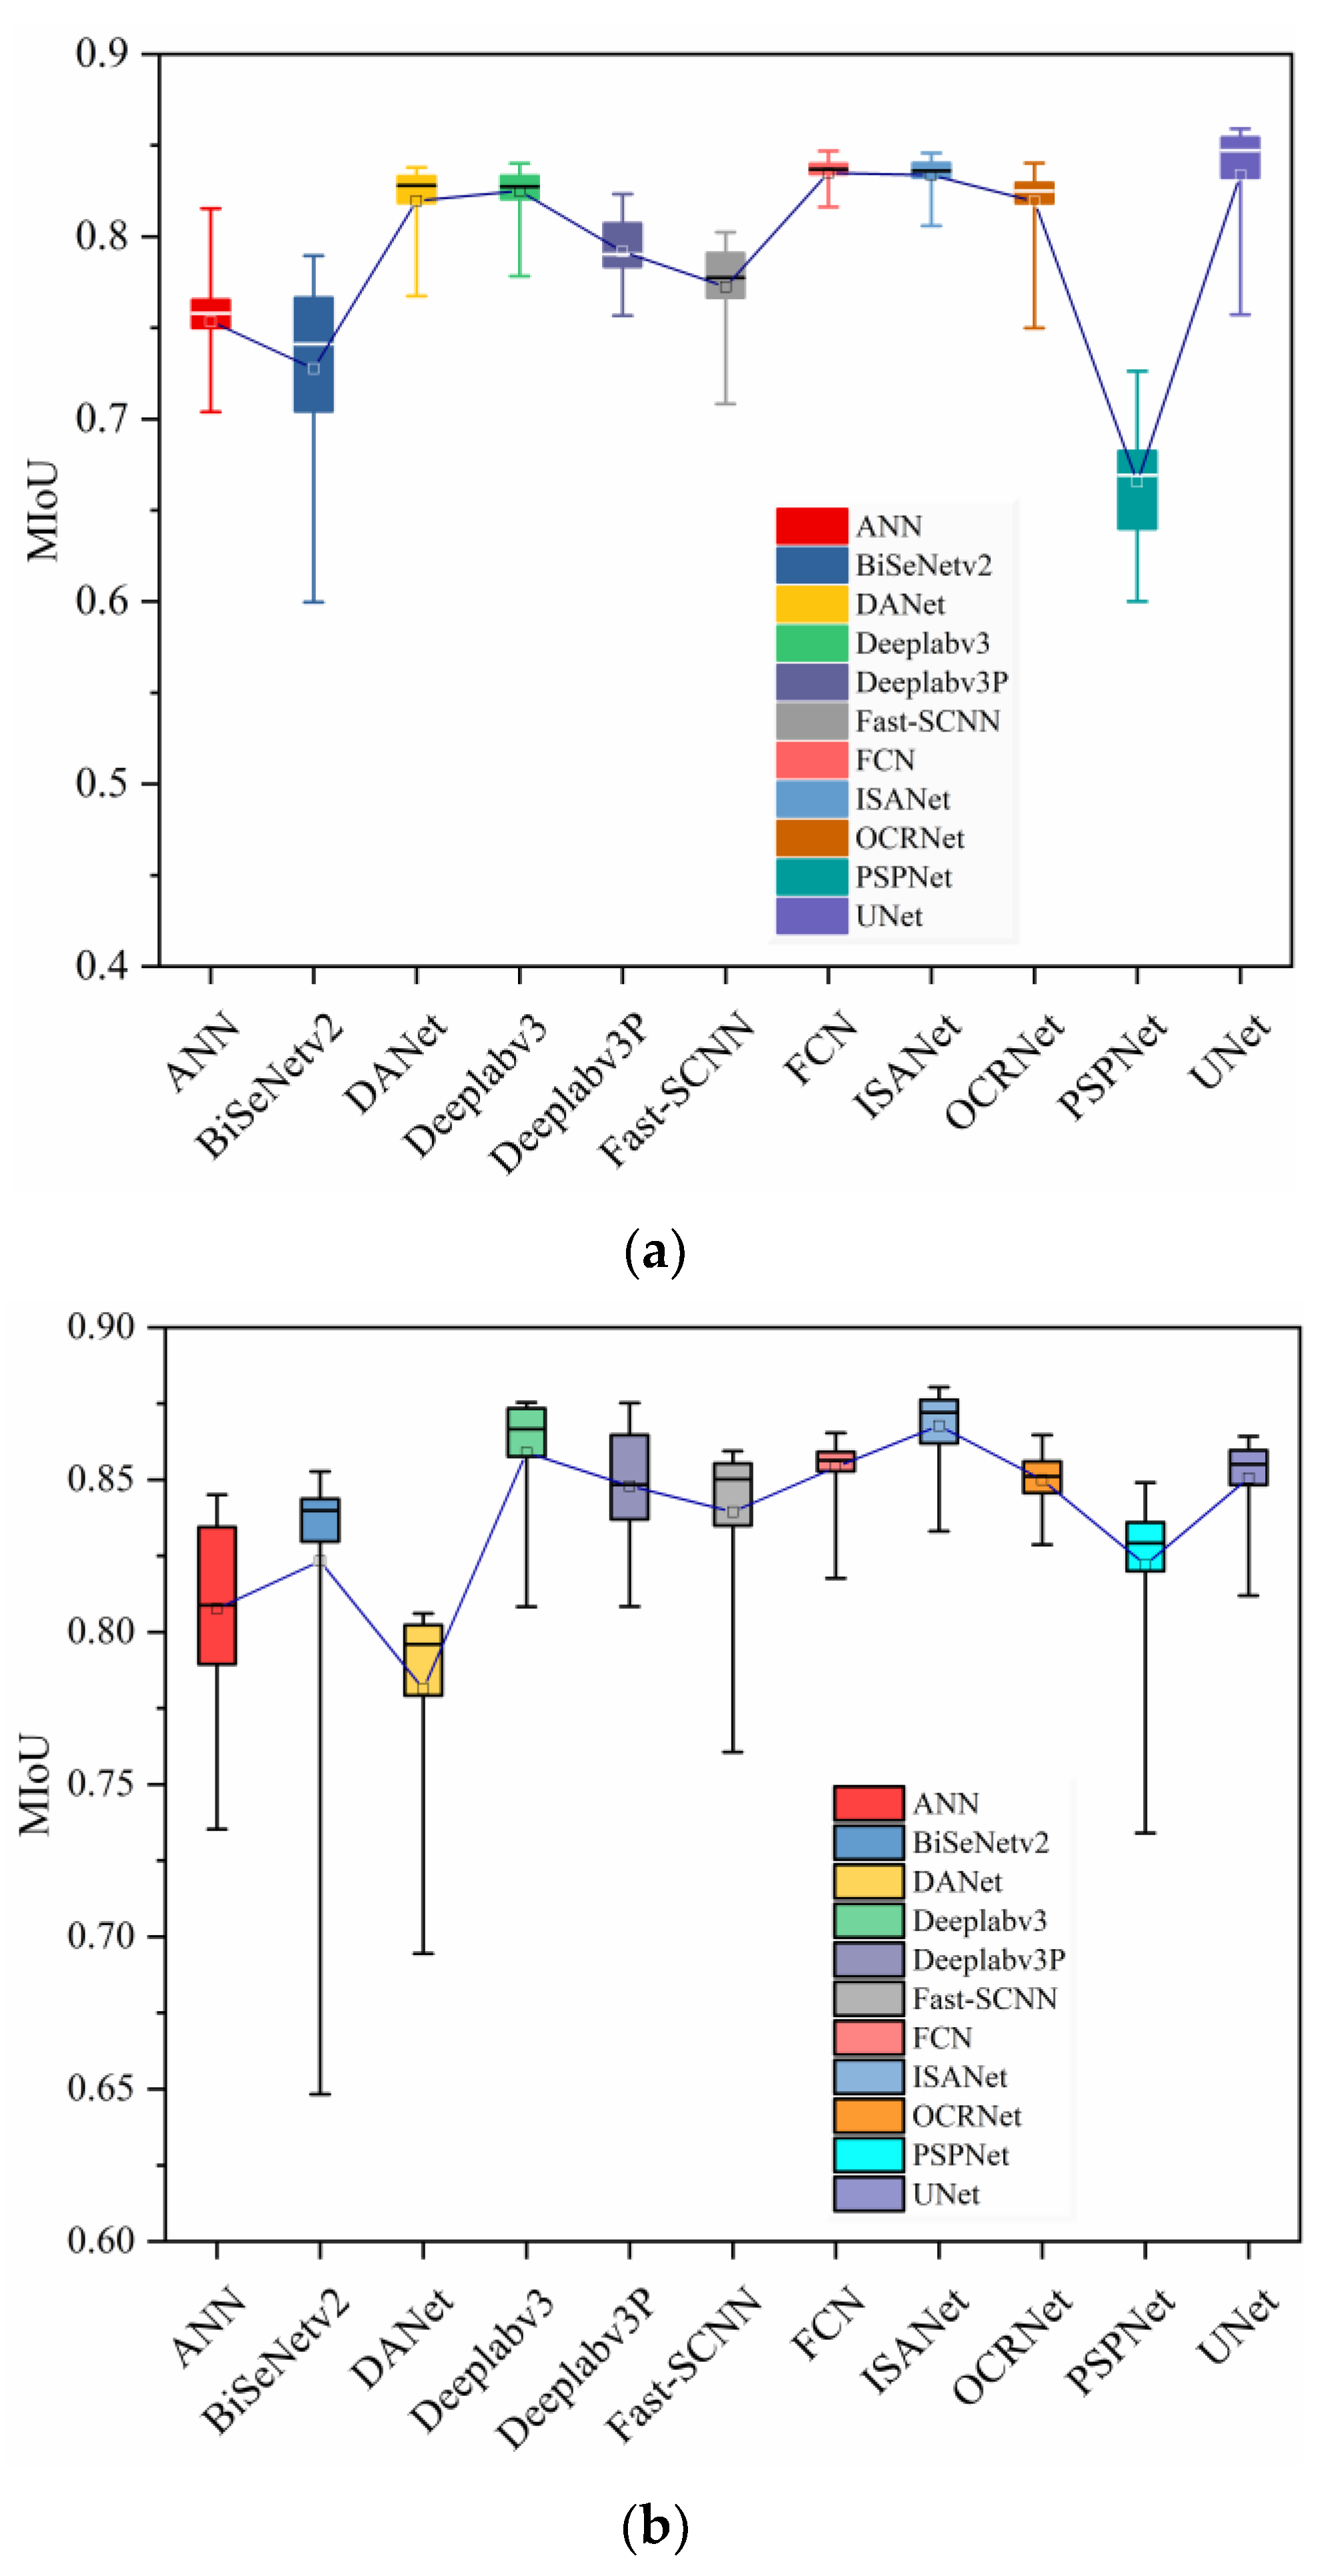
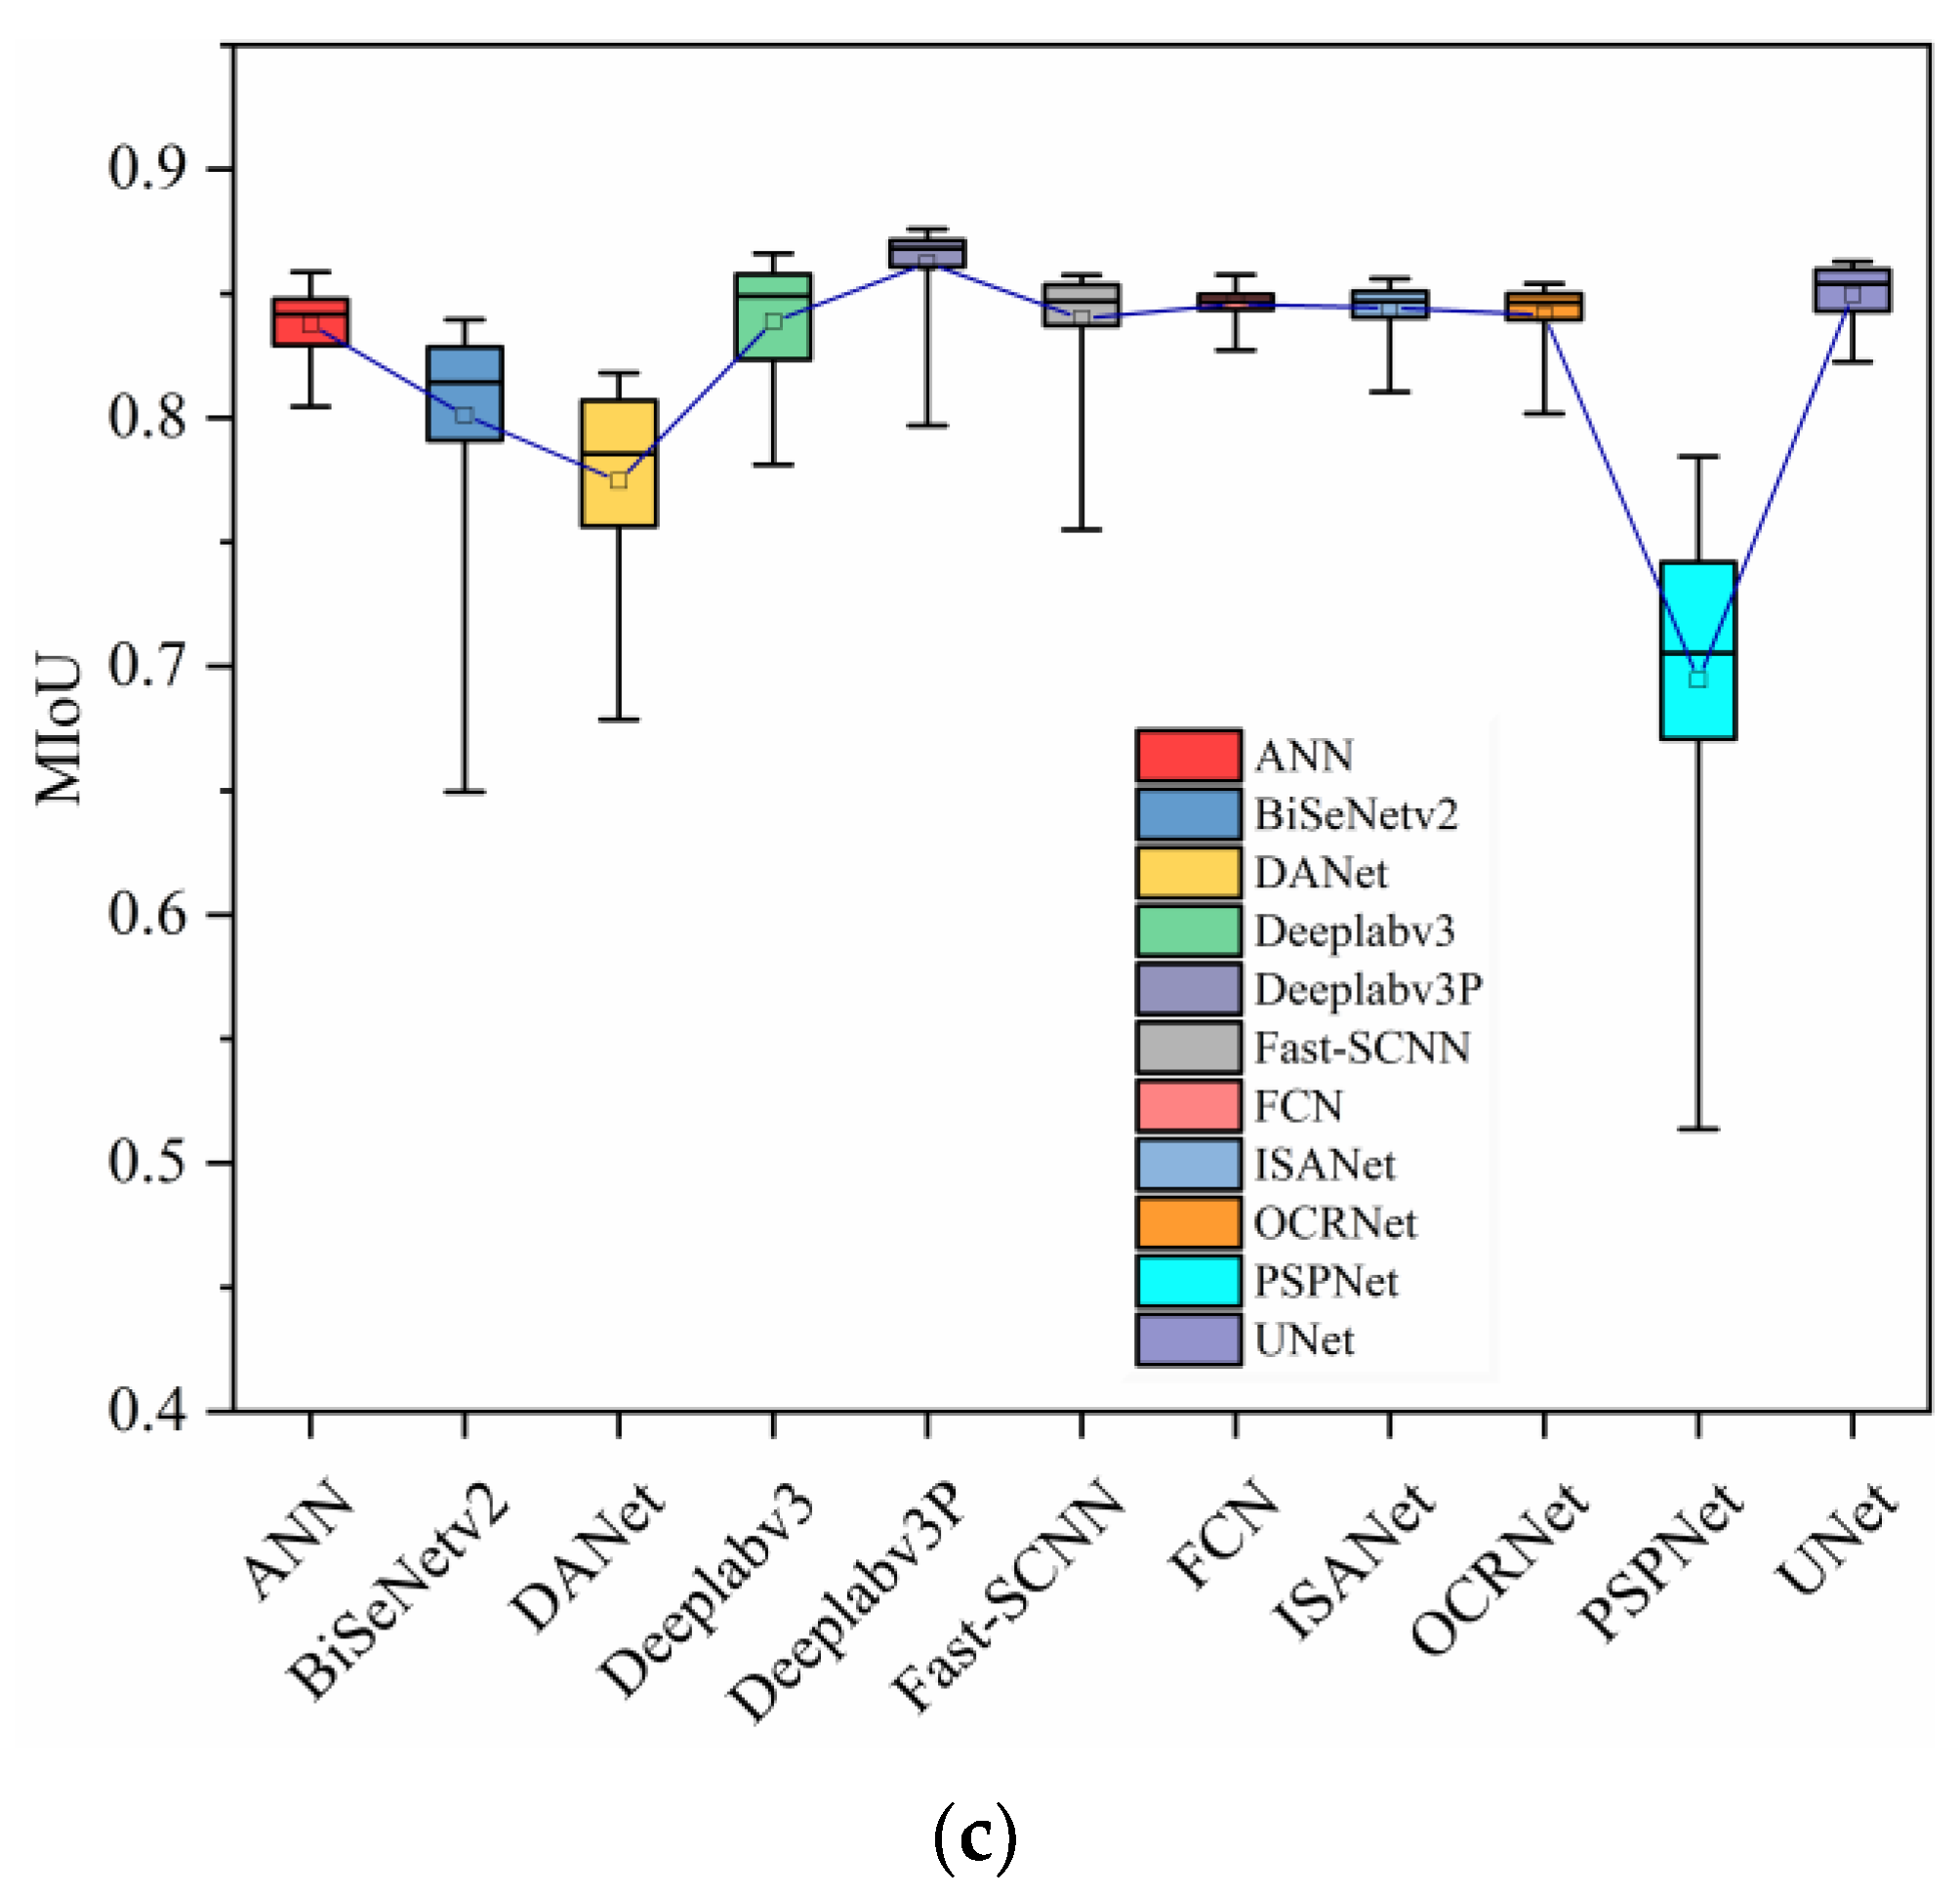
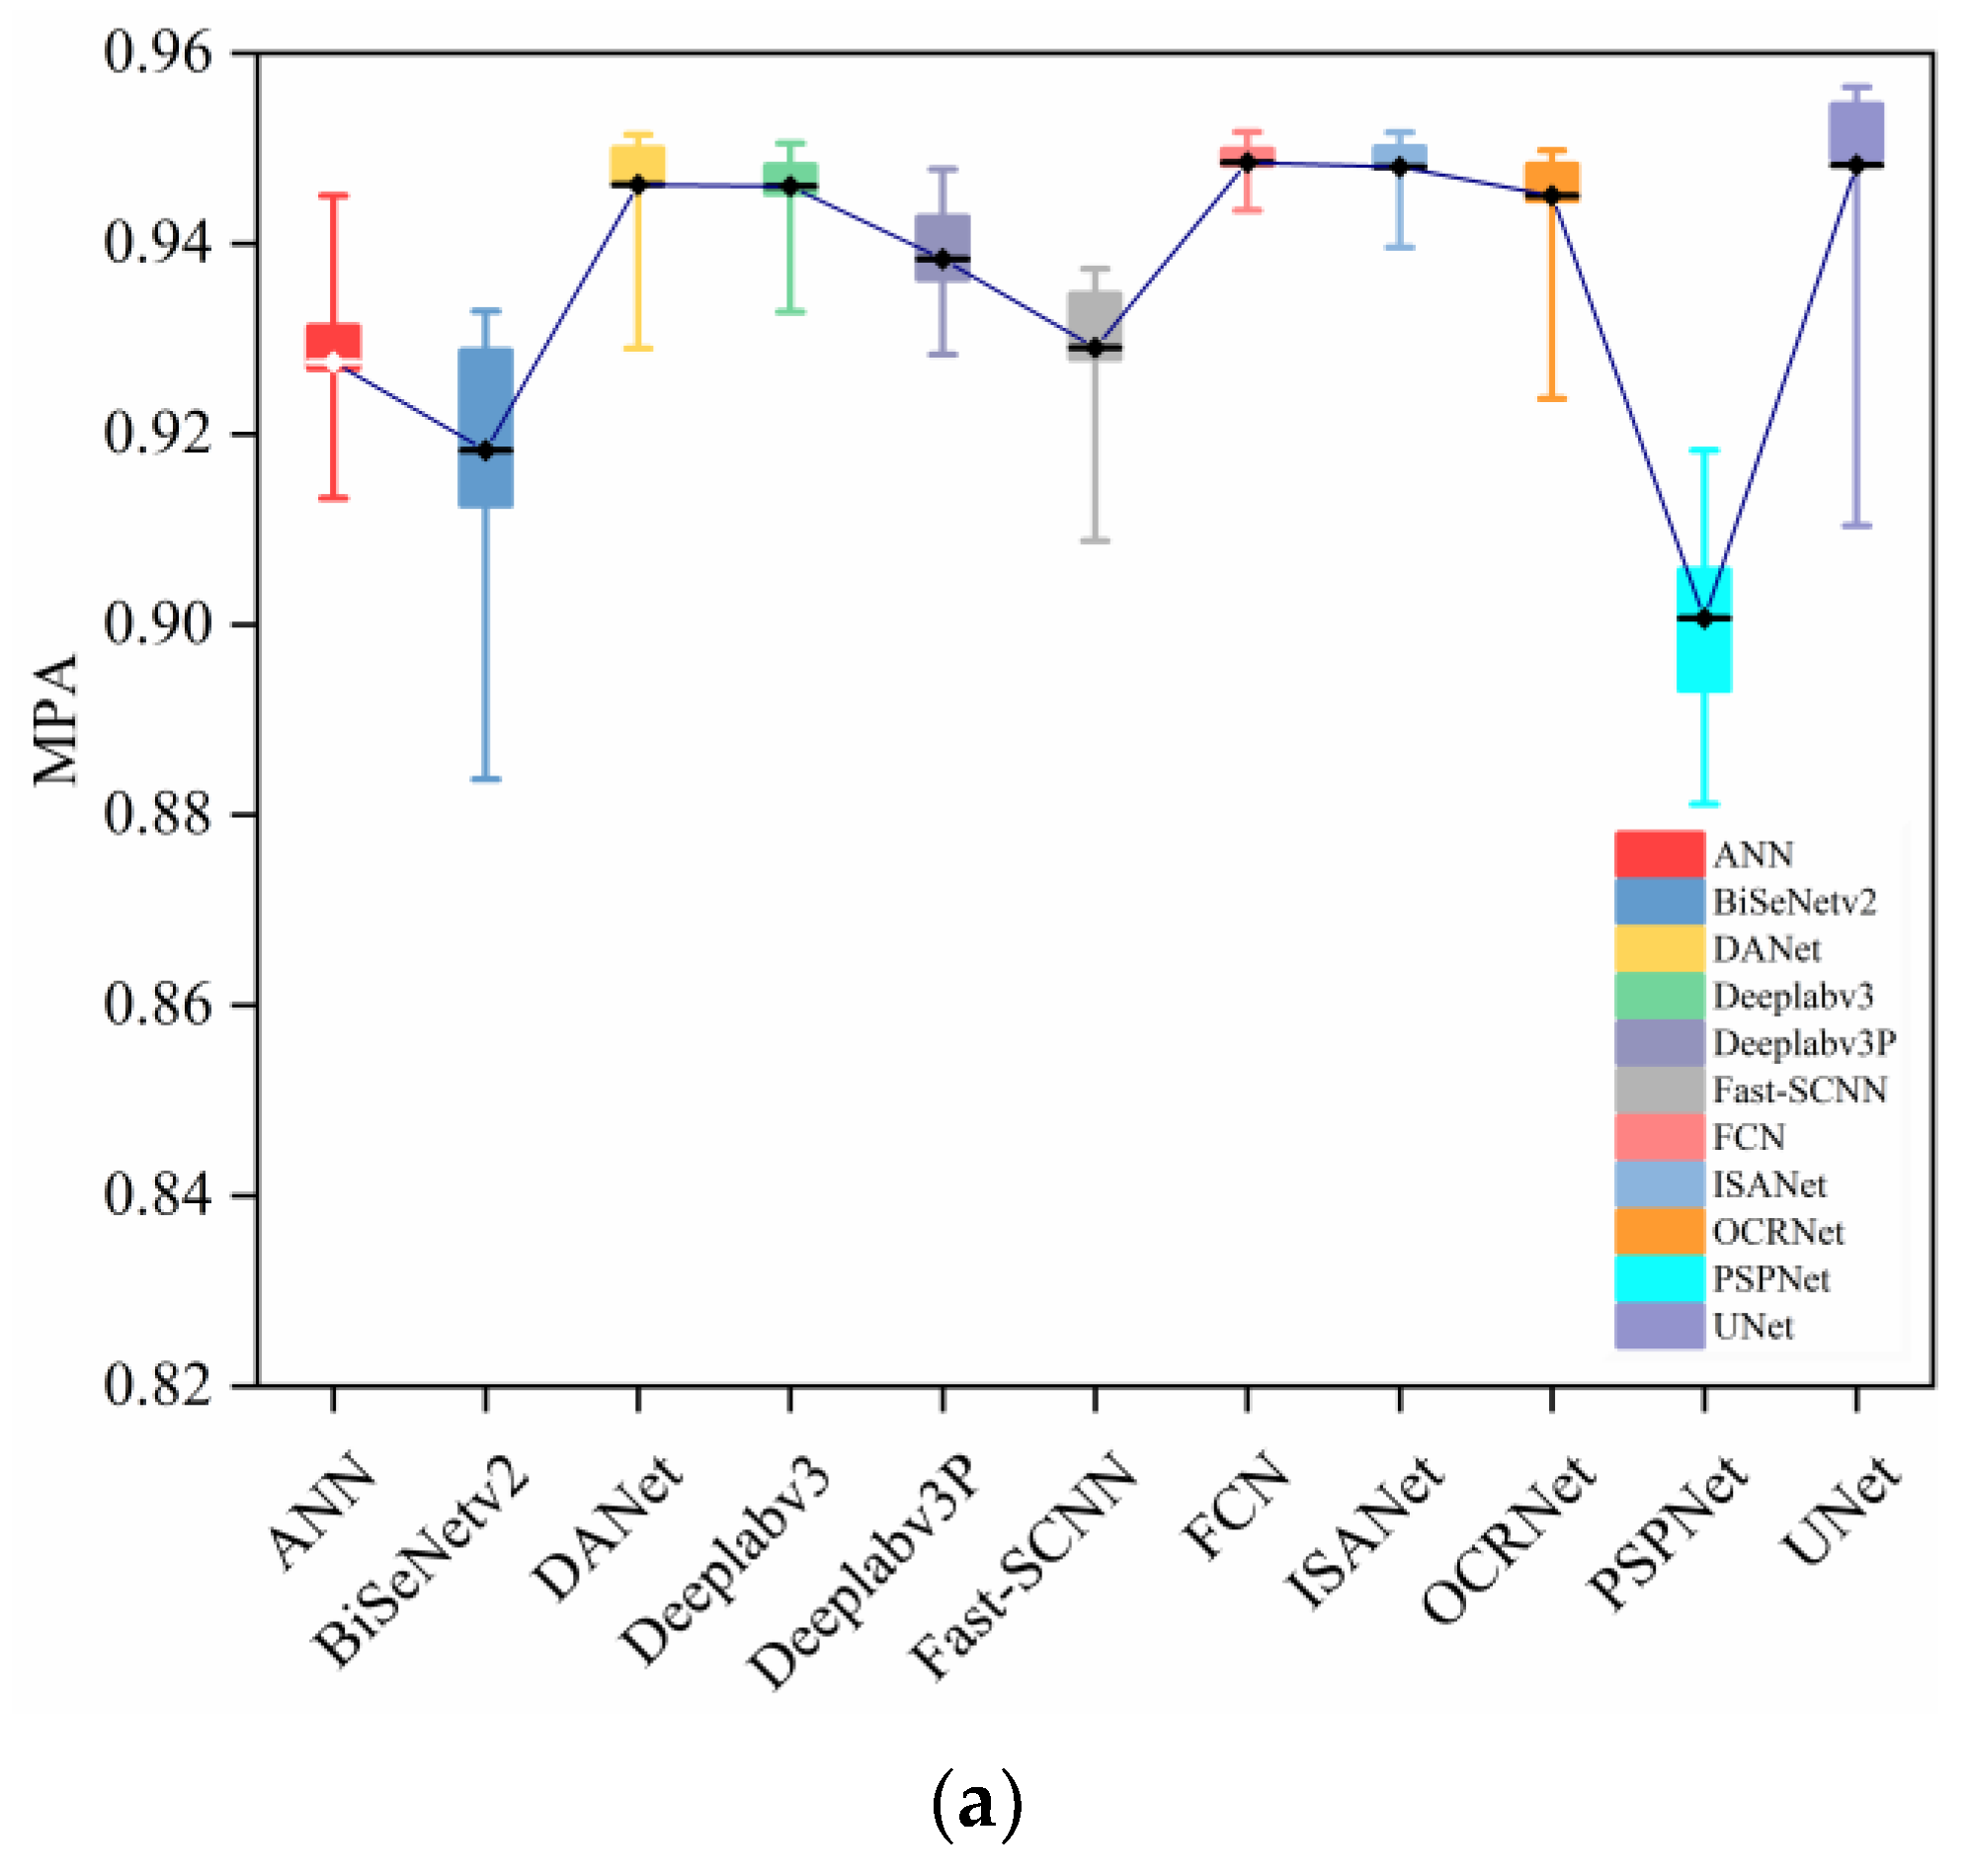
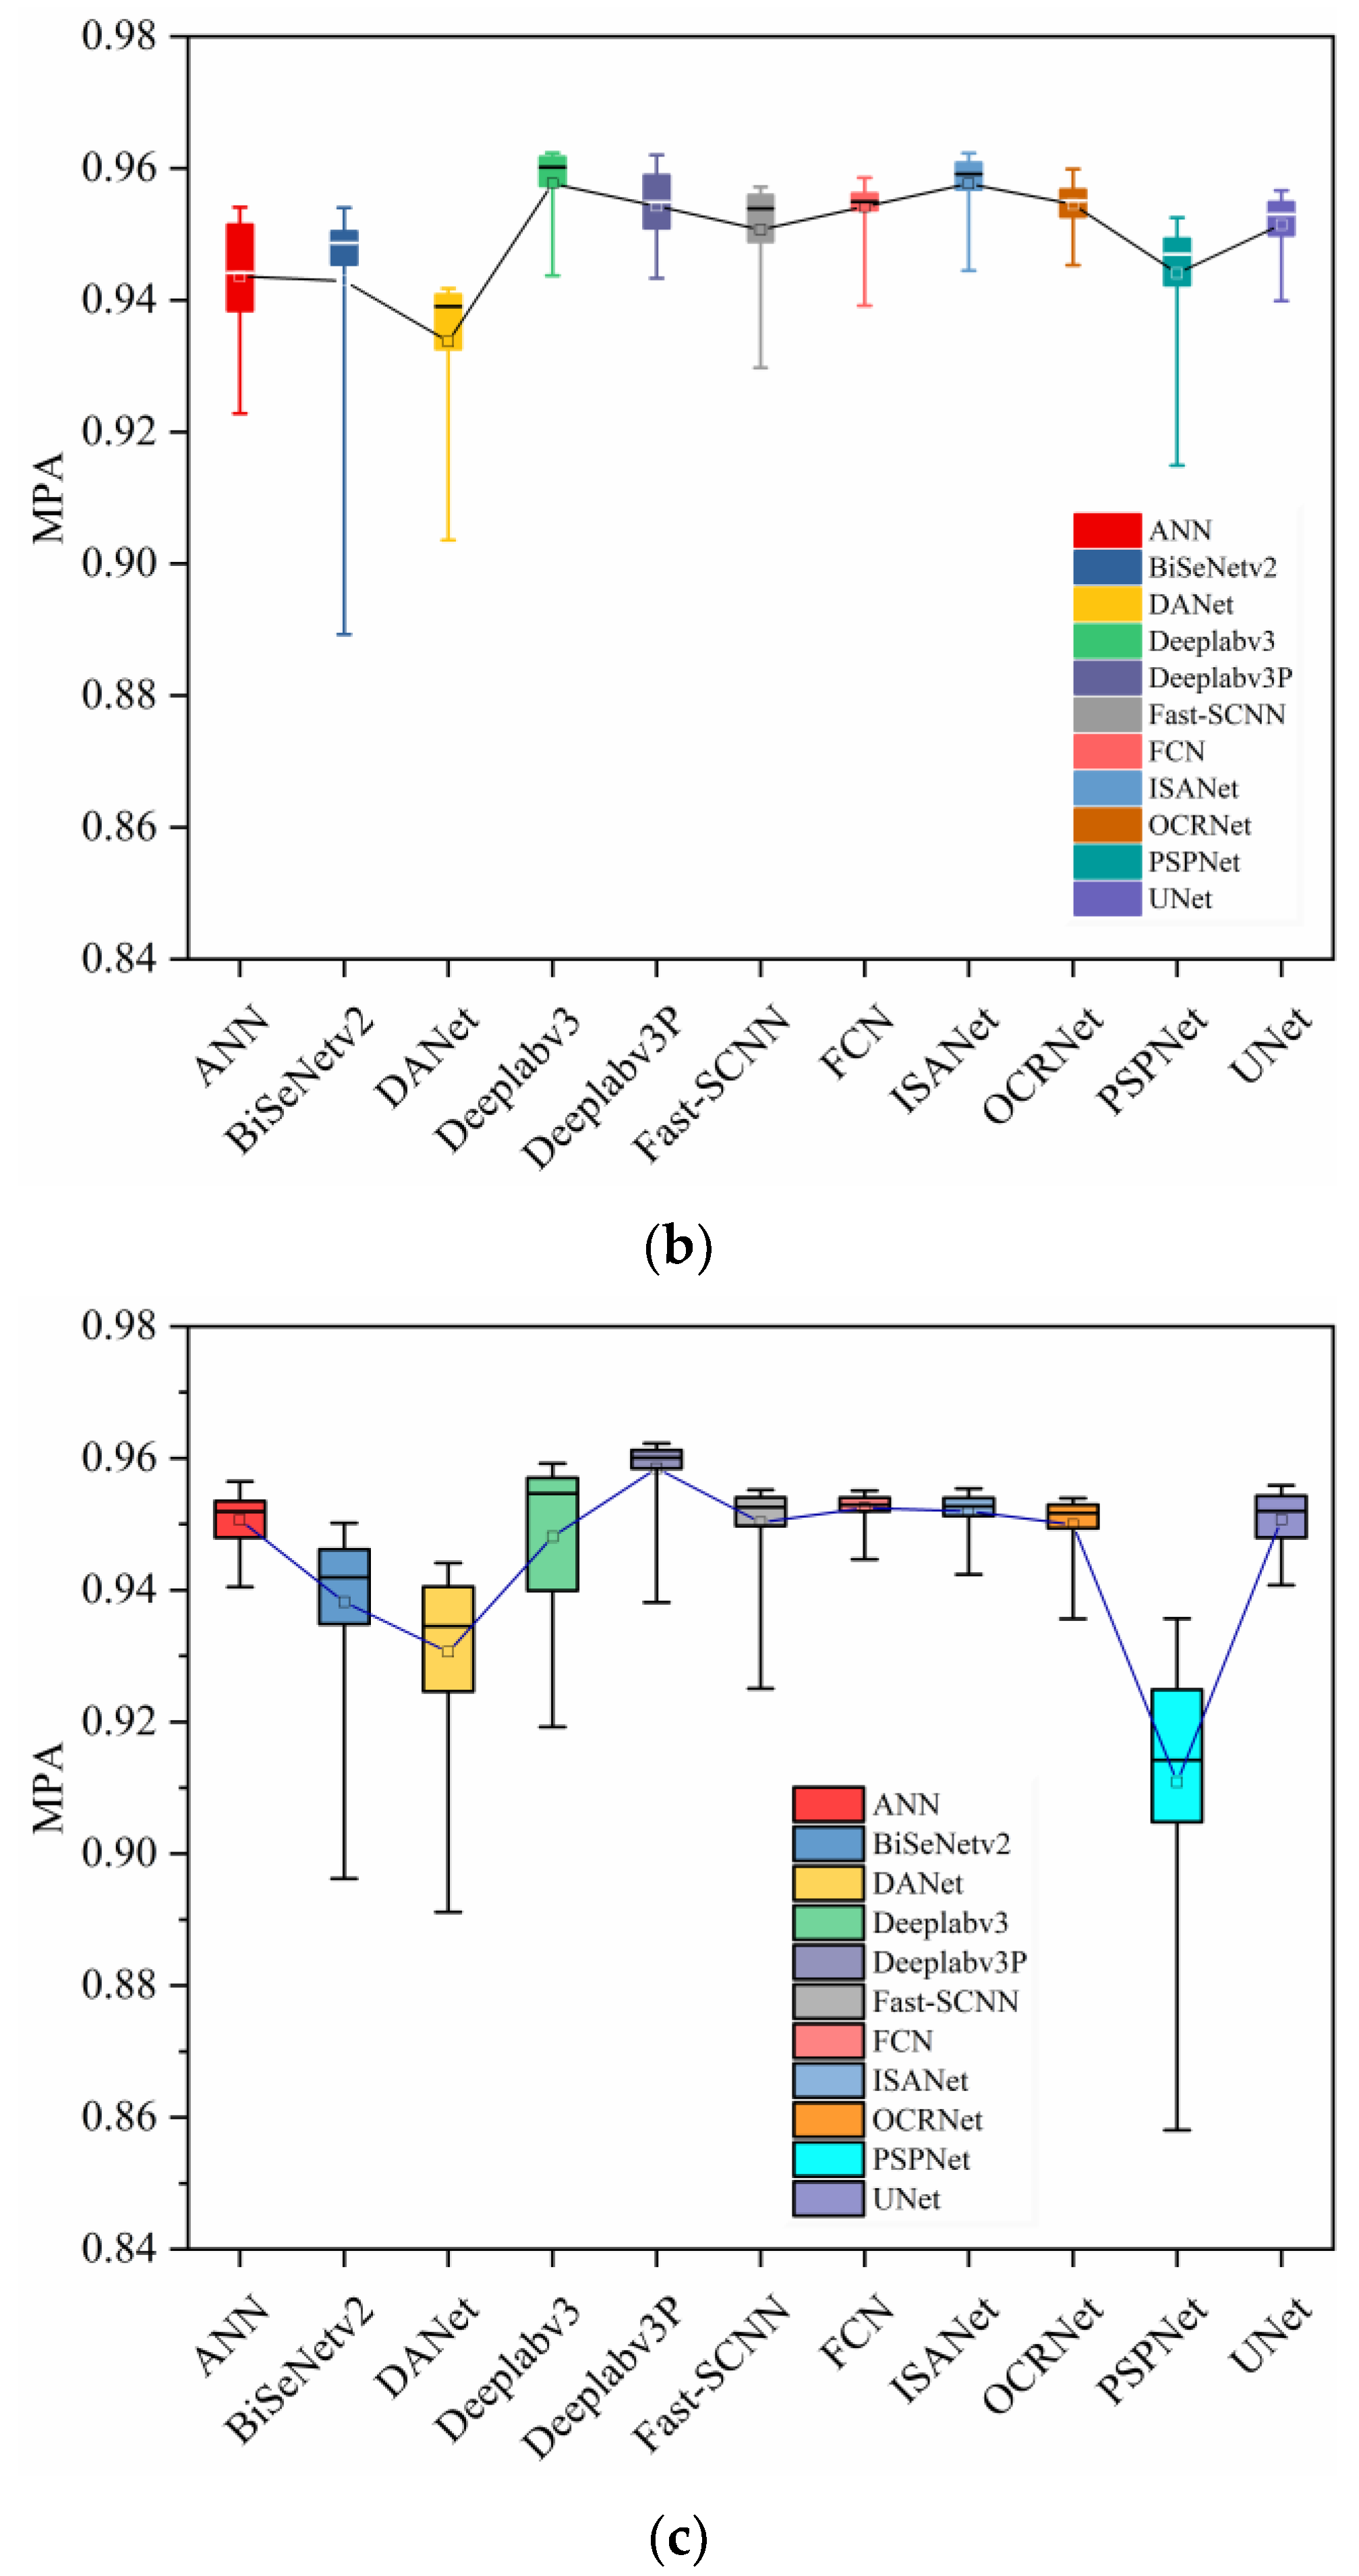
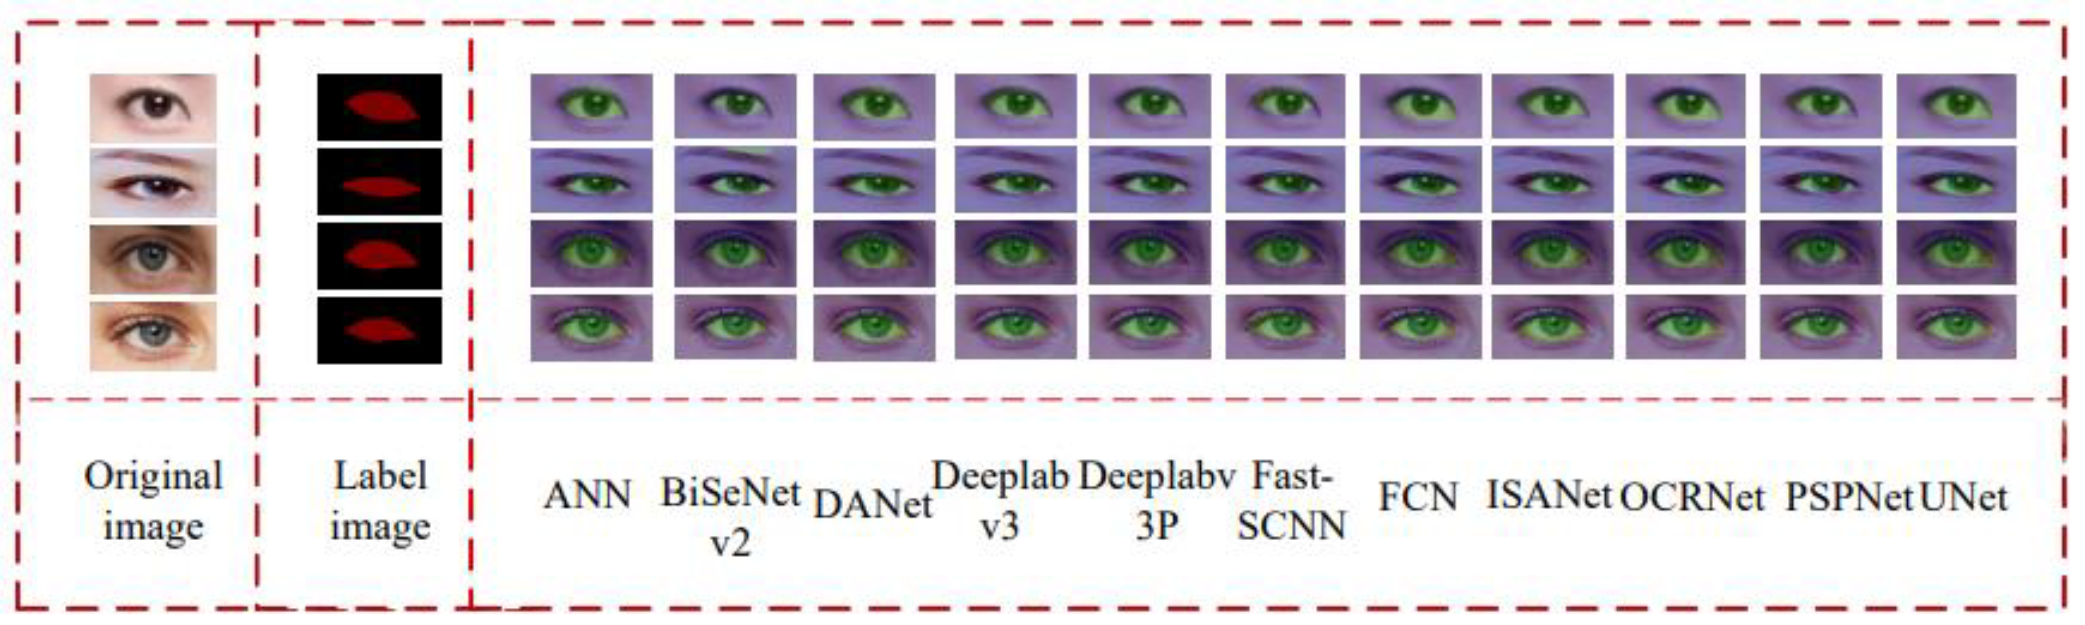
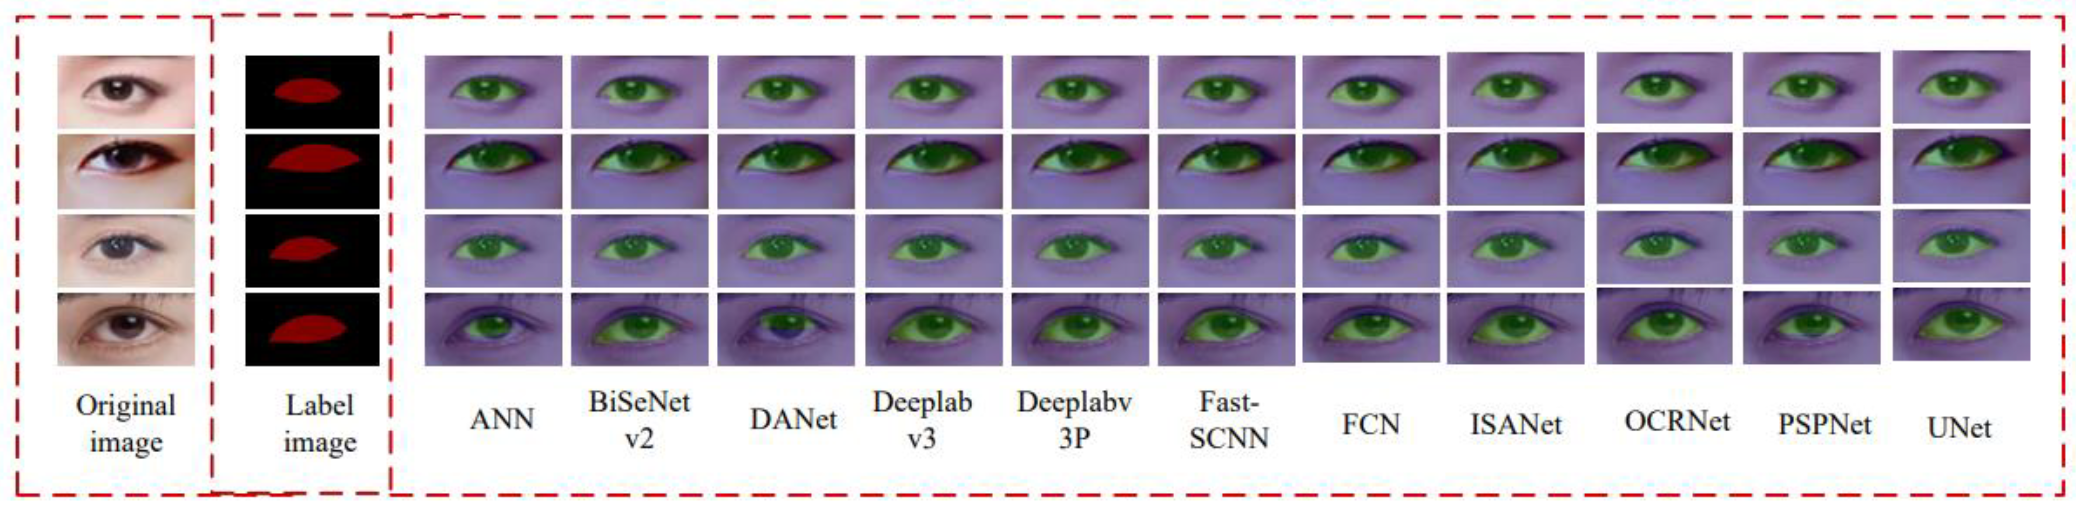
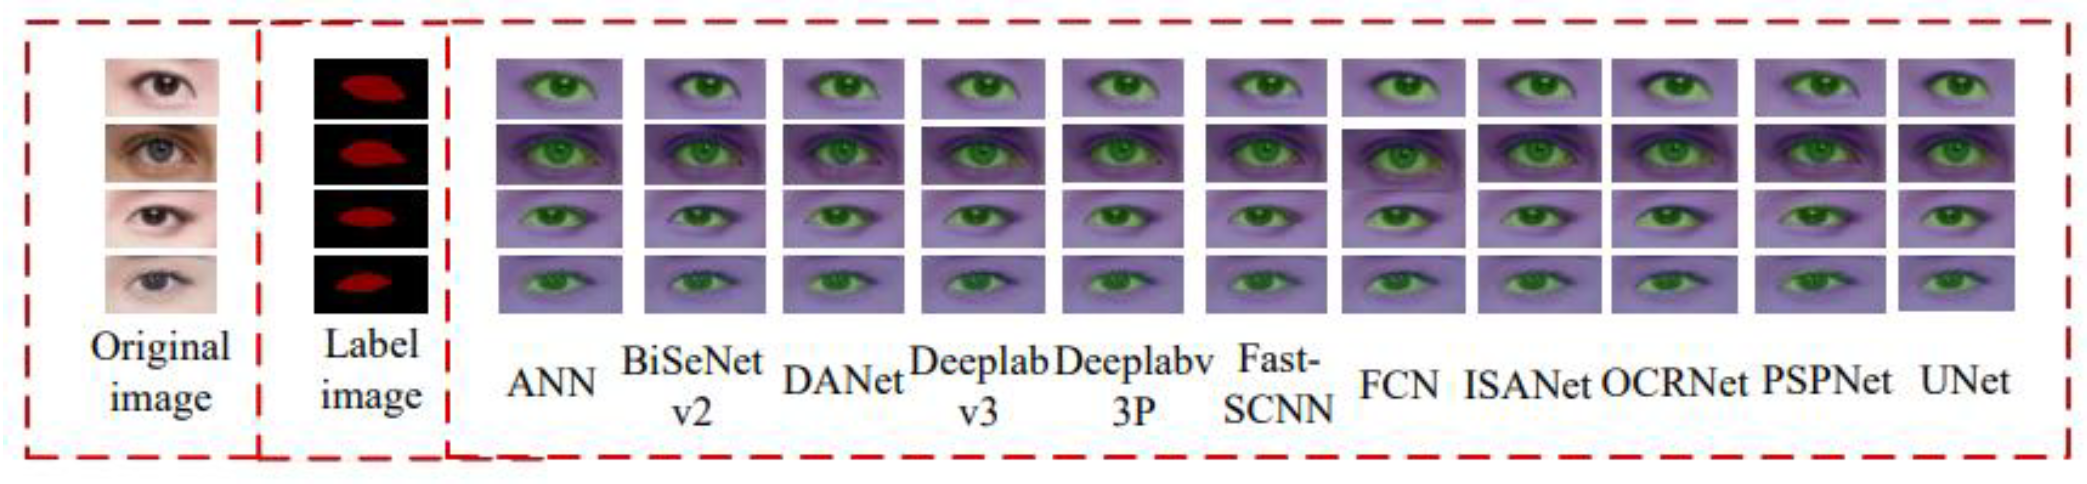
4.2. Model Evaluation in Eye Segmentation

Eye segmentation was carried out for the three different datasets of the left eyes, right eyes, and both eyes. The data for the eye segmentation of the left and the right eyes were used separately for the training, verification, and testing of deep learning models.
A total of 11 deep learning models were tested for the evaluation of the eye image segmentation—ANN, BiSeNetv2, DANet [31], Deeplabv3 [32], Deeplabv3P [33], Fast-SCNN [34], FCN [35], ISANet [36], OCRNet [37], PSPNet [38] and UNet [39]. The models were tested in the training of the three types of data, and the results are shown in Figure 12.
The trend of changes in the loss values of 11 models is similar. Over 500 iterations, models tend to show constant loss values. The BiSeNetv2 model has the largest loss value, while the FCN model has the smallest loss value. Box plots of Figure 13 represent the MIoU of the model. The height of a box represents the lower and upper quartiles (Q1 and Q3), and the second quartile Q2 is marked by a line inside the box. The upper and lower whiskers present the maximum and minimum values in the dataset excluding outliers, which corresponds to [Q1 + (1.5 × IQR)] and [Q1 − (1.5 × IQR)], respectively. IQR is the interquartile range and is calculated as (Q3 − Q1). A small square in the box represents the average value. The horizontal line in each box represents the median of the MIoU. The average MIoU of different models is connected by a line.
Figure 13a shows the results of 11 models on the left eye data. UNet shows the best segmentation performance, and PSPNet has the worst segmentation performance. Figure 13b shows the segmentation performance of 11 models on the right eye data. ISANet shows the best performance, while DANet shows the worst. Figure 13c shows the segmentation performance on the right and left eyes data, and the performance of PSPNet is the worst. Figure 14 shows the performance of the 11 models on the MPA index. In Figure 14, the horizontal line in each box represents the median MPA of different models, and the small box represents the average MPA of the models. Figure 14a shows that UNet has the best segmentation performance and PSPNet has the worst performance on the left eye data. On the right eye, Deeplabv3P shows the best segmentation, while DANet is the worst. Finally, Figure 14c shows the segmentation performance of 11 models on the total eye segmentation dataset. The segmentation performance of PSPNet is the worst for the left and right eye data.
Each model was used to predict and visualize the segmented and labeled image. The segmentation results of the 11 models on the left eye segmentation dataset are shown in Figure 15. From the original image of the left eye, each model created the corresponding label images and visualized segmented images. By using the left eye data of the validation dataset, the models were tested with several evaluation indicators to determine which model showed the best segmentation performance on the left eye dataset (Table 2). In general, the UNet model shows the largest MioU (0.8593), MPA (0.9562), and Kappa (0.8437), while the PSPNet model shows the smallest MioU (0.7457), MPA (0.9236), and Kappa (0.8437). The difference between the maximum and the minimum values of MioU, MPA, and Kappa is 0.1136, 0.0326, and 0.1539. This implies that the segmentation performance of the 11 models is similar. Runtime is used to judge the processing speed as it depends on the number of parameters of the backend. The result presents that for the left eye data, the UNet model showed the best segmentation performance.
The segmentation performance of the 11 models on the right eye dataset is shown in Figure 16 and Table 3. The ISANet model shows the largest MIoU (0.8813), MPA (0.9634), and Kappa (0.8704), while the DANet model has the smallest MIoU (0.8117), MPA (0.9438), and Kappa (0.7823). The difference between the maximum and the minimum values of MioU, MPA, and Kappa is 0.0696, 0.0196, and 0.0881. This implies that the segmentation performance of the 11 models is similar. These differences in the indicators for the right eye data were smaller than those of the left eye data. The ISANet model shows the best segmentation performance among the models as it has two successive attention modules each of which estimates a sparse affinity matrix.
The segmentation results of the 11 models on the left and right eye data are shown in Figure 17 and Table 4. The IDLN model shows the largest MIoU (0.8825), MPA (0.9624), and Kappa (0.8655), while the PSPNet model has the smallest MIoU (0.8019), MPA (0.9389), and Kappa (0.7692). The differences between the values of the two models are 0.0806 (MIoU), 0.0235 (MPA), and Kappa (0.0963). In general, the IDLN model has the best segmentation performance. The reason is that the IDLN model adopts the CBAM attention mechanism. The CBAM sequentially infers attention weights along the spatial and channel dimensions, and then, the attention weights are multiplied in the original feature map to produce adaptively adjusted features. The goal is to increase expressiveness by using the attention mechanism, focusing on important features, and suppressing unnecessary features.
Table 5 shows the comparison of the performance indicators of several DeepLabv3+ models with different backbones and the IDLN on the left and right eye data. The DeepLabv3+ MobileNetv2 model shows the smallest MIoU (0.8589) and MPA (0.9302), while the IDLN model shows the largest MIoU (0.8825) and MPA (0.9624). It is found that when using MobileNetv2 as the backbone feature extraction network, the segmentation performance of the model is lost although the model becomes light. The parameter of the IDLN model is 22.37, which is close to that of the DeepLabv3+-MobileNetv2 model. This result shows that the IDLN model achieves better segmentation and preserves the model’s lightweight, and the main reason is that the IDLN model adopts the CBAM attention mechanism.

5. Conclusions

An image dataset with labeling annotation is proposed for improved eye detection and segmentation. The proposed dataset is expected to save time and cost for clipping eye images and denoting labels. The dataset includes 3000 datasets including 1500 left and 1500 right eye datasets. We tested the datasets with different deep learning models to find the effectiveness of the datasets for eye detection and segmentation problems. For the left eye data, the UNet model shows the best performance, while the ISANet and IDLN models show the best performance for the right eye data and right/left eye data, respectively. It is also found that cascading convolutional block attention modules (CBAM) improve eye detection and segmentation performance significantly on the right and left eye data. With the CBAM, the IDLN model achieves the best segmentation by preserving the model’s lightweight. This result provides a new image database and the basis to improve the performance of deep learning architectures for eye detection and segmentation.

Author Contributions

Conceptualization, C.-Y.H. and R.H.; methodology, C.-Y.H. and Y.X.; software, C.-Y.H. and Y.X.; validation, C.-Y.H., R.H. and Z.L.; formal analysis, C.-Y.H.; investigation, C.-Y.H.; resources, Z.L. and X.L.; data curation, Y.X.; writing—original draft preparation, C.-Y.H. and Y.X.; writing—review and editing, C.-Y.H. and R.H.; visualization, Y.X.; supervision, C.-Y.H., R.H. and Z.L.; project administration, C.-Y.H. and Z.L.; funding acquisition, Z.L. All authors have read and agreed to the published version of the manuscript.

Funding

This work was jointly supported by the research project of the Guandong Provincail Department of Education, grant number 2021ZDZX1139; the National Natural Science Foundation of China, grant number 61976055; the special fund for education and scientific research of Fujian Provincial Department of Finance, grant number GY-Z21001; and the Open Fund Project of Fujian Provincial Key Laboratory of Information Processing and Intelligent Control (Minjiang University), grant number No. MJUKF-IPIC202107.

Data Availability Statement

Not applicable.

Conflicts of Interest

The authors declare no conflict of interest.

References

  1. Fuhl, W. Image-Based Extraction of Eye Features for Robust Eye Tracking. Ph.D. Thesis, University of Tübingen, Tübingen, Germany, 2019. [Google Scholar]
  2. Chuk, T.; Chan, A.B.; Shimojo, S.; Hsiao, J.H. Eye movement analysis with switching hidden Markov models. Behav. Res. Methods 2020, 52, 1026–1043. [Google Scholar] [CrossRef] [PubMed]
  3. Wang, K.; Zhao, R.; Ji, Q. A hierarchical generative model for eye image synthesis and eye gaze estimation. In Proceedings of the IEEE Conference on Computer Vision and Pattern Recognition (CVPR), Salt Lake City, UT, USA, 18–23 June 2018; pp. 440–448. [Google Scholar]
  4. Harezlak, K.; Kasprowski, P. Application of eye tracking in medicine: A survey, research issues and challenges. Comput. Med. Imaging Graph. 2018, 65, 176–190. [Google Scholar] [CrossRef] [PubMed]
  5. Lv, Z.; Chen, D.; Lou, R.; Song, H. Industrial security solution for virtual reality. Proc. IEEE Internet Things J. 2021, 8, 6273–6281. [Google Scholar] [CrossRef]
  6. Abbasi, M.; Khosravi, M.R. A robust and accurate particle filter-based pupil detection method for big data sets of eye video. J. Grid Comput. 2020, 18, 305–325. [Google Scholar] [CrossRef]
  7. Gou, C.; Wu, Y.; Wang, K.; Wang, K.; Wang, F.; Ji, Q. A joint cascaded framework for simultaneous eye detection and eye state estimation. Pattern Recognit. 2017, 67, 23–31. [Google Scholar] [CrossRef] [Green Version]
  8. Jung, Y.; Kim, D.; Son, B.; Kim, J. An eye detection method robust to eyeglasses for mobile iris recognition. Expert Syst. Appl. 2017, 67, 178–188. [Google Scholar] [CrossRef]
  9. Marsot, M.; Mei, J.; Shan, X.; Ye, L.; Feng, P.; Yan, X.; Li, C.; Zhao, Y. An adaptive pig face recognition approach using convolutional neural networks. Comput. Electron. Agric. 2020, 173, 105386. [Google Scholar] [CrossRef]
  10. Shi, S.; Tang, W.Z.; Wang, Y.Y. A review on fatigue driving detection. In Proceedings of the 4th Annual International Conference on Information Technology and Applications, Changsha, China, 29–31 October 2021; EDP Sciences: Les Ulis, France, 2017; Volume 12, p. 01019. [Google Scholar]
  11. Kothari, R.; Yang, Z.; Kanan, C.; Bailey, R.; Pelz, J.B.; Diaz, G.J. Gaze-in-wild: A dataset for studying eye and head coordination in everyday activities. Sci. Rep. 2020, 10, 2539. [Google Scholar] [CrossRef] [PubMed]
  12. Wu, Z.; Rajendran, S.; van As, T.; Zimmermann, J.; Badrinarayanan, V.; Rabinovich, A. MagicEyes: A large scale eye gaze estimation dataset for mixed reality. arXiv 2020, arXiv:2003.08806. [Google Scholar]
  13. Kim, J.; Stengel, M.; Majercik, A.; de Mello, S.; Dunn, D.; Laine, S.; McGuire, M.; Luebke, D. Nvgaze: An anatomically-informed dataset for low-latency, near-eye gaze estimation. In Proceedings of the 2019 CHI Conference on Human Factors in Computing Systems, Glasgow, UK, 4–9 May 2019; pp. 1–12. [Google Scholar]
  14. Fuhl, W.; Santini, T.; Geisler, D.; Kübler, T.C.; Rosenstiel, W.; Kasneci, E. Eyes Wide Open? Eyelid Location and Eye Aperture Estimation for Pervasive Eye Tracking in Real-World Scenarios. In Proceedings of the ACM International Joint Conference on Pervasive and Ubiquitous Computing: Adjunct, Heidelberg, Germany, 12–16 September 2016; Association for Computing Machinery: New York, NY, USA, 2016; pp. 1656–1665. [Google Scholar]
  15. Garbin, S.J.; Komogortsev, O.; Cavin, R.; Hughes, G.; Shen, Y.; Schuetz, I.; Talathi, S.S. Dataset for eye tracking on a virtual reality platform. In Proceedings of the ACM Symposium on Eye Tracking Research and Applications, Stuttgart, Germany, 2–5 June 2020; Association for Computing Machinery: New York, NY, USA, 2020; pp. 1–10. [Google Scholar]
  16. McMurrough, C.D.; Metsis, V.a.; Rich, J.; Makedon, F. An eye tracking dataset for point of gaze detection. In Proceedings of the Symposium on Eye Tracking Research and Applications, Santa Barbara, CA, USA, 28–30 March 2012; Association for Computing Machinery: New York, NY, USA, 2012; pp. 305–308. [Google Scholar]
  17. Phillips, P.J.; Bowyer, K.W.; Flynn, P.J. Comments on the CASIA version 1.0 Iris Data Set. IEEE Trans. Pattern Anal. Mach. Intell. 2007, 29, 1869–1870. [Google Scholar] [CrossRef] [Green Version]
  18. Proença, H.; Filipe, S.; Santos, R.; Oliveira, J.; Alexandre, L.A. The UBIRIS.v2: A Database of visible wavelength iris images captured on-the-move and at-a-distance. IEEE Trans. Pattern Anal. Mach. Intell. 2010, 32, 1529–1535. [Google Scholar] [CrossRef]
  19. Proença, H.; Alexandre, L.A. UBIRIS: A noisy iris image database. In Proceedings of the International Conference on Image Analysis and Processing, Cagliari, Italy, 6–8 September 2015; Springer: Berlin/Heidelberg, Germany, 2005; pp. 970–977. [Google Scholar]
  20. Fuhl, W.; Santini, T.; Kübler, T.C.; Kasneci, E. ElSe: Ellipse Selection for Robust Pupil Detection in Real-World Environments. In Proceedings of the Ninth Biennial ACM Symposium on Eye Tracking Research & Applications, Charleston, SC, USA, 14–17 March 2016; Association for Computing Machinery: New York, NY, USA, 2016; pp. 123–130. [Google Scholar]
  21. Tonsen, M.; Zhang, X.; Sugano, Y.; Bulling, A. Labelled pupils in the wild: A dataset for studying pupil detection in unconstrained environments. In Proceedings of the Ninth Biennial ACM Symposium on Eye Tracking Research & Applications, Charleston, SC, USA, 14–17 March 2016; Association for Computing Machinery: New York, NY, USA, 2016; pp. 139–142. [Google Scholar]
  22. Das, A.; Pal, U.; Blumenstein, M.; Wang, C.; He, Y.; Zhu, Y.; Sun, Z. Sclera Segmentation Benchmarking Competition in Cross-resolution Environment. In Proceedings of the 2019 International Conference on Biometrics (ICB), Crete, Greece, 4–7 June 2019; pp. 1–7. [Google Scholar]
  23. Santini, T.; Fuhl, W.; Kübler, T.; Kasneci, E. Bayesian identification of fixations, saccades, and smooth pursuits. In Proceedings of the Ninth Biennial ACM Symposium on Eye Tracking Research & Applications, Charleston, SC, USA, 14–17 March 2016; Association for Computing Machinery: New York, NY, USA, 2016; pp. 163–170. [Google Scholar]
  24. Fuhl, W.; Geisler, D.; Rosenstiel, W.; Kasneci, E. The Applicability of Cycle GANs for Pupil and Eyelid Segmentation, Data Generation, and Image Refinement. In Proceedings of the IEEE/CVF International Conference on Computer Vision (ICCV) Workshops, Seoul, Korea, 27–28 October 2019. [Google Scholar]
  25. Fuhl, W.; Rosenstiel, W.; Kasneci, E. 500,000 Images closer to eyelid and pupil segmentation. In Proceeding of the Computer Analysis of Images and Patterns. CAIP 2019 (Lecture Notes in Computer Science); Salerno, Italy, 3–5 September 2019, Vento, M., Percannella, G., Eds.; Springer: Cham, Switzerland, 2019; pp. 336–347. [Google Scholar]
  26. Zhu, Z.; Xu, M.; Bai, S.; Huang, T.; Bai, X. Asymmetric non-local neural networks for semantic segmentation. In Proceedings of the IEEE/CVF International Conference on Computer Vision, Seoul, Korea, 27 October–2 November 2019; pp. 593–602. [Google Scholar]
  27. Fu, J.; Liu, J.; Tian, H.; Li, Y.; Bao, Y.; Fang, Z.; Lu, H. Dual attention network for scene segmentation. In Proceedings of the IEEE/CVF Conference on Computer Vision and Pattern Recognition, Long Beach, CA, USA, 15–20 June 2019; pp. 3146–3154. [Google Scholar]
  28. Yu, C.; Gao, C.; Wang, J.; Yu, G.; Shen, C.; Sang, N. Bisenet v2: Bilateral network with guided aggregation for real-time semantic segmentation. Int. J. Comput. Vis. 2021, 129, 3051–3068. [Google Scholar] [CrossRef]
  29. Poudel, R.P.K.; Liwicki, S.; Cipolla, R. Fast-scnn: Fast semantic segmentation network. arXiv 2019, arXiv:1902.04502. [Google Scholar]
  30. Long, J.; Shelhamer, E.; Darrell, T. Fully convolutional networks for semantic segmentation. In Proceedings of the IEEE Conference on Computer Vision and Pattern Recognition, Boston, MA, USA, 7–12 June 2015; pp. 3431–3440. [Google Scholar]
  31. Huang, L.; Yuan, Y.; Guo, J.; Zhang, C.; Chen, X.; Wang, J. Interlaced sparse self-attention for semantic segmentation. arXiv 2019, arXiv:1907.12273. [Google Scholar]
  32. Yuan, Y.; Chen, X.; Wang, J. Object-contextual representations for semantic segmentation. In Proceedings of the European Conference on Computer Vision, Glasgow, UK, 23–28 August 2020; Springer: Cham, Switzerland, 2020; pp. 173–190. [Google Scholar]
  33. Zhao, H.; Shi, J.; Qi, X.; Wang, X.; Jia, J. Pyramid scene parsing network. In Proceedings of the IEEE Conference on Computer Vision and Pattern Recognition, Honolulu, HI, USA, 21–26 July 2017; pp. 2881–2890. [Google Scholar]
  34. Ronneberger, O.; Fischer, P.; Brox, T. U-net: Convolutional networks for biomedical image segmentation. In Proceedings of the International Conference on Medical Image Computing and Computer-Assisted Intervention, Munich, Germany, 5–9 October 2015; Springer: Cham, Switzerland, 2015; pp. 234–241. [Google Scholar]
  35. Chen, L.; Papandreou, G.; Kokkinos, I.; Murphy, K.; Yuille, A.L. DeepLab: Semantic image segmentation with deep convolutional nets, atrous convolution, and fully connected CRFs. arXiv 2016, arXiv:1606.00915. [Google Scholar] [CrossRef] [PubMed] [Green Version]
  36. Chen, L.; Papandreou, G.; Schroff, F.; Adam, H. Rethinking Atrous Convolution for Semantic Image Segmentation. arXiv 2017, arXiv:1706.05587. [Google Scholar]
  37. Liu, C.; Chen, L.C.; Schroff, F.; Adam, H.; Hua, W.; Yuille, A.L.; Li, F.F. Auto-DeepLab: Hierarchical Neural Architecture Search for Semantic Image Segmentation. In Proceedings of the 2019 IEEE/CVF Conference on Computer Vision and Pattern Recognition (CVPR), Long Beach, CA, USA, 15–20 June 2019. [Google Scholar]
  38. Chen, L.-C.; Zhu, Y.; Papandreou, G.; Schroff, F.; Adam, H. Encoder-Decoder with Atrous Separable Convolution for Semantic Image Segmentation. arXiv 2018, arXiv:1802.02611. Available online: http://arxiv.org/abs/1802.02611 (accessed on 7 February 2018).
  39. Roy Choudhury, A.; Vanguri, R.; Jambawalikar, S.R.; Kumar, P. Segmentation of Brain Tumors Using DeepLabv3; Springer International Publishing: Cham, Switzerland, 2019; pp. 154–167. [Google Scholar]
  40. Li, Q.-H.; Li, C.-P.; Zhang, J.; Chen, H.; Wang, S.-Q. Survey of compressed deep neural network. Comput. Sci. 2019, 46, 1–14. [Google Scholar]
  41. Woo, S.; Park, J.; Lee, J.; Kweon, I.S. CBAM: Convolutional block attention module. In Proceedings of the European Conference on Computer Vision, Munich, Germany, 8–14 September 2018; pp. 3–19. [Google Scholar]
  42. WIDER FACE: A Face Detection Benchmark. Available online: http://shuoyang1213.me/WIDERFACE/ (accessed on 31 March 2017).
  43. Srinivas, N.; Atwal, H.; Rose, D.C.; Mahalingam, G.; Ricanek, K.; Bolme, D.S. Age, Gender, and Fine-Grained Ethnicity Prediction Using Convolutional Neural Networks for the East Asian Face Dataset. In Proceedings of the 2017 12th IEEE International Conference on Automatic Face Gesture Recognition (FG 2017), Washington, DC, USA, 30 May–3 June 2017; pp. 953–960. [Google Scholar]
  44. Face Dataset Collection and Annotation. Available online: http://www.surfing.ai/face-data/ (accessed on 1 January 2021).
  45. Data Open and Sharing. Available online: https://developer.apollo.auto/docs/promise.html (accessed on 3 July 2020).
  46. Data for Competition. Available online: https://datafountain.cn/datasets (accessed on 1 January 2020).
Figure 1. Sample images of (a) the eye detection and (b) eye image segmentation datasets.
Mathematics 10 02597 g001
Figure 2. Building blocks of deep convolutional neural network (DCNN) architecture for classification application.
Mathematics 10 02597 g002
Figure 3. The architecture of the Deeplabv3+ Model with Attention Mechanisms for eye image segmentation.
Mathematics 10 02597 g003
Figure 4. File directories of eye image detection and segmentation dataset (EIMDSD).
Mathematics 10 02597 g004
Figure 5. Eye detection (a) and segmentation process (b).
Mathematics 10 02597 g005
Figure 6. Sample images that are used in the proposed dataset.
Mathematics 10 02597 g006
Figure 7. Directory of the eye image segmentation dataset.
Mathematics 10 02597 g007
Figure 8. Original image of the left and right eyes and the sample data of annotated images.
Mathematics 10 02597 g008
Figure 9. Original images and labeled images of the eyes in the dataset.
Mathematics 10 02597 g009
Figure 10. Precision–recall curves of the left and right eyes of the YOLOv3 model.
Mathematics 10 02597 g010
Figure 11. Precision–recall curves of the left and right eyes of the Faster-RCNN model.
Mathematics 10 02597 g011
Figure 12. Loss of 11 models on the three types of datasets: (a) left eye, (b) right eye, and (c) left and right eyes with iterations.
Mathematics 10 02597 g012
Figure 13. MIoU values of 11 models on the three types of datasets: (a) left eye, (b) right eye, and (c) left and right eyes.
Mathematics 10 02597 g013aMathematics 10 02597 g013b
Figure 14. MPA values of 11 models on the three datasets: (a) left eye, (b) right eye, and (c) left and right eyes.
Mathematics 10 02597 g014aMathematics 10 02597 g014b
Figure 15. Segmentation result of 11 models on the left eye data.
Mathematics 10 02597 g015
Figure 16. Segmentation result of 11 models on the right eye data.
Mathematics 10 02597 g016
Figure 17. Segmentation result of 11 models on the left and right eye data.
Mathematics 10 02597 g017
Table 1. Numerical results of evaluation metrics for YOLOV3 and Faster-RCNN eye detection models.
MethodAP for the Left EyeAP for the Right EyeMAP
YOLOv355.9863.6759.825
Faster R-CNN17.4714.8816.175
Table 2. Comparison of performance indicators of the 11 models on the left eye data.
MethodImagesMIoUMPAKappaRuntime (FPS)
ANN3000.82290.94590.797316.39
BiSeNetv23000.79930.93760.765717.54
DANet3000.84410.95080.824710.53
Deeplabv33000.84690.95240.828319.23
Deeplabv3P3000.82500.94820.800228.88
Fast-SCNN3000.81190.93970.783213.16
FCN3000.84760.95220.82936.45
ISANet3000.84910.95300.831115.38
OCRNet3000.84060.95070.82036.13
PSPNet3000.74570.92360.689814.71
UNet3000.85930.95620.843726.73
Table 3. Comparison of performance indicators of the 11 models on the right eye data.
MethodImagesMIoUMPAKappaRuntime (FPS)
ANN3000.84920.95370.831115.61
BiSeNetv23000.85280.95350.835816.13
DANet3000.81170.94380.782310.31
Deeplabv33000.87560.96160.863519.80
Deeplabv3P3000.88000.96290.868827.83
Fast-SCNN3000.86190.95770.846814.83
FCN3000.86580.95840.85177.46
ISANet3000.88130.96340.870414.08
OCRNet3000.86570.95980.85137.30
PSPNet3000.84980.95300.832019.23
UNet3000.86880.95750.855525.71
Table 4. Comparison of performance indicators of the 11 models on the left and right eye data.
MethodImagesMIoUMPAKappaRuntime (FPS)
ANN6000.86300.95700.848315.15
BiSeNetv26000.84210.95020.822314.93
DANet6000.81820.94410.791119.61
Deeplabv36000.86620.95920.852118.52
Deeplabv3P6000.87630.96190.864328.50
Fast-SCNN6000.85860.95520.843016.95
FCN6000.85800.95510.84225.85
ISANet6000.85800.95540.842116.13
OCRNet6000.86190.95670.84696.25
PSPNet6000.80190.93890.769214.29
UNet6000.86580.95680.851927.78
IDLN6000.88250.96240.865534.10
Table 5. Performance of DeepLabv3+ models versus different backbones.
ModelsImagesMIoUMPAParameters (MB)
DeepLabv3+-Xception6000.86840.9494208.70
DeepLabv3+-ResNet506000.87630.9619204.13
DeepLabv3+-MobileNetv26000.85890.930222.18
IDLN6000.88250.962422.37
Parameters (MB) is a measure of the model size.
Publisher’s Note: MDPI stays neutral with regard to jurisdictional claims in published maps and institutional affiliations.

