Abstract
It is significant for anesthesiologists to have a precise grasp of the recovery time of the patient after anesthesia. Accurate prediction of anesthesia recovery time can support anesthesiologist decision-making during surgery to help reduce the risk of surgery in patients. However, effective models are not proposed to solve this problem for anesthesiologists. In this paper, we seek to find effective forecasting methods. First, we collect 1824 patient anesthesia data from the eye center and then performed data preprocessing. We extracted 85 variables to predict recovery time from anesthesia. Second, we extract anesthesia information between variables for prediction using machine learning methods, including Bayesian ridge, lightGBM, random forest, support vector regression, and extreme gradient boosting. We also design simple deep learning models as prediction models, including linear residual neural networks and jumping knowledge linear neural networks. Lastly, we perform a comparative experiment of the above methods on the dataset. The experiment demonstrates that the machine learning method performs better than the deep learning model mentioned above on a small number of samples. We find random forest and XGBoost are more efficient than other methods to extract information between variables on postoperative anesthesia recovery time.
MSC:
05C82
1. Introduction
In medicine, the advancement of surgical treatment technology has promoted the development of medicine, and anesthesia technology is a necessary guarantee for the development of surgery [1]. Anesthetic drugs can temporarily make the body unconscious to perform associated treatment operations for painless purposes. Before and after surgery, anesthesiologists are the guardians of the patient [2]. They adjust the injection of anesthetic agents by monitoring the patient’s vital signs [3]. It has been clinically confirmed that the perfect and professional performance and care of anesthesiologists throughout the surgical process have a great positive effect on intraoperative safety and postoperative recovery of surgical patients [4].
The amount of injected anesthesia is closely related to the patient’s preoperative physical condition and intraoperative vital signs [5]. It also needs to consider the patient’s postoperative recovery time. Since the indicators and intraoperative conditions of different patients are complex and changing, the anesthesiologist must be equipped with specialized knowledge and the ability to respond quickly to ensure the safety of the vital signs of the patient. Nowadays, there is a shortage of anesthesiologists [6]. It is difficult to support the growing clinical demand. At the same time, training a professional and excellent anesthesiologist requires a lot of time. Due to the shortage of anesthesiologists, the workload of anesthesiologists is large and easy to fatigue. Therefore, it is meaningful to discover an effective method to eliminate the problem of anesthesia stress, which predicts recovery time after anesthesia to help anesthesiologists quickly complete postoperative recovery for each patient.
With the promotion of electronic medical records, the digitization of surgical records has enabled much anesthesia data to be recorded for a long time. The digitization of surgical records makes it possible to use traditional statistical learning algorithms and machine learning algorithms in the field of medical anesthesia [7,8]. Mirsadeghi [9] uses machine learning to monitor the depth of anesthesia, which analyzes the parameters of different wavelengths of EEG power, total power, spindle score, and so on. It reflects the EEG characteristics of the awake anesthesia state, obtains a more accurate effect than BIS, and helps anesthesiologists adjust the injection of the anesthesia dose during surgery. Schamberg et al. [10] develop a deep learning neural network using the cross-entropy method to train the neural network through reinforcement learning. They aim to employ the neural network to control the depth of anesthesia in patients, simulating the anesthesiologist’s intraoperative decision-making. Miyaguchi et al. [3] adopt machine learning to predict the decisions made by anesthesiologists during surgery. They also examined the importance and contribution of the features of each model using Shapley additive explanations. Zhao et al. [11] train deep learning, logistic regression, support vector machine, and random forest models to predict postoperative recovery quality based on intraoperative time series monitoring data. All of the above methods are designed to support the decision-making of the anesthesiologist during surgery and help reduce the risk of surgery in patients. Deep learning methods [12,13,14,15] and machine learning methods [16,17] are adopted to testing other medical diseases. However, postoperative monitoring of patients by anesthesiologists is equally important. Postoperative recovery time is closely related to the intraoperative anesthesia dose injection and the physical indicators of postoperative patients. These data are meaningful for the anesthesiologist’s decision-making. Meta-learning models, such as random forest, extreme gradient boosting (XGBoost), and deep learning models, especially the convolutional neural network (CNN) model and deep neural network (DNN), are trained to predict hypotension occurring between tracheal intubation and incision [18]. Deep learning and machine learning methods are proposed to help anesthesiologists make decisions about anesthesia, such as inference of brain states under anesthesia [19] and ultrasound image guidance [20]. Various indicators of postoperative anesthesia help anesthesiologists better monitor patients’ vital signs after surgery, ensure smooth and safe recovery of patient consciousness during the awakening period, and strive to reduce complications during the awakening period [21].
Previous methods collect intraoperative and postoperative data, then successfully adopt deep learning and machine learning methods to help anesthesiologists make decisions for patients. However, previous work has the following shortcoming. Firstly, previous work fails to predict the recovery time from anesthesia for anesthesiologists. Although previous methods inform decision-making for anesthesiologists, these approaches do not focus on anesthesia recovery time to inform decision-making [3,21]. This paper seeks an effective method to help anesthesiologists estimate the recovery time from anesthesia for each patient. Second, few studies are devoted to analyzing the importance of each feature during or after surgery [19,20]. After the analysis, anesthesiologists can quickly make a decision based on important features to estimate how long a patient will recover from anesthesia without resorting to complex machine learning or deep learning models.
To settle the above shortcomings, we adopt machine learning methods and design deep learning models to predict anesthesia recovery time. We also adopt a machine learning interpretation toolkit, such as the SHAP toolkit [22,23], to facilitate anesthesiologists to judge the importance of features. Our main contributions to this work are summarized in the following.
- We apply machine learning methods as prediction models, including Bayesian ridge [24], lightGBM [25], random forest [26], support vector regression (SVR) [27], and XGBoost [28].
- We design simple deep learning models, including a linear residual neural network and jumping knowledge linear neural network to predict the postoperative recovery time. We then adopt a machine learning interpretation toolkit, such as SHAP, to help anesthesiologists evaluate the importance of variables with visual methods.
- We last conduct experiments considering the total amount of narcotic remifentanil in surgeons, routine physical indicators, and so on after surgeon in prediction. The experiments demonstrate that the random forest in predicting anesthesia recovery time is more effective than other methods.
2. Materials
2.1. Patients
Anesthesia data comes from Joint Shantou International Eye Center of Shantou University and The Chinese University of Hong Kong (https://www.jsiec.org/ (accessed on 1 June 2022)). This specific study was approved by the eye center. Patients are from 4 to 62 years old. Both males and females are included in this retrospective study. Anesthesia data were obtained from the Eye Center’s database. According to the American Society of Anesthesiologists (ASA), their physical status classifications are I–II. Most of the patients are I. This study has been approved by the ethics committee board of the Joint Shantou International Eye Center of Shantou University and The Chinese University of Hong Kong.
2.2. Data Collection and Preprocessing
As Table 1 shows, we collect patient information, preoperative data, intraoperative intervention, intraoperative monitoring data, and postoperative data. Patient information includes the age, weight, height, and gender of patients. Preoperative data consist of preoperative body temperature, preoperative dosage, and anesthesia-relevant history. Intraoperative intervention data mainly comprise anesthetic time, medications, inputs, and outputs. Intraoperative monitoring data includes operation type, extubation situation, blood content information, drug dosage, etc. When the patient arrived in the operating room, intraoperative monitoring began, including electrocardiogram, pulse oximetry, intermittent noninvasive blood pressure measurements, and bispectral index scores. Postoperative data consist of postoperative complications, recovery time, postoperative temperature, etc. All variables are used for modeling. In the end, we collected data on 1824 patients with 86 variables. Each patient was regarded as an independent sample. Finally, 1824 data were collected. We select 85 as independent variables to predict anesthesia recovery time per patient in the abbreviations Table A1.

Table 1.
Comparative statistics of some variables in the training set, validation set, and testing set, where statistics are the f-values of ANOVA with * is the chi-square test value.
We removed some useless metrics, such as patient grouping. We fill missing numeric data by using imputation. To speed up the convergence of the neural network, all continuous indexes are normalized. In all models, we convert categorical data to binary data using a one-hot encoding method [29].
2.3. Descriptive Statistics
We adopt descriptive statistics on some features to understand the approximate distribution of the data. The dataset is divided into a training set (n = 1276), validation set (n = 274) and test set (n = 274). As Table 1 shows, we analyze statistics of some variables in the training set, validation set, and testing set.
3. Methodology
Figure 1 shows the workflow for predicting anesthesia recovery information. After collecting information from the eye center, machine learning models and deep learning models are constructed to train the model and then predict the future anesthesia recovery time. After the prediction, the machine learning model is interpreted by the SHAP toolkit to visualize the importance of features.
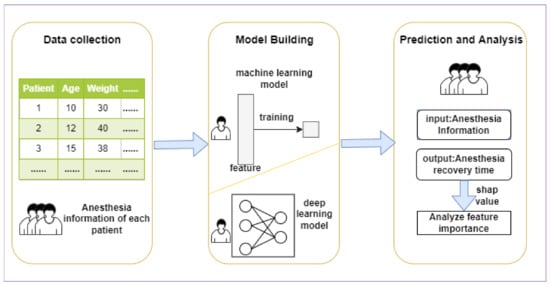
Figure 1.
The workflow of this research. We first collect data from the eye center. Then we adopt machine learning models and the proposed deep learning models to predict anesthesia recovery time. we last analyze features’ importance by SHAP toolkit.
3.1. Problem Definition
In this study, we aim to learn a function to predict recovery time after anesthesia using various preoperative, intraoperative, and patients’ postoperative indicators. Let denote the features of each patient. represents the recovery time of each patient after anesthesia. Our function is formulated as .
3.2. Machine Learning Model
We use XGBoost, random tree regression (RTR), support vector regression (SVR), lightGBM, and Bayesian ridge regression to predict recovery time from anesthesia. XGBoost is a boosted tree model [30]. It is the integration of many tree models, which is the CART regression tree model. The idea of the algorithm is to continuously add trees and continuously perform feature splitting to grow a tree. When a tree is added, it is actually learning a new function to fit the residual of the last prediction [31]. Random Forest belongs to the Bagging class of algorithms. The tasks completed by the random forest include random forest classification and regression. In the training phase, random forest uses bootstrap sampling to collect multiple different sub-training datasets from the input training dataset to train multiple different decision trees. In the prediction phase, random forest averages the prediction results of multiple internal decision trees to obtain the final result [32]. SVR is a support vector machine (SVM) implementation for regression [33]. The SVR model creates an interval band on both sides of the linear function. The loss does not include any sample that falls within an interval [34]. In other words, only the support vector influences its function model. For non-linear models, use the same kernel function as SVM to map feature space for regression [35]. Finally, the optimized model is obtained by minimizing the total loss and maximizing the interval [36]. LightGBM is a gradient boosting framework that uses decision trees based on learning algorithms [37]. It supports efficient parallelism, which includes feature parallelism, data parallelism, and voting parallelism. In principle, it uses the negative gradient of the loss function as a residual approximation of the current decision tree to fit the new decision tree. Bayesian ridge regression can be used for regularization parameters in the estimation stage, The regularization parameters can be changed according to the existing data during the estimation process. The estimation of the model parameters generally uses the maximum marginal likelihood logarithm estimation [38].
3.3. Deep Learning Model
3.3.1. Linear Residual Neural Network
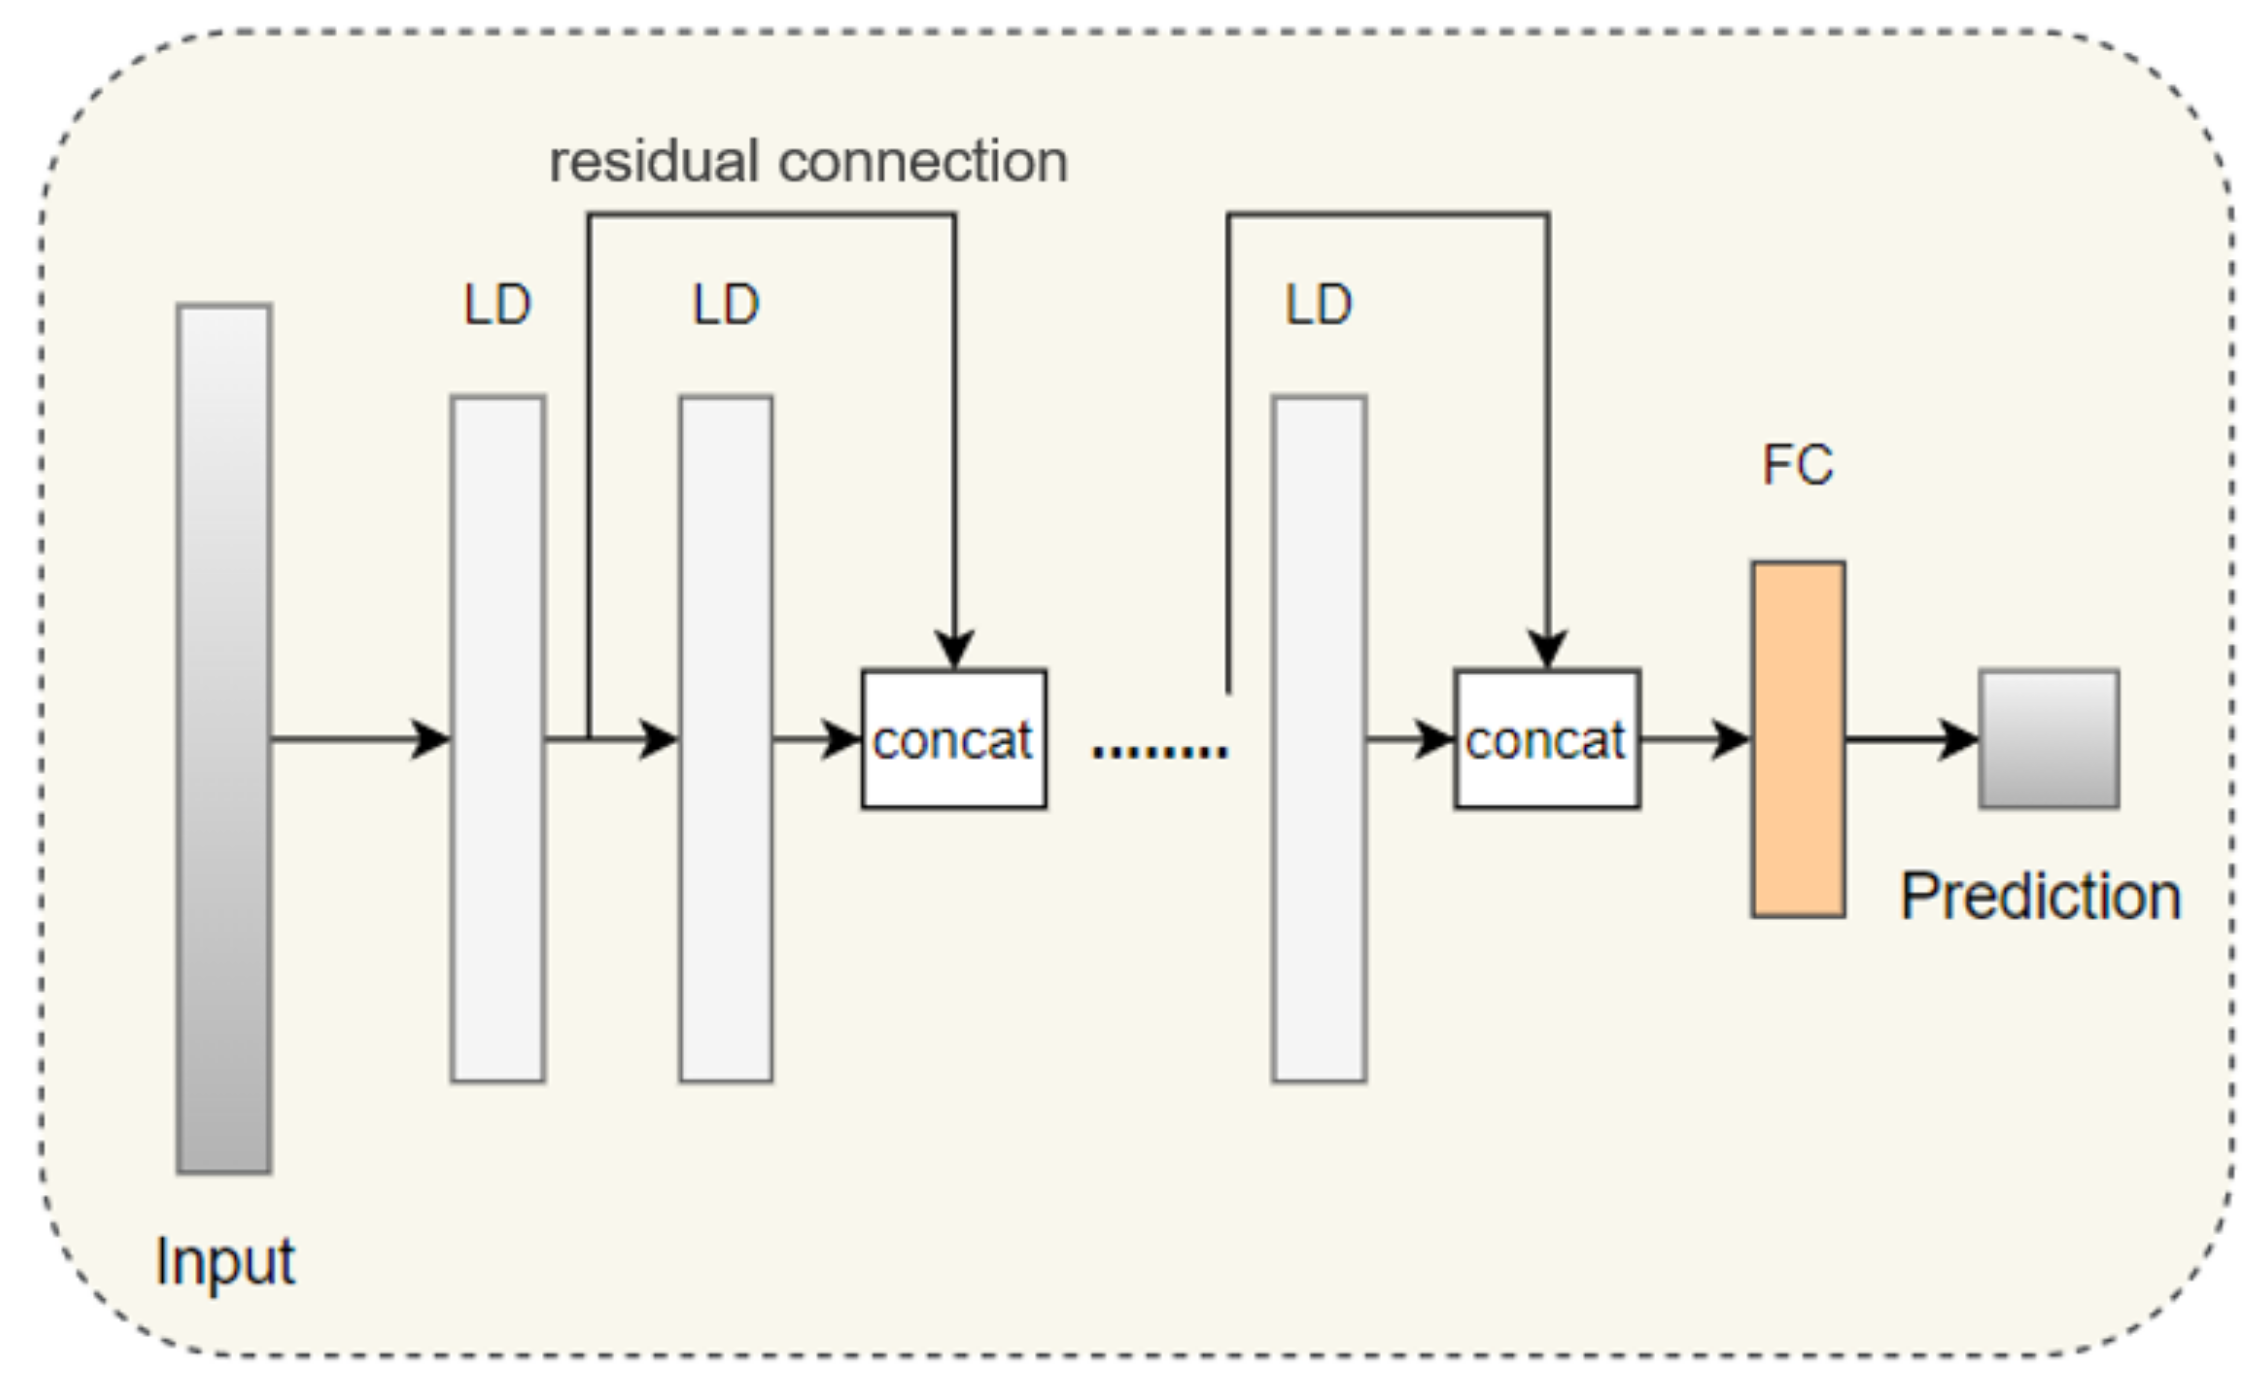
To capture hidden multivariate features of anesthesia information, we need to design deep linear neural networks, but this may lead to network degradation [39]. Therefore, we introduce dropout and residual connections to further alleviate this problem. We designed a simple linear residual neural network (LRN). As Figure 2 displays, the n linear layers are stacked to obtain deep correlations of the independent variables [40]. The output of the ith linear layer with residual connections can be expressed as follows.
where denotes a fully connected layer. represents the ith hidden feature. is a concatenation operation. The final prediction can be expressed as
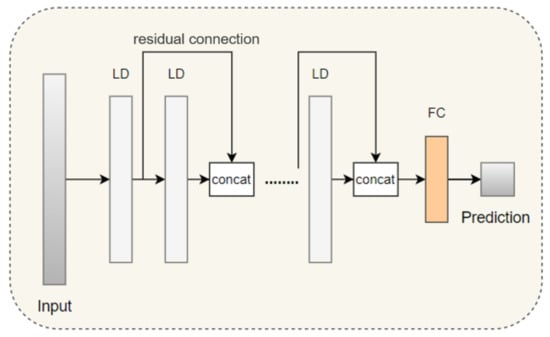
Figure 2.
The network structure of LRN, where LD is the combination of linear layer and dropout layer and FC is a fully connected layer. The concat donates concatenation with an activation function.
3.3.2. Jumping Knowledge Linear Neural Network
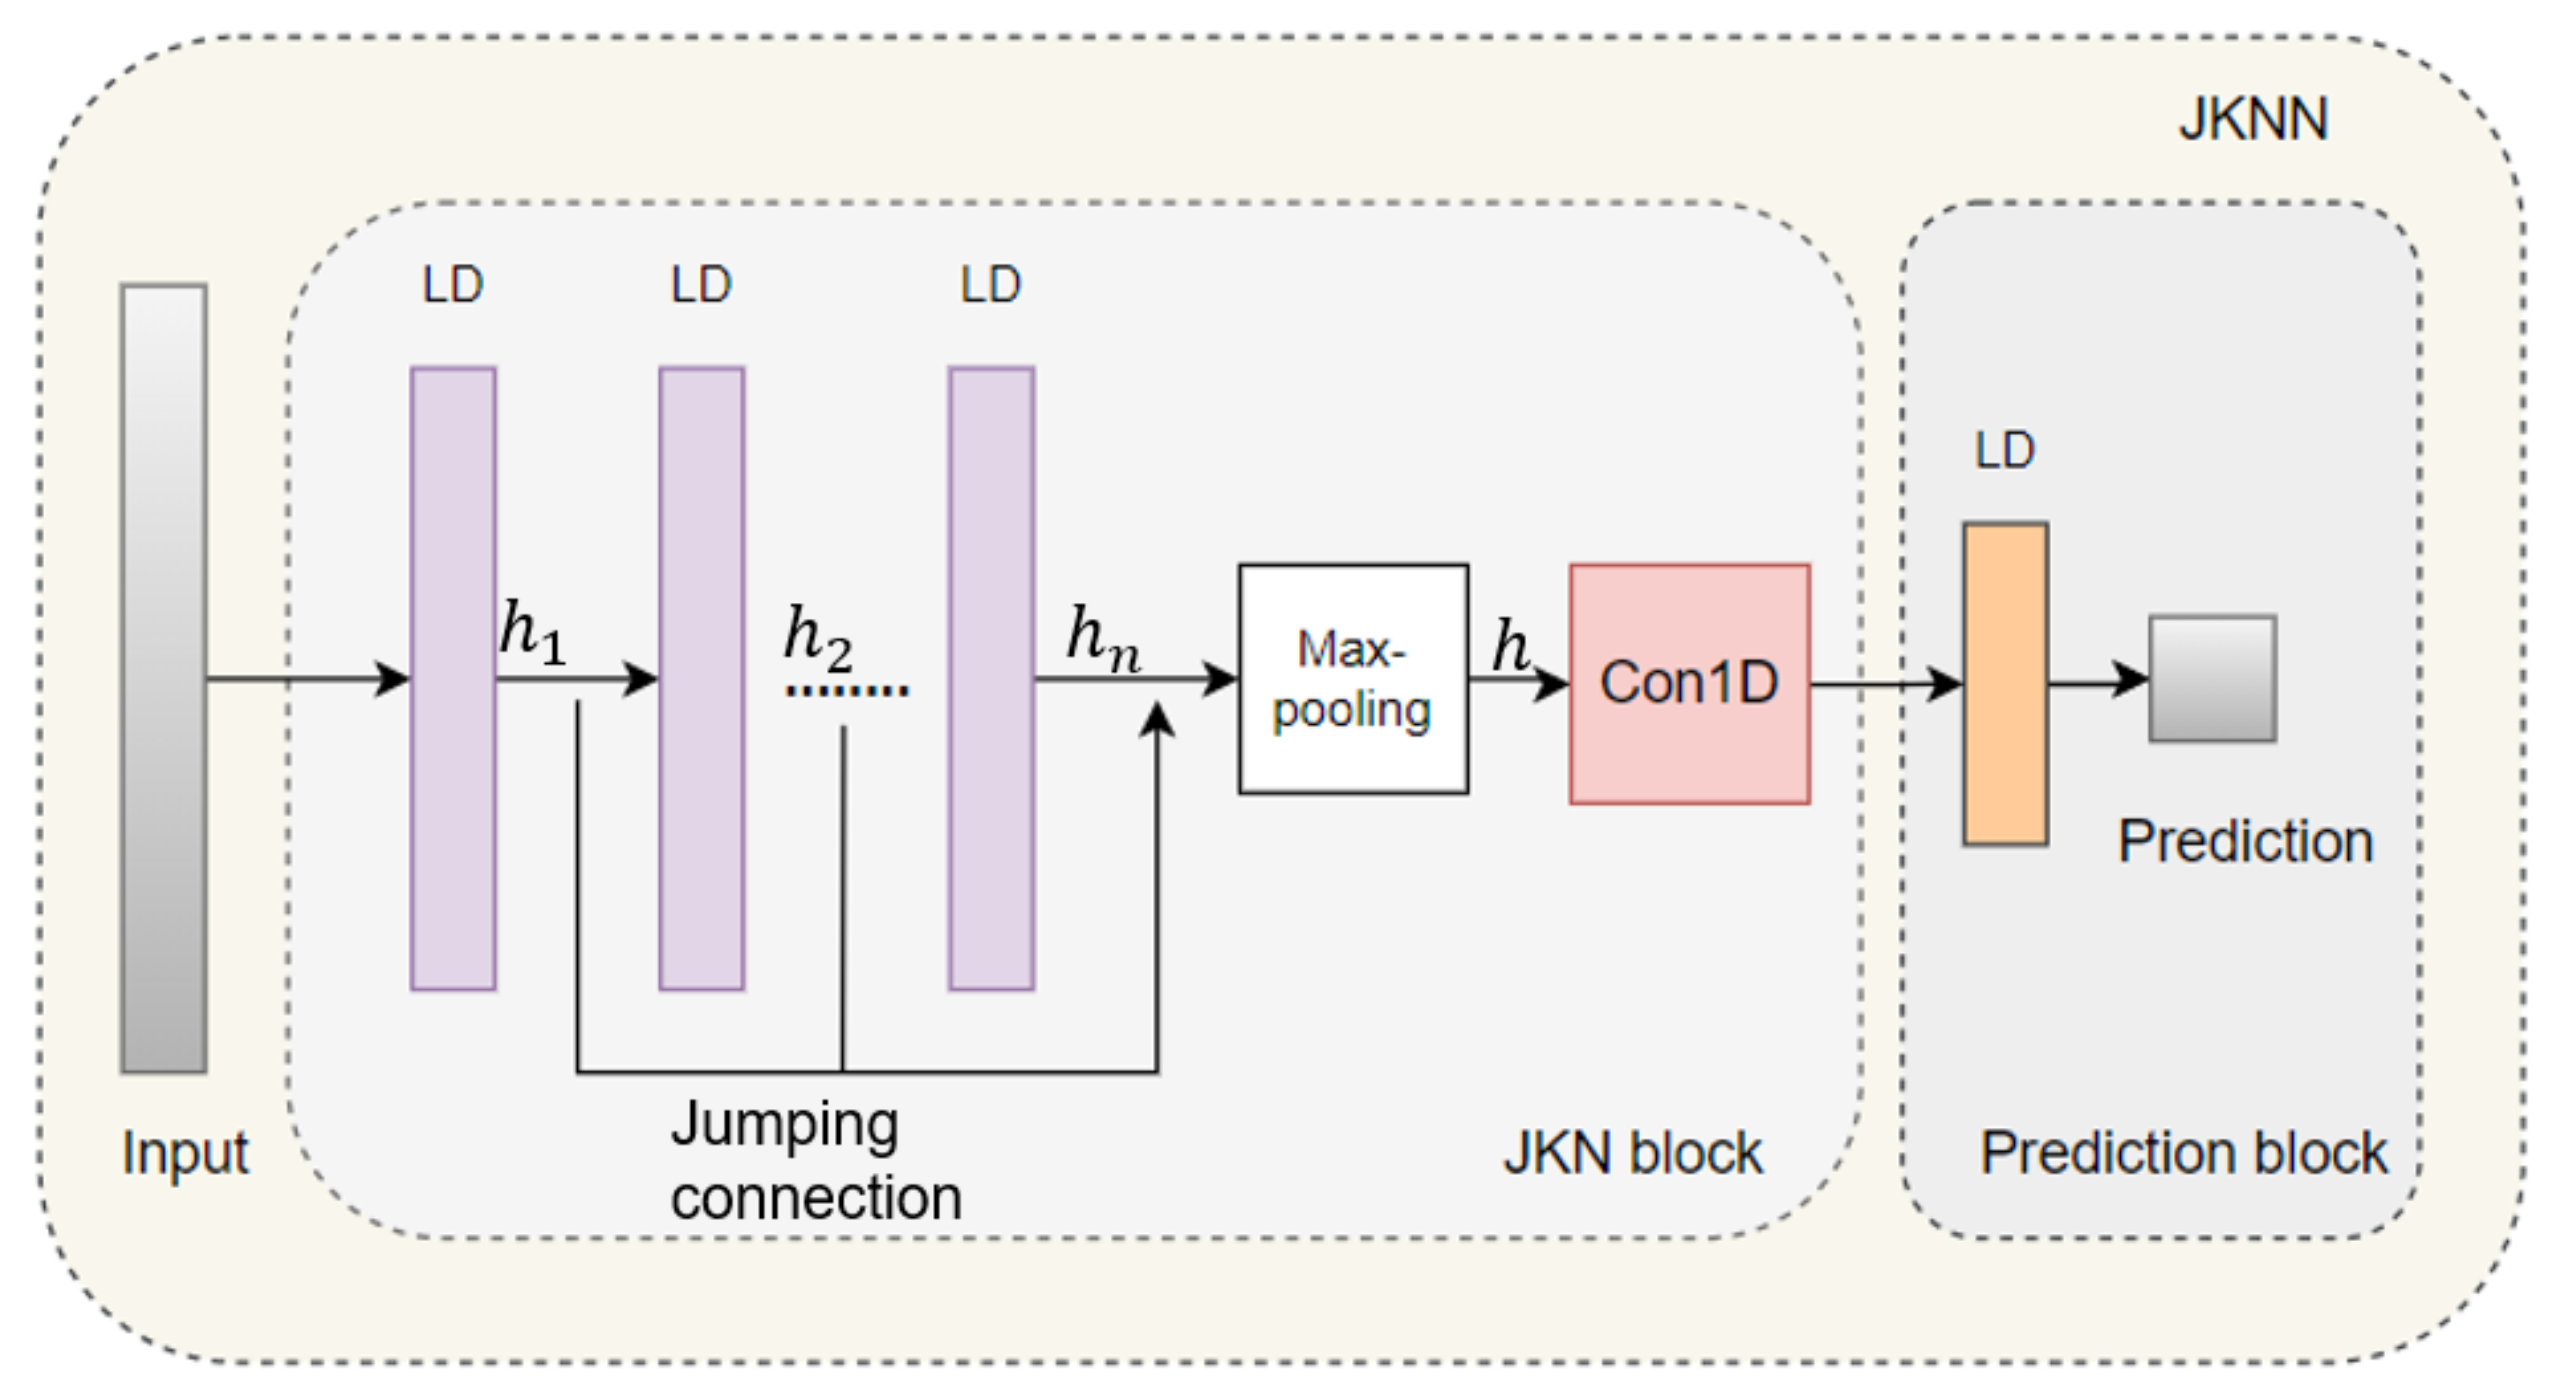
To adapt to local neighborhood properties and tasks in representation learning on graphs, Xu and Li, etc., propose jumping knowledge (JK) networks to enable better structure-aware representation [41]. Motived by JK, we propose a jumping knowledge linear neural network (JKLNN) network to effectively capture proximity multivariate correlation. As Figure 3 shows, JKLNN consists of two blocks, including a jumping knowledge neural network (JKN) block and a prediction block. The JKN block was designed to integrate diverse hidden information by stacking linear layers with a jumping connection. The prediction block consists of a fully connected layer with a ReLU activation function. First, the data will be entered into stacked n linear layers to extract shallow and deep multivariate features. Then, concatenation and max-pooling operations integrate multivariate features of anesthesia, which can be formulated as follows.
where represent features of i layer and concat means concatenation operation. is calculated by . is the output of the JKN block. Finally, Z is passed to the prediction block to predict the recovery time of anesthesia. Let W and b denote respectively learnable weights and offsets, the formula of the prediction block is summed up as:
where is the ReLU activation function. denote anesthesia recovery time for each patient.
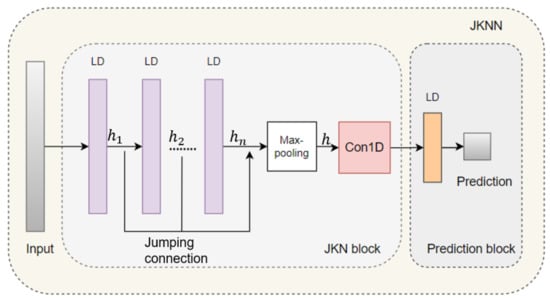
Figure 3.
The network structure of JKLNN, where LD is the combination of linear layer and dropout layer to extract hidden information of multiple independent variables.
4. Experiment
4.1. Models
In this study, we predict recovery time after anesthesia based on the patient information we collected. We conduct the following model to predict recovery time.
- XGBoost: XGBoost is an efficient and scalable implementation of gradient boosting framework, which includes an efficient linear model solver and tree learning algorithm [30].
- Random Forest: Random forest is a specific implementation of the bagging method, which trains multiple decision trees and fuses each result of trees for classification and regression [42].
- SVR: Support Vactor Regression (SVR) is an important application branch in SVM, which minimizes the total deviation of all sample points from the hyperplane to regress [43].
- LightGBM: LightGBM is a histogram-based boosting decision tree algorithm, which has the advantages of low memory footprint, high accuracy, and support for parallel and large-scale data processing [37].
- Bayesian Ridge: Bayesian ridge regression is a ridge regression based on gamma prior, which introduces a regular term of gamma prior in the estimation process [38].
- LRN: We design a simple linear neural network (LRN) using residual connections to prevent the degradation problem of deep networks [39,44].
- JKLNN: We designed the JKNN network according to the JK framework [41]. We extend neighborhood aggregation with skip connections to multivariable information aggregation.
4.2. Experiments and Results
We trained the collected data in the aforementioned models to predict post-anesthesia recovery time. As shown in Table 2, we only record the best results for each method. RMSE, MAPE, and R2 are employed as evaluation indicators to measure the quality of the regression effect. In Table 3, dataset A includes features for preoperative detection and postoperative monitoring. Dataset B consists of intraoperatively tested variables. All Dataset includes dataset A and dataset B from 1824 patients, which are not divided into training, test, and validation sets. For the specific details of datasets A and B, refer to Table A1. The lower the RMSE and MAPE, the more significant the regression effect is. The higher the R2, the more effective the regression effect is. Their calculation formulations are as follows.
where is the prediction of post-anesthesia recovery time. denotes the mean prediction of recovery time after anesthesia and m is the size of the dataset. To compare the prediction performance of the model, we introduce the optimization percentage p, whose calculation formula is as follows.
where and represent the MAPE, RMSE, or R2 of different forecasting models. The meaning of p is that is optimized by p over .
Table 2.
Comparative prediction effects of different methods in the training set, test set, and validation set.
Table 3.
Comparative result in dataset A, dataset B, and all datasets.
From Table 2, the result of machine learning models is the average value of XGBoost, random forest, SVR, lightGBM, and Bayesian ridge. The result of deep learning models is the mean of the proposed LRN and JKNN. The optimization percentage from 1.072% to 26.7799% in Table 2 implies that machine learning models have better prediction performance than the proposed deep learning model. Therefore, we conclude that the above machine learning methods are superior to the deep learning methods in predicting anesthesia recovery time. Executive experiments in training and test set reveal the optimal performance of the random forest, so the random forest is the most effective predictive model. The second best model to predict performance is XGBoost.
From Table 3, we can compare the performance of the model on different datasets. According to each dataset, the random forest has the best predictive performance. The performance of the model in both dataset A and dataset A is more ineffective than the performance of all datasets, which certifies that the preoperative, intraoperative, and postoperative monitoring data are all significant to predict recovery time after anesthesia. Compared to machine learning models, deep learning models predict more accurately in all datasets.
Combining Table 2 and Table 3, the prediction effect of the deep learning model in the training set is more invalid than the prediction in all datasets. This further proves the following conclusion: the small training set unsuccessfully supports neural networks to learn a large number of exact parameters for the proposed LKLNN and LRN. Data from different data centers are often not shared, making it impossible to have huge datasets to support model training. Due to the limitations of the experiment, the eye center is unable to collect enough data related to anesthesia from more patients. Deep learning models have more parameters to learn than machine learning models, so numerous data is required to train deep learning models. So, the proposed LRN and JKNN perform ineffectively. In turn, it demonstrates that machine learning models can be trained by small amounts of data to capture multivariate information to predict recovery time from anesthesia. In summary, random forests in machine learning methods are the most effective in predicting recovery time after anesthesia.
4.3. Feature Importance
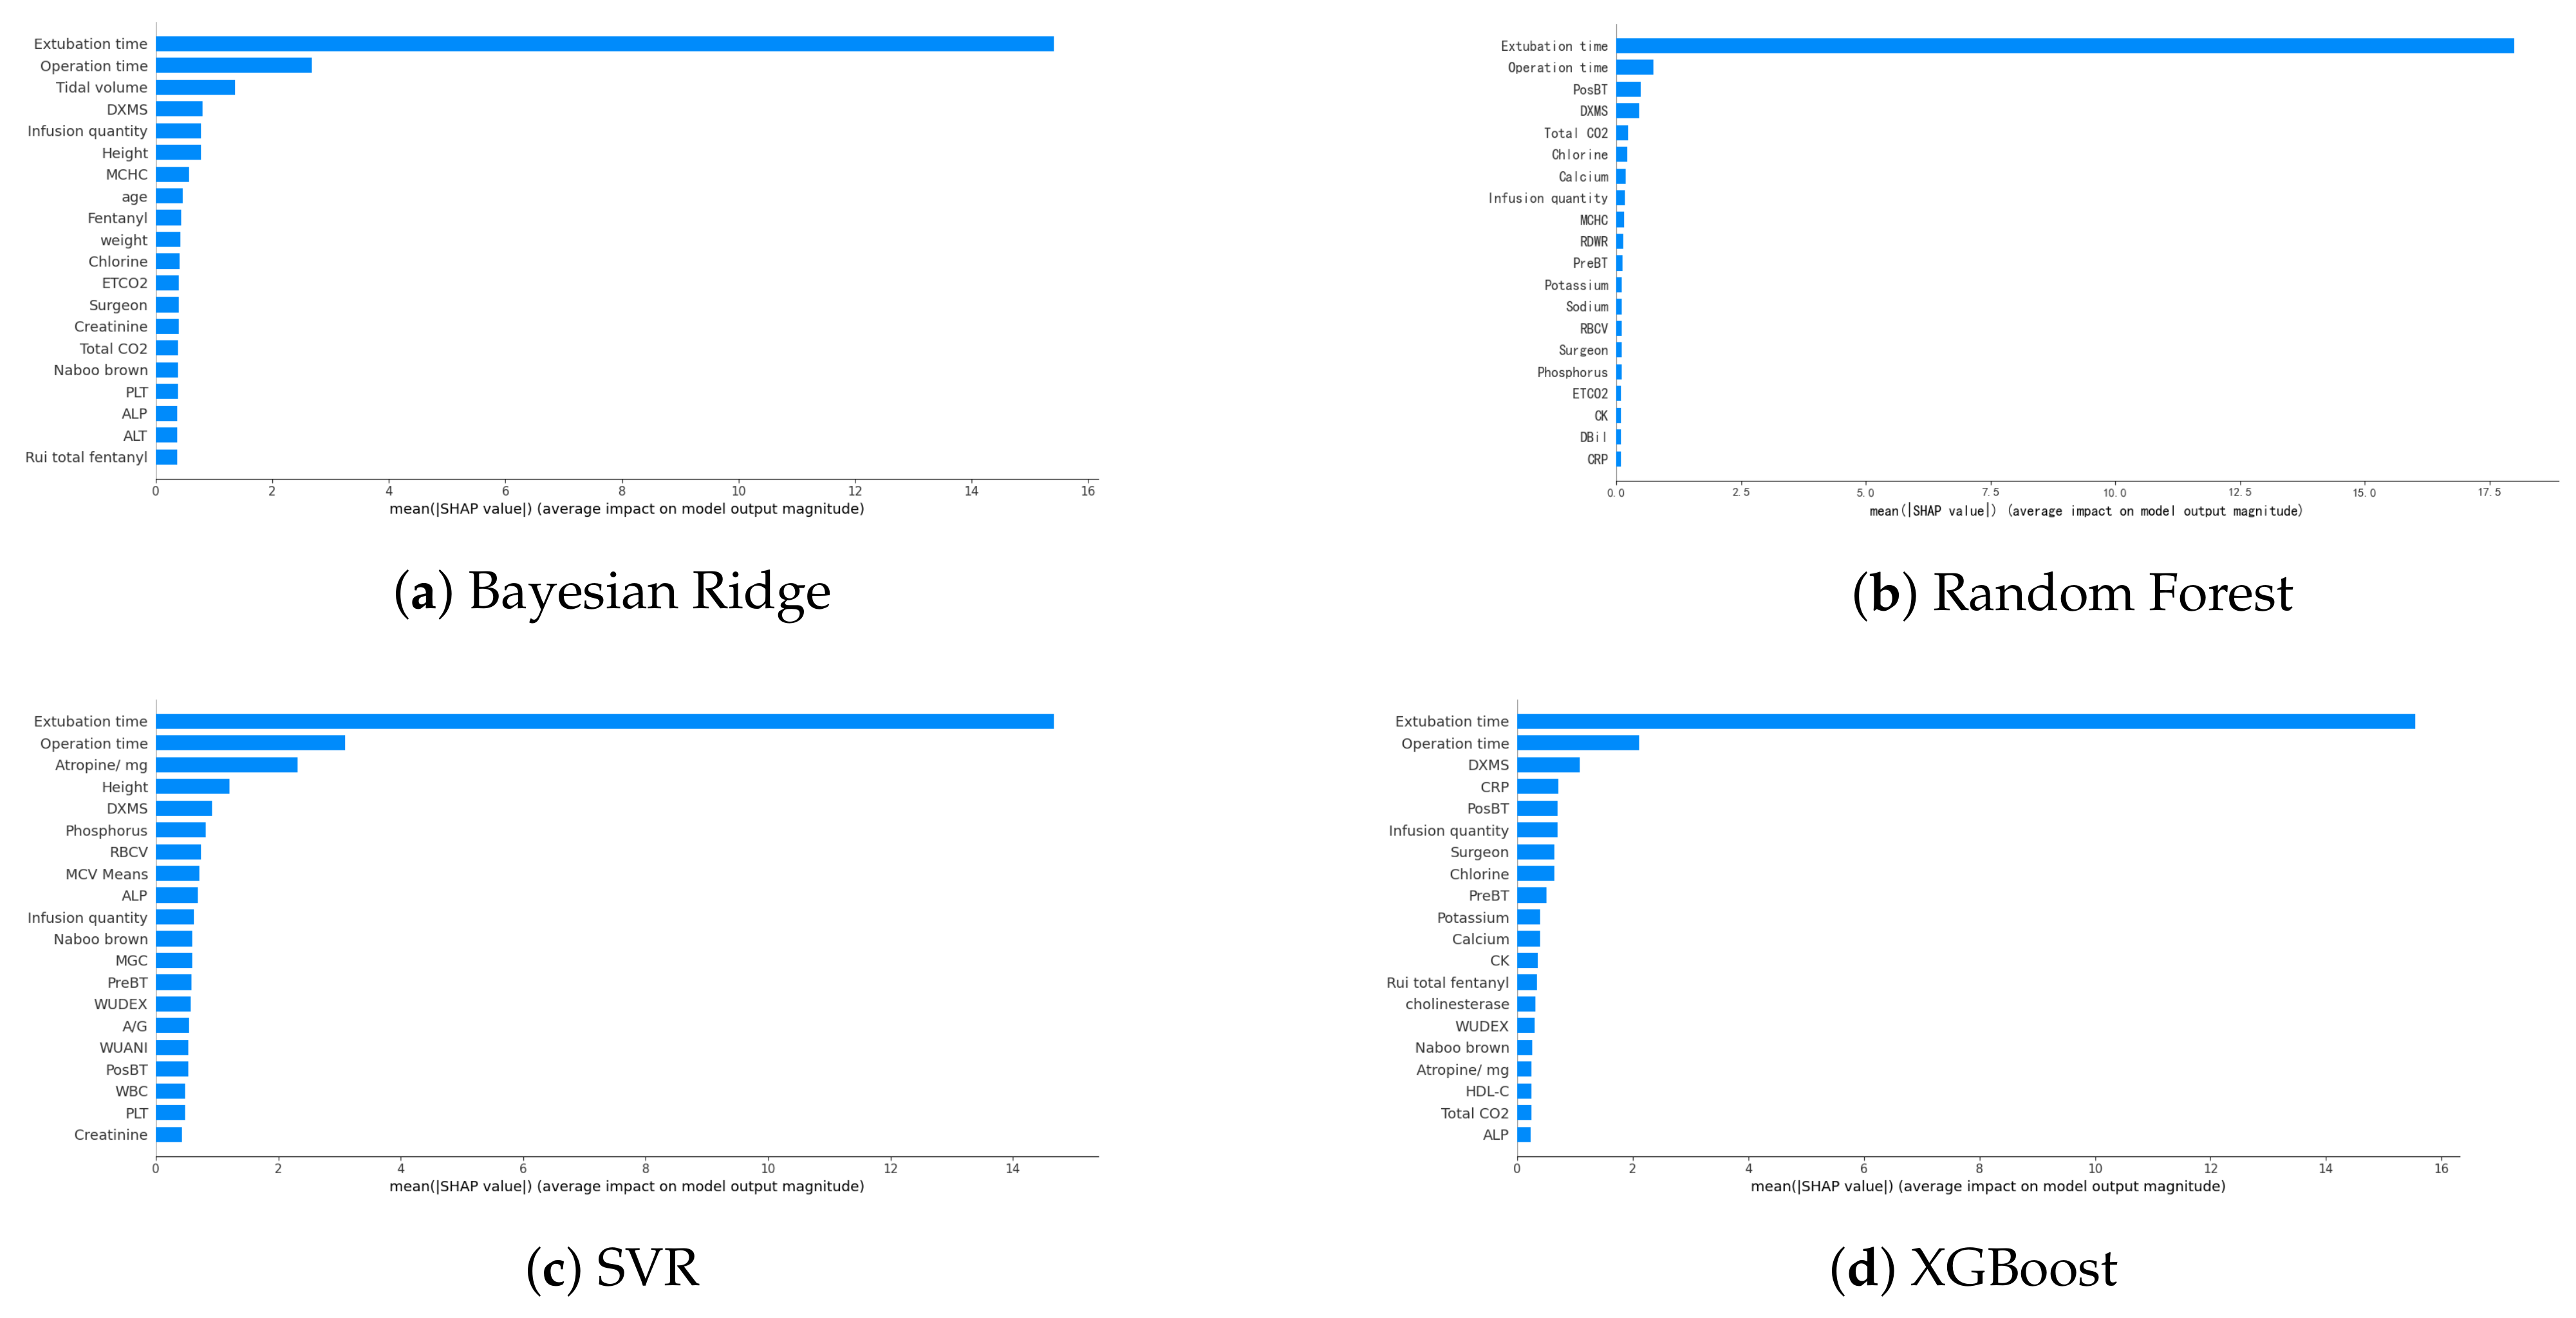
The SHAP toolkit is an interpretable machine learning library for python [22]. Feature importance helps us assess the impact of any given variable on the performance of the algorithm [18]. To interpret the obtained predictive models and verify the validity of the predictions, we performed an analysis of the machine learning predictive models using the SHAP value to estimate feature importance. SHAP values of Bayesian ridge, random forest, SVR, and XGBoost are presented in Figure 4. Because it is not suitable to use the SHAP tool to interpret deep learning models, we do not provide SHAP values for the deep learning methods. We selected four machine learning models with the most efficient prediction performance to obtain the importance of features. Among all models, the extubation time is the most valuable feature, followed by the operation time. The third most valuable characteristic of each model is different. Because dexamethasone (DXMS) is the third or fourth of four models, it is comprehensively the third most important indicator after synthesis.
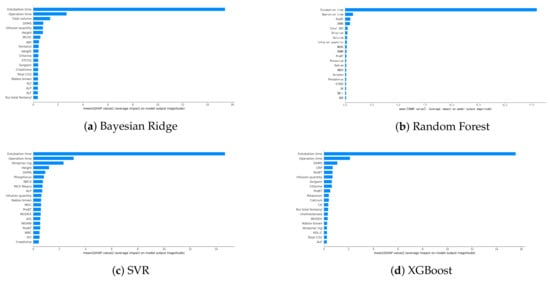
Figure 4.
Top 20 important features calculated according to mean absolute SHAP values. The abbreviations in the figure are shown in Table A1 in the following abbreviations part.
Synthetically, the four most important indicators, from high to low, are extubation time, operation time, dexamethasone (DXMS), and postoperative body temperature (PosBT). The correlation between extubation time and anesthesia recovery time was the most significant. Other indicators have little significance for predicting recovery time from anesthesia. This provides an anesthesiologist with a judgmental basis to determine the recovery time after anesthesia.
4.4. Limitations
This study has a few limitations. For example, features used for prediction model training were extracted only from the same eye center. The amount of collected data is inevitably small. The data we collect only include patients treated in the eye centers, so the distribution of data has certain geographical limitations. In the future, we plan to collect data from multiple hospitals and employ small dataset algorithms [45] in our models, and extend our study to other prediction tasks [46,47].
5. Conclusions
In this paper, we explore the problem of predicting recovery time after anesthesia based on the patient’s basic information as well as past vital signs and medication use history. Firstly, we collect patient information on anesthesia recovery time, preoperative data, intraoperative intervention, intraoperative monitoring data, and postoperative data from eye centers. Secondly, we design two deep learning models, including a linear residual neural network and a jumping knowledge linear neural network. Lastly, we adopt machine learning models and deep learning models to predict the recovery time of patients after anesthesia. The machine learning models consist of XGBoost, random tree regression, support vector regression, lightGBM, and Bayesian ridge regression. Executive experiments and analysis reveal that machine learning methods perform more effectively than the linear residual model and jumping knowledge linear neural network in the deep learning model. This suggests that machine learning can better capture multivariate information with a small amount of data to predict anesthesia recovery time. The pictures of the SHAP value to explain the importance of the features demonstrate that extubation time, operation time, and dexamethasone are most significant in predicting recovery time from anesthesia. In our future work, we will delve into deep learning models with a large number of patients for anesthetists.
Author Contributions
Conceptualization, T.Z. and C.L.; Data curation, C.L.; Formal analysis, Y.S. and Z.L.; Funding acquisition, T.Z.; Investigation, S.Y. and H.L.; Methodology, S.Y. and H.L.; Software, S.Y. and H.L.; Project administration, C.L. and Z.L.; Supervision, T.Z.; Validation, Y.S. and Z.L.; Visualization, S.Y.; Writing—original draft, S.Y. and Z.L.; S.Y., H.L. and Z.L. contribute equally. All authors have read and agreed to the published version of the manuscript.
Funding
This work was supported by the National Natural Science Foundation of China (No. 61902232), the 2022 Guangdong Basic and Applied Basic Research Foundation (No. 2022A1515011590), the STU Incubation Project for the Research of Digital Humanities and New Liberal Arts (No. 2021DH-3), the 2020 Li Ka Shing Foundation Cross-Disciplinary Research Grant (No. 2020LKSFG05D), and the Open Fund of Guangdong Provincial Key Laboratory of Infectious Diseases and Molecular Immunopathology (No. GDKL202212).
Institutional Review Board Statement
This study has been approved by the ethics committee board of the Joint Shantou International Eye Center of Shantou University and The Chinese University of Hong Kong.
Informed Consent Statement
Patient consent was waived due to no personal identification included in the dataset for this retrospective analysis.
Data Availability Statement
The software can be requested from the corresponding author.
Acknowledgments
The software was written by S.Y. and H.L., and run by C.L. The data have not been accessed by whom not affiliated with the Joint Shantou International Eye Center of Shantou University and The Chinese University of Hong Kong.
Conflicts of Interest
The authors declare no conflict of interest.
Appendix A
The following abbreviations in Table A1 are used in this manuscript.
Table A1.
Full names and corresponding abbreviations of the collected features. Features marked with * are from dataset A, conversely from dataset B.
Table A1.
Full names and corresponding abbreviations of the collected features. Features marked with * are from dataset A, conversely from dataset B.
| Features Name | |||||
|---|---|---|---|---|---|
| Full Name | grouping * | gender * | age * | weight * | height * |
| Abbreviations | - | - | - | - | - |
| Full Name | Preoperative body temperature * | Preoperative medication (atropine mg) * | Emergency surgery | History of surgery * | Basic diseases * |
| Abbreviations | PreBT | Atropine/mg | - | - | - |
| Full Name | ASA sizing * | Infusion quantity | Operation time | fentanyl | Classification and muscle relaxants |
| Abbreviations | - | - | - | - | MGC |
| Full Name | The postoperative complications * | Rui total fentanyl (mu/g) | Whether to use dexmedetomidine | Whether to use anti-nausea drugs | Naboo brown |
| Abbreviations | PO-comp | - | WUDEX | WUANI | - |
| Full Name | dexamethasone | Tidal volume | ETCO2 | The clinician | Vascular active drug |
| Abbreviations | DXMS | - | - | Clinician | VAD |
| Full Name | The surgeon | Operation type | Extubation time * | Postoperative body temperature * | potassium |
| Abbreviations | Surgeon | - | - | PosBT | - |
| Full Name | sodium | chlorine | calcium | phosphorus | total carbon dioxide |
| Abbreviations | - | - | - | - | Total CO2 |
| Full Name | The total protein | albumin | globulin | White ball than | Total bilirubin |
| Abbreviations | TP | - | - | A/G | TBIL |
| Full Name | Direct bilirubin | Indirect bilirubin | Cereal third transaminase | Aspertate aminotransferase | GGTP (gamma-glutamyl transpeptidase) |
| Abbreviations | DBil | I-Bil | ALT | SGPT | GGTP |
| Full Name | Alkaline phosphatase | cholinesterase | L-lactic dehydrogenase | Alpha hydroxybutyric acid dehydrogenase | Creatine kinase |
| Abbreviations | ALP | - | LDH | Alpha-HBD | CK |
| Full Name | Creatine enzyme isoenzyme MB | Urea | creatinine | Uric acid | Cystine protease inhibition enzyme C |
| Abbreviations | CK-MB | - | - | - | CPIEC |
| Full Name | glucose | fructosamine | Total cholesterol | triglycerides | High density cholesterol |
| Abbreviations | - | FA | TC | - | HDL-C |
| Full Name | Low density cholesterol | C-reactive protein | White blood cell count | Neutrophil percentage | The lymphocyte percentage |
| Abbreviations | LDL-C | CRP | WBC | NEUT% | LY% |
| Full Name | Monocyte percentage | Eosinophil percentage | Basophils percentage | The absolute value neutral cells | The lymphocyte absolute value |
| Abbreviations | M% | E% | B% | Physiol Meas | Lymp Meas |
| Full Name | Monocyte absolute value | Eosinophils absolute value | Basophils absolute value | Red blood cell count | hemoglobin |
| Abbreviations | Mono Meas | Eosi Meas | Baso Meas | RBC | HGB |
| Full Name | Red blood cells deposited | Average red blood cell volume | The average amount of hemoglobin | Average hemoglobin concentration | Red blood cell distribution width |
| Abbreviations | RBCA | RBCV | MCV Means | MCHC | RDWR |
| Full Name | The platelet count | Platelet than the product | Mean platelet volume | Platelet distribution width | Routine urine * |
| Abbreviations | PLT | PCT | MPV | PDW | RU |
| Full Name | Recovery time * | ||||
| Abbreviations | - | ||||
References
- John Doyle, D.; Dahaba, A.A.; LeManach, Y. Advances in anesthesia technology are improving patient care, but many challenges remain. BMC Anesthesiol. 2018, 18, 39. [Google Scholar]
- Doyle, D.J.; Garmon, E.H. American Society of Anesthesiologists Classification (ASA Class); American Society of Anesthesiologists: Schaumburg, IL, USA, 2017. [Google Scholar]
- Miyaguchi, N.; Takeuchi, K.; Kashima, H.; Morita, M.; Morimatsu, H. Predicting anesthetic infusion events using machine learning. Sci. Rep. 2021, 11, 1–10. [Google Scholar] [CrossRef]
- Jeong, Y.S.; Kang, A.R.; Jung, W.; Lee, S.J.; Lee, S.; Lee, M.; Chung, Y.H.; Koo, B.S.; Kim, S.H. Prediction of blood pressure after induction of anesthesia using deep learning: A feasibility study. Appl. Sci. 2019, 9, 5135. [Google Scholar] [CrossRef] [Green Version]
- Lalonde, D.; Martin, A. Epinephrine in local anesthesia in finger and hand surgery: The case for wide-awake anesthesia. JAAOS-J. Am. Acad. Orthop. Surg. 2013, 21, 443–447. [Google Scholar] [CrossRef]
- Doyle, D.J.; Goyal, A.; Bansal, P.; Garmon, E.H. American Society of Anesthesiologists Classification; StatPearls Publishing: Treasure Island, FL, USA, 2021. [Google Scholar]
- Char, D.S.; Burgart, A. Machine Learning Implementation in Clinical Anesthesia: Opportunities and Challenges. Anesth. Analg. 2020, 130, 1709. [Google Scholar] [CrossRef]
- Mancel, L.; Van Loon, K.; Lopez, A.M. Role of regional anesthesia in Enhanced Recovery after Surgery (ERAS) protocols. Curr. Opin. Anesthesiol. 2021, 34, 616–625. [Google Scholar] [CrossRef]
- Mirsadeghi, M.; Behnam, H.; Shalbaf, R.; Jelveh Moghadam, H. Characterizing awake and anesthetized states using a dimensionality reduction method. J. Med. Syst. 2016, 40, 1–8. [Google Scholar] [CrossRef]
- Schamberg, G.; Badgeley, M.; Brown, E.N. Controlling level of unconsciousness by titrating propofol with deep reinforcement learning. In Proceedings of the International Conference on Artificial Intelligence in Medicine; Springer: Berlin/Heidelberg, Germany, 2020; pp. 26–36. [Google Scholar]
- Zhao, X.; Liao, K.; Wang, W.; Xu, J.; Meng, L. Can a deep learning model based on intraoperative time-series monitoring data predict post-hysterectomy quality of recovery? Perioper. Med. 2021, 10, 1–12. [Google Scholar] [CrossRef]
- Zhou, T.; Han, G.; Li, B.N.; Lin, Z.; Ciaccio, E.J.; Green, P.H.; Qin, J. Quantitative analysis of patients with celiac disease by video capsule endoscopy: A deep learning method. Comput. Biol. Med. 2017, 85, 1–6. [Google Scholar] [CrossRef]
- Li, B.N.; Wang, X.; Wang, R.; Zhou, T.; Gao, R.; Ciaccio, E.J.; Green, P.H. Celiac Disease Detection from Videocapsule Endoscopy Images Using Strip Principal Component Analysis. IEEE ACM Trans. Comput. Biol. Bioinform. 2019, 18, 1396–1404. [Google Scholar] [CrossRef]
- Song, Y.; Yu, Z.; Zhou, T.; Teoh, J.Y.C.; Lei, B.; Choi, K.S.; Qin, J. Learning 3D Features with 2D CNNs via Surface Projection for CT Volume Segmentation. In Proceedings of the International Conference on Medical Image Computing and Computer-Assisted Intervention; Springer: Berlin/Heidelberg, Germany, 2020; pp. 176–186. [Google Scholar] [CrossRef]
- Huang, H.; Zheng, S.; Yang, Z.; Wu, Y.; Li, Y.; Qiu, J.; Cheng, Y.; Lin, P.; Lin, Y.; Guan, J.; et al. Voxel-based morphometry and a deep learning model for the diagnosis of early Alzheimer’s disease based on cerebral gray matter changes. Cereb. Cortex 2022, bhac099, Epub ahead of printing. [Google Scholar] [CrossRef] [PubMed]
- Yuan, Y.; Quan, T.; Song, Y.; Guan, J.; Zhou, T.; Wu, R. Noise-immune Extreme Ensemble Learning for Early Diagnosis of Neuropsychiatric Systemic Lupus Erythematosus. IEEE J. Biomed. Health Inform. 2022, 26, 3495–3506. [Google Scholar] [CrossRef] [PubMed]
- Song, Y.; Zhou, T.; Teoh, J.Y.C.; Zhang, J.; Qin, J. Unsupervised Learning for CT Image Segmentation via Adversarial Redrawing. In Proceedings of the International Conference on Medical Image Computing and Computer-Assisted Intervention; Springer: Berlin/Heidelberg, Germany, 2020; pp. 309–320. [Google Scholar] [CrossRef]
- Lee, J.; Woo, J.; Kang, A.R.; Jeong, Y.S.; Jung, W.; Lee, M.; Kim, S.H. Comparative analysis on machine learning and deep learning to predict post-induction hypotension. Sensors 2020, 20, 4575. [Google Scholar] [CrossRef] [PubMed]
- Wang, Q.; Liu, F.; Wan, G.; Chen, Y. Inference of Brain States under Anesthesia with Meta Learning Based Deep Learning Models. IEEE Trans. Neural Syst. Rehabil. Eng. 2022, 30, 1081–1091. [Google Scholar] [CrossRef]
- Liu, Y.; Cheng, L. Ultrasound images guided under deep learning in the anesthesia effect of the regional nerve block on scapular fracture surgery. J. Healthc. Eng. 2021, 2021, 6231116. [Google Scholar] [CrossRef]
- Afshar, S.; Boostani, R.; Sanei, S. A combinatorial deep learning structure for precise depth of anesthesia estimation from EEG signals. IEEE J. Biomed. Health Inform. 2021, 25, 3408–3415. [Google Scholar] [CrossRef]
- Mokhtari, K.E.; Higdon, B.P.; Başar, A. Interpreting financial time series with SHAP values. In Proceedings of the 29th Annual International Conference on Computer Science and Software Engineering, Toronto, ON, Canada, 4–6 November 2019; pp. 166–172. [Google Scholar]
- Laberge, G.; Aïvodji, U.; Hara, S. Fooling SHAP with Stealthily Biased Sampling. arXiv 2022, arXiv:2205.15419. [Google Scholar]
- Xu, W.; Liu, X.; Leng, F.; Li, W. Blood-based multi-tissue gene expression inference with Bayesian ridge regression. Bioinformatics 2020, 36, 3788–3794. [Google Scholar] [CrossRef]
- Chen, C.; Zhang, Q.; Ma, Q.; Yu, B. LightGBM-PPI: Predicting protein-protein interactions through LightGBM with multi-information fusion. Chemom. Intell. Lab. Syst. 2019, 191, 54–64. [Google Scholar] [CrossRef]
- Speiser, J.L.; Miller, M.E.; Tooze, J.; Ip, E. A comparison of random forest variable selection methods for classification prediction modeling. Expert Syst. Appl. 2019, 134, 93–101. [Google Scholar] [CrossRef]
- Rigatti, S.J. Random forest. J. Insur. Med. 2017, 47, 31–39. [Google Scholar] [CrossRef] [Green Version]
- Ogunleye, A.; Wang, Q.G. XGBoost model for chronic kidney disease diagnosis. IEEE ACM Trans. Comput. Biol. Bioinform. 2019, 17, 2131–2140. [Google Scholar] [CrossRef]
- Potdar, K.; Pardawala, T.S.; Pai, C.D. A comparative study of categorical variable encoding techniques for neural network classifiers. Int. J. Comput. Appl. 2017, 175, 7–9. [Google Scholar] [CrossRef]
- Chen, T.; He, T.; Benesty, M.; Khotilovich, V.; Tang, Y.; Cho, H.; Chen, K. Xgboost: Extreme Gradient Boosting, R package version 0.4-2; R Foundation for Statistical Computing: Vienna, Austria, 2015; pp. 1–4. [Google Scholar]
- Zheng, S.; Zhang, S.; Song, Y.; Lin, Z.; Dazhi, J.; Zhou, T. A noise-immune boosting framework for short-term traffic flow forecasting. Complexity 2021, 2021, 5582974. [Google Scholar] [CrossRef]
- Breiman, L. Random forests. Mach. Learn. 2001, 45, 5–32. [Google Scholar] [CrossRef] [Green Version]
- Cai, L.; Chen, Q.; Cai, W.; Xu, X.; Zhou, T.; Qin, J. SVRGSA: A hybrid learning based model for short-term traffic flow forecasting. IET Intell. Transp. Syst. 2019, 13, 1348–1355. [Google Scholar] [CrossRef]
- Cai, W.; Yu, D.; Wu, Z.; Du, X.; Zhou, T. A hybrid ensemble learning framework for basketball outcomes prediction. Phys. A Stat. Mech. Appl. 2019, 528, 1–8. [Google Scholar] [CrossRef]
- Li, Y.; Ge, Z.; Zhiyan, Z.; Shen, Z.; Wang, Y.; Zhou, T.; Wu, R. Broad learning enhanced 1H-MRS for early diagnosis of neuropsychiatric systemic lupus erythematosus. Comput. Math. Methods Med. 2020, 2020, 8874521. [Google Scholar] [CrossRef]
- Dou, H.; Tan, J.; Wei, H.; Wang, F.; Yang, J.; Ma, X.G.; Wang, J.; Zhou, T. Transfer inhibitory potency prediction to binary classification: A model only needs a small training set. Comput. Methods Programs Biomed. 2022, 215, 106633. [Google Scholar] [CrossRef]
- Ke, G.; Meng, Q.; Finley, T.; Wang, T.; Chen, W.; Ma, W.; Ye, Q.; Liu, T.Y. LightGBM: A highly efficient gradient boosting decision tree. In Proceedings of the 31st Conference on Neural Information Processing Systems (NIPS 2017), Long Beach, CA, USA, 4–9 December 2017. [Google Scholar]
- Shi, Q.; Abdel-Aty, M.; Lee, J. A Bayesian ridge regression analysis of congestion’s impact on urban expressway safety. Accid. Anal. Prev. 2016, 88, 124–137. [Google Scholar] [CrossRef]
- Targ, S.; Almeida, D.; Lyman, K. Resnet in resnet: Generalizing residual architectures. arXiv 2016, arXiv:1603.08029. [Google Scholar]
- Zhou, T.; Han, G.; Xu, X.; Lin, Z.; Han, C.; Huang, Y.; Qin, J. δ-agree AdaBoost stacked autoencoder for short-term traffic flow forecasting. Neurocomputing 2017, 247, 31–38. [Google Scholar] [CrossRef]
- Xu, K.; Li, C.; Tian, Y.; Sonobe, T.; Kawarabayashi, K.i.; Jegelka, S. Representation learning on graphs with jumping knowledge networks. In Proceedings of the International Conference on Machine Learning, PMLR, Stockholm, Sweden, 10–15 July 2018; pp. 5453–5462. [Google Scholar]
- Su, R.; Chen, X.; Cao, S.; Zhang, X. Random forest-based recognition of isolated sign language subwords using data from accelerometers and surface electromyographic sensors. Sensors 2016, 16, 100. [Google Scholar] [CrossRef] [PubMed] [Green Version]
- Terrault, N.A.; Hassanein, T.I. Management of the patient with SVR. J. Hepatol. 2016, 65, S120–S129. [Google Scholar] [CrossRef] [PubMed] [Green Version]
- Bartlett, P.; Helmbold, D.; Long, P. Gradient descent with identity initialization efficiently learns positive definite linear transformations by deep residual networks. In Proceedings of the International Conference on Machine Learning, PMLR, Stockholm, Sweden, 10–15 July 2018; pp. 521–530. [Google Scholar]
- Zhou, T.; Dou, H.; Tan, J.; Song, Y.; Wang, F.; Wang, J. Small dataset solves big problem: An outlier-insensitive binary classifier for inhibitory potency prediction. Knowl.-Based Syst. 2022, 251, 109242. [Google Scholar] [CrossRef]
- Lu, H.; Ge, Z.; Song, Y.; Jiang, D.; Zhou, T.; Qin, J. A temporal-aware lstm enhanced by loss-switch mechanism for traffic flow forecasting. Neurocomputing 2021, 427, 169–178. [Google Scholar] [CrossRef]
- Yang, S.; Li, H.; Luo, Y.; Li, J.; Song, Y.; Zhou, T. Spatiotemporal Adaptive Fusion Graph Network for Short-Term Traffic Flow Forecasting. Mathematics 2022, 10, 1594. [Google Scholar] [CrossRef]

Publisher’s Note: MDPI stays neutral with regard to jurisdictional claims in published maps and institutional affiliations. |
© 2022 by the authors. Licensee MDPI, Basel, Switzerland. This article is an open access article distributed under the terms and conditions of the Creative Commons Attribution (CC BY) license (https://creativecommons.org/licenses/by/4.0/).