Article

Technology Spillovers among Innovation Agents from the Perspective of Network Connectedness

School of Economics, Jinan University, Guangzhou 510632, China
*
Author to whom correspondence should be addressed.
Mathematics 2022, 10(16), 2854; https://doi.org/10.3390/math10162854
Submission received: 5 July 2022 / Revised: 6 August 2022 / Accepted: 7 August 2022 / Published: 10 August 2022

Abstract

:
By constructing a technology spillover connectedness index and connectedness matrix, this paper studies the technology spillover connectedness among innovation agents in China from the perspective of network topology. An empirical study based on invention patent data finds that there is noticeable technology spillover connectedness among the six innovation agents: central enterprises, other domestic enterprises, universities and scientific research institutes, troops, individuals and other organizations, and foreign-funded enterprises. Other domestic enterprises are the hub of technology spillover connectedness among these agents, while foreign-funded enterprises play a limited role. The study of further subdividing foreign-funded enterprises according to their sources finds that the United States, South Korea, and Japan are the centers of technology spillover connectedness in China. The dynamic evolution of technology spillover connectedness shows that the total technology spillover connectedness among innovation agents presents an obvious downward trend, which is closely related to the complex and changeable international economic situation and the uncertainty of China’s economic policy in recent years. This paper concludes with insights into how China uses the spillover connectedness among innovation agents to spur agents’ innovation performance and promote the nation’s economic growth and competitiveness.

1. Introduction

Long-run sustainable economic growth, or economic development, is one of the main goals of each country. Under the framework of endogenous growth, technological advancement and innovation are the major motive powers for maintaining a nation’s long-run economic growth, productivity gain, and competitive advantage [1,2,3]. In the Proposal of the CPC (Communist Party of China) Central Committee on Formulating the 14th Five Year Plan for National Economic and Social Development and the Long-Term Goals for 2035, “adhering to the core position of innovation in the overall situation of China’s modernization” and “deeply implementing the innovation driven development strategy” is emphasized.
As an important power source of innovation, technology spillover has long been a focal point of academic researchers and policymakers. Maskus [4] defines technology spillover as ‘‘technological knowledge being learned and absorbed into competition in such a way that the benefits do not fully accrue to the original owner of the technology’’. Griliches [5] classifies technology spillovers into rent spillovers and pure knowledge spillovers. Rent spillovers occur because of imperfect and asymmetric information or the impossibility of price discrimination by the innovating firm and via trade or direct investment flows. In contrast, pure knowledge spillovers arise because of the imperfect appropriability of knowledge associated with innovations and are performed through patent citation, patent cooperation, or licensing [6].
A large body of literature focuses on rent spillovers and examines whether international trade and foreign direct investment (FDI) play a role in promoting technology spillover [7,8]. International trade has been widely accepted as the major channel of technology spillover [9,10,11]. However, the spillover effect of FDI on the host country is controversial. Though some research verifies the positive spillover effect of FDI on the innovation performance of domestic firms or industries [12,13], some research finds that FDI can also be a curse [14], which is explained by the agglomeration effect and the competition effect [15].
Nevertheless, it is difficult to measure pure knowledge flows because of their diversified channels of spillovers [6]. Patent citations [16,17,18] and patent collaboration [19,20] are widely used in this issue.
In addition to identifying the channels of technology spillover connectedness, the spillover connectedness among different innovation agents counts for much. An innovation agent is a person or social organization that can innovate and actually engages in innovative activities and is the decision maker and important participant in the patent implementation. The main innovation agent is diverse, mainly including universities, scientific research institutions, enterprises, and individuals. Therefore, promoting the technology spillover connectedness and strengthening the innovation linkage among innovation agents is undoubtedly significant to improving innovation agents’ performance and enhancing China’s economic innovation and competitiveness.
Yet few studies comprehensively examine the technology spillover connectedness across innovation agents. This paper attempts to contribute to the existing literature by systematically analyzing the direction and scale of technology spillover connectedness among the innovation agents from the perspective of network connectedness.
The remaining of this paper is organized as follows. Section 2 summarizes related literature. Section 3 describes the conceptual framework. Section 4 and Section 5 conduct static and dynamic analyses of the technology spillover connectedness among innovation agents, respectively. Conclusion and discussion are shown in Section 6.

2. Literature Review

Two strands of literature are closely related to our study: technology spillovers among innovation agents and technology spillover analysis from the perspective of network connectedness.

2.1. Technology Spillovers among Innovation Agents

Universities, scientific research institutes, and firms have traditionally been identified as the essential elements of the innovation system [21,22]. Therefore, some research focuses on the technology spillover in the industry-university-research collaboration [23,24]. Chen et al. [25] put forward a methodology for shaping network dynamics of university-industry collaboration. Cao and Li [26] analyze the evolution law of knowledge transfer in the industry-university-research cooperation innovation network under different network scales. Mao et al. [27] investigate the impact of network density and heterogeneity on knowledge growth in university-industry innovation networks. In addition, some research explores the approach that fosters university-industry collaborations for innovation [28]. Similarly, by analyzing the key factors affecting knowledge flow in the IUR-SI (industry-university-research institute synergetic innovation) process, Wu et al. [29] explore how knowledge flow can be promoted more effectively and efficiently. By comparing the spillover effect of domestic and international universities on local firms’ innovation, Qiu et al. [30] capture that domestic collaboration rather than international collaboration has had larger positive spillovers in recent years due to regional absorptive capacity.
There is also a substantial amount of literature on the spillover effect among firms of different sizes or ownership. Some studies have investigated the vertical and horizontal spillover effects from multinationals to local firms. Vertical spillover refers to multinationals promoting the technological capability of other related upstream and downstream industries in the host country [31]. In contrast, the horizontal technology spillover effect refers to multinationals promoting technological developments in the same industry in the host country [32]. Motohashi and Yuan [33] find evidence of vertical spillovers of innovative activities of multinationals on local firms in China. Del Giudice et al. [34] verify the effect of horizontal technology spillover on small- and medium-sized enterprises (SMEs) for international growth.
The technology spillover among firms of different sizes is also widely examined. Bin [35] finds that technological developments in large- and medium-sized (LMEs) enterprises spill over upon non-LMEs and state-owned LMEs spill over to both state-owned and non-state-owned enterprises in manufacturing industries with low technological capital intensity. Recently, technology spillover among small- and medium-sized firms is also verified [36], as many SMEs are clustering in Science Parks and Economic Development Zones, which can provide them with an interactive network leading to cooperation and sharing of knowledge [37].

2.2. Technology Spillover Analysis from the Perspective of Network Connectedness

Patent citations and patent collaboration has increased the interconnectedness and interdependence among innovation agents, resulting in the rise of collaboration networks [38]. Social networks of inventors have been verified as a significant mechanism for technology spillovers [39,40,41]. A recent study by Tajpour et al. [42] finds that effective participation in the organizational social network can activate knowledge management and create value. Therefore, the characteristics and structure of technology collaboration networks have been examined to depict the technology and knowledge spillover [43].
Some studies use nodes centrality [44], network density [45], and small-world structure of the network [46] to measure the network position of the innovation agents. Using the CRENoS database on regional patenting, Maggioni et al. [47] investigate the characteristics of innovation flows. By incorporating patent citations with co-inventors information, Xiang et al. [48] propose a method for constructing international knowledge spillover networks. Shih and Chang [49] measure each country’s degree, closeness, and betweenness centralities within the international diffusion network. Using topological structures, centrality rankings, and a block modeling analysis assisted by measures from social network analysis, Yang et al. [50] investigate the structure of international technology diffusion and its evolution. Employing co-patent networks and co-publication networks, Wanzenböck et al. [51] investigate the embeddedness of European regions in different types of inter-regional knowledge networks.
The above literature primarily examines the presence of spillover and its direction across agents, but it is largely silent about the more detailed spillover shock from one agent to another. The research of Diebold and Yilmaz [52,53] fills this gap by proposing connectedness measures at all levels, from system-wide to pairwise, that capture the different strengths of different connections and time-variation in connectedness. This method has been widely used in quantifying the connectedness across financial, commodity, and energy markets [54,55,56].
Following the connectedness measures proposed by Diebold and Yilmaz [52,53], this paper constructs the technology spillover connectedness index and technology spillover connectedness matrix. It conducts static and dynamic research on the direction, intensity, and scale of technology spillover connectedness among innovation agents from the perspective of network topology. It also identifies the hub of technology spillover connectedness. Compared with traditional methods that only focus on the connectedness between two agents, the social network analysis can reflect the overall technology spillover connectedness network among innovation agents, which helps to reveal the linkage’s overall characteristics and structural relationship. In addition, this paper illustrates static and dynamic results on the direction, intensity, and scale of technology spillover connectedness among agents, which helps to grasp the innovation ability of all kinds of agents and provides a reference for putting forward targeted policy to improve a nation’s innovation.

3. Conceptual Framework

3.1. Construction of Technology Spillover Connectedness Index and Connectedness Matrix

We use the VAR model to analyze the technology spillover connectedness network among innovation agents. This technology spillover connectedness network is based on forecast error variance decompositions from a generalized VAR framework developed by Diebold and Yilmaz (2012, 2014) [52,53]. Specifically, Diebold and Yilmaz propose a quantitative way of measuring technology spillover connectedness index and matrix in a system based on forecast error variance decompositions of the VAR model. Variance decompositions allow us to split the forecast error variances of each variable into parts and assess how much one variable affects other variables in the system. With this novel technology spillover connectedness index, we can measure the direction and intensity of technology spillover connectedness between innovation agents and identify systemically important innovation agents with large total directional spillover connectedness to others. Thus, the VAR system describes the dynamic relationship between variables. We use the variance decomposition of VAR forecast errors to measure the technology spillover connectedness network among innovation agents. However, the VAR model also has limitations. The more variables included in a VAR system, the more coefficients need to be estimated. Therefore, VAR models usually contain only a few variables.
In this section, we introduce a technology spillover connectedness index and technology spillover connectedness matrix based on this method to systematically investigate both the directional technology spillover connectedness and the total technology spillover connectedness among innovation agents.
First, consider a covariance stationary N-variable VAR(p) process:
x t = i = 1 p Φ i x t i + ε t
where x t is an N-dimensional column vector representing the number of invention patents of N innovation agents. Σ is the covariance matrix. ε 0 , Σ is a vector of independently and identically distributed disturbances. The moving average representation of Equation (1) is as follows.
x t = i = 0 A i ε t i
where the N × N coefficient matrix A i obeys the following recursion.
A i = Φ 1 A i 1 + Φ 2 A i 2 + + Φ p A i p
where A 0 is an N × N identity matrix and A i = 0 for i < 0 .
This variance decomposition allows us to measure the proportion of the forecast error variances of each endogenous variable xi in the VAR system affected by variable xj. It then allows us to assess the spillover intensity from variable xj to variable xi from the perspective of pairwise connectedness. Specifically, the H-step-ahead forecast error variance decompositions of variable xj to variable xi is as follows.
θ i j G H = σ j j 1 h = 0 H 1 e i A h Σ e j 2 h = 0 H 1 e i A h Σ A h e i
where Σ is the covariance matrix for the error vector ε , σ j j is the j th diagonal element of the covariance matrix, and e i is the selection vector, with one as the j th element and zeros otherwise. A h is the coefficient matrix of the moving average, and H is the predictive horizon.
Based on the above variance decompositions, the pairwise directional technology spillover connectedness from innovation agent j to innovation agent i is defined as:
S i j G H = θ i j G H
Note that in general S i j G H S j i G H , so there are N 2 N separate pairwise directional connectedness measures.
Then, we define net pairwise directional technology spillover connectedness, or net technology spillover connectedness from innovation agent j to innovation agent i as
N S i j G H = S i j G H S j i G H
Then, we construct a total directional technology spillover connectedness index to measure the directional spillovers received by one innovation agent from all other innovation agents and the directional spillovers transmitted by one innovation agent to all other innovation agents, which reflect the overall technology spillover connectedness of the innovation agent. Specifically, the column “FROM” in the technology spillover connectedness matrix is its off-diagonal row sum, indicating the sum of the technology spillover connectedness of innovation agent i by other innovation agents. That is, we define total directional technology spillover connectedness from others to i as
S i G H = j = 1 j i N θ i j G H
The row “TO” in the technology spillover connectedness matrix is its off-diagonal column sum, indicating the sum of the technology spillover connectedness of innovation agent j on other innovation agents. That is, we define total directional technology spillover connectedness to others from j as
S j G H = i = 1 i j N θ i j G H
Therefore, innovation agent i ’s net total directional technology spillover connectedness is
N T S i G H = S i G H S i G H
Finally, the total of the off-diagonal entries in the technology spillover connectedness matrix (equivalently, the sum of the “FROM” column or “TO” row) measures total spillovers. We have
S G H = 1 N i , j = 1 i j N θ i j G H
Based on the above method and measures, we can construct a technology spillover connectedness matrix of the innovation agents (Table 1).

3.2. Data Source

As the main form of intellectual property rights, patent data are widely used to study technology spillover connectedness. Considering that patents need to be reviewed from application to authorization, the number of patents authorized can better reflect the quality of patents and technological innovation than the number of patent applications. Therefore, we select the invention patent with the highest technical content as the data source. Specifically, we use big data processing and analysis technology to extract the data of China’s authorized invention patents during 2015 and 2019 from the invention patent database of the State Intellectual Property Office. According to the applicant information of each patent, we can count the number of invention patents of six innovation agents: central enterprises, other domestic enterprises, universities and scientific research institutes, troops, individuals and other organizations, and foreign-funded enterprises.
Figure 1 illustrates the statistics of the number of invention patents of the six innovation agents from 2015 to 2019. Obviously, other domestic enterprises have the largest number of invention patents, and the troops have the least number of invention patents. Specifically, the number of invention patents of other domestic enterprises is 941,389, which is 5.7 times that of central enterprises (164,329), two times that of universities and scientific research institutes (478,056), 1.8 times that of foreign-funded enterprises (535,573), 6.4 times that of individuals and other organizations (147,770), and 100.8 times that of troops (9339).
Table 2 shows the distribution of invention patents of innovation agents. Among them, the proportion of central enterprises increased from 6.010% in 2015 to 7.309% in 2019. The proportion of other domestic enterprises increased from 38.029% in 2015 to 43.631% in 2019. The proportion of universities and scientific research institutes increased from 19.918% in 2015 to 23.284% in 2019. The proportion of troops increased from 0.393% in 2015 to 0.446% in 2019. The proportion of individuals and other organizations decreased from 8.011% in 2015 to 4.441% in 2019, and the proportion of foreign-funded enterprises decreased from 27.640% in 2015 to 20.889% in 2019. The number of authorized patents is mainly concentrated in other domestic enterprises, universities and scientific research institutes, and foreign-funded enterprises. The proportion of patents authorized by central enterprises is relatively stable. The proportion of patents authorized by individuals and other organizations showed a downward trend. However, the proportion of troops is not high.

4. Static Analysis of the Technology Spillover Connectedness among the Innovation Agents

Based on the descriptive statistics analysis of innovation agents’ invention patent data, this section will conduct static analysis by constructing the technology spillover connectedness index and connectedness matrix to measure the technology spillover connectedness path, direction, and degree among the six innovation agents. It will also identify the hub of technology spillover connectedness.

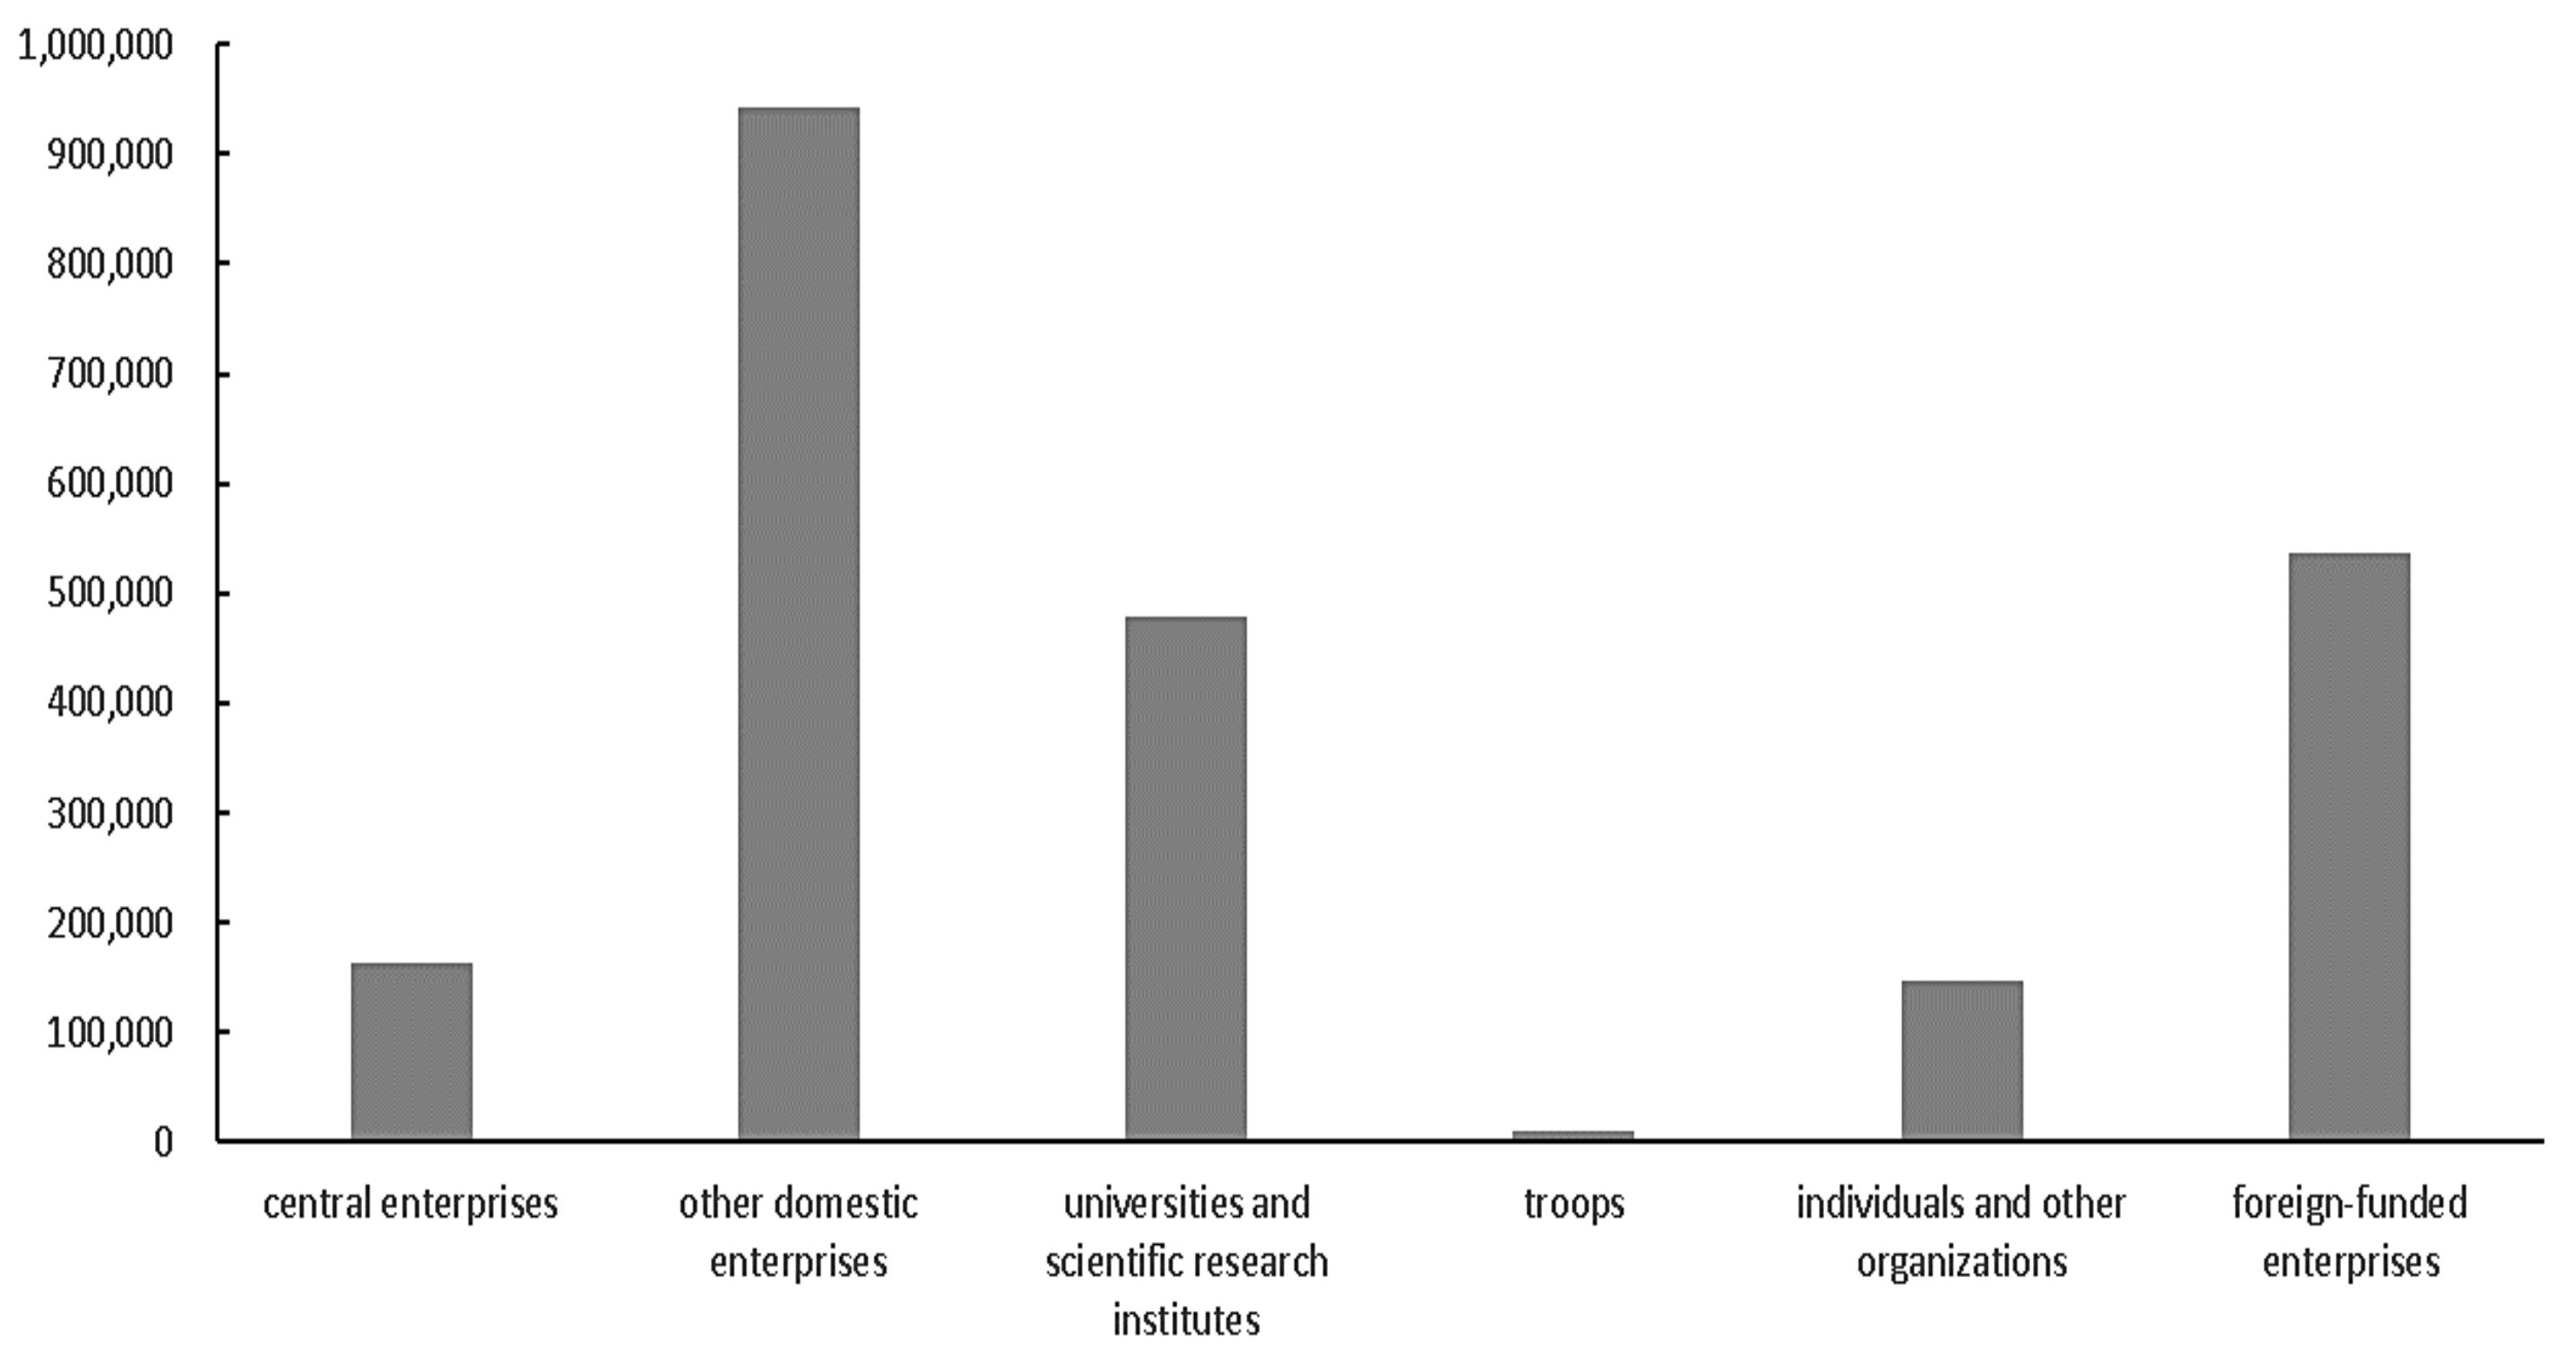
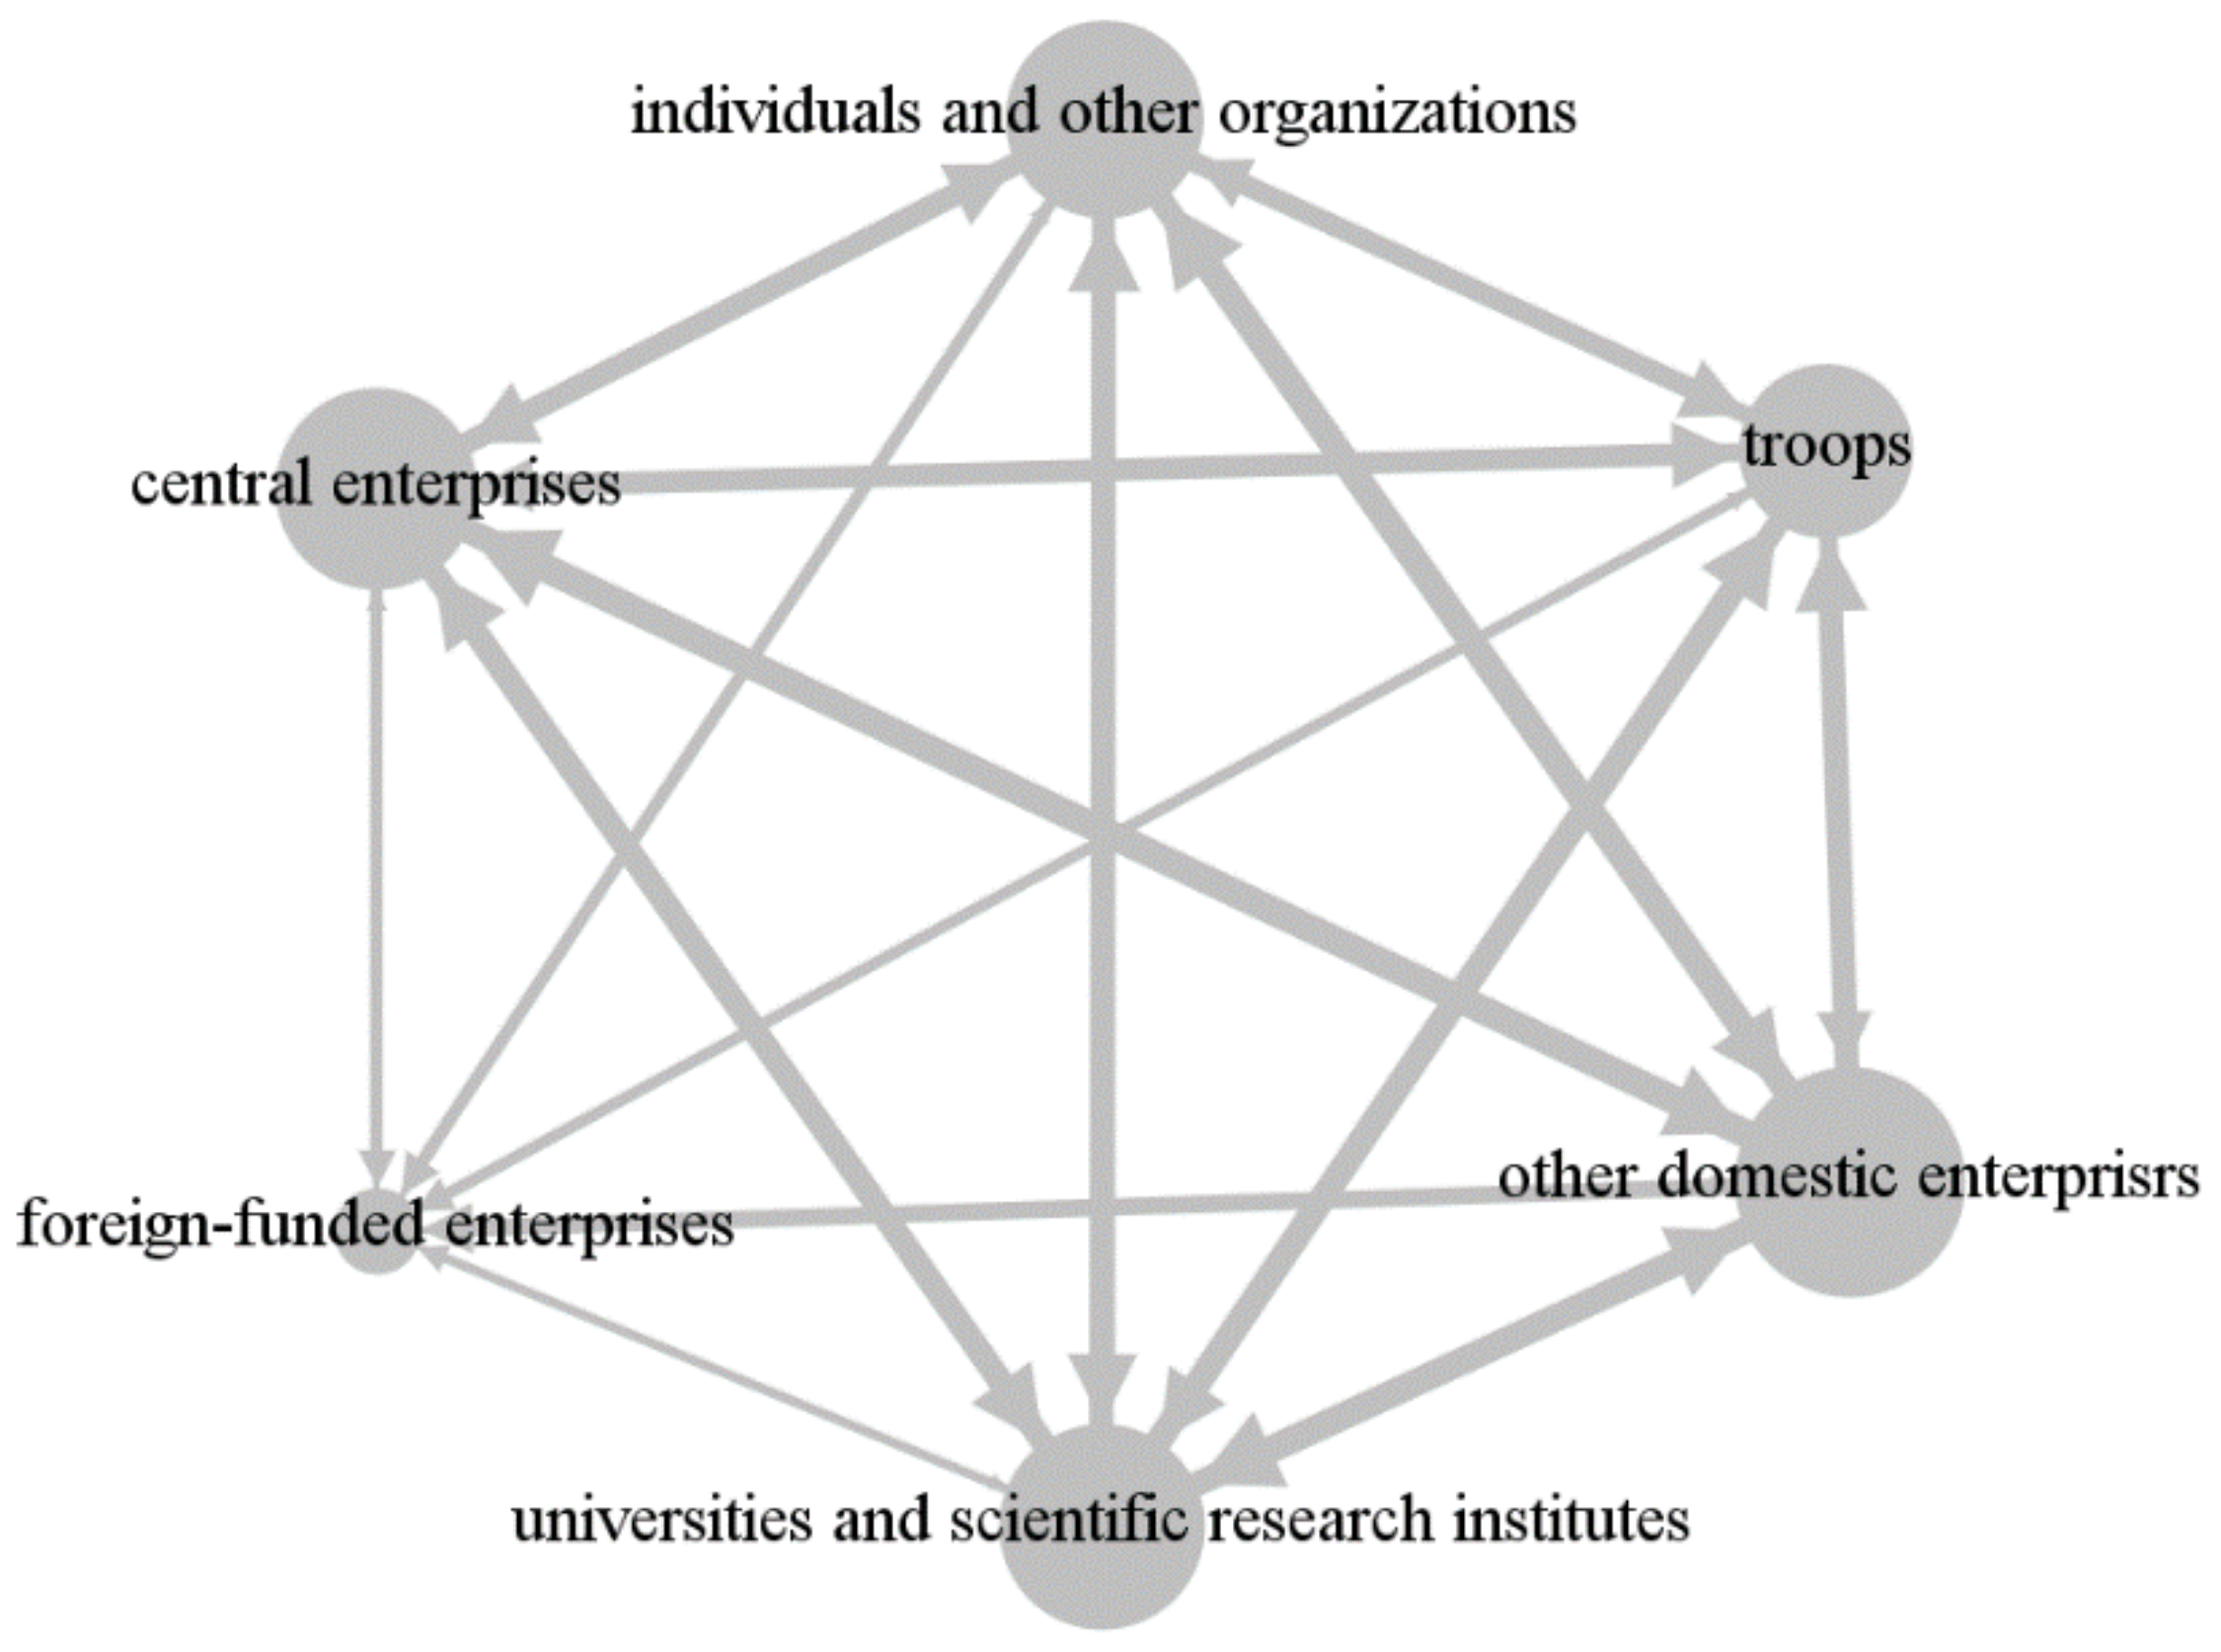
4.1. Analysis of Technology Spillover Connectedness among the Six Innovation Agents

Based on the above technology spillover connectedness index and connectedness matrix, we will use each innovation agent’s weekly invention patent data from January 2015 to December 2019 to analyze the technology spillover connectedness among the six innovation agents.
Given that the technology spillover connectedness index is built on the VAR model, we first take the natural logarithm of the data and use the Augmented Dickey-Fuller (ADF) method to test the stationarity of the invention data of the six innovation agents. The ADF statistics reject the null hypothesis of unit roots at the 1% level. Then, according to the Schwarz Criterion, the optimal lag order of 1 is selected for the VAR model, and the predictive horizon is 5 weeks. The technology spillover connectedness 0+matrix among six agents is calculated, as shown in Table 3.
The total technology spillover connectedness among the six innovation agents is 68.1%, indicating that in addition to the factors of the innovation agents themselves, more than half of the weight is contributed by the other innovation agents, suggesting high technology spillover connectedness among innovation agents. This also confirms that the six innovation agents have formed a close technology spillover connectedness collaboration network.
Then we will discuss the pairwise directional technology spillover connectedness measures, which are the off-diagonal elements of the upper-left 6 × 6 submatrix. The highest observed pairwise connectedness is from other domestic enterprises to central enterprises (21.967%). In return, the pairwise connectedness from central enterprises to other domestic enterprises (19.372%) is also high. In addition, the pairwise connectedness between individuals and other organizations and other domestic enterprises (21.148%, 18.664%), between other domestic enterprises and universities and scientific research institutes (20.973%, 18.892%) is also high. Followed by the pairwise connectedness between central enterprises, universities and scientific research institutes (18.31%, 18.198%), between individuals, other organizations, universities and scientific research institutes (18.141%, 17.183%), between troops, universities and scientific research institutes (20.004%, 16.801%). In general, the most innovative domestic agents play a major role in technology spillover connectedness.
As can be seen from the total directional technology spillover connectedness to others (the “TO” row in Table 3), the connectedness of other domestic enterprises to the other five agents is the largest, reaching 94.309%. The technology spillover connectedness to other agents is followed by universities and scientific research institutes, which reach 80.787%. Central enterprises ranked third, with 78.573% of the technology spillover connectedness to other agents. Individuals and other organizations ranked fourth, with 76.709% of the technology spillover connectedness to other agents. The technology spillover connectedness of troops to other agents is 63.276%. The technology spillover connectedness from any of these five innovation agents is more than 60%. However, foreign-funded enterprises have the smallest total directional technology spillover connectedness to other agents, only 14.946%.
As can be seen from the total directional technology spillover connectedness from others (the “FROM” column in Table 3), universities and scientific research institutes are most affected by other agents, reaching 75.231%. Followed by other domestic enterprises, central enterprises, troops, individuals, and other organizations, with roughly the same total directional technology spillover connectedness. In contrast, foreign-funded enterprises are the least affected by other agents, only 41.97%.
The above results show that other domestic enterprises are the main transmitters of technology spillover connectedness, followed by universities and scientific research institutes, central enterprises, individuals and other organizations, and troops. The technology spillover connectedness of foreign-funded enterprises is relatively small. One possible reason is that most of the invention patents applied by foreign-funded enterprises in China are independent inventions rather than collaboration inventions with Chinese agents. For example, in 2019, foreign-funded enterprises had a total of 92,818 invention patents. Still, the patents applied independently were 87,944, accounting for 95%, while the collaboration invention patents with China were only 926, accounting for 1%.
In order to further analyze the path, intensity, and center of technology spillover connectedness among various agents, the social network diagram of technology spillover connectedness is drawn. As shown in Figure 2, each innovation agent is a “node”, and the larger the node size of the innovation agent, the greater the technology spillover connectedness of the agent to other agents. The connecting line between nodes represents spillover connectedness. The thicker the connecting line, the greater the degree of technology spillover connectedness from one agent to another. It is evident that there is a technology spillover connectedness among various agents. In addition, other domestic enterprises, universities and scientific research institutes, and central enterprises have the largest nodes and become the center of technology spillover connectedness.
Based on the above analysis of technology spillover connectedness, we further examine the net total directional technology spillover connectedness of the six innovation agents. As shown in Table 4, we rank the net total directional technology spillover connectedness of these agents. “TO” and “FROM” are the same as in Table 3, measuring the technology spillover connectedness of one agent to other agents and from other agents. The net total directional technology spillover connectedness “NET” is “TO” minus “FROM” (formula (9)) and “GROSS” is the sum of “TO” and “FROM”.
Positive net total directional technology spillover connectedness means an agent affects other agents more than it is affected by other agents as a net transmitter. In contrast, negative net total directional technology spillover connectedness suggests a net receiver. As can be seen from Table 4, other domestic enterprises act as the largest transmitter of the total directional technology spillover connectedness, reaching 20.454%. This is much higher than other agents, revealing that other domestic enterprises are in a dominant position in the technology spillover connectedness. Followed by central enterprises, universities and scientific research institutes, individuals, and other organizations, which are net transmitters of technology spillover connectedness but far smaller than other domestic enterprises. In contrast, foreign-funded enterprises and troops have negative net total directional technology spillover connectedness, indicating that these agents are net receivers of technology spillover connectedness, in which foreign-funded enterprises are the largest receivers.

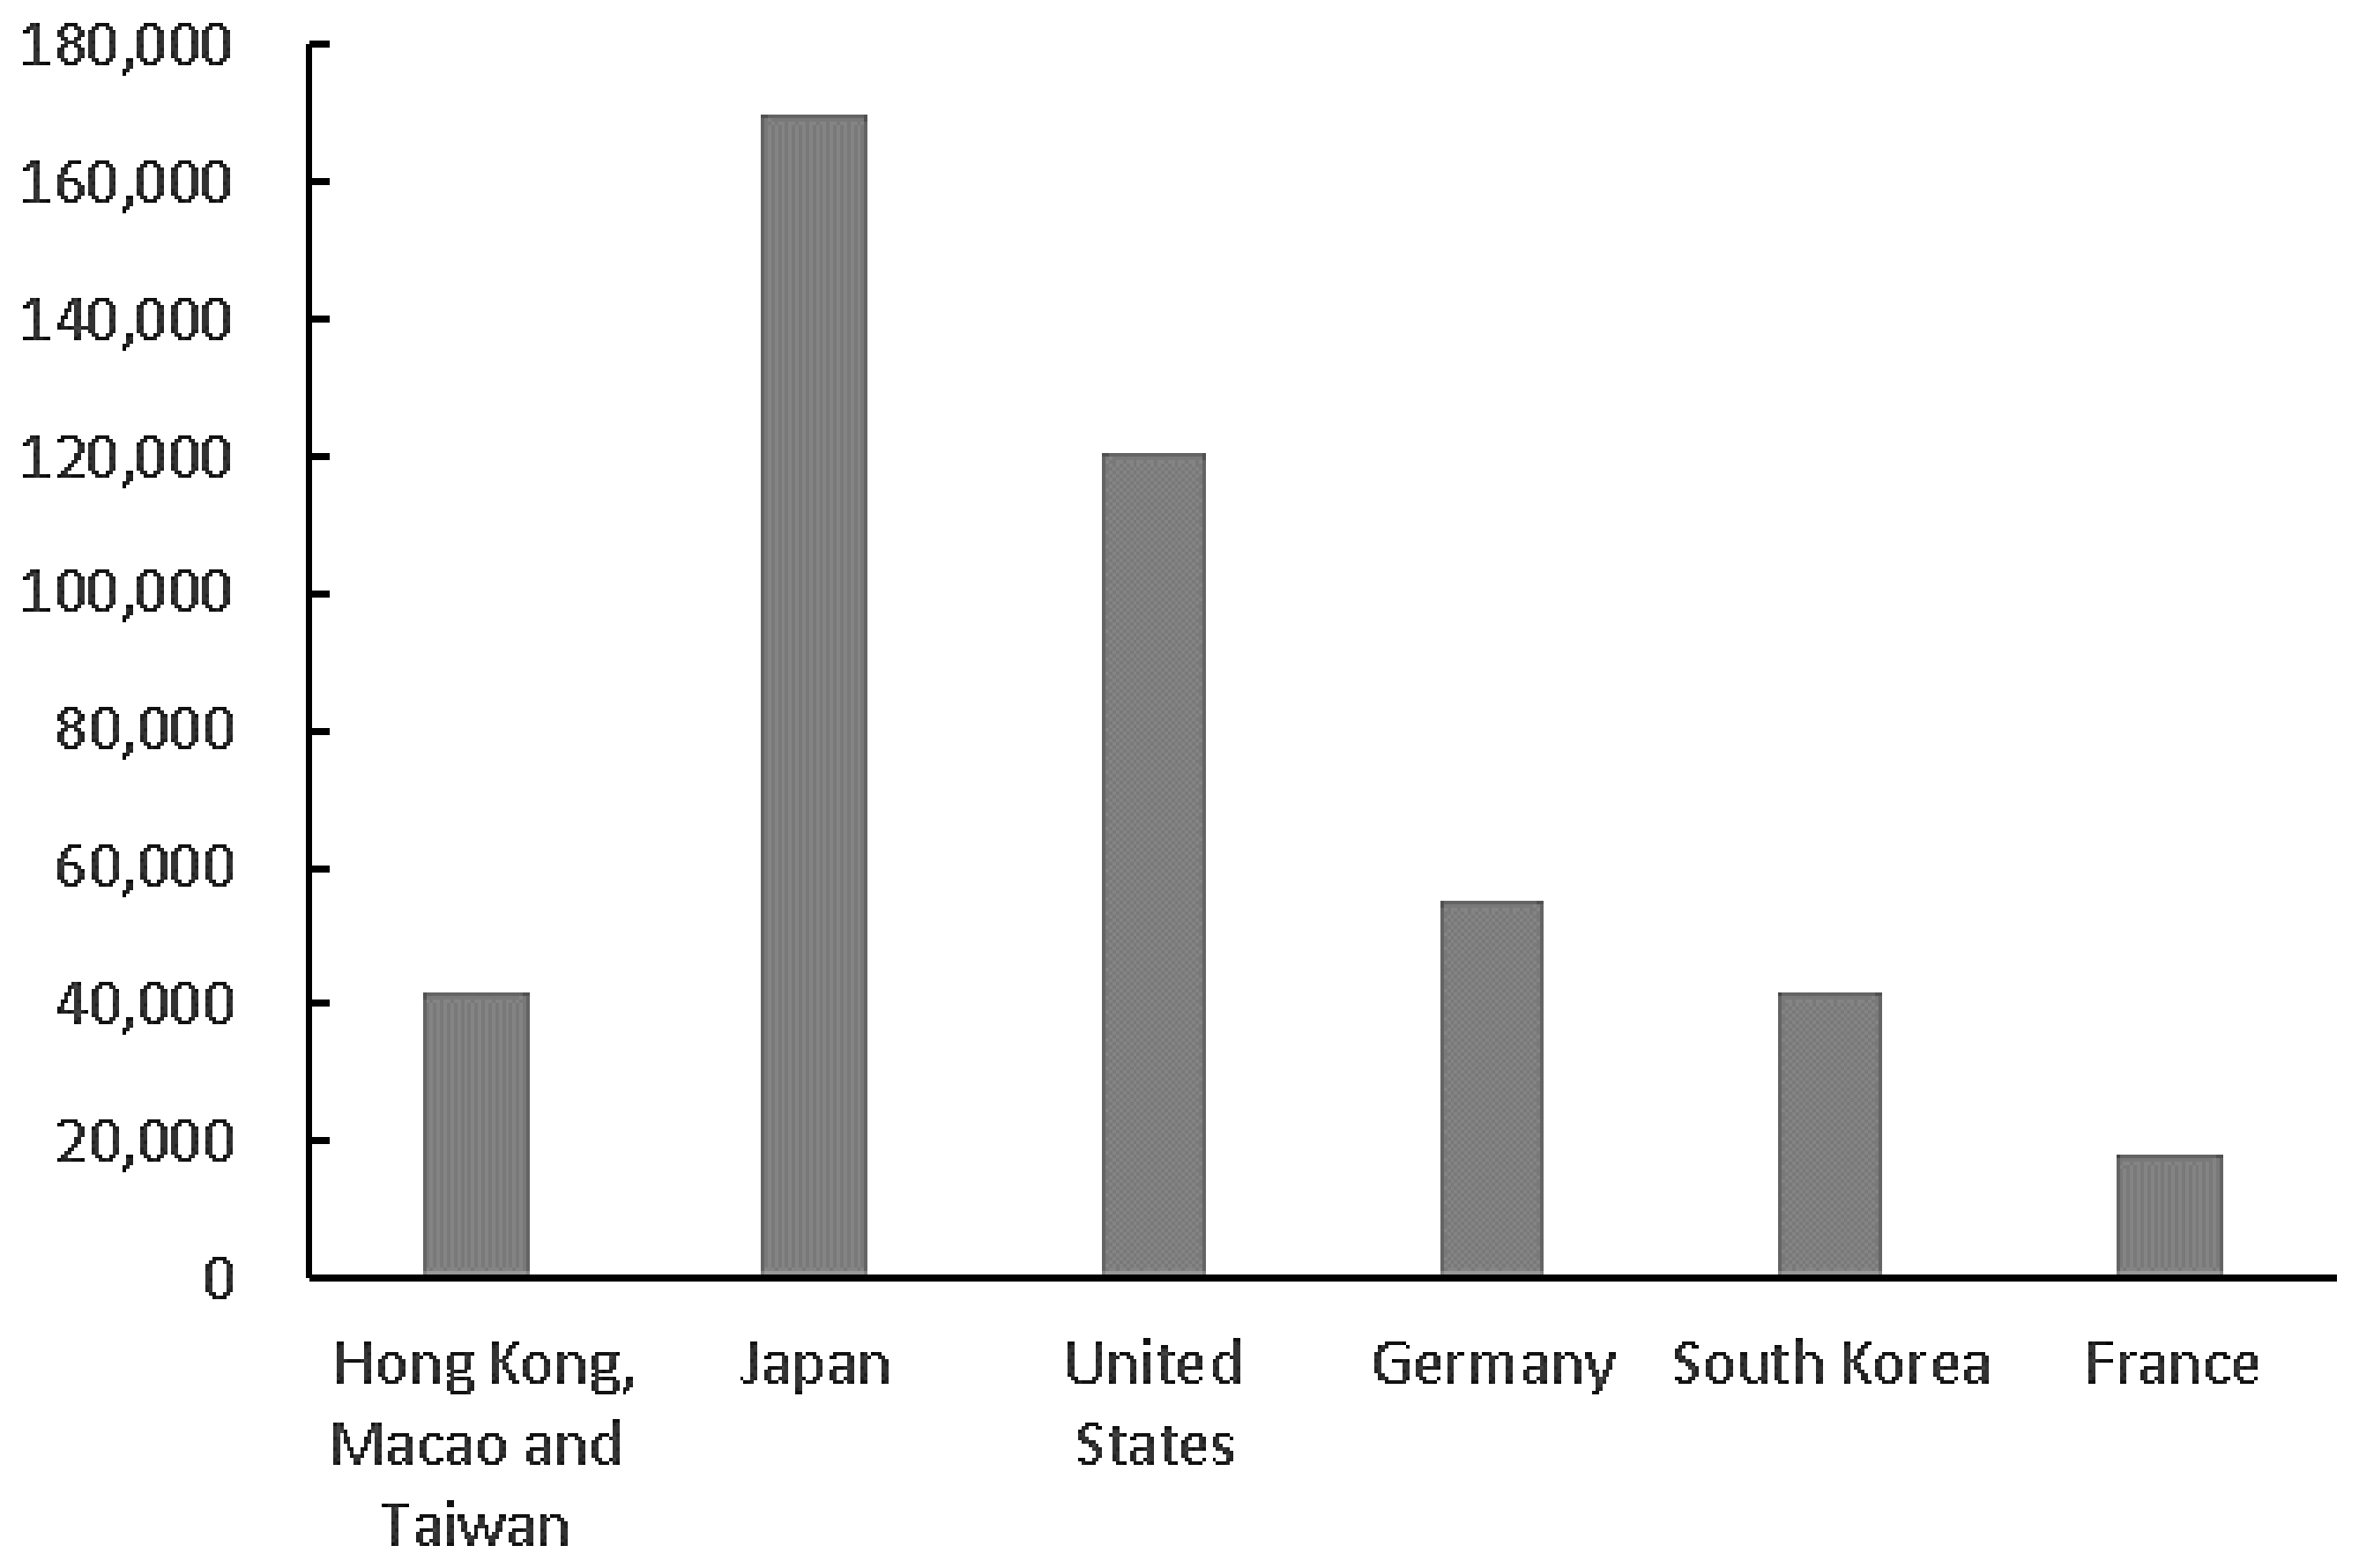
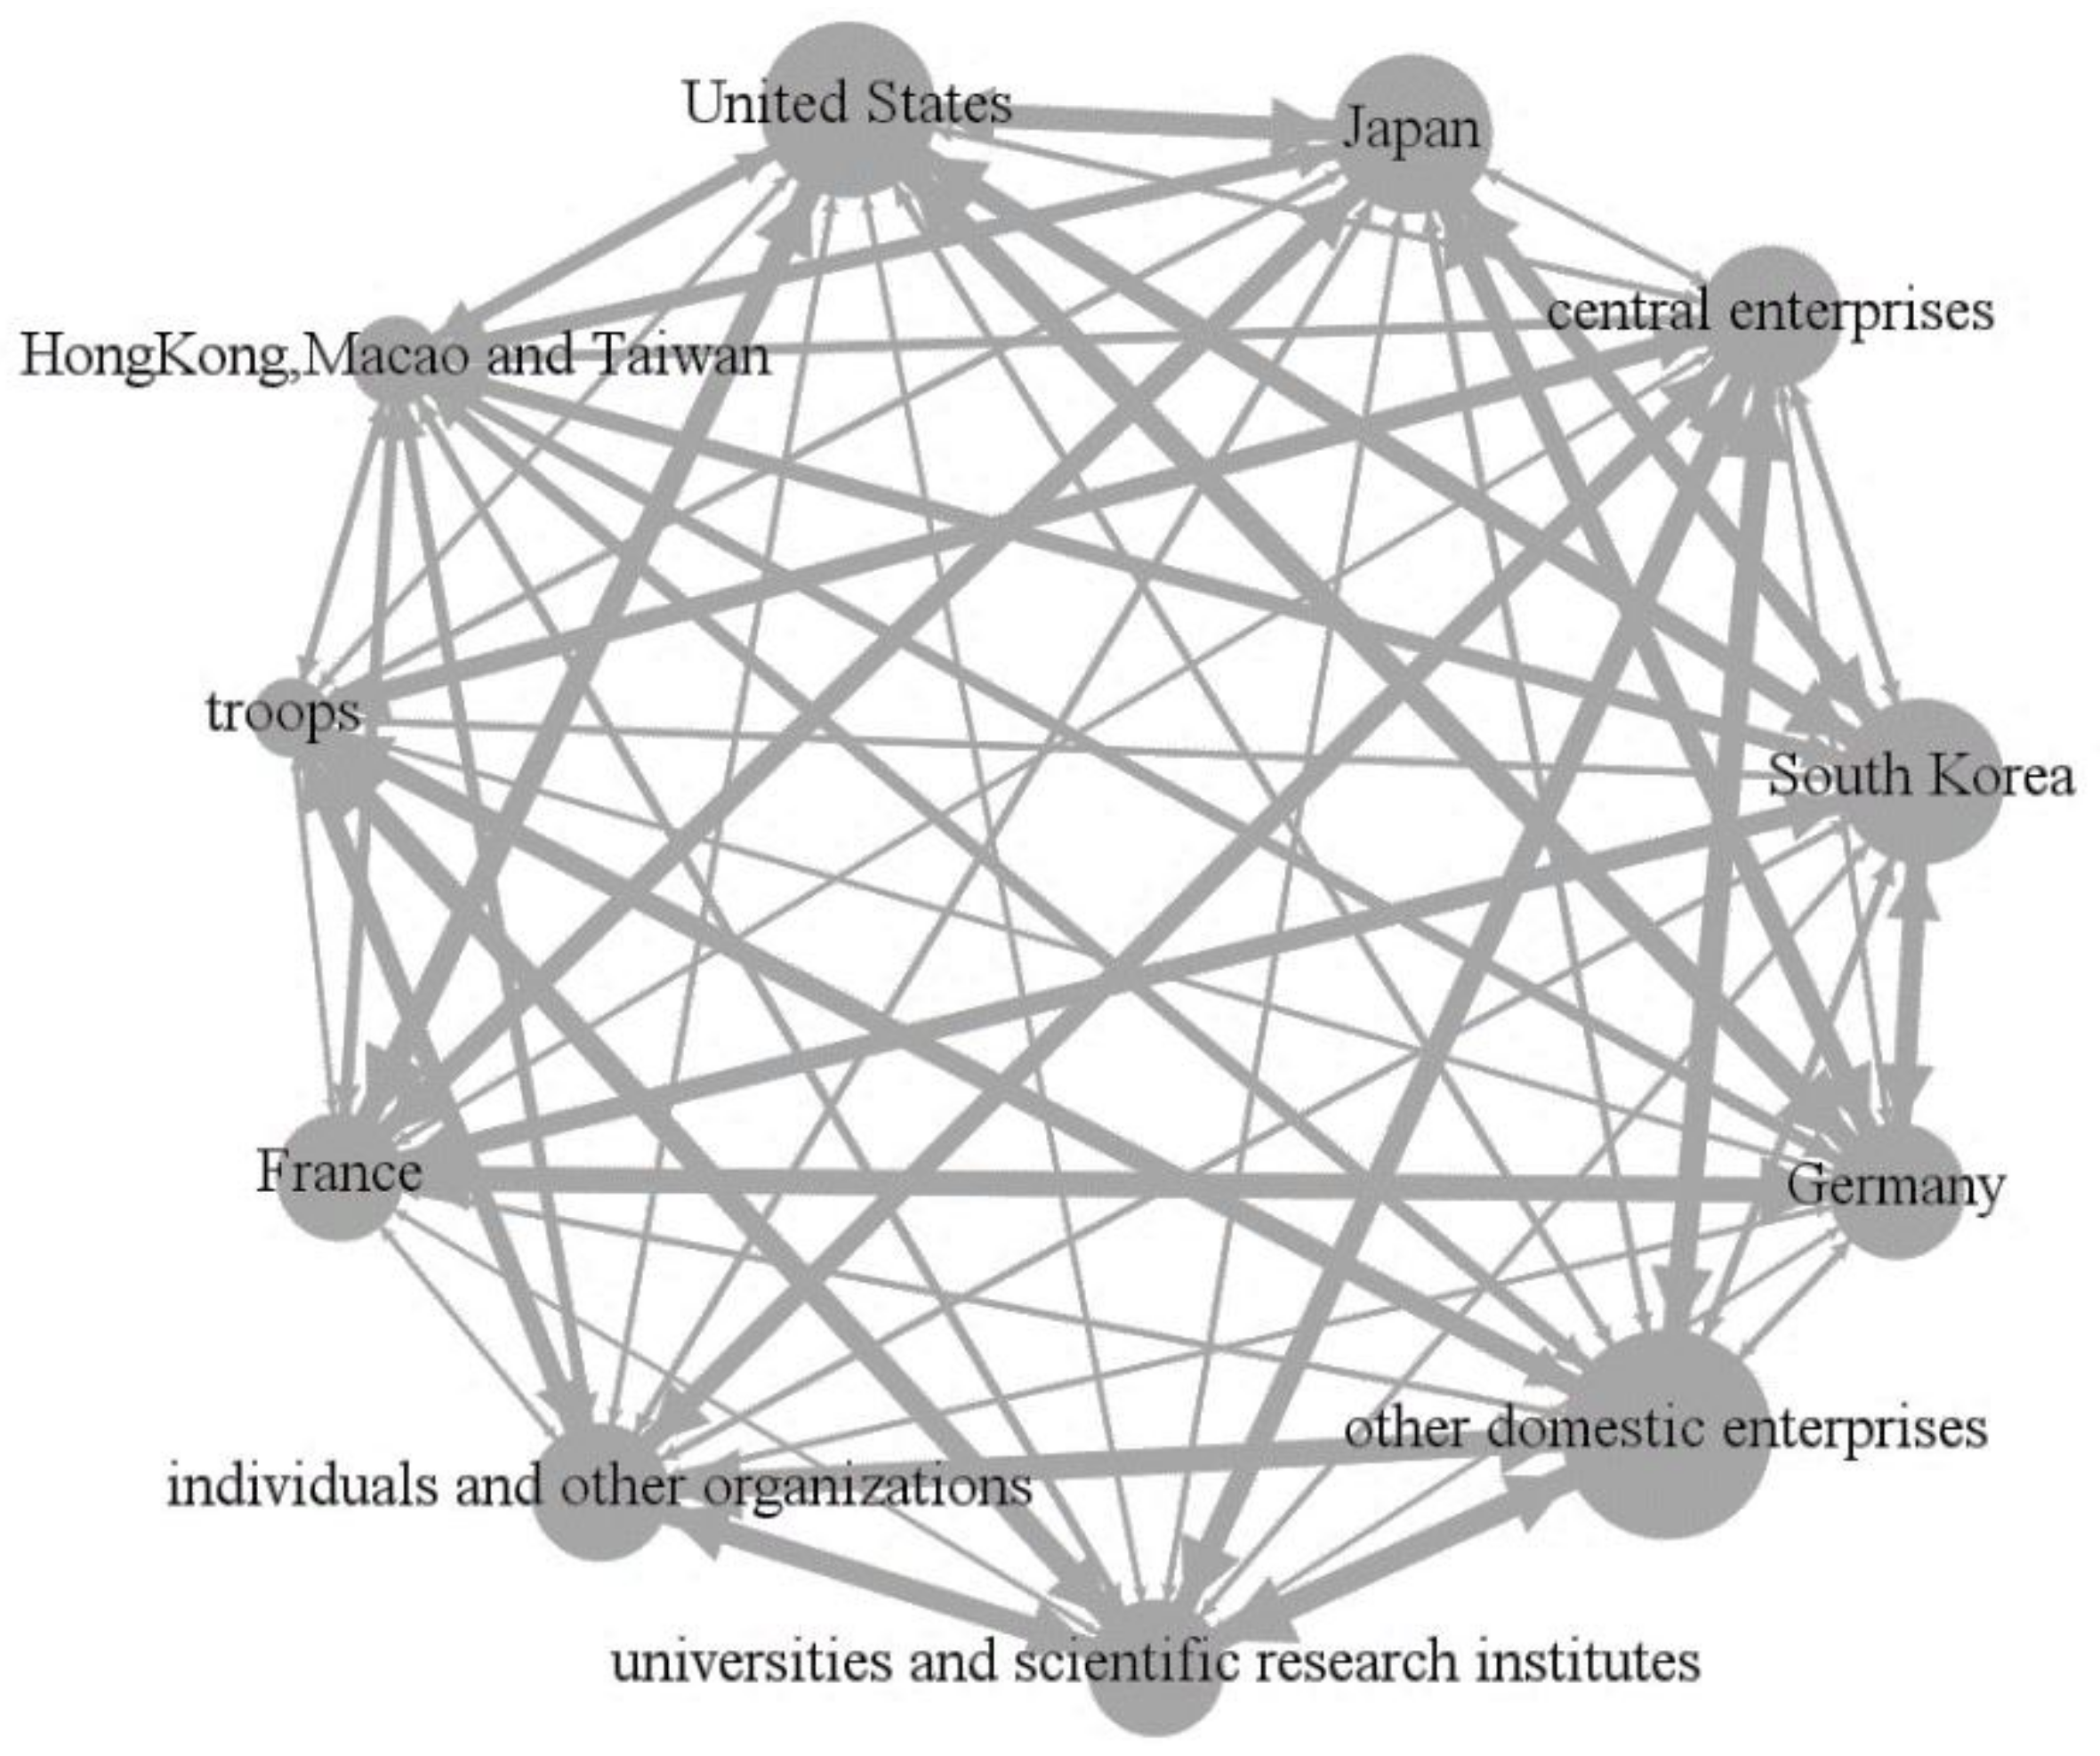
4.2. Analysis of Technology Spillover Connectedness among the Eleven Innovation Agents

In order to identify which countries or regions of foreign-funded enterprises play a major role in technology spillover connectedness, we further divide foreign-funded enterprises into Hong Kong, Macao and Taiwan, Japan, the United States, Germany, South Korea, and France according to their sources, which have the largest number of invention patents in the sample. Consequently, we have 11 innovation agents: central enterprises, other domestic enterprises, universities and scientific research institutes, troops, individuals and other organizations, Hong Kong, Macao and Taiwan, Japan, the United States, Germany, South Korea, and France.
Figure 3 illustrates the number of invention patents in Hong Kong, Macao, Taiwan, Japan, the United States, Germany, South Korea, and France in China from 2015 to 2019. Among these countries and regions, Japan has the largest number of invention patents, 169,815. Followed by the United States (120,330), Germany (54,910), South Korea (41,920), Hong Kong, Macao, and Taiwan (41,699), and France (17,941), respectively. Japan’s patents are 1.4 times that of the United States, 3.1 times that of Germany, 4.1 times that of South Korea, 4.1 times that of Hong Kong, Macao, and Taiwan, and 9.5 times that of France.
Table 5 shows the distribution of invention patents of national or regional innovation agents. Among them, the proportion of Hong Kong, Macao, and Taiwan enterprises decreased from 2.183% in 2015 to 1.559% in 2019. The proportion of Japanese enterprises decreased from 9.729% in 2015 to 6.430% in 2019. The proportion of American enterprises decreased from 5.915% in 2015 to 4.735% in 2019. The proportion of German enterprises decreased from 2.656% in 2015 to 2.063% in 2019. The proportion of French enterprises decreased from 0.928% in 2015 to 0.668% in 2019. On the contrary, the proportion of South Korean enterprises increased from 1.661% in 2015 to 2.041% in 2019. In other words, the proportion of invention patents in all countries and regions apart from South Korea has decreased. The total proportion of these six countries or regions decreased from 23.071% in 2015 to 17.497% in 2019.
Employing the technology spillover connectedness index and connectedness matrix, we analyze technology spillover connectedness among eleven innovation agents. Specifically, we calculate the technology spillover connectedness matrix of the eleven innovation agents (Table 6).
As can be seen from the total directional technology spillover connectedness to others (the “TO” row in Table 6), after subdividing foreign-funded enterprises, the United States has the largest technology spillover connectedness to other agents among all foreign-funded enterprises, reaching 88.114%. Followed by South Korea and Japan, the technology spillover connectedness to other agents reaches 85.227% and 83.535%, respectively, which are more than 80%. The technology spillover connectedness of Germany and France to other agents are 77.088% and 74.842%, respectively, and the technology spillover connectedness of Hong Kong, Macao, and Taiwan to other agents are 64.194%, which are all higher than 60%. These results show that the enterprises of the United States, South Korea, and Japan are the center of technology spillover connectedness among all foreign-funded enterprises, mainly because these three countries are also important sources of China’s foreign direct investment.
As can be seen from the total directional technology spillover connectedness from others (the “FROM” column in Table 6), Germany is the agent most affected by technology spillover connectedness from other agents, reaching 81.768%, followed by the United States, South Korea, and Japan.
The total technology spillover connectedness among the eleven innovation agents is 78.674%, which is consistent with the above results of the six agents. It suggests that in addition to the innovation agents’ factors, more than half of the weight is contributed by other agents, and there is a significant technology spillover connectedness among the eleven innovation agents.
On this basis, the network diagram of technology spillover connectedness is drawn. As shown in Figure 4, among the source countries and regions of foreign-funded enterprises, the United States, South Korea, and Japan have the largest nodes and are the center of technology spillover connectedness.

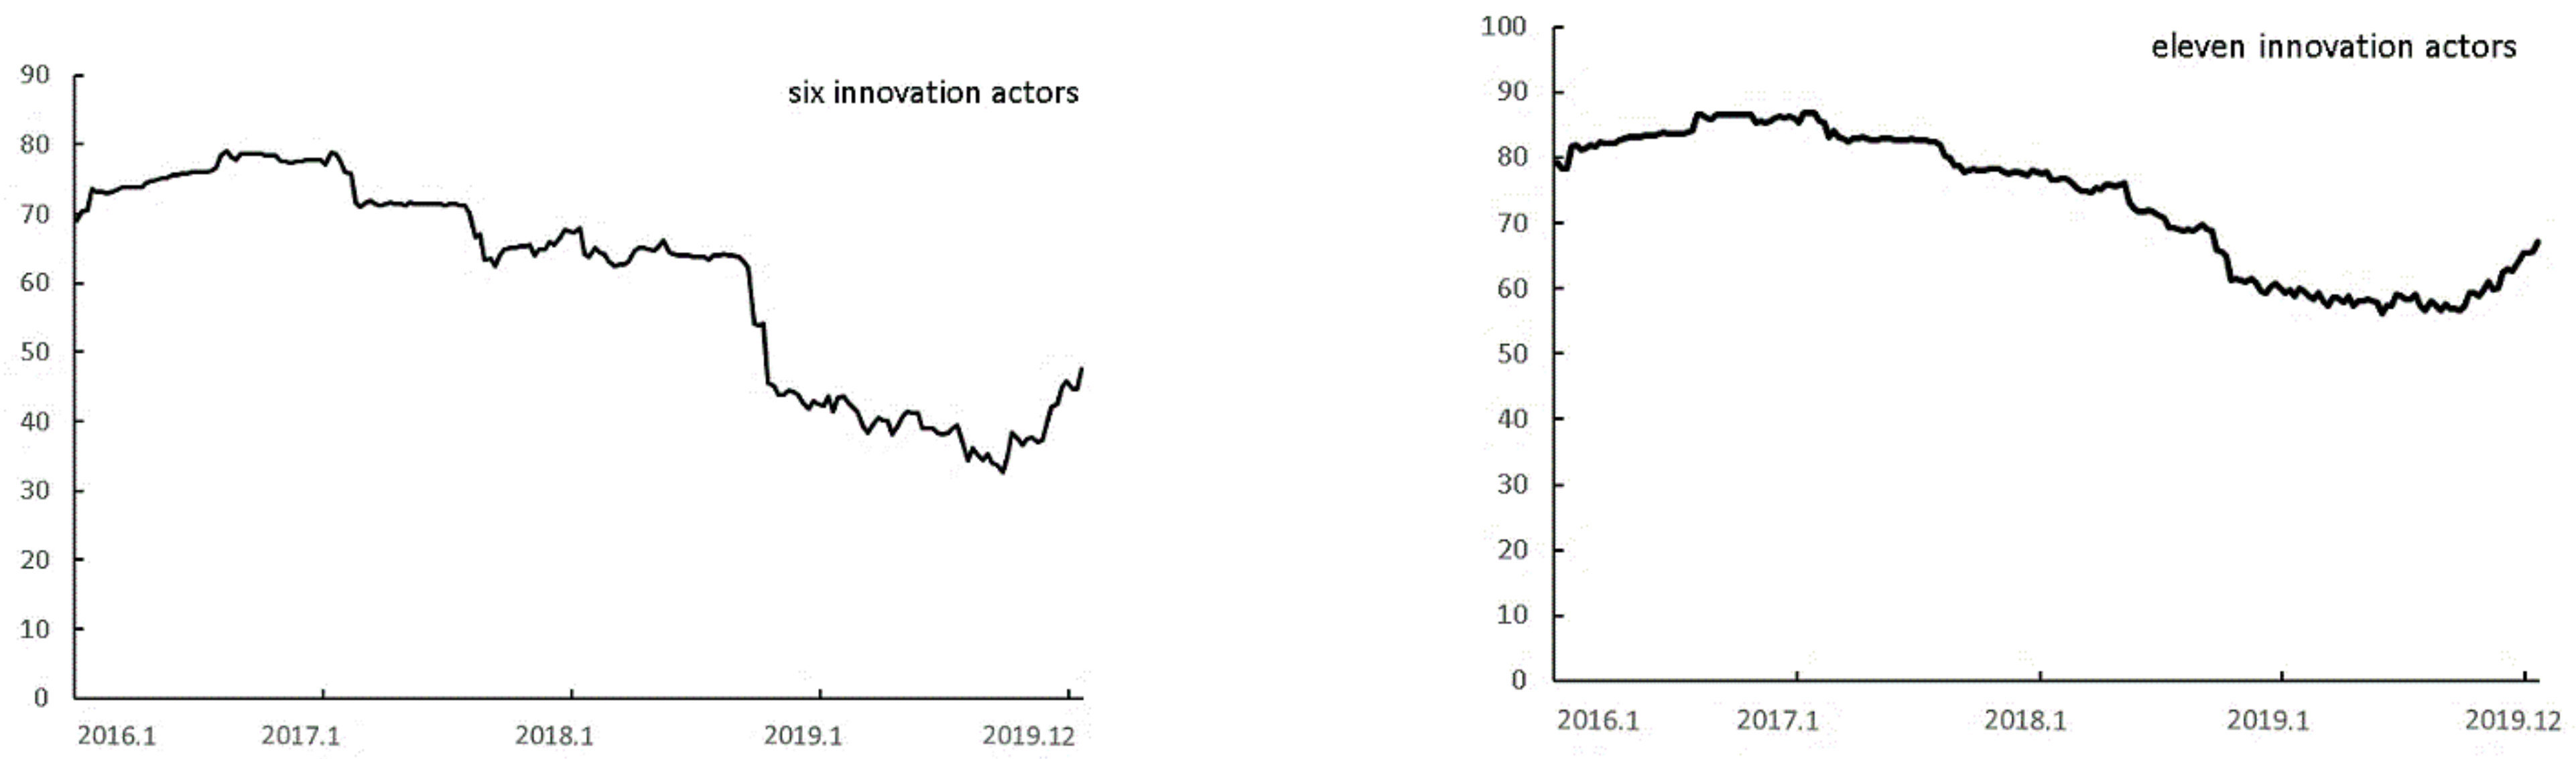
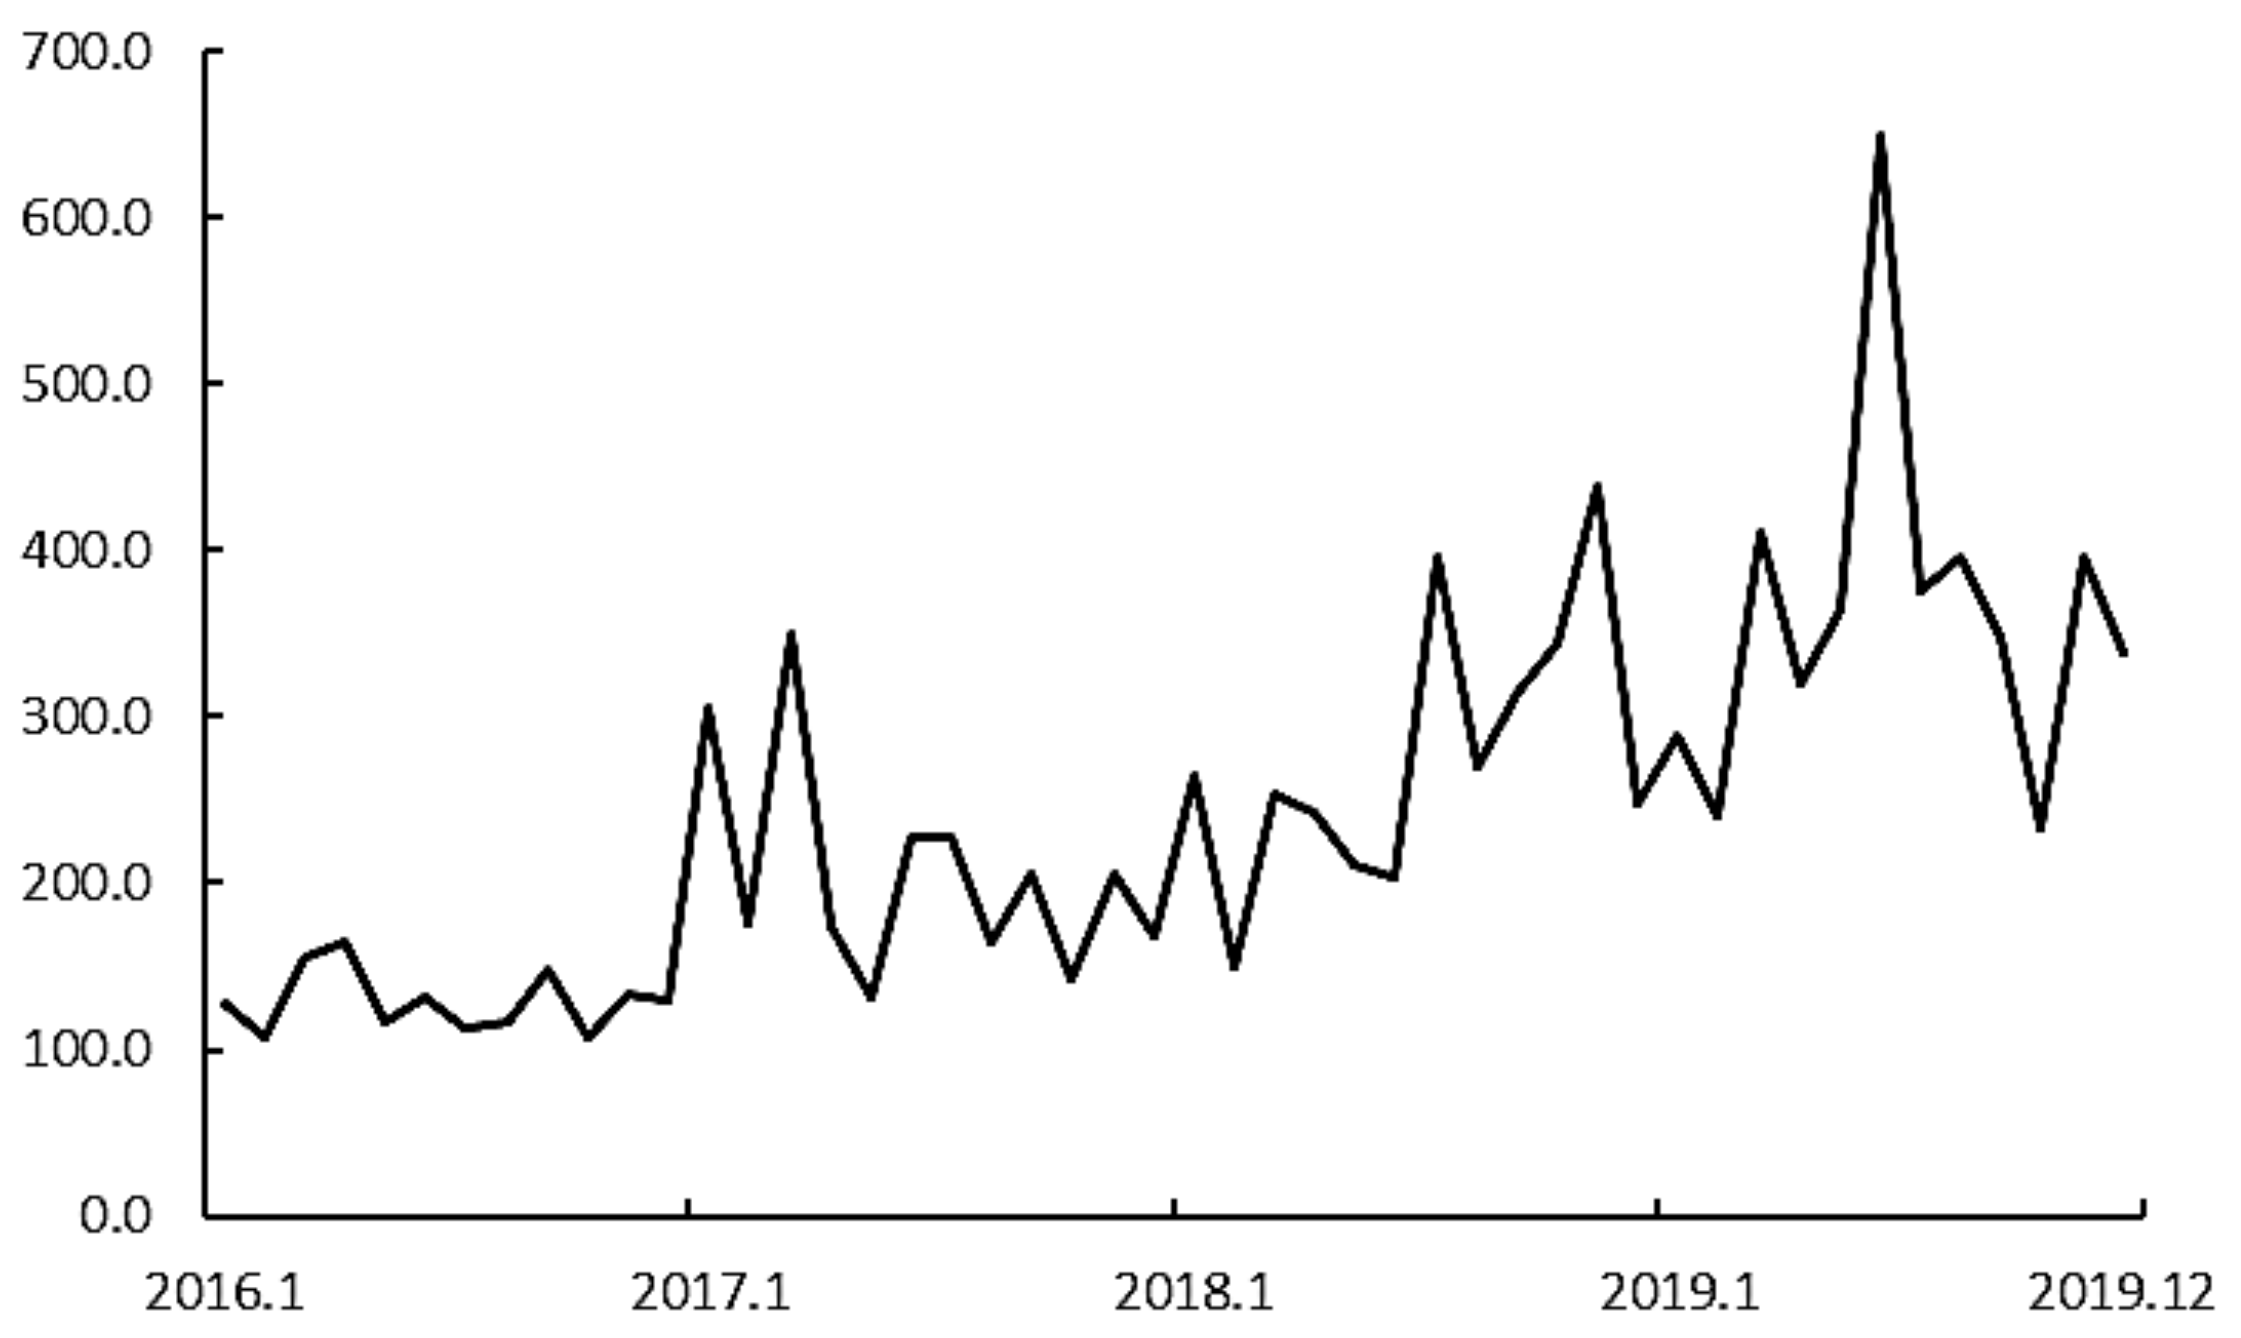
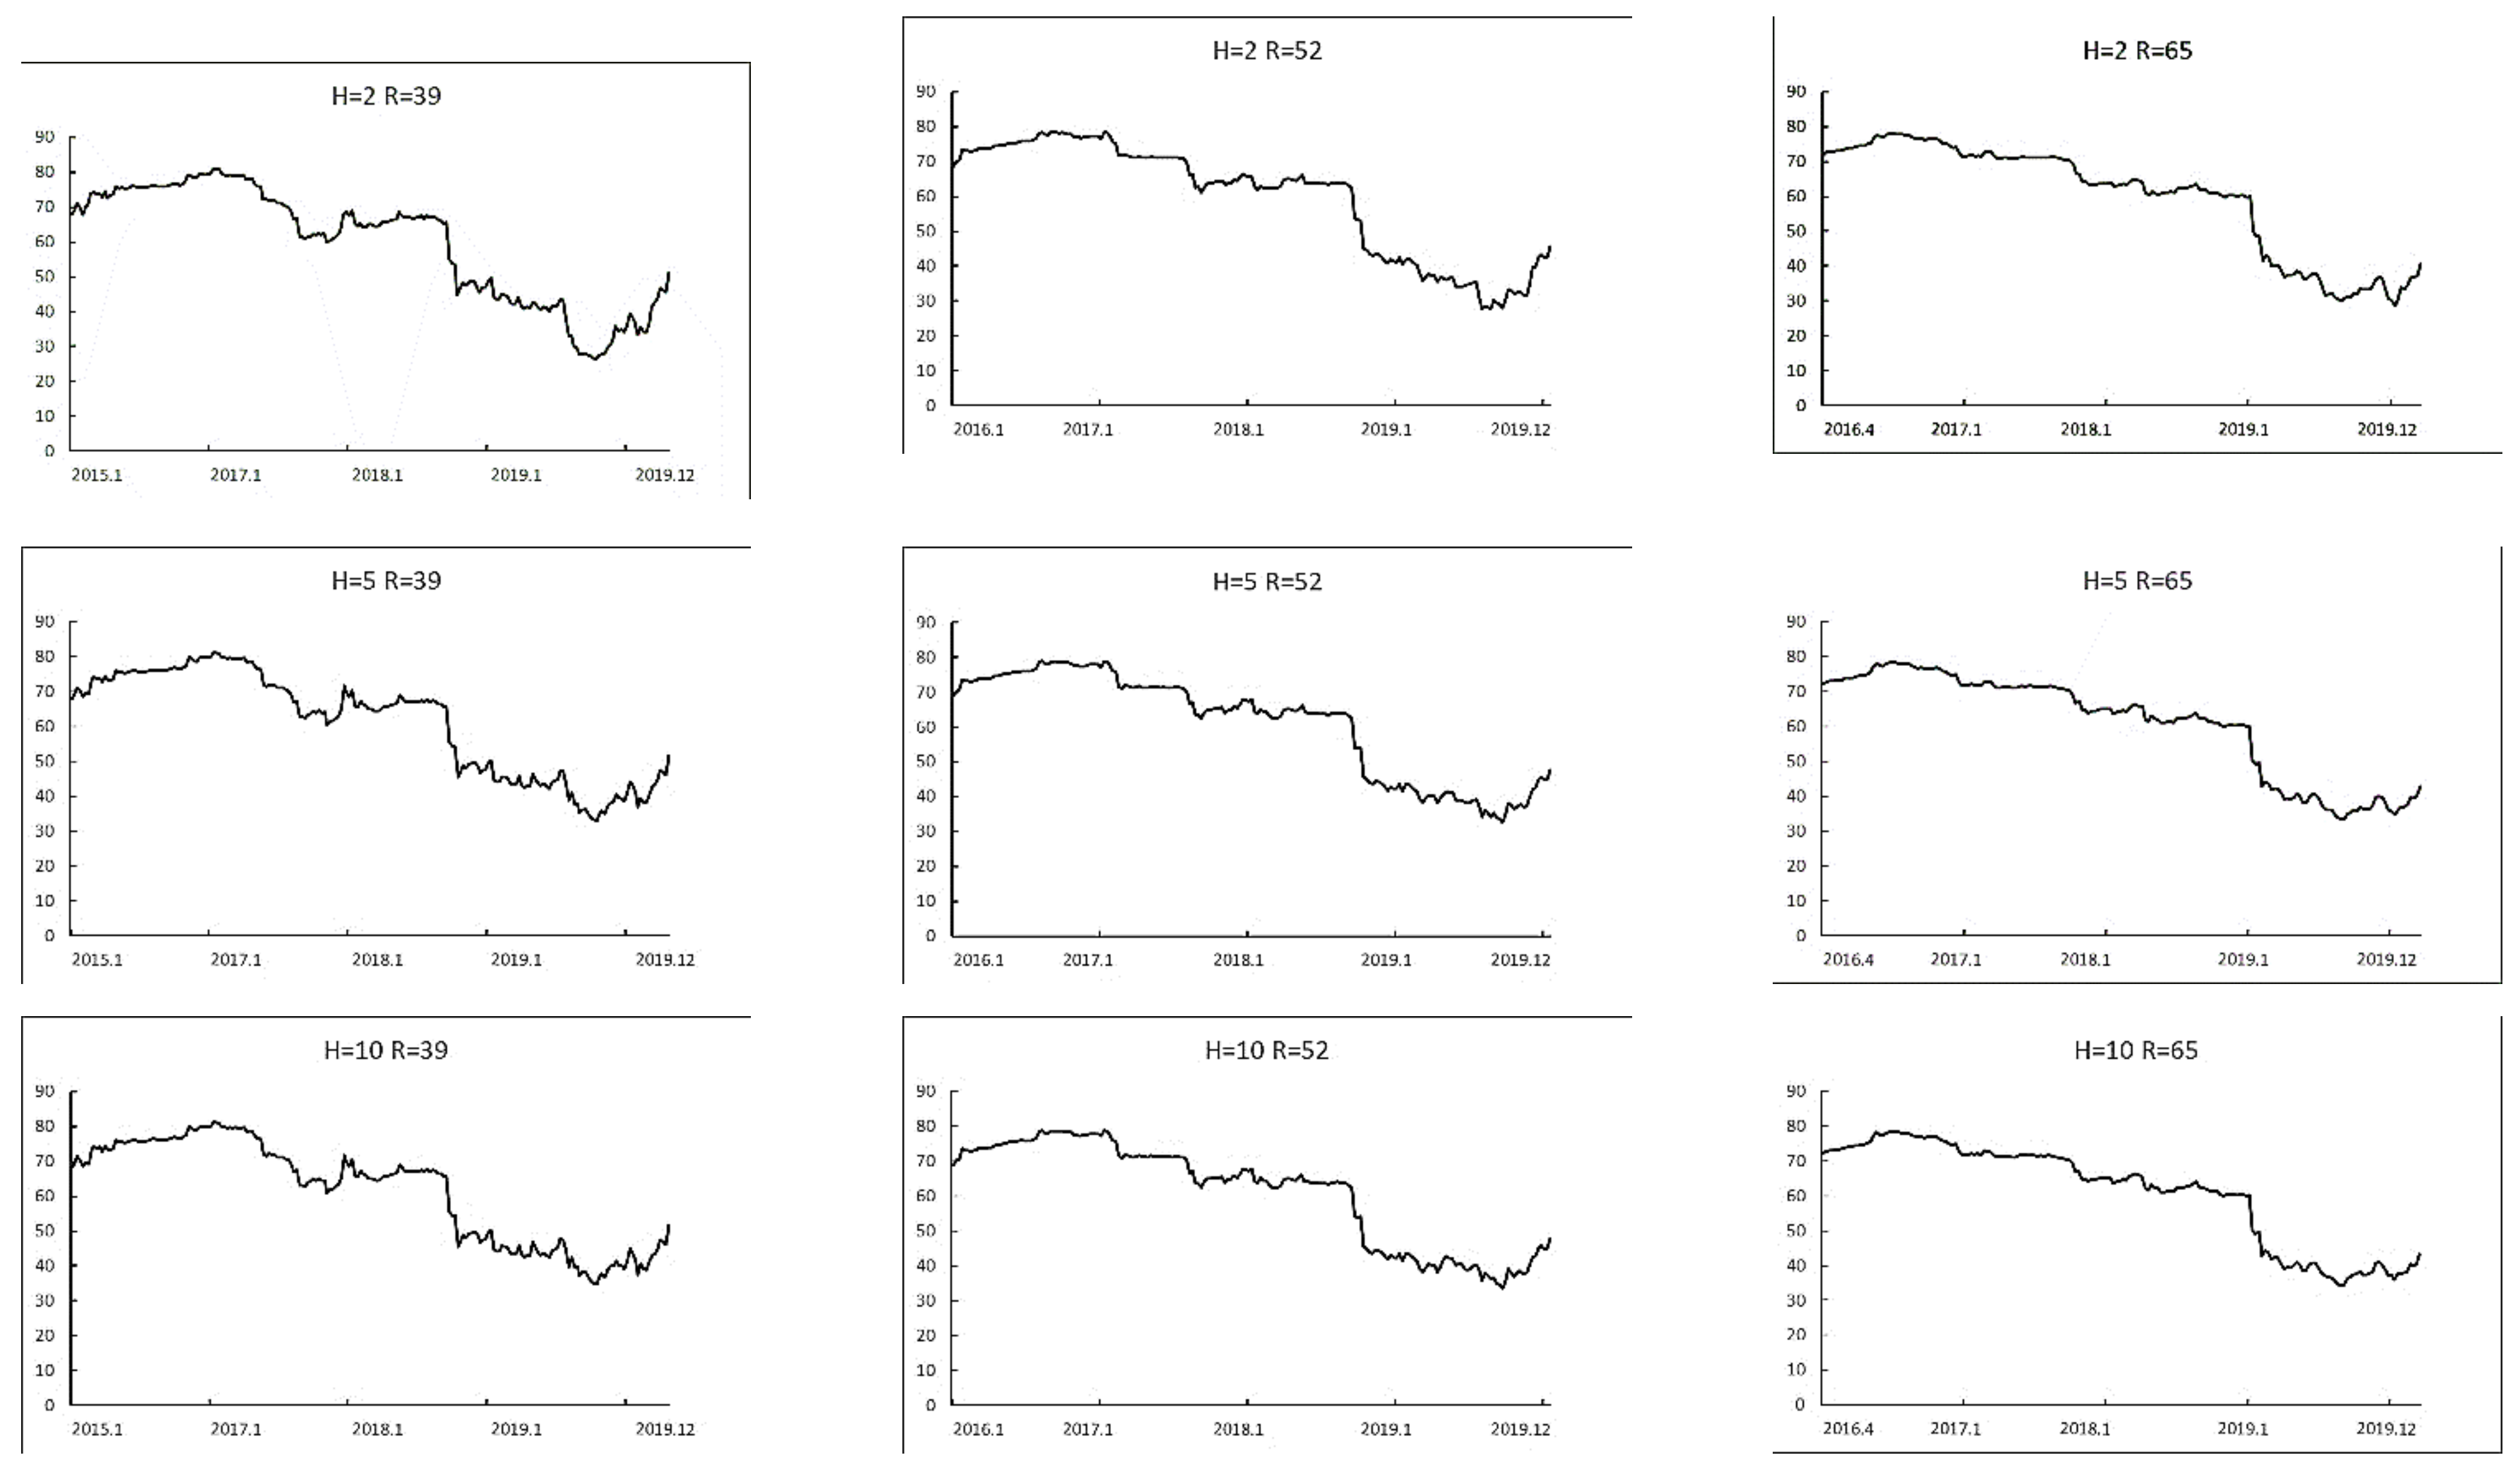
5. Dynamic Analysis of the Technology Spillover Connectedness among the Innovation Agents

Based on the above static analysis, we use the rolling estimation windows to examine the dynamic evolution of the total technology spillover connectedness among the innovation agents. According to Equation (10), we can obtain these innovation agents’ total technology spillover connectedness. As shown in Figure 5, no matter six or eleven innovation agents, the total technology spillover connectedness index showed a slight downward trend from 2016 to 2018, followed by a dramatic decline. Then, the total technology spillover connectedness index rebounded by the end of 2019. However, in general, the technology spillover connectedness among innovation agents has declined during the sample period.
This downward trend is closely related to the complex and changeable international economic situation and the uncertainty of China’s economic policy in recent years. Professor Davis of the University of Chicago and others use the text analysis method to mine the People’s Daily and Guangming Daily texts. By searching keywords, they have screened out articles related to economic policy uncertainty. After statistical and standardized processing, they compile the Economic Policy Uncertainty Index (EPU), published monthly since October 1949. In order to be consistent with the above dynamic analysis of technology spillover connectedness of innovation agents, we cite their data from 2016 to 2019.
Figure 6 shows China’s Economic Policy Uncertainty Index (EPU) has maintained a high level and showed an upward trend. Existing literature has found that economic policy uncertainty negatively affects a country’s innovation. For example, Bhattacharya et al. [57] find that policy uncertainty has an adverse impact on the quantity, quality, and originality of a country’s innovation, reducing the innovation incentive and R & D expenditure of innovation agents thereby significantly inhibiting innovation. The reduction of innovation willingness and expenditure will undoubtedly lead to the decline of technology spillover connectedness among innovation agents.
We also discuss the robustness of the results to the model’s choice of parameters. In addition to the analysis with the predictive horizon of 5 weeks and the rolling estimation window width of 52 weeks in Figure 5, we also consider the scenarios with the predictive horizon of 2 and 10 weeks, the rolling estimation window width of 39 and 65 weeks, respectively. Figure 7 shows the dynamic evolution of total technology spillover connectedness among the six innovation agents. (We also test the robustness of the eleven innovation agents, and the results are basically the same).
As shown in Figure 7, no matter which predictive horizon and rolling estimation window width are chosen, the dynamic behavior of the total technology spillover connectedness measures is basically the same, consistent with the previous dynamic analysis. Therefore, our results are robust to the choice of the alternative predictive horizon and rolling estimation window width.

6. Conclusions and Discussion

Employing the framework of variance decomposition of VAR forecast errors to construct the technology spillover connectedness index and connectedness matrix, this paper studies the technology spillover connectedness network among innovation agents in China. Furthermore, this paper attempts to contribute to the existing literature by systematically conducting static and dynamic research on the direction, intensity, and scale of technology spillover connectedness among innovation agents from the perspective of network topology and identifying the hub of technology spillover connectedness.
We get the total technology spillover connectedness among the six innovation agents is 68.1%, indicating that in addition to the factors of the innovation agents themselves, more than half of the weight is contributed by the other innovation agents, suggesting relatively high technology spillover connectedness among innovation agents. However, there is still much room for improvement. Other domestic enterprises in China are the largest hub of technology spillover connectedness, followed by universities and scientific research institutes, central enterprises, individuals and other organizations, and troops. Whereas the technology spillover connectedness of foreign-funded enterprises is fairly small no matter to or from others, suggesting that foreign-funded enterprises play a rather limited role in promoting technology spillover and innovation in China’s market. The study of further subdividing foreign-funded enterprises according to their sources finds that the United States, South Korea, and Japan are the centers of technology spillover connectedness in China.
The dynamic evolution of technology spillover connectedness shows that the total technology spillover connectedness among innovation agents presents an obvious downward trend, which is closely related to the complex and changeable international economic situation and the uncertainty of China’s economic policy in recent years.
According to our findings that other domestic enterprises in China are the center of technology spillover connectedness, it should continue to strengthen domestic enterprises’ position as main innovation agents, support enterprises to increase R&D investment, implement preferential tax policies for enterprises’ basic research investment, and promote the agglomeration of various innovation elements to enterprises. Meanwhile, the government should support enterprises to take the lead in establishing innovation consortia and undertaking major national science and technology projects.
It is noteworthy that, compared with other domestic enterprises, which should have been an important pillar and backbone of the national economy, China’s central enterprises play a limited role in technology spillover connectedness. From this point of view, in order to give full play to central enterprises’ technology spillover connectedness, it is important to deepen the reform of the innovation mechanism of central enterprises, encourage central enterprises to increase R & D investment, improve the allocation efficiency of their innovation resources, and stimulate the vitality of innovation elements.
In order to enhance the technology spillover connectedness of foreign-funded enterprises on China’s innovation agents, the government should strengthen the protection of intellectual property rights, encourage foreign-funded enterprises to increase R & D investment and apply for invention patents in China, and to strengthen scientific and technological innovation cooperation with China’s innovation agents.
In addition, the government should formulate and implement strategic scientific plans and scientific projects to promote the optimal allocation and resource sharing of scientific research forces in scientific research institutes, universities, and enterprises.
In general, the findings of this paper can be used to discuss how China uses the spillover connectedness among innovation agents to spur agents’ innovation performance and promote the nation’s economic growth and competitiveness. However, this paper still has some limitations, which are also our future research direction. First, this paper only studies the technology spillover connectedness between innovation agents at the micro level but omits the role and heterogeneity of cities. Therefore, the technology spillover connectedness based on the city level is a direction worth exploring in the future. In addition, given the data availability, this paper only uses the number of invention patents authorized to measure innovation output. In fact, the number of papers published is another indicator of innovation output. Therefore, using the number of scientific papers to study this problem will be another important direction worthy of in-depth research in the future.

Author Contributions

All authors contributed equally and significantly to this work. All authors have read and agreed to the published version of the manuscript.

Funding

This research was funded by the National Natural Science Foundation of China (71974076), Guangdong Natural Science Foundation of China (2019A1515011923), the Fundamental Research Funds for the Central Universities (19JNKY07), and the China Postdoctoral Science Foundation (2021M691253).

Institutional Review Board Statement

Not applicable.

Informed Consent Statement

Not applicable.

Data Availability Statement

The data used in the research were retrieved from the State Intellectual Property Office of China, https://www.cnipa.gov.cn/.

Conflicts of Interest

The authors declare no conflict of interest.

References

  1. Grossman, G.M.; Helpman, E. Endogenous innovation in the theory of growth. J. Econ. Perspect. 1994, 8, 23–44. [Google Scholar] [CrossRef] [Green Version]
  2. Hasan, I.; Tucci, C.L. The innovation–economic growth nexus: Global evidence. Res. Policy 2010, 39, 1264–1276. [Google Scholar] [CrossRef] [Green Version]
  3. Yglesias, E. Porter vs. Porter: Modeling the technological competitiveness of nations. Scientometrics 2003, 57, 281–293. [Google Scholar] [CrossRef]
  4. Maskus, K.E. Encouraging International Technology Transfer; International Centre for Trade and Sustainable Development (ICTSD): Geneva, Switzerland, 2004. [Google Scholar]
  5. Griliches, Z. Issues in assessing the contribution of research and development to productivity growth. Bell J. Econ. 1979, 10, 92–116. [Google Scholar] [CrossRef]
  6. Sun, Y.; Liu, F. Measuring international trade-related technology spillover: A composite approach of network analysis and information theory. Scientometrics 2013, 94, 963–979. [Google Scholar] [CrossRef]
  7. Chuang, Y.C.; Hsu, P.F. FDI, trade, and spillover efficiency: Evidence from China’s manufacturing sector. Appl. Econ. 2004, 36, 1103–1115. [Google Scholar] [CrossRef]
  8. Liu, X.; Buck, T. Innovation performance and channels for international technology spillovers: Evidence from Chinese high-tech industries. Res. Policy 2007, 36, 355–366. [Google Scholar] [CrossRef]
  9. Grossman, G.M.; Helpman, E. Trade, knowledge spillovers, and growth. Eur. Econ. Rev. 1991, 35, 517–526. [Google Scholar] [CrossRef] [Green Version]
  10. Das, G.G. Trade-induced technology spillover and adoption: A quantitative general equilibrium application. J. Econ. Dev. 2002, 27, 21–44. [Google Scholar]
  11. Madsen, J.B. Technology spillover through trade and TFP convergence: 135 years of evidence for the OECD countries. J. Int. Econ. 2007, 72, 464–480. [Google Scholar] [CrossRef] [Green Version]
  12. Cheung, K.Y.; Lin, P. Spillover effects of FDI on innovation in China: Evidence from the provincial data. China Econ. Rev. 2004, 15, 25–44. [Google Scholar] [CrossRef] [Green Version]
  13. Liu, Z. Foreign direct investment and technology spillover: Evidence from China. J. Comp. Econ. 2002, 30, 579–602. [Google Scholar] [CrossRef]
  14. Du, J.; Li, H.; Wu, X. Empirical analysis on the negative technology spillover effect of foreign direct investment in China. Asian J. Technol. Innov. 2008, 16, 133–151. [Google Scholar] [CrossRef]
  15. Lu, Y.; Tao, Z.; Zhu, L. Identifying FDI spillovers. J. Int. Econ. 2017, 107, 75–90. [Google Scholar] [CrossRef]
  16. Jaffe, A.B.; Trajtenberg, M.; Henderson, R. Geographic localization of knowledge spillovers as evidenced by patent citations. Q. J. Econ. 1993, 108, 577–598. [Google Scholar] [CrossRef]
  17. Criscuolo, P.; Narula, R.; Verspagen, B. Role of home and host country innovation systems in R&D internationalisation: A patent citation analysis. Econ. Innov. New Technol. 2005, 14, 417–433. [Google Scholar]
  18. Thompson, P.; Fox-Kean, M. Patent citations and the geography of knowledge spillovers: A reassessment. Am. Econ. Rev. 2005, 95, 450–460. [Google Scholar] [CrossRef] [Green Version]
  19. Chen, Z.; Guan, J. The impact of small world on innovation: An empirical study of 16 countries. J. Informetr. 2010, 4, 97–106. [Google Scholar] [CrossRef]
  20. Guan, J.; Chen, Z. Patent collaboration and international knowledge flow. Inf. Processing Manag. 2012, 48, 170–181. [Google Scholar] [CrossRef]
  21. Seibert, S.E.; Kacmar, K.M.; Kraimer, M.L.; Downes, P.E.; Noble, D. The role of research strategies and professional networks in management scholars’ productivity. J. Manag. 2017, 43, 1103–1130. [Google Scholar] [CrossRef]
  22. Yaşar, M.; Paul, C.J.M. Firm performance and knowledge spillovers from academic, industrial and foreign linkages: The case of China. J. Product. Anal. 2012, 38, 237–253. [Google Scholar] [CrossRef]
  23. Chen, S.H.; Lin, W.T. The dynamic role of universities in developing an emerging sector: A case study of the biotechnology sector. Technol. Forecast. Soc. Chang. 2017, 123, 283–297. [Google Scholar] [CrossRef]
  24. Rubin, T.H.; Aas, T.H.; Stead, A. Knowledge flow in technological business incubators: Evidence from Australia and Israel. Technovation 2015, 41, 11–24. [Google Scholar] [CrossRef]
  25. Chen, H.; Song, X.; Jin, Q.; Wang, X. Network dynamics in university-industry collaboration: A collaboration-knowledge dual-layer network perspective. Scientometrics 2022, 1–24. [Google Scholar] [CrossRef]
  26. Cao, X.; Li, C. Evolutionary game simulation of knowledge transfer in industry-university-research cooperative innovation network under different network scales. Sci. Rep. 2020, 10, 1–13. [Google Scholar] [CrossRef] [Green Version]
  27. Mao, C.; Yu, X.; Zhou, Q.; Harms, R.; Fang, G. Knowledge growth in university-industry innovation networks–Results from a simulation study. Technol. Forecast. Soc. Chang. 2020, 151, 119746. [Google Scholar] [CrossRef]
  28. Yu, S.; Yuizono, T. A Proximity Approach to Understanding University-Industry Collaborations for Innovation in Non-Local Context: Exploring the Catch-Up Role of Regional Absorptive Capacity. Sustainability 2021, 13, 3539. [Google Scholar] [CrossRef]
  29. Wu, Y.; Gu, X.; Tu, Z.; Zhang, Z. System dynamic analysis on industry-university-research institute synergetic innovation process based on knowledge flow. Scientometrics 2022, 127, 1317–1338. [Google Scholar] [CrossRef]
  30. Qiu, S.; Liu, X.; Gao, T. Do emerging countries prefer local knowledge or distant knowledge? Spillover effect of university collaborations on local firms. Res. Policy 2017, 46, 1299–1311. [Google Scholar] [CrossRef]
  31. Markusen, J.R.; Venables, A.J. Foreign direct investment as a catalyst for industrial development. Eur. Econ. Rev. 1999, 43, 335–356. [Google Scholar] [CrossRef] [Green Version]
  32. Lou, J.; Wang, S. Public Finance in China: Reform and Growth for A Harmonious Society; World Bank Publications: Washington, DC, USA, 2008. [Google Scholar]
  33. Motohashi, K.; Yuan, Y. Productivity impact of technology spillover from multinationals to local firms: Comparing China’s automobile and electronics industries. Res. Policy 2010, 39, 790–798. [Google Scholar] [CrossRef]
  34. Del Giudice, M.; Scuotto, V.; Garcia-Perez, A.; Petruzzelli, A.M. Shifting Wealth II in Chinese economy. The effect of the horizontal technology spillover for SMEs for international growth. Technol. Forecast. Soc. Chang. 2019, 145, 307–316. [Google Scholar] [CrossRef]
  35. Bin, G. Technological development, technology spillover and profitability: An industry level empirical analysis of Chinese manufacturing industries. Technol. Anal. Strateg. Manag. 2005, 17, 279–292. [Google Scholar] [CrossRef]
  36. Lasagni, A. How can external relationships enhance innovation in SMEs? New evidence for Europe. J. Small Bus. Manag. 2012, 50, 310–339. [Google Scholar] [CrossRef]
  37. Zeng, S.X.; Xie, X.M.; Tam, C.M. Relationship between cooperation networks and innovation performance of SMEs. Technovation 2010, 30, 181–194. [Google Scholar] [CrossRef]
  38. Gui, Q.; Liu, C.; Du, D.B. The structure and dynamic of scientific collaboration network among countries along the Belt and Road. Sustainability 2019, 11, 5187. [Google Scholar] [CrossRef] [Green Version]
  39. Singh, J. Collaborative networks as determinants of knowledge diffusion patterns. Manag. Sci. 2005, 51, 756–770. [Google Scholar] [CrossRef] [Green Version]
  40. Wei, L.T.; Goang, Y.W.; Sheng, H.T.; Kuei, L.K.; Lo, T.-W.; Yang, W.-G.; Hung, T.-S.; Lai, K.-K. Technological spillovers of transferred inventors from the perspective of Social Network Analysis (SNA). Afr. J. Bus. Manag. 2011, 5, 8192–8203. [Google Scholar] [CrossRef]
  41. Zacchia, P. Knowledge spillovers through networks of scientists. Rev. Econ. Stud. 2020, 87, 1989–2018. [Google Scholar] [CrossRef] [Green Version]
  42. Tajpour, M.; Hosseini, E.; Mohammadi, M.; Bahman-Zangi, B. The Effect of Knowledge Management on the Sustainability of Technology-Driven Businesses in Emerging Markets: The Mediating Role of Social Media. Sustainability 2022, 14, 8602. [Google Scholar] [CrossRef]
  43. Han, Y.; Park, Y. Patent network analysis of inter-industrial knowledge flows: The case of Korea between traditional and emerging industries. World Pat. Inf. 2006, 28, 235–247. [Google Scholar] [CrossRef]
  44. Bergé, L.R.; Wanzenböck, I.; Scherngell, T. Centrality of regions in R&D networks: A new measurement approach using the concept of bridging paths. Reg. Stud. 2017, 51, 1165–1178. [Google Scholar]
  45. De Noni, I.; Orsi, L.; Belussi, F. The role of collaborative networks in supporting the innovation performances of lagging-behind European regions. Res. Policy 2018, 47, 1–13. [Google Scholar] [CrossRef]
  46. Fleming, L.; King, C., III; Juda, A., I. Small worlds and regional innovation. Organ. Sci. 2007, 18, 938–954. [Google Scholar] [CrossRef] [Green Version]
  47. Maggioni, M.A.; Uberti, T.E.; Usai, S. Treating patents as relational data: Knowledge transfers and spillovers across Italian provinces. Ind. Innov. 2011, 18, 39–67. [Google Scholar] [CrossRef]
  48. Xiang, X.-Y.; Cai, H.; Lam, S.; Pei, Y.-L. International knowledge spillover through co-inventors: An empirical study using Chinese assignees’ patent data. Technol. Forecast. Soc. Chang. 2013, 80, 161–174. [Google Scholar] [CrossRef]
  49. Shih, H.Y.; Chang, T.L.S. International diffusion of embodied and disembodied technology: A network analysis approach. Technol. Forecast. Soc. Chang. 2009, 76, 821–834. [Google Scholar] [CrossRef]
  50. Yang, W.; Yu, X.; Zhang, B.; Huang, Z. Mapping the landscape of international technology diffusion (1994–2017): Network analysis of transnational patents. J. Technol. Transf. 2021, 46, 138–171. [Google Scholar] [CrossRef]
  51. Wanzenboeck, I.; Scherngell, T.; Brenner, T. Embeddedness of regions in European knowledge networks: A comparative analysis of inter-regional R&D collaborations, co-patents and co-publications. Ann. Reg. Sci. 2014, 53, 337–368. [Google Scholar]
  52. Diebold, F.X.; Yilmaz, K. Better to Give than to Receive: Predictive Directional Measurement of Volatility Spillovers. Int. J. Forecast. 2012, 28, 57–66. [Google Scholar] [CrossRef] [Green Version]
  53. Diebold, F.X.; Yilmaz, K. On the network topology of variance decompositions: Measuring the connectedness of financial firms. J. Econom. 2014, 182, 119–134. [Google Scholar] [CrossRef] [Green Version]
  54. Xu, W.; Ma, F.; Chen, W.; Zhang, B. Asymmetric volatility spillovers between oil and stock markets: Evidence from China and the United States. Energy Econ. 2019, 80, 310–320. [Google Scholar] [CrossRef]
  55. Yoon, S.-M.; Al Mamun, M.; Uddin, G.S.; Kang, S.H. Network connectedness and net spillover between financial and commodity markets. North Am. J. Econ. Financ. 2019, 48, 801–818. [Google Scholar] [CrossRef]
  56. Bouri, E.; Cepni, O.; Gabauer, D.; Gupta, R. Return connectedness across asset classes around the COVID-19 outbreak. Int. Rev. Financ. Anal. 2021, 73, 101646. [Google Scholar] [CrossRef]
  57. Bhattacharya, U.; Hsu, P.H.; Tian, X.; Xu, Y. What affects innovation more: Policy or policy uncertainty? J. Financ. Quant. Anal. 2017, 52, 1869–1901. [Google Scholar] [CrossRef] [Green Version]
Figure 1. Number of invention patents of six innovation agents from 2015 to 2019.
Mathematics 10 02854 g001
Figure 2. Technology spillover connectedness network of six innovation agents.
Mathematics 10 02854 g002
Figure 3. Number of invention patents of major countries or regions from 2015 to 2019.
Mathematics 10 02854 g003
Figure 4. Technology spillover connectedness network of eleven innovation agents.
Mathematics 10 02854 g004
Figure 5. Rolling total technology spillover connectedness of the innovation agents. Note: The predictive horizon is 5 weeks, and the rolling estimation window width is 52 weeks.
Mathematics 10 02854 g005
Figure 6. China’s Economic Policy Uncertainty Index (EPU).
Mathematics 10 02854 g006
Figure 7. Robustness of the rolling total technology spillover connectedness of the innovation agents.
Mathematics 10 02854 g007
Table 1. Technology spillover connectedness matrix.
x 1 x 2 x N FROM
x 1 θ 11 G H θ 12 G H θ 1 N G H j = 1 j 1 N θ 1 j G H
x 2 θ 21 G H θ 22 G H θ 2 N G H j = 1 j 2 N θ 2 j G H
x N θ N 1 G H θ N 2 G H θ N N G H j = 1 j N N θ N j G H
TO i = 1 i 1 N θ i 1 G H i = 1 i 2 N θ i 2 G H i = 1 i N N θ i N G H 1 N i , j = 1 i j N θ i j G H
Table 2. Distribution of invention patents of six innovation agents (%).
Innovation Agents20152016201720182019
Central enterprises6.0106.9127.8477.7587.309
Other domestic enterprises38.02939.48840.56544.24943.631
Universities and scientific research institutes19.91818.69121.83420.94923.284
Troops0.3930.3640.4340.4100.446
Individuals and other organizations8.0117.4056.7416.2664.441
Foreign-funded enterprises27.64027.14022.57920.36820.889
Total100100100100100
Table 3. The technology spillover connectedness matrix of the six innovation agents.
Central EnterprisesOther Domestic EnterprisesUniversities and Scientific Research InstitutesTroopsIndividuals and Other OrganizationsForeign-Funded EnterprisesFROM
Central enterprises27.06121.96718.19813.02816.762.98772.939
Other domestic enterprises19.37226.14518.89213.04918.6643.87873.855
Universities and scientific research institutes18.3120.97324.76916.80117.1831.96475.231
Troops16.32118.13620.00427.10415.3893.04572.896
Individuals and other organizations16.63321.14818.14112.71528.293.07271.71
Foreign-funded enterprises7.93812.0855.5517.6848.71358.0341.97
TO78.57394.30980.78763.27676.70914.94668.1
Table 4. Net total directional technology spillover connectedness of six innovation agents.
OrderAgentsNETTOFROMGROSS
1Other domestic enterprises20.45494.30973.855168.164
2Central enterprises5.63478.57372.939151.512
3Universities and scientific research institutes5.55680.78775.231156.018
4Individuals and other organizations4.99976.70971.71148.419
5Troops−9.6263.27672.896136.172
6Foreign-funded enterprises−27.02414.94641.9756.916
Table 5. Distribution of invention patents of national or regional innovation agents (%).
Innovation Agents20152016201720182019
Hong Kong, Macao and Taiwan2.1832.1311.7941.5771.559
Japan9.7298.6476.9216.0936.430
The United States5.9156.0105.0994.8274.735
Germany2.6562.9402.4212.0472.063
South Korea1.6611.8021.7601.8962.041
France0.9280.9740.7650.6410.668
Total23.07122.50418.76017.08217.497
Table 6. The technology spillover connectedness matrix of the eleven innovation agents.
Central EnterprisesOther Domestic EnterprisesUniversities and Scientific Research InstitutesTroopsIndividuals and Other OrganizationsHong Kong, Macao and TaiwanThe United StatesJapanSouth KoreaGermanyFranceFROM
Central enterprises22.56518.3615.911.14914.6315.0782.6612.2073.9372.0751.43777.435
Other domestic enterprises15.61921.30115.83610.67615.6896.8782.9033.0264.2692.1171.68578.699
Universities and scientific research institutes16.48518.83222.22615.16415.4314.3311.4932.0372.2411.090.6777.774
Troops14.32515.76417.73423.92113.5844.2252.3112.3462.8441.5011.44676.079
Individuals and other organizations14.54518.3815.57810.94924.316.2842.0063.0232.3721.471.08275.69
Hong Kong, Macao and Taiwan5.0428.9834.2793.5997.38422.6799.84111.40411.4468.1827.16277.321
the United States2.7423.4981.5932.1132.2617.39218.56614.54315.11916.07216.10281.434
Japan2.2383.6571.962.1543.0218.77415.38919.6814.09514.54414.48880.32
South Korea3.6834.7942.2772.3442.3818.7415.61214.15219.0213.54213.45580.98
Germany2.3192.81.1941.5381.7646.64218.09315.50414.59818.23217.31581.768
France1.7192.3910.9941.5971.4635.8517.80515.29214.30616.49522.08777.913
TO78.71797.45877.34561.28377.60964.19488.11483.53585.22777.08874.84278.674
Publisher’s Note: MDPI stays neutral with regard to jurisdictional claims in published maps and institutional affiliations.

