Based on the descriptive statistics analysis of innovation agents’ invention patent data, this section will conduct static analysis by constructing the technology spillover connectedness index and connectedness matrix to measure the technology spillover connectedness path, direction, and degree among the six innovation agents. It will also identify the hub of technology spillover connectedness.
4.1. Analysis of Technology Spillover Connectedness among the Six Innovation Agents
Based on the above technology spillover connectedness index and connectedness matrix, we will use each innovation agent’s weekly invention patent data from January 2015 to December 2019 to analyze the technology spillover connectedness among the six innovation agents.
Given that the technology spillover connectedness index is built on the VAR model, we first take the natural logarithm of the data and use the Augmented Dickey-Fuller (ADF) method to test the stationarity of the invention data of the six innovation agents. The ADF statistics reject the null hypothesis of unit roots at the 1% level. Then, according to the Schwarz Criterion, the optimal lag order of 1 is selected for the VAR model, and the predictive horizon is 5 weeks. The technology spillover connectedness 0+matrix among six agents is calculated, as shown in
Table 3.
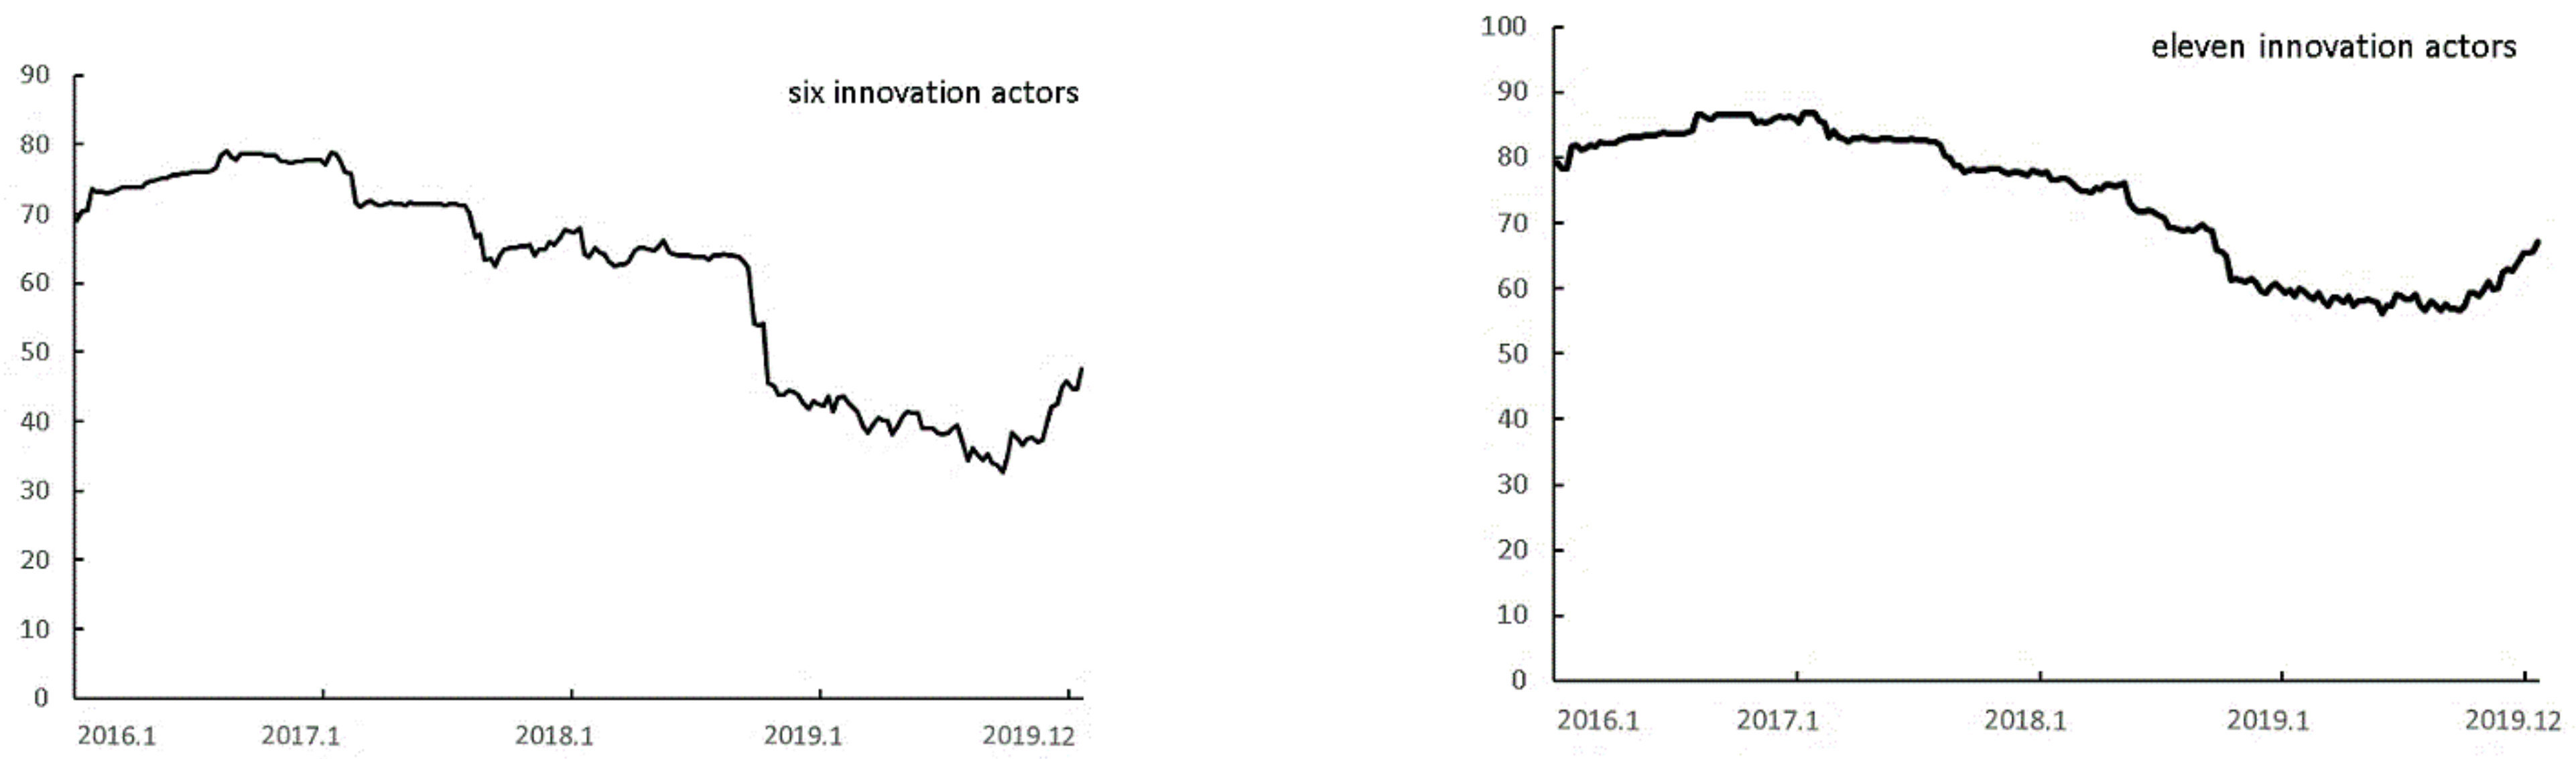
The total technology spillover connectedness among the six innovation agents is 68.1%, indicating that in addition to the factors of the innovation agents themselves, more than half of the weight is contributed by the other innovation agents, suggesting high technology spillover connectedness among innovation agents. This also confirms that the six innovation agents have formed a close technology spillover connectedness collaboration network.
Then we will discuss the pairwise directional technology spillover connectedness measures, which are the off-diagonal elements of the upper-left 6 × 6 submatrix. The highest observed pairwise connectedness is from other domestic enterprises to central enterprises (21.967%). In return, the pairwise connectedness from central enterprises to other domestic enterprises (19.372%) is also high. In addition, the pairwise connectedness between individuals and other organizations and other domestic enterprises (21.148%, 18.664%), between other domestic enterprises and universities and scientific research institutes (20.973%, 18.892%) is also high. Followed by the pairwise connectedness between central enterprises, universities and scientific research institutes (18.31%, 18.198%), between individuals, other organizations, universities and scientific research institutes (18.141%, 17.183%), between troops, universities and scientific research institutes (20.004%, 16.801%). In general, the most innovative domestic agents play a major role in technology spillover connectedness.
As can be seen from the total directional technology spillover connectedness to others (the “TO” row in
Table 3), the connectedness of other domestic enterprises to the other five agents is the largest, reaching 94.309%. The technology spillover connectedness to other agents is followed by universities and scientific research institutes, which reach 80.787%. Central enterprises ranked third, with 78.573% of the technology spillover connectedness to other agents. Individuals and other organizations ranked fourth, with 76.709% of the technology spillover connectedness to other agents. The technology spillover connectedness of troops to other agents is 63.276%. The technology spillover connectedness from any of these five innovation agents is more than 60%. However, foreign-funded enterprises have the smallest total directional technology spillover connectedness to other agents, only 14.946%.
As can be seen from the total directional technology spillover connectedness from others (the “FROM” column in
Table 3), universities and scientific research institutes are most affected by other agents, reaching 75.231%. Followed by other domestic enterprises, central enterprises, troops, individuals, and other organizations, with roughly the same total directional technology spillover connectedness. In contrast, foreign-funded enterprises are the least affected by other agents, only 41.97%.
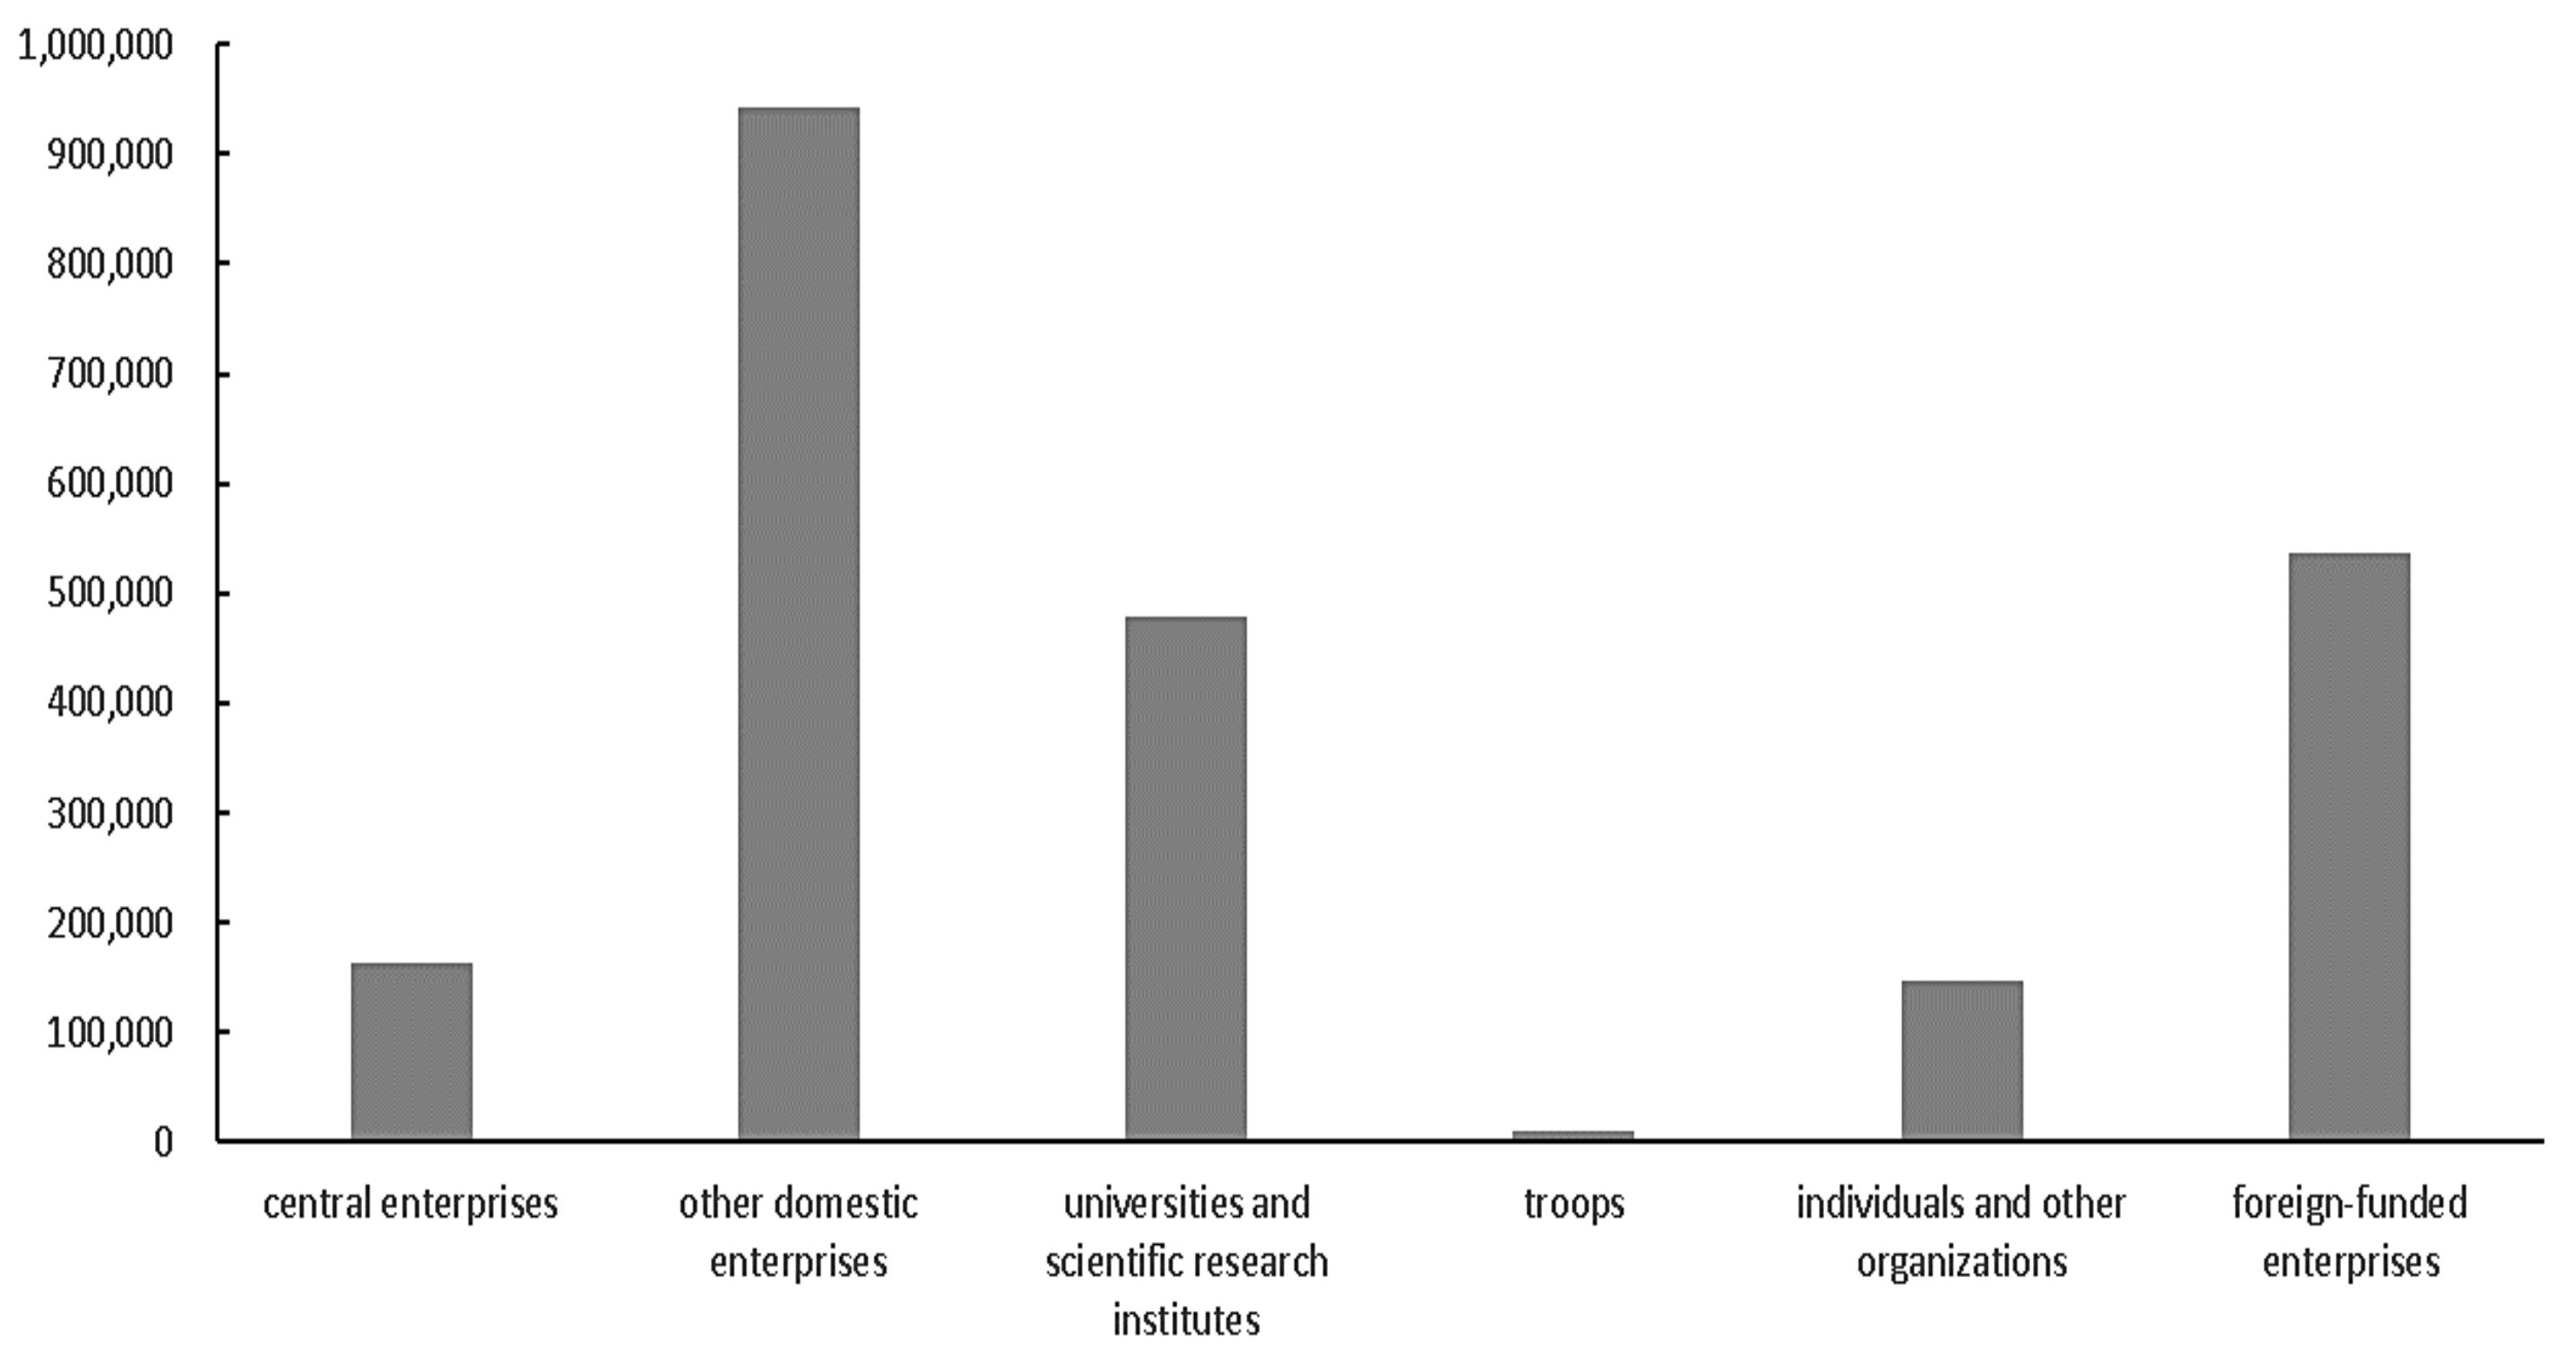
The above results show that other domestic enterprises are the main transmitters of technology spillover connectedness, followed by universities and scientific research institutes, central enterprises, individuals and other organizations, and troops. The technology spillover connectedness of foreign-funded enterprises is relatively small. One possible reason is that most of the invention patents applied by foreign-funded enterprises in China are independent inventions rather than collaboration inventions with Chinese agents. For example, in 2019, foreign-funded enterprises had a total of 92,818 invention patents. Still, the patents applied independently were 87,944, accounting for 95%, while the collaboration invention patents with China were only 926, accounting for 1%.
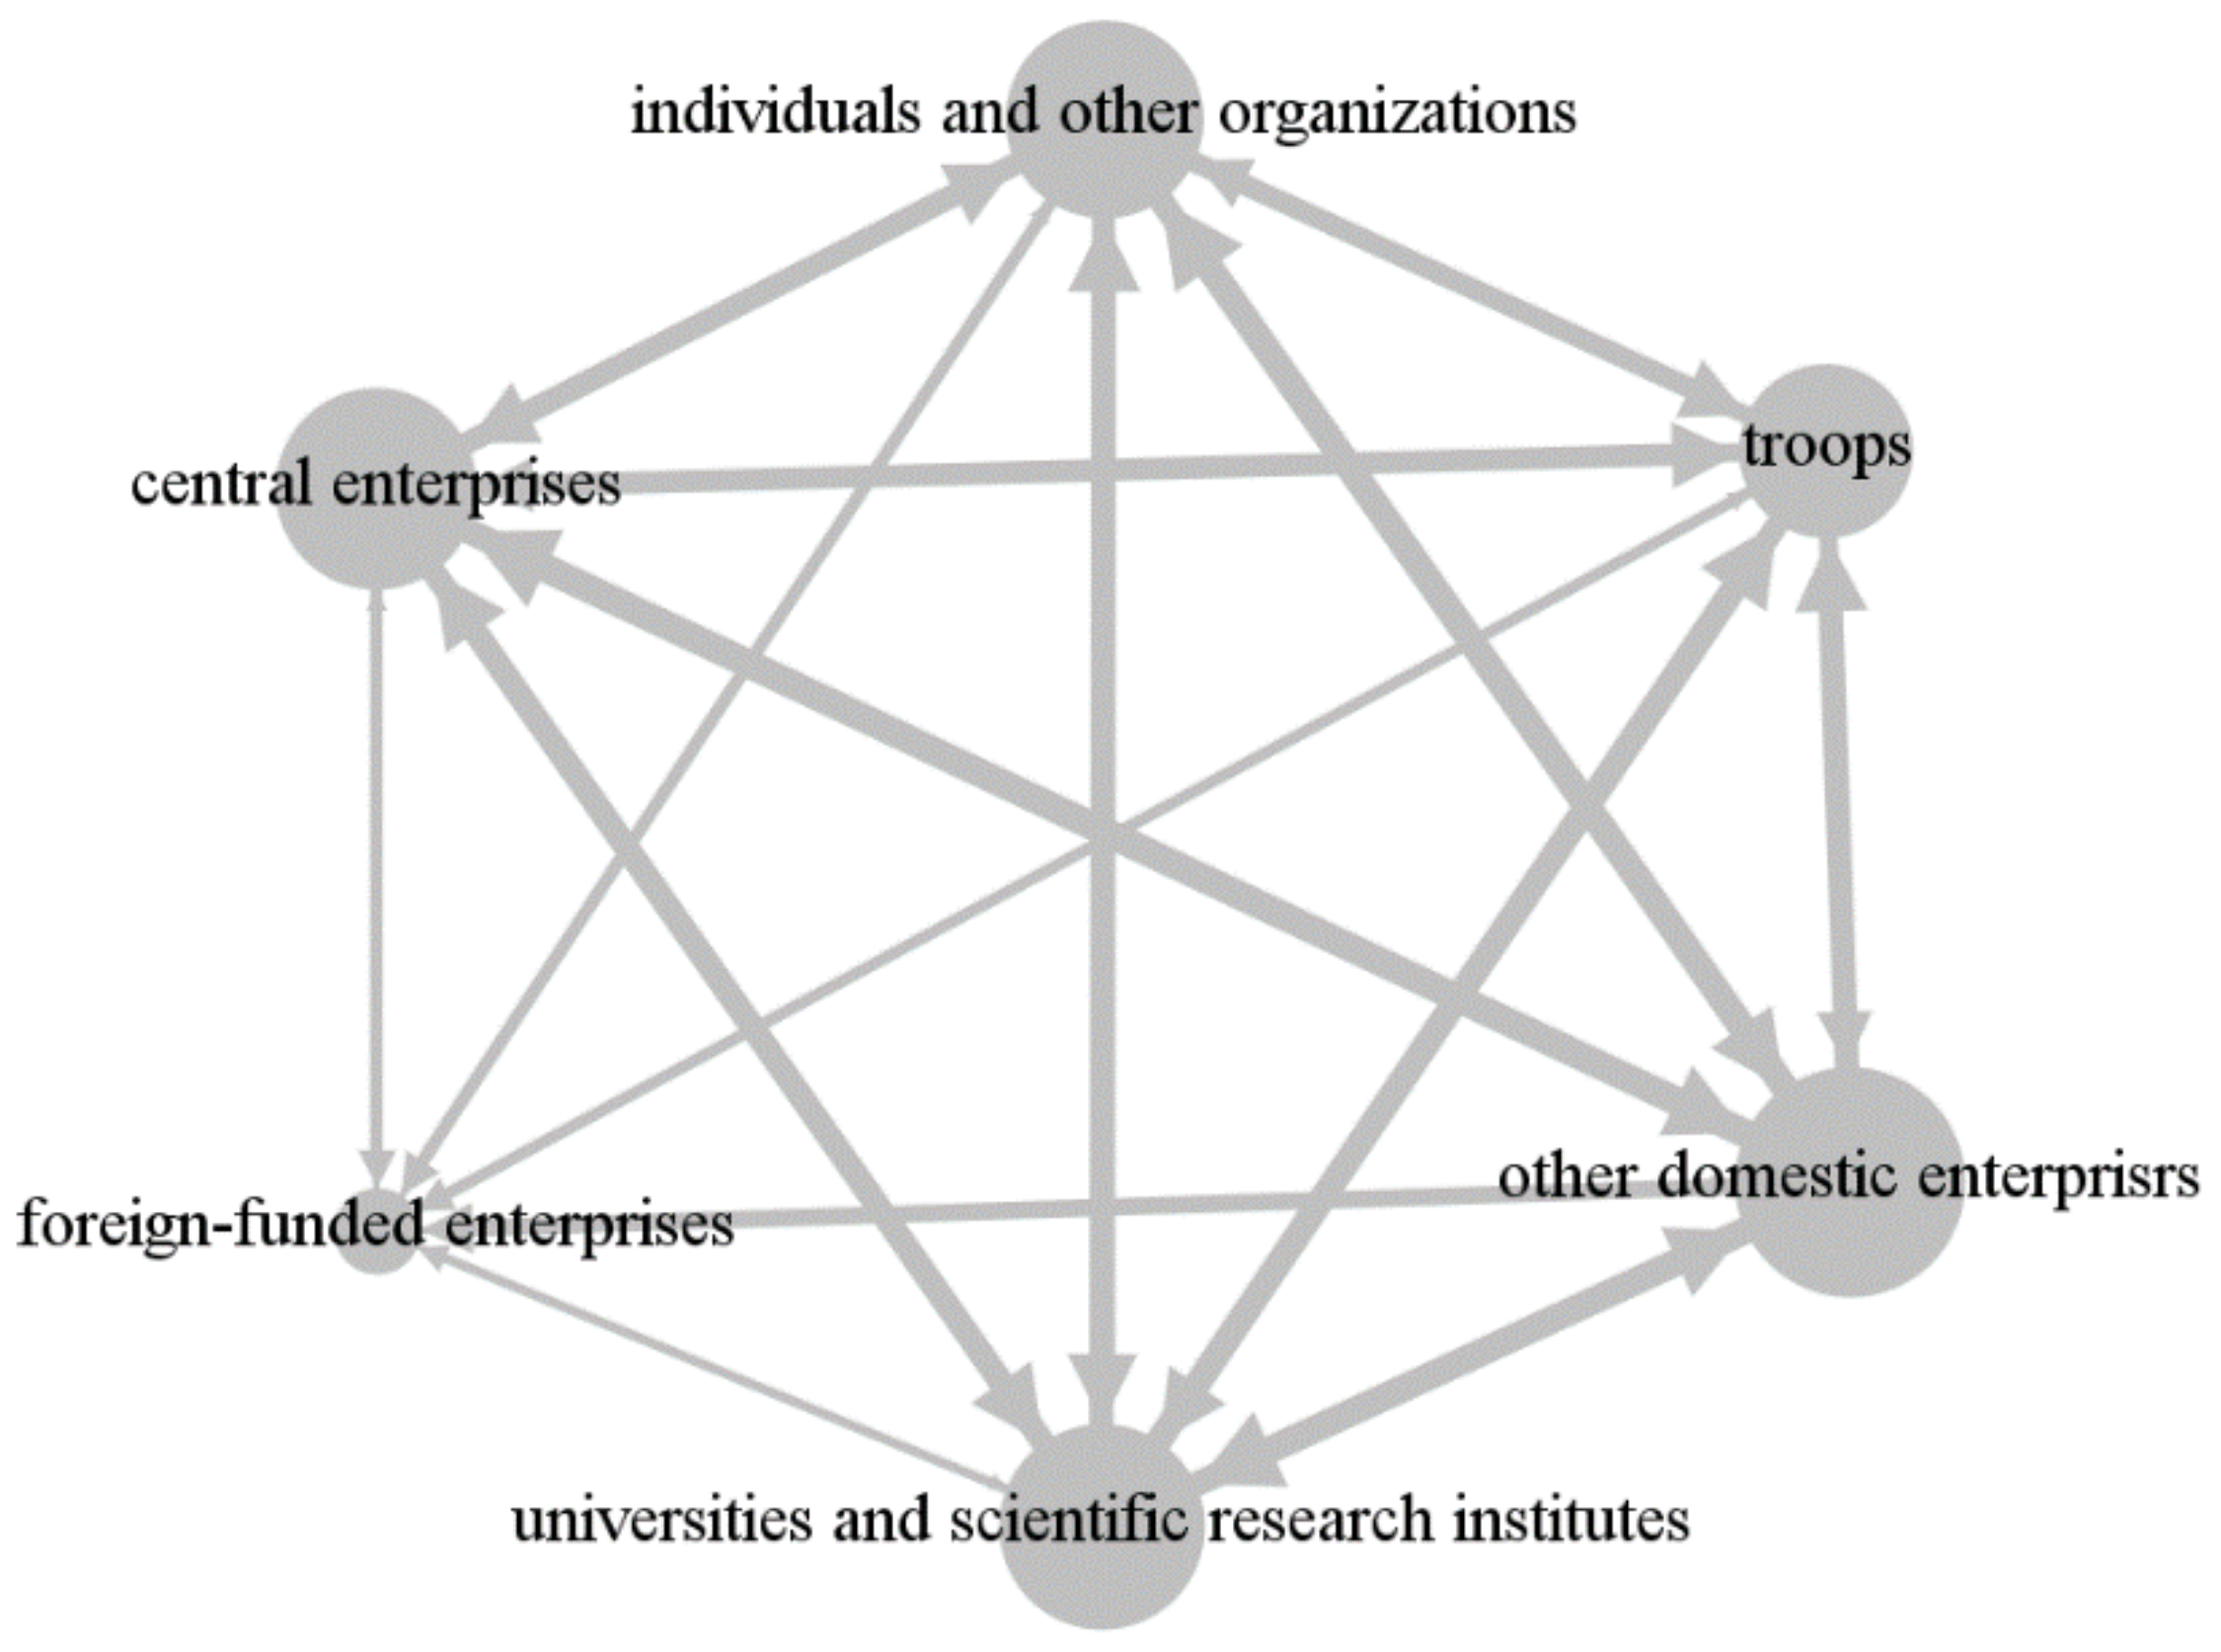
In order to further analyze the path, intensity, and center of technology spillover connectedness among various agents, the social network diagram of technology spillover connectedness is drawn. As shown in
Figure 2, each innovation agent is a “node”, and the larger the node size of the innovation agent, the greater the technology spillover connectedness of the agent to other agents. The connecting line between nodes represents spillover connectedness. The thicker the connecting line, the greater the degree of technology spillover connectedness from one agent to another. It is evident that there is a technology spillover connectedness among various agents. In addition, other domestic enterprises, universities and scientific research institutes, and central enterprises have the largest nodes and become the center of technology spillover connectedness.
Based on the above analysis of technology spillover connectedness, we further examine the net total directional technology spillover connectedness of the six innovation agents. As shown in
Table 4, we rank the net total directional technology spillover connectedness of these agents. “TO” and “FROM” are the same as in
Table 3, measuring the technology spillover connectedness of one agent to other agents and from other agents. The net total directional technology spillover connectedness “NET” is “TO” minus “FROM” (formula (9)) and “GROSS” is the sum of “TO” and “FROM”.
Positive net total directional technology spillover connectedness means an agent affects other agents more than it is affected by other agents as a net transmitter. In contrast, negative net total directional technology spillover connectedness suggests a net receiver. As can be seen from
Table 4, other domestic enterprises act as the largest transmitter of the total directional technology spillover connectedness, reaching 20.454%. This is much higher than other agents, revealing that other domestic enterprises are in a dominant position in the technology spillover connectedness. Followed by central enterprises, universities and scientific research institutes, individuals, and other organizations, which are net transmitters of technology spillover connectedness but far smaller than other domestic enterprises. In contrast, foreign-funded enterprises and troops have negative net total directional technology spillover connectedness, indicating that these agents are net receivers of technology spillover connectedness, in which foreign-funded enterprises are the largest receivers.
4.2. Analysis of Technology Spillover Connectedness among the Eleven Innovation Agents
In order to identify which countries or regions of foreign-funded enterprises play a major role in technology spillover connectedness, we further divide foreign-funded enterprises into Hong Kong, Macao and Taiwan, Japan, the United States, Germany, South Korea, and France according to their sources, which have the largest number of invention patents in the sample. Consequently, we have 11 innovation agents: central enterprises, other domestic enterprises, universities and scientific research institutes, troops, individuals and other organizations, Hong Kong, Macao and Taiwan, Japan, the United States, Germany, South Korea, and France.
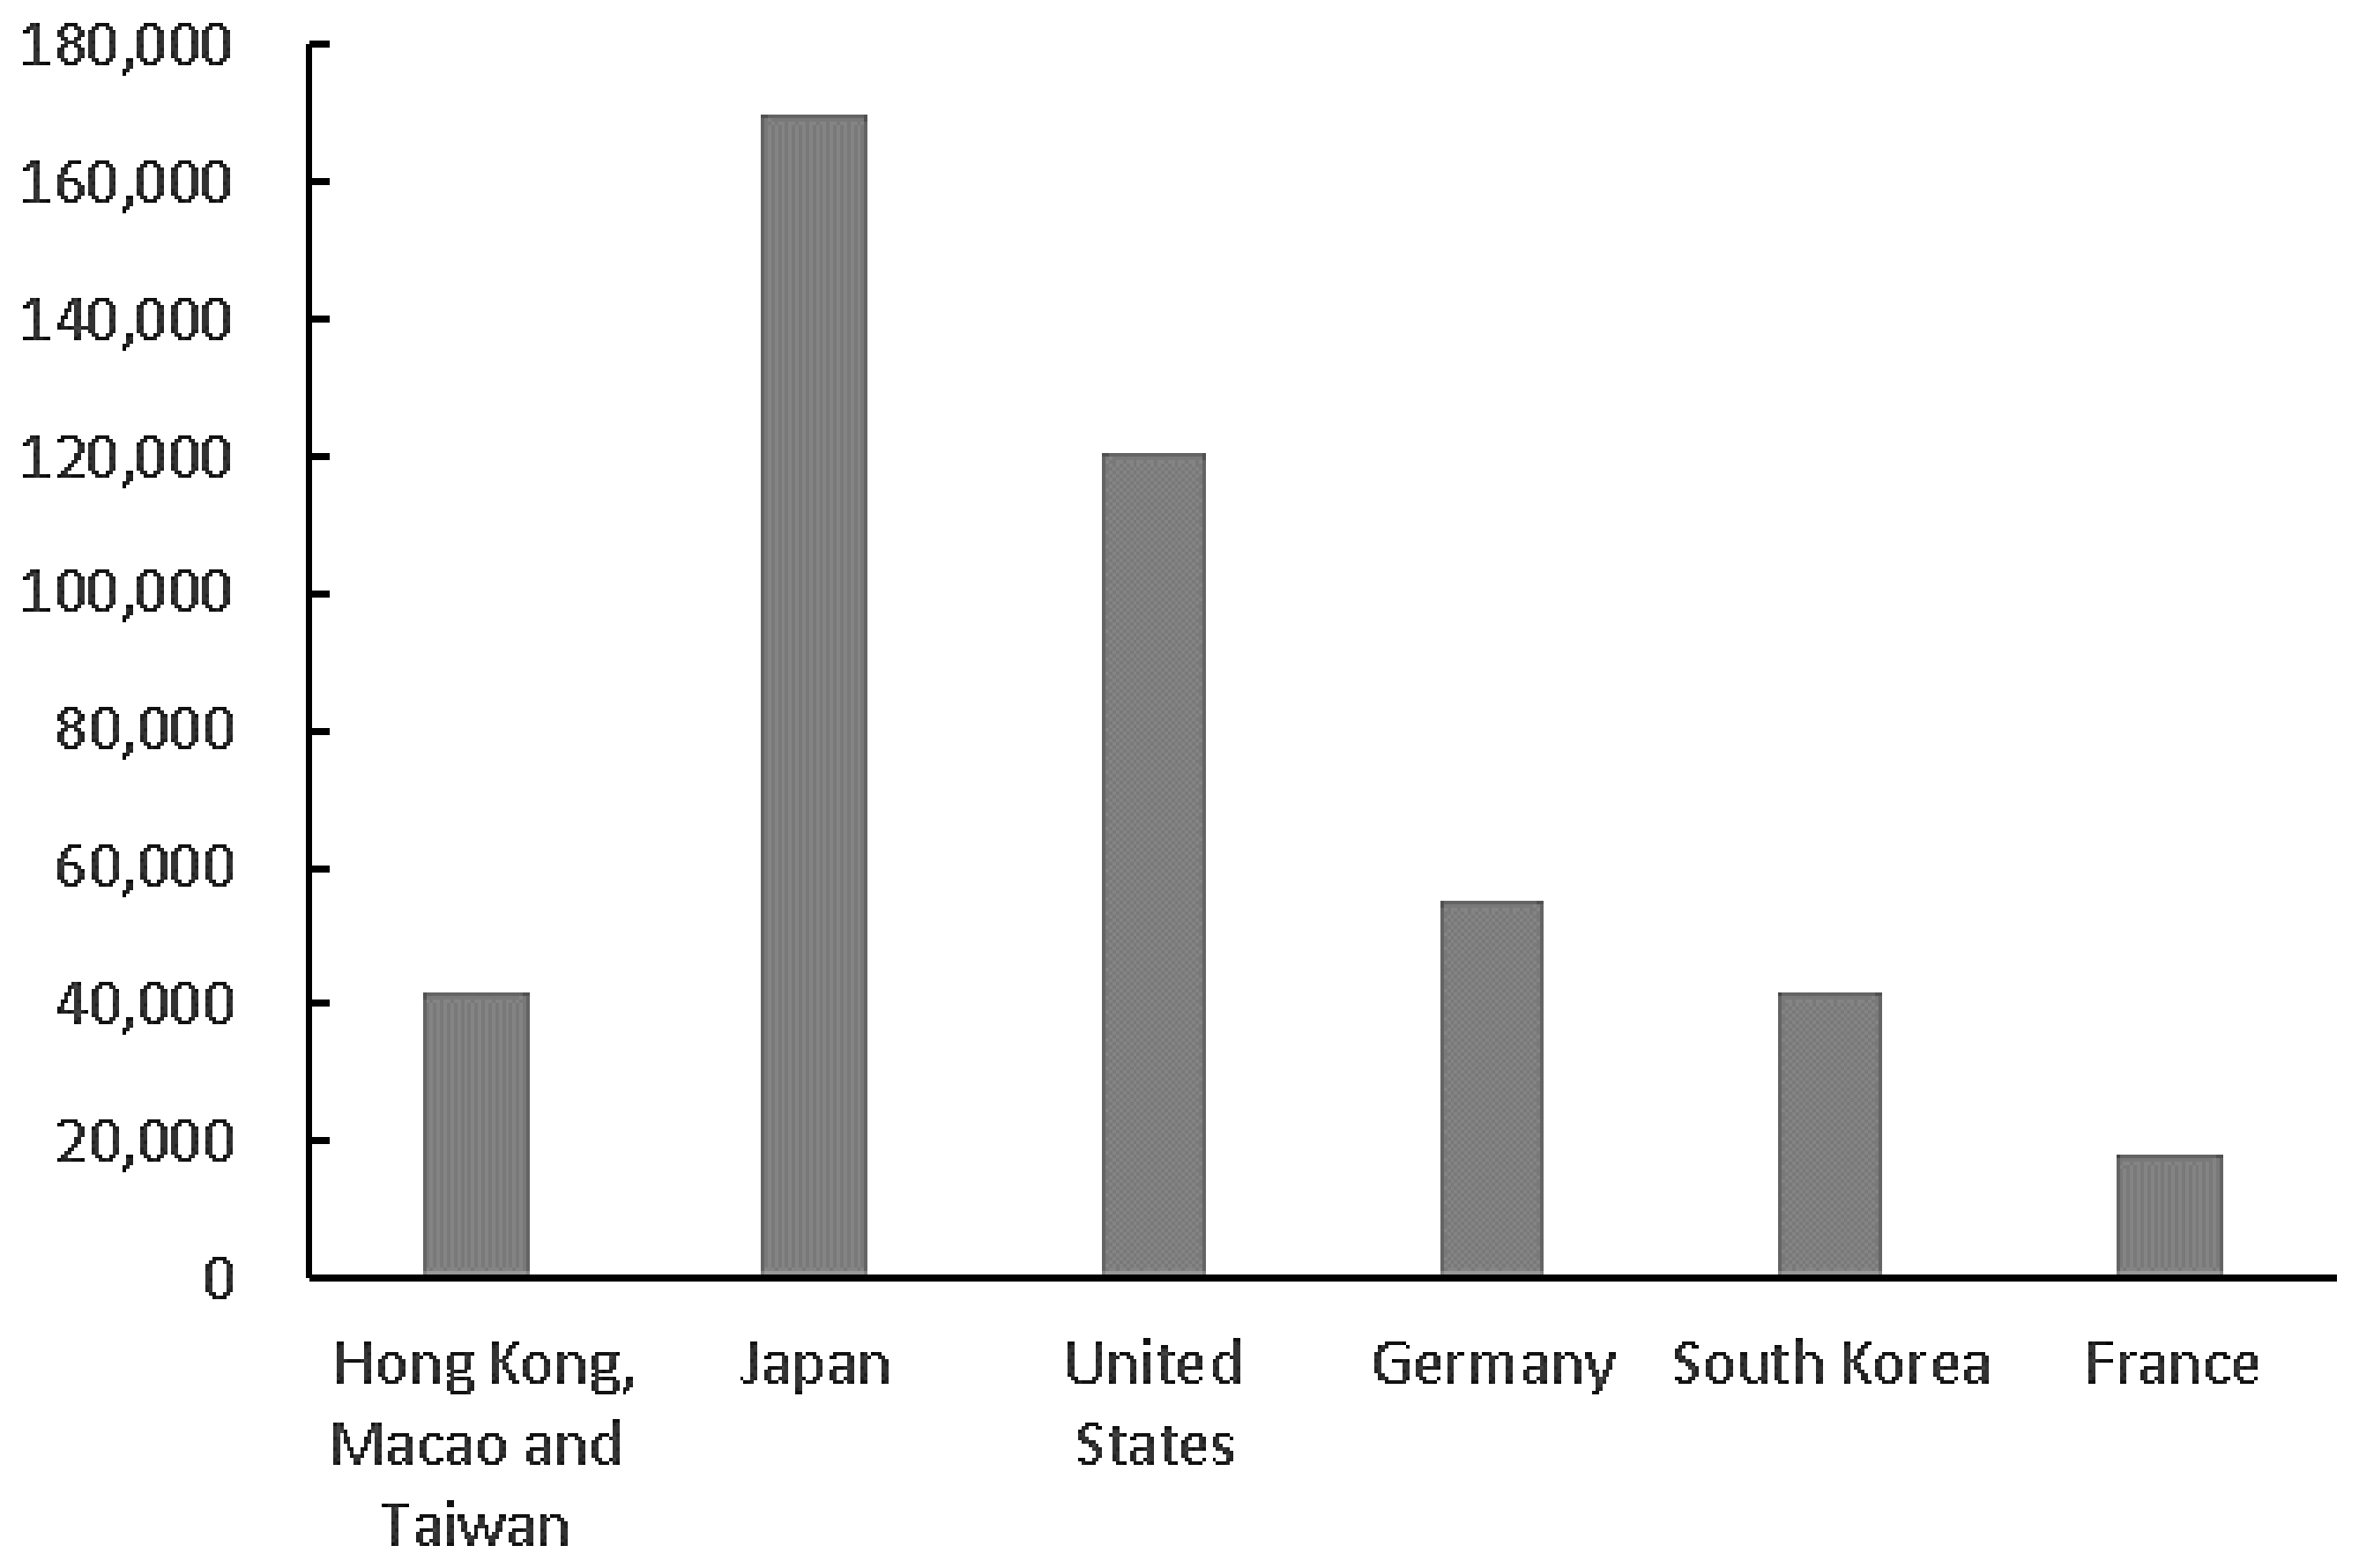
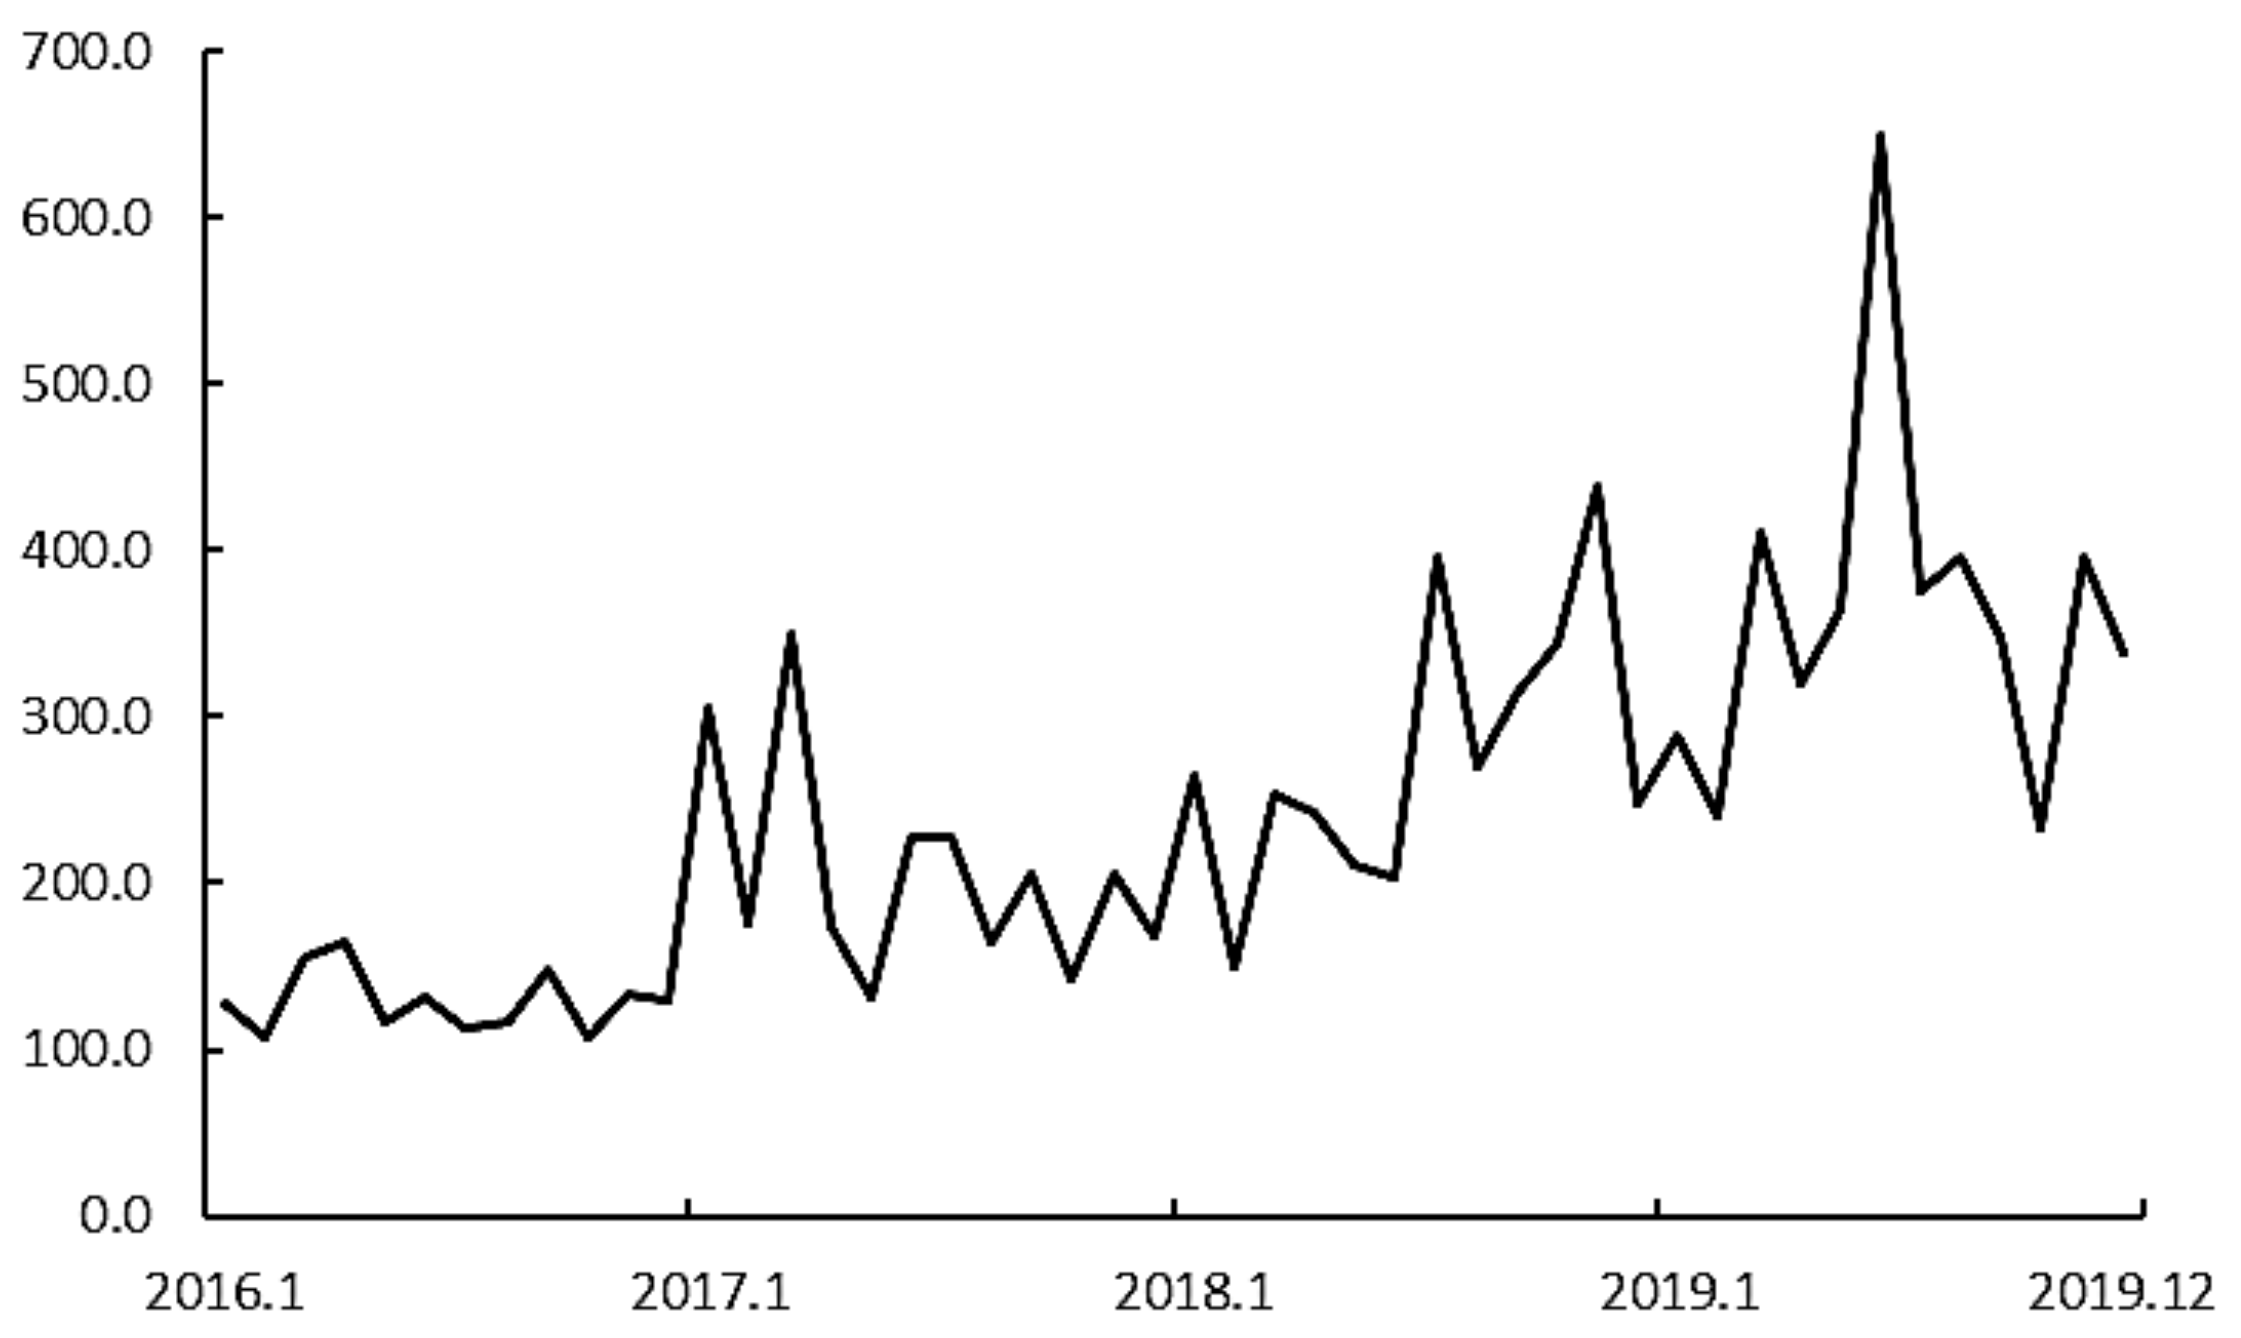
Figure 3 illustrates the number of invention patents in Hong Kong, Macao, Taiwan, Japan, the United States, Germany, South Korea, and France in China from 2015 to 2019. Among these countries and regions, Japan has the largest number of invention patents, 169,815. Followed by the United States (120,330), Germany (54,910), South Korea (41,920), Hong Kong, Macao, and Taiwan (41,699), and France (17,941), respectively. Japan’s patents are 1.4 times that of the United States, 3.1 times that of Germany, 4.1 times that of South Korea, 4.1 times that of Hong Kong, Macao, and Taiwan, and 9.5 times that of France.
Table 5 shows the distribution of invention patents of national or regional innovation agents. Among them, the proportion of Hong Kong, Macao, and Taiwan enterprises decreased from 2.183% in 2015 to 1.559% in 2019. The proportion of Japanese enterprises decreased from 9.729% in 2015 to 6.430% in 2019. The proportion of American enterprises decreased from 5.915% in 2015 to 4.735% in 2019. The proportion of German enterprises decreased from 2.656% in 2015 to 2.063% in 2019. The proportion of French enterprises decreased from 0.928% in 2015 to 0.668% in 2019. On the contrary, the proportion of South Korean enterprises increased from 1.661% in 2015 to 2.041% in 2019. In other words, the proportion of invention patents in all countries and regions apart from South Korea has decreased. The total proportion of these six countries or regions decreased from 23.071% in 2015 to 17.497% in 2019.
Employing the technology spillover connectedness index and connectedness matrix, we analyze technology spillover connectedness among eleven innovation agents. Specifically, we calculate the technology spillover connectedness matrix of the eleven innovation agents (
Table 6).
As can be seen from the total directional technology spillover connectedness to others (the “TO” row in
Table 6), after subdividing foreign-funded enterprises, the United States has the largest technology spillover connectedness to other agents among all foreign-funded enterprises, reaching 88.114%. Followed by South Korea and Japan, the technology spillover connectedness to other agents reaches 85.227% and 83.535%, respectively, which are more than 80%. The technology spillover connectedness of Germany and France to other agents are 77.088% and 74.842%, respectively, and the technology spillover connectedness of Hong Kong, Macao, and Taiwan to other agents are 64.194%, which are all higher than 60%. These results show that the enterprises of the United States, South Korea, and Japan are the center of technology spillover connectedness among all foreign-funded enterprises, mainly because these three countries are also important sources of China’s foreign direct investment.
As can be seen from the total directional technology spillover connectedness from others (the “FROM” column in
Table 6), Germany is the agent most affected by technology spillover connectedness from other agents, reaching 81.768%, followed by the United States, South Korea, and Japan.
The total technology spillover connectedness among the eleven innovation agents is 78.674%, which is consistent with the above results of the six agents. It suggests that in addition to the innovation agents’ factors, more than half of the weight is contributed by other agents, and there is a significant technology spillover connectedness among the eleven innovation agents.
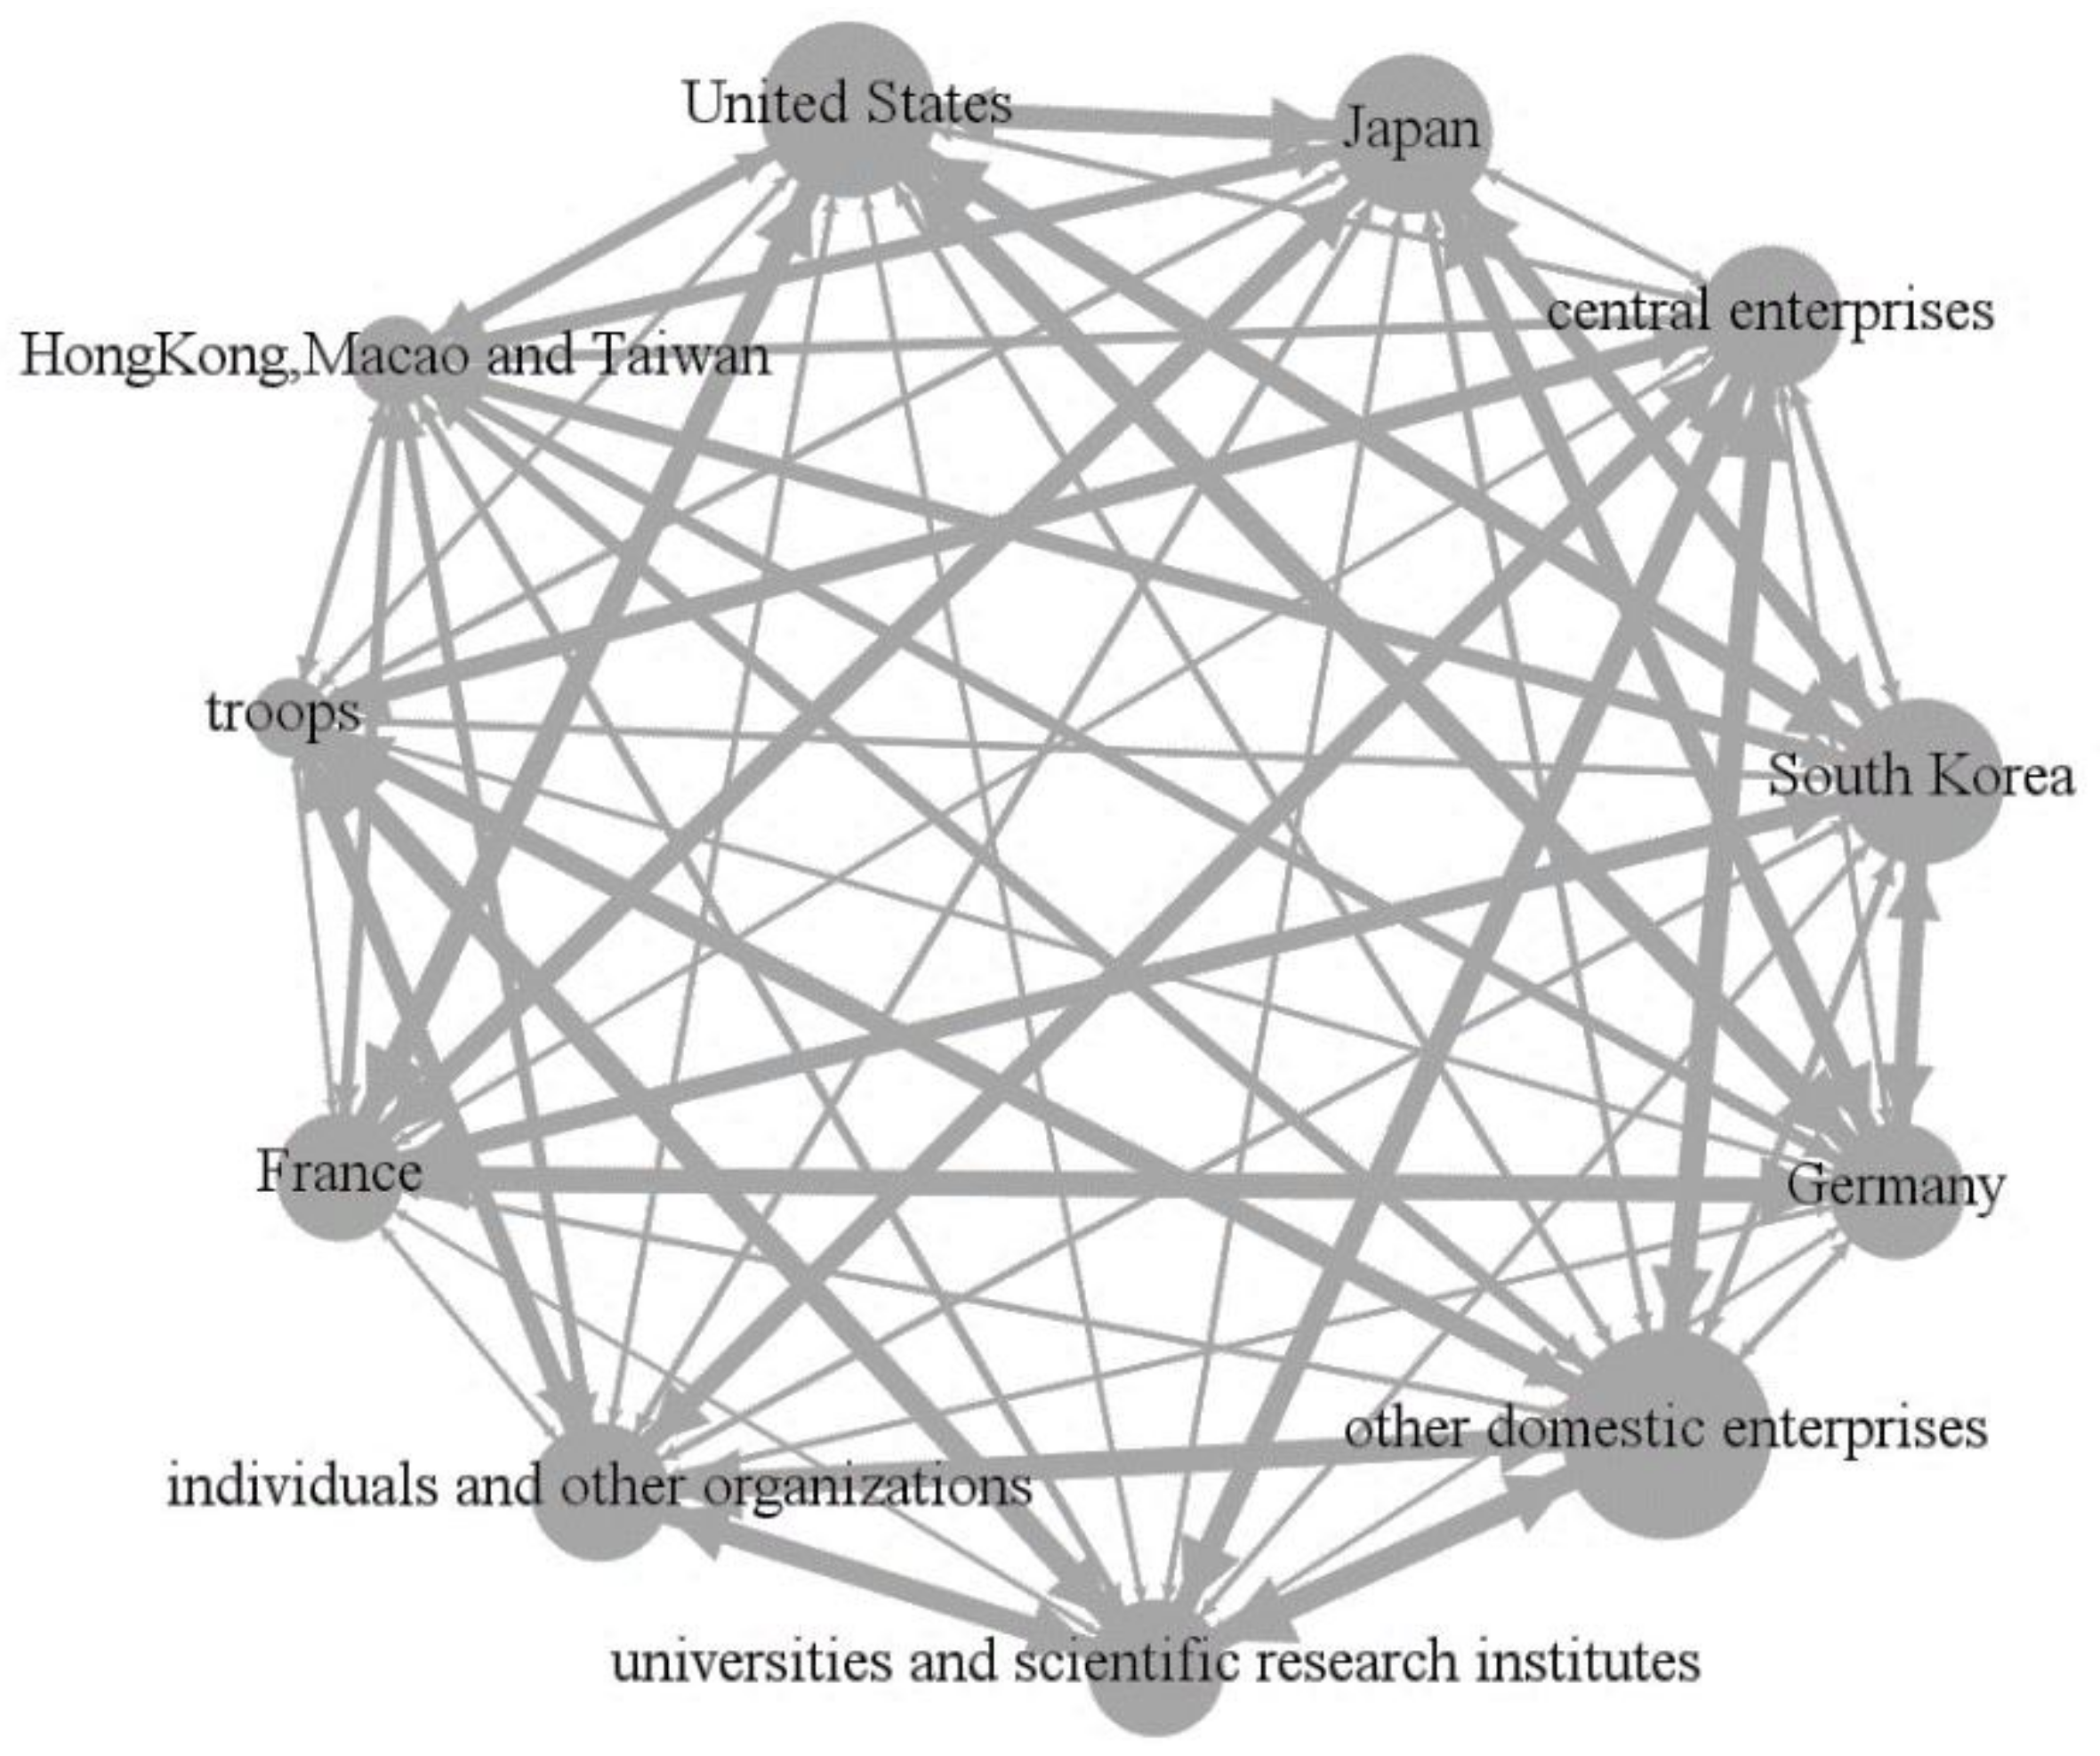
On this basis, the network diagram of technology spillover connectedness is drawn. As shown in
Figure 4, among the source countries and regions of foreign-funded enterprises, the United States, South Korea, and Japan have the largest nodes and are the center of technology spillover connectedness.


