Article

Modeling Inventory Cost Savings and Supply Chain Success Factors: A Hybrid Robust Compromise Multi-Criteria Approach

1
Eating Behavior Research Center, School of Nutrition and Dietetics, Universidad de Valparaíso, Valparaíso 2360102, Chile
2
Center of Micro-Bioinnovation, Universidad de Valparaíso, Valparaíso 2360102, Chile
3
COPPEAD, Universidade Federal de Rio de Janeiro, Rio de Janeiro 21941-598, Brazil
4
School of Industrial Engineering, Pontificia Universidad Católica de Valparaíso, Valparaíso 2350026, Chile
5
Faculty of Natural Sciences and Mathematics, Escuela Superior Politécnica del Litoral ESPOL, Guayaquil 090902, Ecuador
6
Faculty of Engineering, Universidad Espíritu Santo, Samborondón 0901952, Ecuador
*
Author to whom correspondence should be addressed.
Mathematics 2022, 10(16), 2911; https://doi.org/10.3390/math10162911
Submission received: 9 July 2022 / Revised: 5 August 2022 / Accepted: 5 August 2022 / Published: 12 August 2022
(This article belongs to the Section Computational and Applied Mathematics)

Abstract

:
Determining success factors for managing supply chains is a relevant aspect for companies. Then, modeling the relationship between inventory cost savings and supply chain success factors is a route for stating such a determination. This is particularly important in pharmacies and food nutrition services (FNS), where the advances made on this topic are still scarce. In this article, we propose and formulate a robust compromise (RoCo) multi-criteria model based on non-linear programming and time-dependent demand. The novelty of our proposal is in defining a score that allows us to measure the mentioned success factors in a simple way, in meeting together all three elements (RoCo multi-criteria, non-linear programming, and time-dependent demand) to state a new model, and in applying it to pharmacies and FNS. This model relates inventory cost savings for pharmacy/FNS and success factors across their supply chains. Savings of inventory costs are predicted by lot sizes to be purchased and computed by comparing optimal and true inventory costs. We utilize a system that records the movements and costs of products to collect the data. Factors, such as purchasing organization, economies of scale, and synchronized supply, are assumed using the purchase system, with these factors ranked on a Likert scale. We consider multilevel relationships between savings obtained for 79 pharmacy/FNS products, and success factor scores according to these products. To deal with the endogeneity bias of the relationships proposed, internal instrumental variables are employed by utilizing generalized statistical moments. Among our main conclusions, we state that the greatest cost savings obtained from inventory models are directly associated with low-success supply chain factors. In this association, the success factors operate as endogenous variables, with respect to inventory cost savings, given the simultaneity of their relationship with cost savings when inventory decision-making.

1. Abbreviations, Introduction, Bibliographical Review, and Objectives

In this section, we provide the abbreviations, introduction, literature study, contribution, and objective of the study, as well as the description of the next sections.

1.1. Abbreviations and Acronyms

Next, abbreviations and acronyms employed in our work are defined in Table 1 to facilitate its reading. Notations associated with some technical issues are presented in the following section.

1.2. Introductory Aspects

The supply chain is a framework of people and industries/organizations who are elaborating a product (good) or service to deliver it to a client. Links on this chain start with the producers of the raw materials and finish when the final product is delivered to the consumer.
Supply chain management is a key aspect and it must be optimized at low costs to obtain an efficient production cycle. Organizations try to enhance their supply chains to reduce their costs and to be more competitive.
Supply management in industry can be improved through efficient inventory policies that allows us to optimize an assortment of goods to meet customer demand [1]. However, each company, as in the case of pharmacies and FNS, has its own peculiarities. Such peculiarities must be studied and modeled using appropriate methodologies that optimize supply management, making it necessary to consider performance measures, such as cost savings [2,3]. Several studies, summarized in [4], indicated that optimizing inventory management can enable cost savings in supply chains for the service industry. The possible savings from inventory management vary according to the performance achieved by each organization, depending on its internal strategy [5]. In particular, on the one hand, pharmacies require the supply of medicines and pharmaceutical products. On the other hand, FNS prepares a daily menu where the components or raw materials required to make up the menu constitute an assortment of inventory to be demanded by groups of people in closed regimes, such as hospitals, institutions, schools, and universities.
It is common in healthcare to classify products that make up the inventory according to factors as employment, expiration, treatment, prices, and storage. These factors are relevant to determining the parameters related to order, storage, and shortage penalty costs, according to the category at which the product belongs and whose supply we want to optimize [6]. From another perspective, the inventory cost savings from may vary depending on the product category whose cost is optimized [7]. Blockchain might save billions for healthcare by stating the chain of custody in supply management [8].

1.3. State of the Art

Although FNS and pharmacies have shown growth in developing countries, there is little literature related to the supply chain of these services in the public area. The scarce research is limited to gastronomy, healthcare, hospital, and tourism services [9,10]. In [11], a proposal for sustainable and home healthcare logistics, as a response to the COVID-19 pandemic [12,13], was designed. In [14], two-level programming for the home healthcare supply chain considering outsourcing was established. In [15,16,17,18,19], stochastic inventory models, by assuming traditional cost parameters and a random DPUT to minimize the TC of the inventory, were formulated. Particularly, the work presented in [17] considered time dependence for the DPUT of drugs modeled through conditional statistical distributions with respect to explanatory variables (covariates) and an ARMA structure.
The ARMA models are highly flexible, with its parameters being estimated and interpreted in a simple way, in addition to allowing us to directly carry our forecasting [20]. However, the usual ARMA structures assume linearity and Gaussian/normal distributed errors, making such structures limited. When non-Gaussianity is identified in the underlying data distribution, for example in intermittent DPUT [21], practitioners often transform the data for reaching Gaussianity. Nevertheless, when transforming the data, interpretation problems of the obtained information arise, besides undesirable statistical properties.
GLM [22] are used to handle these problems in a more general statistical framework. GLM are more flexible than Gaussian regression and assume any distribution belonging to the exponential family, as the binomial, gamma, and normal distributions, among others [22]. Note that the Gaussian regression is a special case of GLM when the normal distribution is assumed. GLM assume a distribution for the response (explained or dependent) variable instead of the model error and permit us to describe non-linear and linear settings linking the covariates to the model structure by a suitable function.
If time dependency and non-Gaussianity are present, the DPUT can be modeled by GARMA models [17], which are a GLM extension of ARMA models that modify the data mean through a link function. Note also that, although the GARMA models state a temporal dependency on the DPUT, if this is not considered, the parameters associated with the ARMA structure can be set as zero and a usual GLM is obtained. Therefore, the GLM are a particular case of the GARMA models. Thus, once the underlying distribution has been assumed, the GARMA parameters may be estimated utilizing the ML method [23,24]. Similarly, a zero-inflated distribution can be stated to model an intermittent DPUT [21], that is, demand values equal to zero.
Once the random structure of demand has been modeled, it can be forecasted using probabilistic scenarios into an SP approach to find optimal supply costs [25]. To optimize the model, a two-stage SP approach can be utilized following the works presented in [19,26]. In its first stage, a purchase decision related to when and how much to acquire is made, without knowing the values that the DPUT can take. Then, forecasting the probabilistic scenarios of the DPUT for a product/service, the decision of the second stage is made by calculating stocks at hand and expected shortages [17]. Note that, at any stage, there is a finite number of states that are described by multidimensional variables [27].
Although the forecasting of supply in hospital pharmacies and FNS is carried out generally in one period, the two-stage SP models are more helpful in determining optimal costs in that case as well [28]. In [17,19], two-stage SP approaches were considered to lead to significant cost savings in inventory management.
These savings are related to the supply chain management of pharmacies and FNS by means of success factors that were identified. However, in spite of the importance of inventory management based on the supply chain that minimizes costs in pharmacies and FNS, there is a lack of performance measures that quantify the cost saving [2].
The correct operation of the supply chain involves, among others, to suppliers, dealers, and final service to arrive on time with the product or service to the user; see [29] for the case of pharmacies and FNS. Several studies [2,29,30,31] indicated that there are saving opportunities in the supply chain related to success factors for its management, such as: (i) purchasing products and raw materials agreed between technical and supply staff [2,9]; (ii) successful partnership with a group purchasing organization [30,32]; and (iii) existence of supply data management technology, which are synchronized and integrated with the purchase system [31].
Problems involving multiple alternatives and criteria through a structured framework can be applied by using a stochastic MCDM model. This type of models are a growing research field with different approaches being developed to explore the underlying epistemic uncertainty in ranking alternatives and weighting criteria for measuring performance, such as indicated in [33,34,35,36].
Note that the cost savings achieved through inventory policies in service industries (such as pharmacies and FNS) and supply chain success factors could occur simultaneously or in both directions [37]. Then, the factors previously mentioned in (i)–(iii), as determinants of the performance of a stochastic inventory model (saving effect), can also be considered as an inverse relationship. Thus, inefficiency in saving performance (cause) is a determinant of the inability of grouped purchases, poor coordination between technical-supply staff, and lack of investment in data management platforms (effect). Then, the relationship between cost savings obtained by using a stochastic inventory model and its determinant factors may be modeled under a statistical regression context as mentioned in the following paragraph [38].
A temporal correlation between the errors can exist, as they may be influenced by the mentioned success factors. Then, we must consider this correlation because ignoring it can lead to biased and inefficient estimators of the corresponding regression coefficients [39,40]. One can hypothesize relationships between the success factors at different levels. At the lowest level of the response variable, we have cost savings per product. At an intermediate level, we have those products belonging to certain categories. Then, at a higher hierarchical level, we have the organization analyzed (pharmacy or FNS). Therefore, we know that, like in single-level regression models, endogeneity is a concern to be also considered in multilevel models [41].
In multilevel models [42], there are several assumptions involving random components at multiple levels. In this kind of models, any moderate correlation between a covariate and a random component might cause significant bias in the estimated coefficients and variance components [41]. This estimation framework is known as SUR [39]. Furthermore, the multilevel models could include variables that simultaneously appear on the left and right sides of equations. This simultaneity can be rectified by employing each equation through a 2SLS estimation method. When this method is used with the SUR, the system of equations is simultaneously estimated utilizing the 3SLS method [39].
Note that the SUR estimators are biased if the covariates are correlated with the errors. This can be circumvented by 2SLS, W2SLS, or 3SLS estimation with instrumental variables. These variables for each simultaneous equation can be either different or identical for all equations. In some cases, such variables may be of dummy type and then we can use the Wald estimator, also called the grouping estimator. This estimator weights the proportion between the number of times that the instrumental variable takes the zero value and the number of times it takes the one value in the sample [43]. The instrumental variable technique has also been extended to the GLM framework [44]. To face this challenge in a simpler way, a multilevel hierarchical structure was proposed in [42] by using a GMSM method.
The GMSM method addresses endogeneity in multilevel models without the need for external instrumental variables, handling this difficulty in a simpler way. The GMSM method employs both between and within variations of the exogenous variables, but only assumes the within variation of the variables to be endogenous [45].

1.4. Contribution, Objectives, and Organization of the Article

Despite the advances made in determining success factors for managing supply chains of pharmacies and FNS, these advances are still scarce. For example, in [46], a multi-criteria framework was stated considering profit, environmental pollution, consumer health level, and brand equity for a competitive pharmaceutical supply chain, whereas the work presented in [47] utilized a data-driven method mixed with a knowledge-driven MCDM method to reduce the dependence of judges. In another application of MCDM presented in [48], a framework developed based on five different criteria using design, manufacture, service, maintenance, scrap, and recycling for an environmentally friendly reliability-based optimization method.
According to our literature review, to the best of our knowledge, there is a gap in the related state of the art due to no previous studies defined a score that measures the mentioned success factors. To fill this gap, the present study contributes to the MCDM literature by addressing various issues that are associated with establishing relationships between inventory cost savings and success factors in the supply chain, which we apply to pharmacy and FNS industries. Our study includes how to robustly establish an indicator of success factors in supply chain management of these industries, and how to deal with the relationships of inventory cost savings n multilevel products, categories, and organizations. In addition, we consider the possible endogeneity of this relationship with the help of a computer application that registers the factors of interest in the supply system. Determining success factors for managing supply chains is a relevant aspect for the companies. Then, modeling the relationship between inventory cost savings and supply chain success factors is a route for stating such a determination. This is particularly important in pharmacies and FNS, where the advances made on this topic are still scarce.
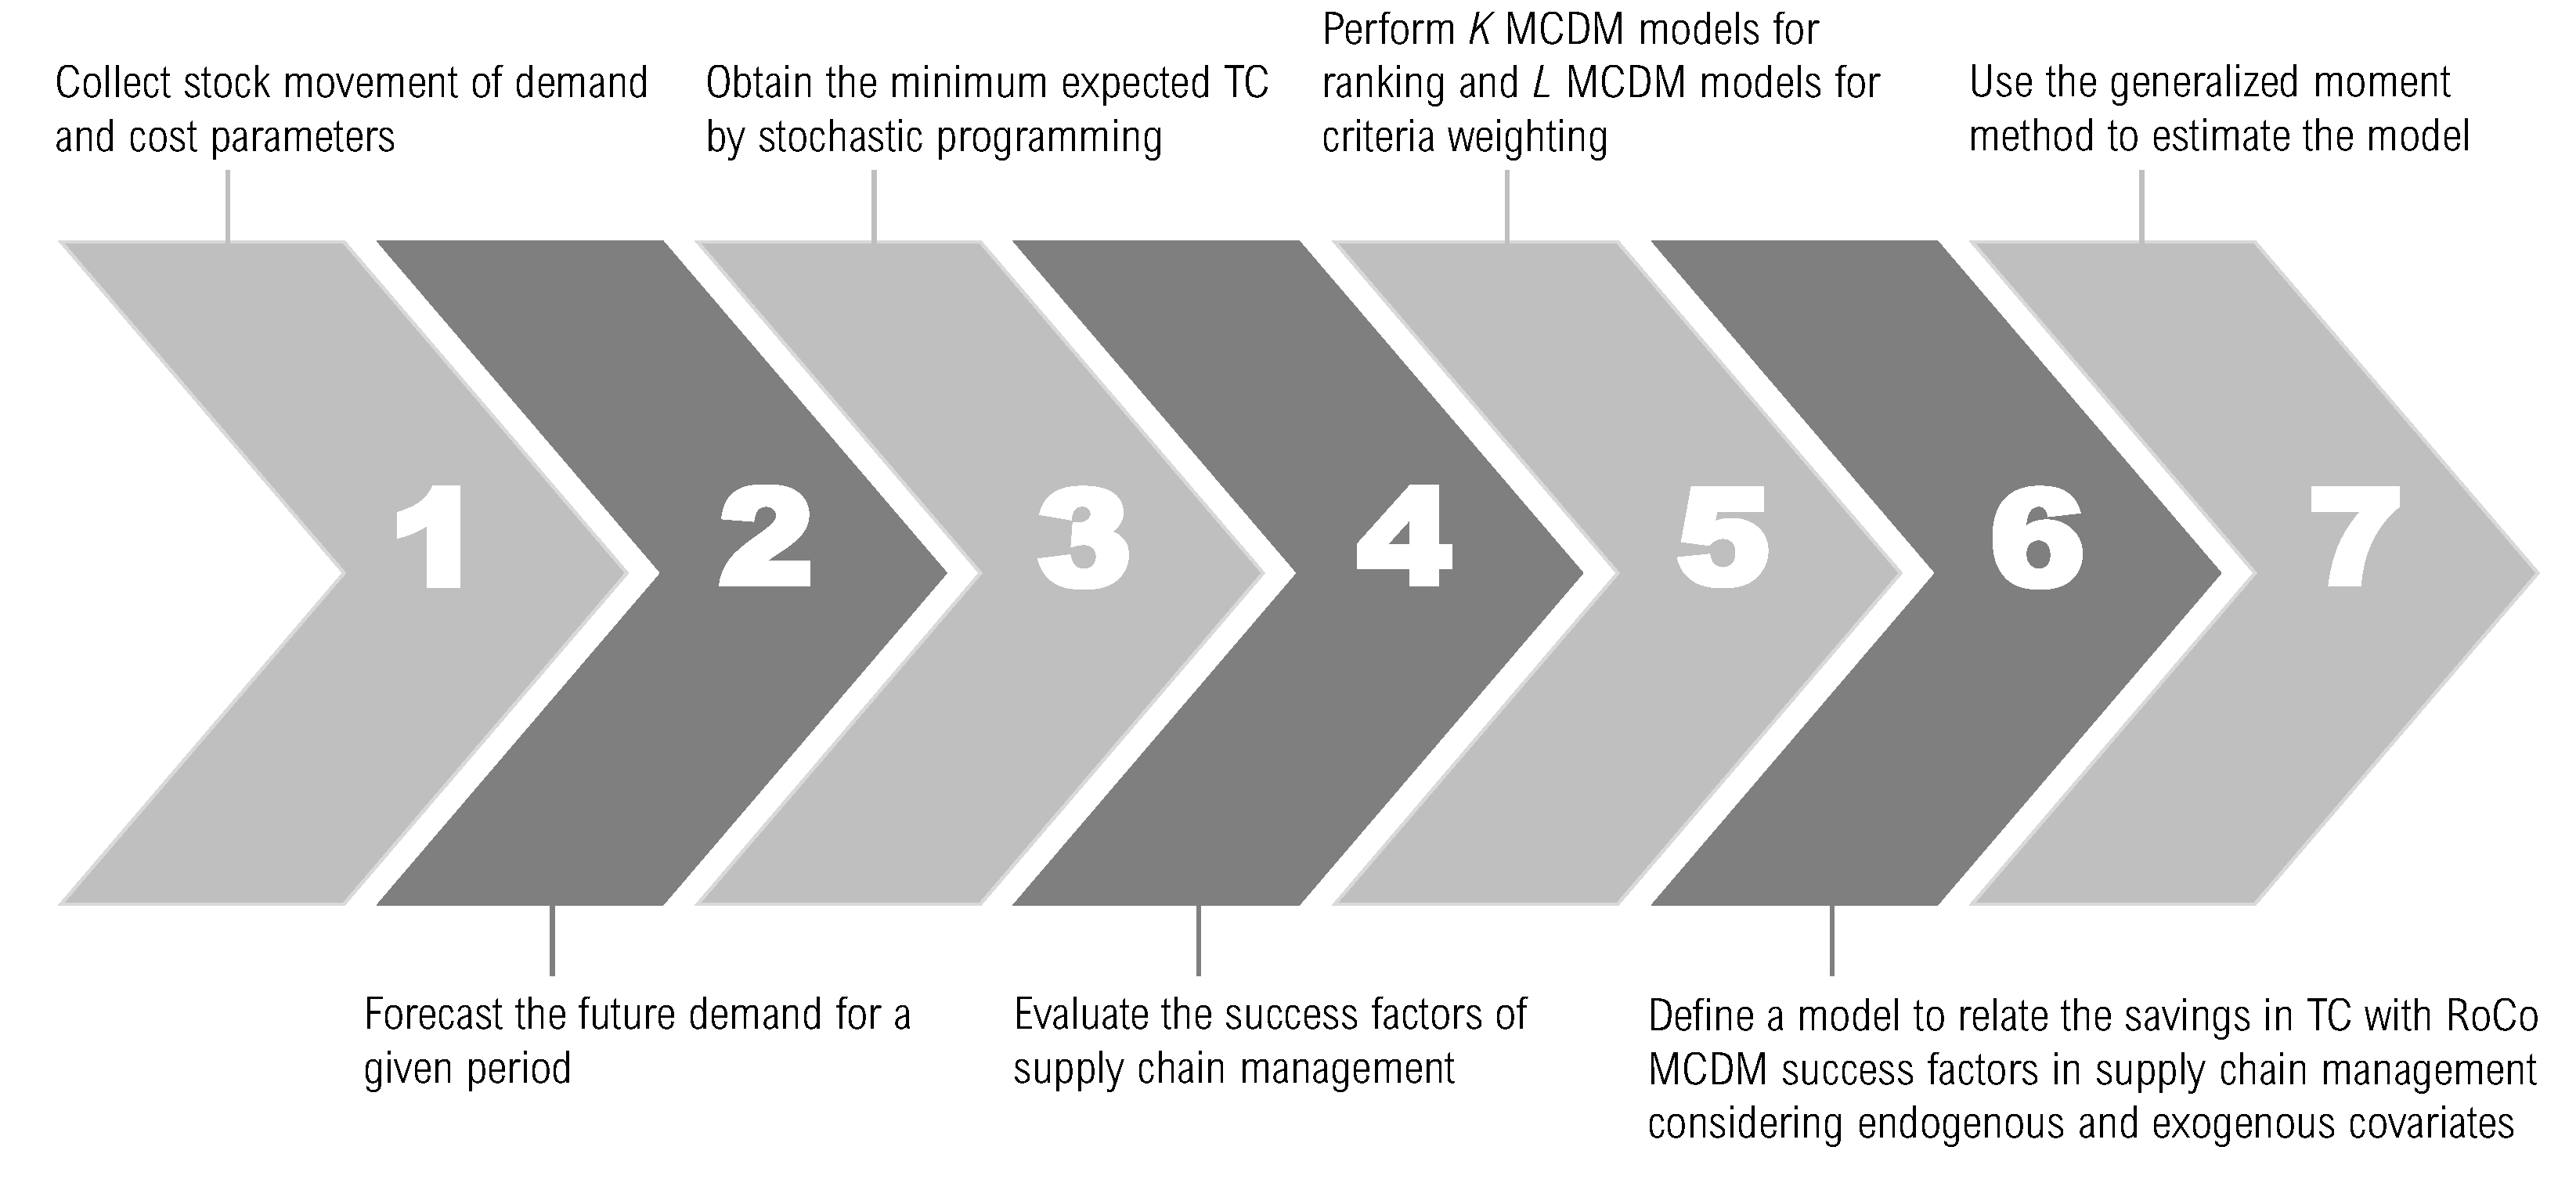
A novel RoCo MCDM model is proposed to obtain a score of the supply chain success factors, such as a group purchasing organization, economies of scale, and the existence of supply data management technology, which are synchronized and integrated with the purchase system. The structure of the proposed model considers non-linear SP, solved by a differential evolution algorithm—specifically with a genetic algorithm [49], and a multilevel setting between savings obtained for pharmacies/FNS products and success factor scores according to the products studied. To deal with the endogeneity bias of the relationships proposed, internal instrumental variables are used by a GMSM method. We believe that the results to be obtained will directly benefit the function of supply chain managers. We conjecture it since a method to obtain a robust indicator will be able to measure success factors for the supply chains they manage. Moreover, our results will allow the managers to understand how these factors influence the organization and product categories on the inventory cost savings. Therefore, the novelty of our proposal is in defining a score that permits us to measure the mentioned success factors in a simple way, in meeting together all three elements (RoCo multi-criteria, non-linear programming, and time-dependent demand) to state a new model, and in applying it to pharmacies and FNS. In summary, the objective of the present investigation is to formulate a novel stochastic inventory model that minimizes the inventories TC in pharmacies and FNS industries. We compare these TC with true TC to establish savings and relate them to supply chain success factors in such industries.
The rest of the paper is organized as follows. Section 2 describes the empirical and methodological design to study the mentioned relationships. In Section 3, the results of applying this methodology are reported in a case study. Finally, in Section 4, we carry out a discussion of our findings summarized in conclusions along with their scope, learning of managerial utility, limitations, and ideas for future research.

2. Methodology

In this section, we describe the methodology proposed.

2.1. Description of the Methodology

To construct a RoCo MCDM model linking the cost saving and success factors of supply, an SP algorithm is performed. This algorithm is structured by collecting the demand movements, forecasting future demand, and optimizing the expected TC, obtaining the MCDM model, as described in Section 2.2. Then, we made a RoCo multi-criteria decision by using different MCDM models, as detailed in Section 2.3. However, there are no criteria that relate the cost savings to success factors of supply. Thus, in Section 2.4, we propose a multilevel regression model to link cost savings of inventory (in %) and RoCo MCDM score (expressed as a proportion between zero and one) in supply chain with the GMSM method. The proposed methodology is represented in Figure 1 to state the problem setting.

2.2. Stochastic Programming Algorithm

The two-stage probabilistic inventory model seeks to minimize the expected TC denoted by E ( TC ) . This expected value is a function that depends on a set of components associated with decision variables and coefficients used in the resource function of SP. For some time t, in a planning horizon of T periods, with t { 1 , , T } , such components are the coefficients:
(a)
C t : Purchase budget in period t;
(b)
u t : Unit purchase cost in period t;
(c)
o t : Fixed order cost in period t;
(d)
h t : Holding cost at the end of period t;
(e)
s t : Shortage cost at the end of period t,
while the decision variables are:
(f)
Z t : Binary variable indicating whether a purchase is carried out in period t;
(g)
Q t : Quantity of units to be purchased in period t;
(h)
I t : Stock level at the end of period t;
(i)
S t : Shortage level at the end of period t,
and the data of I 0 corresponding to initial stock level. Following [26], in the first stage, we decide when and how much to purchase. Then, Z t and Q t are optimized for the first stage. In Table 2, we see the coefficients and variables that are used in the proposed model.
Next, after observing the demand, we obtain inventory and shortage levels. Thus, I t and S t are optimized for the second stage. For the calculation of the coefficients h t and o t utilized in the resource function, we employ the methodology shown in [15], while C t and u t are data obtained from the computational registry and s t is estimated as a penalty in the absence of a product by the manager in charge of the decision-making unit.
As mentioned, we want to minimize E ( TC ) considering different demand scenarios ω Ω , with p t ω [ 0 , 1 ] denoting the probability of occurrence of scenario ω in a forecast period t + 1 . Hence, the mathematical programming model is given by
min E ( TC ) = ω Ω t = t + 1 T p t ω ( o t Z t + u t Q t + h t I t ω + s t S t ω ) ,
subject to:
Q t + ( I t 1 ω S t 1 ω ) ( I t ω S t ω ) = y t ω , t { 1 , , T } , ω Ω ,
Q t C t Z t , t { 1 , , T } ,
Q t , I t ω , S t ω , y t ω 0 , Z t { 0 , 1 } .
Algorithm 1 shows the steps of the SP approach. Note that the objective function defined in (1) attains a solution that minimizes E ( TC ) over all scenarios. This minimization can be carried out through the addition of sharing cuts for feasibility and optimality at the resource function [50]. Constraint stated in (2) refers to stock equilibrium, whereas the expression presented in (3) assures us that no amount should be requested when the decision in period t is not to buy. Constraint established in (4) refers to non-negativity and binary aspects.
Algorithm 1: Steps of the stochastic programming algorithm.
1:
Collect C t and u t from the stock movement capture and interoperability module.
2:
Collect s t from the manager in charge of the decision-making unit.
3:
Forecast y t ω using the procedure presented in [17].
4:
Compute h t and o t employing the approach stated in [15].
4.1: Optimize Z t and Q t , that is, compute when and how much to purchase.
4.2: Optimize I t ω and S t ω .
5:
Report the results utilizing the knowledge generation module for management.
To obtain the observed values from a forecasted DPUT y t ω of Y t and their probabilities p t ω , we use GARMA models, while for obtaining E ( TC ) , that is, the inventory TC over T periods of the decision stages, the methodology employed is adapted from [17]; see in this reference Algorithms 1 and 2 for details.
To quantify performance measures in TC, generated from the purchase plan of the inventory model obtained from SP based on the generation of scenarios, it is possible to compare the results with the true TC. The savings of inventory cost (in %) are computed as: Δ = ( ( AC SPC ) / SPC ) × 100 % , where AC and SPC are the TC obtained under actual/true case and SP, respectively.
From Section 1, we adapt the items shown in Table 3 to evaluate the SFSCM model for pharmacies and FNS, which were consulted with decision-makers from these organizations. Such items were answered on a Likert scale considering products and categories plausible of an inventory mix of the organization, such as dairy, fruit, grocery, meat, or vegetable for FNS; and drug for pharmacies, with the following rating scale: 1 = Totally disagree, 2 = Disagree, 3 = Neither agree nor disagree, 4 = Agree, and 5 = Totally agree.
We use distinct pieces of information or items to evaluate the SFSCM performance, the minimum covariance in establishing MCDM weights, and the relative importance order of each item criterion for a successful factor performance. Thus, we assure that any unconsidered epistemic uncertainty would not impact the performance of estimates computed under the key concept of a compromise solution among such distinct methods and their underlying assumptions. With respect to alternative ranking, we utilize: (i) the COPRAS method for stating utility functions [51]; (ii) the TOPSIS method for considering ideal solutions from a matrix X formed of m alternatives (5 levels of Likert scale) and n = 1 criterion, with the highest score being “+” [52]; and (iii) the VIKOR method for considering trade-off between consensus and regret functions [53]. As criteria weighting, we employ: (iv) the SWARA method for considering the relative efficiency of each criterion [54]; and (v) the AHP method for running a pairwise comparison between criteria [55].

2.3. RoCo MCDM Supply Chain Management Score

Let F { f k } k { 1 , , K } be a set formed by K MCDM models used for ranking, such as TOPSIS, VIKOR, and COPRAS. For all k { 1 , , K } , each function f k F associated with such MCDM models returns, as an output, a vector of performance scores p k containing values for each of the m alternatives. Each function uses as inputs a weight vector w with values for the n criteria, an m × n matrix R of normalized criterion values for each alternative, and a vector s with the sign description for each of the n criteria. Hence, we obtain f k ( w , R , s ) = p k . Further, let G { g l } l { 1 , , L } be a set formed by L distinct MCDM models employed for criteria weighting, such as AHP and SWARA. For all l { 1 , , L } , each function g l G associated with such MCDM models returns, as an output, a vector of weights w l containing values for each of the n criteria; and as an input, an m × n matrix X of original criterion values for each alternative, which can be eventually normalized into an R matrix depending on the method. Therefore, we have g l ( X ) = w l or g l ( R ) = w l .
Let W be a vector of length K denoting the weights for each function f k F . Heuristic genetic algorithms [49] can be used to solve the RoCo non-linear program in terms of the optimal values of W = ( W 1 , , W K ) and w = ( w 1 , , w n ) , such as:
min W Cov ( f 1 ( w , R , s ) , , f K ( w , R , s ) ) ,
subject to:
w . min w w . max , k = 1 K W k = 1 , i = 1 n w i = 1 ,
where the objective function stated in (5) represents the weighted covariance matrix of the performance computed using each MCDM model in F . Additionally, w . min and w . max are vectors of length n computed, respectively, by min { g 1 ( X ) or g 1 ( R ) , ⋯, g L ( X ) or g L ( R ) } and max { g 1 ( X ) or g 1 ( R ) , , g L ( X ) or g L ( R ) } , that is, they represent the minimal and maximal weights obtained using the MCDM models in G for each criterion. Constraints expressed in (6) indicate that all MCDM model and criterion weights sum up to one.

2.4. A Model of Relationships

We propose a regression to relate savings of inventory TC (in %) and RoCo MCDM SFSCM score in supply chain for FNS and pharmacies formulated as
Δ 1 , 2 , 3 = β 0 + β 1 SF 1 + β 2 SF 2 + β 3 SF 3 + u 1 , 2 , 3 ,
where Δ 1 , 2 , 3 is the response (saving of TC in %) for a product (level 1) that belongs to a category (level 2) and an organization (level 3). Note that β 0 is the intercept of the multilevel relationships, SF j is associated with the jth column of the matrix of exogenous and endogenous covariates to success factors in supply, defined as SF 1 product { RoCo MCDM SFSCM score } ; SF 2 category { 1 : = dairy ; 2 : = vegetable ; 3 : = meat ; 4 : = grocery ; 5 : = fruit ; 6 : = drug } ; and SF 3 organization { 0 : = FNS ; 1 : = pharmacy } . Additionally, note that β 1 , β 2 and β 3 are slopes in each multilevel of analysis, whereas u 1 , 2 , 3 is the model random error.
Estimation of multilevel models (with a maximum of three levels) was presented in [42] employing the GMSM approach. This approach controls endogeneity at higher levels in the data hierarchy. For a three-level model, endogeneity can be handled either if present at Level 2, at Level 3, or both levels. Level 1 endogeneity, where the covariates are correlated with the structural errors (errors at Level 1), is not addressed.
Note that random slopes cannot be endogenous. In addition, the response must follow a continuous distribution. The approach returns the coefficient estimates obtained with fixed-effects, random-effects, and the GMSM estimator, such that a comparison across models may be carried out. Asymptotically, the multilevel GMSM estimators share the same properties as the corresponding fixed-effects estimators, but they allow the estimation of all variables in the model, unlike the fixed-effects counterpart. To facilitate the choice of the estimator to be used for the obtained data, the approach also conducts with omitted variables based on the Hausman test for panel data [56].

3. Application of the Case Study

In this section, we apply our methodology to a case study.

3.1. Example of the Case Study

In our case study, we consider 79 organizations corresponding to 51 FNS and 28 pharmacies. We state the cost parameters necessary to apply an SP approach in two stages and to form a dataset related to saving of inventory TC (in %) from these organizations. The formed dataset considers 28 observations for the product category “drug” in pharmacies, whereas for FNS we have 12 observations for grocery, 10 for meat, 10 for fruit, 10 for vegetable, and 9 for dairy products. To show the hypothesized multilevel relationships, we collect a data sample for the convenience of the daily demand patterns of products over two months.

3.2. Data Collection

To collect the data mentioned in Section 3.1, we design a computer application divided into three components as follows:
  • Stock movement capture and interoperability module: This is responsible for the exchange of data between the proposed and inventory systems. To develop this module, an MSD was stated to carry out interoperability and implementation considering an API. Such an interface employs HTTPS, but the data are represented with JSON. This module is also responsible for backup of the data. The module records each stock movement to obtain predictions that feed the optimization model. This model delivers the final results and serves as an input for the inventory management module.
  • Intelligent inventory management module: This is in charge of the data analytics, scenario generation, and application of prediction and optimization models. It was necessary to use data analysis tools, such as Python and/or R, for developing this module that implements the selection of demand prediction models and optimizes some computational complements. The execution time of the optimization models is usually high, so that plug-ins, such as CPLEX, Gurobi, and PuLP, were required to reduce such times, allowing an efficient product to be given to the end user.
  • Knowledge generation module for management: Employing the data collected and the results obtained when the models are applied, the information generated is presented to decision-makers through dashboards and consolidated reports.
Figure 2 shows a scheme of the computer application to register system demands and costs of products and to forecast stochastic lot sizes in pharmacies and FNS.

3.3. Exploratory Data Analysis

Table 4 and Table 5 report the descriptive statistics for saving of inventory cost (in %) by organizations and categories, respectively. The savings for each product were obtained by applying the proposed methodology summarized in Figure 1 of Section 2.
Boxplots shown in Figure 3 summarize descriptive measures, in addition to intuiting the shape and symmetry of the statistical distribution of the variable saving of inventory cost (in %) by organizations and categories, with cases {#19, #47, #48} and {#19, #29, #54} being identified as outliers, respectively.
The scatterplots shown in Figure 4 and Figure 5 compare the values taken by the MCDM RoCo SFSCM score (expressed as a proportion between zero and one) expressed along the x-axis, and the savings of inventory cost (in %) sketched along the y-axis, considering a dataset segmented by organization and products, respectively. The resulting graph enables us to visually identify the possible correlation between the two variables considering the organization data subset and the product data subset, respectively.
The boxplots shown in Figure 6 explore the criteria weights for items (first panel) and the MCDM weights (second panel) that form the MCDM RoCo SFSCM score in the study. From this figure, note that items 7 to 9 of Table 3 have higher weights compared to the other items. Furthermore, COPRAS tends to obtain higher weights than TOPSIS and VIKOR, while VIKOR presents a high variability. We identify cases {#10} and {#7, #8} as outliers for criteria and MCDM weights, respectively.

3.4. Confirmatory Data Analysis

Table 6 reports the results of the correlation test between cost saving (in %) and the MCDM RoCo SFSCM score (between zero and one) of the full dataset and segmented by organization and category. Note that the correlations with statistical significance (p-value < 0.05 ) are given with a negative coefficient for the entire dataset, but it is positive for FNS in the organizations, and meat and grocery in the categories.
After testing several models of relationships, we show the final random-effects model considering multilevel and endogeneity. Here, the saving of inventory cost (in %) is modeled in response to Score.MCDM_Scores.RoCo considered as an endogenous variable under the notation: endo ( Score . MCDM _ Scores . RoCo ) . Additionally, the exogenous dummy variables correspond to belonging to organization and product, whereas the intercepts at Level 2 category and Level 3 organization are denoted as (1 category ) and (1 organization ), respectively. These results are displayed in Table 7.
The following tests corroborate the robustness of our findings. The omitted variable test between Level 2 fixed-effects and Level 2 GMSM shows that the null hypothesis of Level 2 with no omitted effects is accepted (with a p-value being very high); see Table 8. In case of wrongly assuming that an endogenous variable is exogenous, the random effects, as well as the GMSM estimators, are biased since the former is constructed using the wrong set of internal instrumental variables. Consequently, comparing the results of the omitted variable tests, they indicate whether the variable is indeed endogenous or not. To conclude the test, the results at Level 2/3 GMSM versus random effects in these levels (with a p-value being very high) provide support that the random effects should be used, and that effectively the main component of success factors are the endogenous variables.

4. Results, Implications, Conclusions, Limitations, and Future Work

4.1. Scope of Results and Findings

Although the general correlation between the variables under study was negative, the finding of a positive regression coefficient in the multilevel model with endogeneity can be explained. Additionally, given the results shown in Figure 6, we checked that items 7, 8, and 9, defined in Table 3 related to using technologies for data management, are most weighted in calculating the MCDM RoCo SFSCM score for the organizations. In accordance with our finding that this variable is endogenous, and with the results provided in [2], we showed that investment in information technology, acceleration of transactions, provision of product information by the entire supply chain, along with integration of supply data with purchasing systems, reduces the processing errors and inventory management becomes more efficient, leading to greater savings of inventory total costs. In addition, given the results shown in Figure 6, we see that the decision model that has the greatest weight to construct the MCDM RoCo SFSCM score in these organizations is COPRAS. According to [51], this is a simple and straightforward method that determines rank from different angles, considering the nature of criteria during rank calculation, which determines the direction of the relationship found.
In this work, we also corroborated that the possibility of finding saving differences in total costs of inventory varies according to the performance achieved by each type of organization [5]. In our case, the level of strategic development, especially in the area of technological management of data and helpful information for supply, is much higher in the pharmaceutical sector. This would explain why the savings of inventory total costs decrease when this type of organization is considered (statistical significance of 7%), validating the use of random effects for calculating intercepts by organization. Much influenced by the above, it is that when the product category is a drug, the savings of inventory total costs also decrease (statistical significance of 11%). However, it seems that the random effect of considering multiple product categories to establish intercepts is not plausible to be demonstrated with our data.

4.2. Managerial Implications

Below, we present specific action plans based on the case study results of this research, which may be beneficial to pharmacy and food service logistics decision-makers:
  • In general, the savings obtained in total cost of inventories are greater in organizations where there are low levels of development for their supply chain management. However, in product categories, such as meat and grocery, which achieve better development in their supply chain management, this association seems to be better performed. This is corroborated in [57,58]. Then, it is expected that, as a supply chain of some category of a specific product reaches a critical point of operational “maturity”, it will be a determinant of the total cost savings from its inventory management.
  • Our MCDM RoCo SFSCM score summarizes information helpful and determines a measure of success in supply chain management for a specific inventory item.
  • To establish relationships between variables, it is important to consider suitable models. In our case, multilevels and endogeneity/simultaneity of relationships were used. The Rendo package of R contains the statistical tools (summary function) to determine the correct specification of the model to be tested, by comparing robust and efficient estimators at different levels under the hypothesis of no omission of variables.

4.3. Conclusions

The main conclusions of the case study are the following:
  • The analysis of our main result shown in Table 7 indicates that the MCDM RoCo SFSCM score for pharmacy and FNS are positively related to the savings obtained from stochastic inventory models.
  • Using the GMSM method, we confirm that the MCDM RoCo SFSCM scores are endogenous variables with respect to savings of inventory total costs.
Through our findings, we intend to contribute to developing knowledge for decision-makers, as well as to clarify ways of working in the academic field of operations and management research with a mathematical basement.

4.4. Study Limitations

We report some limitations of our study as follows:
  • Note that considering a larger sample will permit us to report more reliable conclusions statistically, about the relationship between performance of supply chain management illustrated through the savings of inventory total costs.
  • It is possible that the results in the relationships found are strongly dependent on the type of industry in which the studies are carried out.
  • Another limitation that we can state is recognizing that the computer application developed in this research is not formally validated and verified, since it is in the pilot stage to later become a software prototype.

4.5. Future Studies

Research arising from the present study is proposed as follows:
  • Incorporation in the modeling of temporal and spatial structures, as well as partial least squares and mixture models, are suitable to be studied and can improve the predictive capability of the statistical part of the model [59,60,61,62,63].
  • Other applications in the context of multivariate methods are in cluster analysis and principal component analysis, particularly when using principal components to remove the collinearity among covariates [64].
The methodology used in this applied investigation provides options to explore other theoretical and numerical aspects related, which are in progress and we hope to report them in future articles.

Author Contributions

Data curation, F.R., M.H., and C.M.-B.; methodology, F.R., P.W., M.H., V.L., and C.M.-B.; writing—original draft, F.R., P.W., M.H., and C.M.-B.; writing—review and editing, V.L. All authors have read and agreed to the published version of the manuscript.

Funding

Research of F.R. was supported by Center of Micro-Bioinnovation, Faculty of Pharmacy, Universidad de Valparaiso, Chile. In addition, this research was partially supported by FONDECYT, project grant number 11190004 (F.R.) and 1200525 (V.L. and M.H.), from the National Agency for Research and Development (ANID) of the Chilean government.

Institutional Review Board Statement

Not applicable.

Informed Consent Statement

Not applicable.

Data Availability Statement

The data and R codes used to support the findings of this study are available from the corresponding author upon request.

Acknowledgments

The authors would also like to thank the reviewers for their constructive comments which led to improve the presentation of the manuscript.

Conflicts of Interest

The authors declare no conflict of interest.

References

  1. Young, R.; Esqueda, P. Supply chain vulnerability: Considerations of the case of Latin America. ARLA Acad. Rev. Latinoam. Adm. 2005, 34, 63–77. [Google Scholar]
  2. Moons, K.; Waeyenbergh, G.; Pintelon, L. Measuring the logistics performance of internal hospital supply chains—A literature study. Omega 2019, 82, 205–217. [Google Scholar] [CrossRef]
  3. Wanke, P.; Ewbank, H.; Leiva, V.; Rojas, F. Inventory management for new products with triangularly distributed demand and lead-time. Comput. Oper. Res. 2016, 69, 97–108. [Google Scholar] [CrossRef]
  4. De Vries, J. Diagnosing inventory management systems: An empirical evaluation of a conceptual approach. Int. J. Prod. Econ. 2007, 108, 63–73. [Google Scholar] [CrossRef]
  5. Madhani, P.M. Strategic supply chain management for enhancing competitive advantages: Developing business value added framework. Int. J. Value Chain. Manag. 2019, 10, 316–338. [Google Scholar] [CrossRef]
  6. Saha, E.; Ray, P.K. Modelling and analysis of inventory management systems in healthcare: A review and reflections. Comput. Ind. Eng. 2019, 137, 106051. [Google Scholar] [CrossRef]
  7. Danas, K.; Roudsari, A.; Ketikidis, P.H. The applicability of a multi-attribute classification framework in the healthcare industry. J. Manuf. Technol. Manag. 2006, 17, 772–785. [Google Scholar] [CrossRef]
  8. Akbar, M.A.; Leiva, V.; Rafi, S.; Qadri, S.F.; Mahmood, S.; Alsanad, A. Towards roadmap to implement blockchain in healthcare systems based on a maturity model. J. Softw. Evol. Proc. 2022. [Google Scholar] [CrossRef]
  9. Burns, L.R. The Health Care Value Chain: Producers, Purchasers, and Providers; Jossey-Bass: San Francisco, CA, USA, 2002. [Google Scholar]
  10. Morillo, M. Service costs for food and beverage in hostels. Vis. Gerenc. 2009, 2, 304–327. [Google Scholar]
  11. Fathollahi-Fard, A.M.; Ahmadi, A.; Karimi, B. Sustainable and robust home healthcare logistics: A response to the COVID-19 pandemic. Symmetry 2022, 14, 193. [Google Scholar] [CrossRef]
  12. Delgado, E.J.; Cabezas, X.; Martin-Barreiro, C.; Leiva, V.; Rojas, F. An equity-based optimization model to solve the location problem for healthcare centers applied to hospital beds and COVID-19 vaccination. Mathematics 2022, 10, 1825. [Google Scholar] [CrossRef]
  13. Cabezas, X.; García, S.; Martin-Barreiro, C.; Delgado, E.; Leiva, V. A two-stage location problem with order solved using a Lagrangian algorithm and stochastic programming for a potential use in COVID-19 vaccination based on sensor-related data. Sensors 2021, 21, 5352. [Google Scholar] [CrossRef] [PubMed]
  14. Fathollahi-Fard, A.M.; Hajiaghaei-Keshteli, M.; Tavakkoli-Moghaddam, R. Bi-level programming for home health care supply chain considering outsourcing. J. Ind. Inf. Integr. 2022, 25, 100246. [Google Scholar] [CrossRef]
  15. Rojas, F.; Leiva, V.; Wanke, P.; Marchant, C. Optimization of contribution margins in food services by modeling independent component demand. Rev. Colomb. Estad. 2015, 38, 1–30. [Google Scholar] [CrossRef]
  16. Rojas, F.; Leiva, V. Inventory management in food companies with demand statistically dependent. ARLA Acad. Rev. Latinoam. Adm. 2016, 29, 450–485. [Google Scholar] [CrossRef]
  17. Rojas, F.; Leiva, V.; Wanke, P.; Lillo, C.; Pascual, J. Modeling lot-size with time-dependent demand based on stochastic programming and case study of drug supply in Chile. PLoS ONE 2019, 14, e0212768. [Google Scholar]
  18. Rojas, F.; Wanke, P.; Bravo, F.; Tan, Y. Inventory pooling decisions under demand scenarios in times of COVID-19. Comput. Ind. Eng. 2021, 161, 107591. [Google Scholar] [CrossRef]
  19. Rojas, F.; Leiva, V.; Huerta, M.; Martin-Barreiro, C. Lot-size models with uncertain demand considering its skewness/kurtosis and stochastic programming applied to hospital pharmacy with sensor-related COVID-19 data. Sensors 2021, 21, 5198. [Google Scholar] [CrossRef]
  20. Gilbert, K. An ARIMA supply chain model. Manag. Sci. 2005, 51, 305–310. [Google Scholar] [CrossRef]
  21. Nikolopoulos, K.; Syntetos, A.A.; Boylan, J.; Petropoulos, F.; Assimakopoulos, V. An aggregate-disaggregate intermittent demand approach (ADIDA) to forecasting: An empirical proposition and analysis. J. Oper. Res. Soc. 2011, 62, 544–554. [Google Scholar] [CrossRef]
  22. McCullagh, P.; Nelder, J.A. Generalized Linear Models; Chapman and Hall: London, UK, 1983. [Google Scholar]
  23. Box, G.E.P.; Jenkins, G.M.; Reinsel, G.C.; Ljung, G.M. Time Series Analysis: Forecasting and Control; Wiley: Hoboken, NJ, USA, 2015. [Google Scholar]
  24. Wanke, P.; Leiva, V. Exploring the potential use of the Birnbaum-Saunders distribution in inventory management. Math. Probl. Eng. 2015, 2015, 827246. [Google Scholar] [CrossRef]
  25. Gurumurthy, A.; Nair, V.K.; Vinodh, S. Application of a hybrid selective inventory control technique in a hospital: A precursor for inventory reduction through lean thinking. TQM J. 2021, 33, 568–595. [Google Scholar] [CrossRef]
  26. Raa, B.; Aghezzaf, H. A robust dynamic planning strategy for lot-sizing problems with stochastic demands. J. Intell. Manuf. 2005, 16, 207–213. [Google Scholar] [CrossRef]
  27. Kall, P.; Wallace, S.W.; Kall, P. Stochastic Programming; Springer: New York, NY, USA, 1994. [Google Scholar]
  28. Singh, R.; Dwivedi, A.D.; Srivastava, G. Internet of things based blockchain for temperature monitoring and counterfeit pharmaceutical prevention. Sensors 2020, 20, 3951. [Google Scholar] [CrossRef]
  29. Toba, S.; Tomasini, M.; Yang, Y.H. Supply chain management in hospital: A case study. Calif. J. Oper. Manag. 2008, 6, 49–55. [Google Scholar]
  30. Albarune, A.R.B.; Farhat, N.; Afzal, F. Valued supply chain for integrated hospital management: A conceptual framework. Int. J. Supply Chain. Manag. 2015, 4, 39–49. [Google Scholar]
  31. Feibert, D.C.; Jacobsen, P. Measuring process performance within healthcare logistics-a decision tool for selecting track and trace technologies. Acad. Strateg. Manag. J. 2015, 14, 33. [Google Scholar]
  32. Moon, S. Taking cost off supply shelf. Healthcare turning to supply chain management techniques honed by retail, manufacturing to limit inventory, slash expenses. Mod. Healthc. 2004, 34, 26. [Google Scholar]
  33. Chai, J.; Liu, J.N.; Ngai, E.W. Application of decision-making techniques in supplier selection: A systematic review of literature. Expert Syst. Appl. 2013, 40, 3872–3885. [Google Scholar] [CrossRef]
  34. Chang, B.; Chang, C.W.; Wu, C.H. Fuzzy DEMATEL method for developing supplier selection criteria. Expert Syst. Appl. 2011, 38, 1850–1858. [Google Scholar] [CrossRef]
  35. Rajesh, R.; Ravi, V. Supplier selection in resilient supply chains: A grey relational analysis approach. J. Clean. Prod. 2015, 86, 343–359. [Google Scholar] [CrossRef]
  36. Stewart, T.J.; Durbach, I. Dealing with uncertainties in MCDA. In Multiple Criteria Decision Analysis; Springer: New York, NY, USA, 2016; pp. 467–496. [Google Scholar]
  37. Baltacioglu, T.; Ada, E.; Kaplan, M.D.; Yurt And, O.; Cem Kaplan, Y. A new framework for service supply chains. Serv. Ind. J. 2007, 27, 105–124. [Google Scholar] [CrossRef]
  38. Liyanage, L.H.; Shanthikumar, J.G. A practical inventory control policy using operational statistics. Oper. Res. Lett. 2005, 33, 341–348. [Google Scholar] [CrossRef]
  39. Henningsen, A.; Hamann, J.D. Systemfit: A package for estimating systems of simultaneous equations in R. J. Stat. Softw. 2007, 23, 1–40. [Google Scholar] [CrossRef]
  40. Farebrother, R.W. Linear Least Squares Computations; Routledge: Oxfordshire, UK, 2018. [Google Scholar]
  41. Antonakis, J.; Bastardoz, N.; Rönkkö, M. On ignoring the random effects assumption in multilevel models: Review, critique, and recommendations. Organ. Res. Methods 2021, 24, 443–483. [Google Scholar] [CrossRef]
  42. Kim, J.S.; Frees, E.W. Multilevel modeling with correlated effects. Psychometrika 2007, 72, 505–533. [Google Scholar] [CrossRef]
  43. Angrist, J.D.; Pischke, J.S. Mostly Harmless Econometrics: An Empiricist’s Companion; Princeton University Press: Princeton, NJ, USA, 2008. [Google Scholar]
  44. Marra, G.; Radice, R. A flexible instrumental variable approach. Stat. Model. 2011, 11, 581–603. [Google Scholar] [CrossRef]
  45. Gui, R.; Meierer, M.; Algesheimer, R. REndo: An R package to address endogeneity without external instrumental variables. J. Stat. Soft. 2022. in press. Available online: https://papers.ssrn.com/sol3/papers.cfm?abstract_id=3974740 (accessed on 8 July 2022).
  46. Shakouhi, F.; Tavakkoli-Moghaddam, R.; Baboli, A.; Bozorgi-Amiri, A. Multi-objective programming and six-sigma approaches for a competitive pharmaceutical supply chain with the value chain and product lifecycle. Environ. Sci. Pollut. Res. 2022. [Google Scholar] [CrossRef]
  47. Dorfeshan, Y.; Tavakkoli-Moghaddam, R.; Jolai, F.; Mousavi, S.M. New data-driven and knowledge-driven multi-criteria decision-making method. J. Data Min. 2021, 9, 543–554. [Google Scholar]
  48. Feng, Y.; Hong, Z.; Tian, G.; Li, Z.; Tan, J.; Hu, H. Environmentally friendly MCDM of reliability-based product optimisation combining DEMATEL-based ANP, interval uncertainty and vise kriterijumska optimizacija kompromisno resenje (VIKOR). Inf. Sci. 2018, 442, 128–144. [Google Scholar]
  49. Mullen, K.M.; Ardia, D.; Gil, D.L.; Windover, D.; Cline, J. DEoptim: An R package for global optimization by differential evolution. J. Stat. Softw. 2011, 40, 1–26. [Google Scholar] [CrossRef]
  50. Infanger, G.; Morton, D.P. Cut sharing for multistage stochastic linear programs with interstage dependency. Math. Program. 1996, 75, 241–256. [Google Scholar] [CrossRef]
  51. Zheng, Y.; Xu, Z.; He, Y.; Liao, H. Severity assessment of chronic obstructive pulmonary disease based on hesitant fuzzy linguistic COPRAS method. Appl. Soft Comput. 2018, 69, 60–71. [Google Scholar] [CrossRef]
  52. Wanke, P.; Barros, C.P.; Chen, Z. An analysis of Asian airlines efficiency with two-stage TOPSIS and MCMC generalized linear mixed models. Int. J. Prod. Econ. 2015, 169, 110–126. [Google Scholar] [CrossRef]
  53. Opricovic, S.; Tzeng, G.H. Compromise solution by MCDM methods: A comparative analysis of VIKOR and TOPSIS. Eur. J. Oper. Res. 2004, 156, 445–455. [Google Scholar] [CrossRef]
  54. Keršuliene, V.; Zavadskas, E.K.; Turskis, Z. Selection of rational dispute resolution method by applying new step-wise weight assessment ratio analysis (SWARA). J. Bus. Econ. Manag. 2010, 11, 243–258. [Google Scholar] [CrossRef]
  55. Partovi, F.Y. Determining what to benchmark: An analytic hierarchy process approach. Int. J. Oper. Prod. Manag. 1994, 14, 25–39. [Google Scholar] [CrossRef]
  56. Sharma, P.; Singh, A.K.; Leiva, V.; Cabezas, X.; Martin-Barreiro, C. Modern multivariate statistical methods for evaluating the impact of WhatsApp on academic performance: Methodology and case study in India. Appl. Sci. 2022, 12, 6141. [Google Scholar] [CrossRef]
  57. Vallandingham, L.R.; Yu, Q.; Sharma, N.; Strandhagen, J.W.; Strandhagen, J.O. Grocery retail supply chain planning and control: Impact of consumer trends and enabling technologies. IFAC-PapersOnLine 2018, 51, 612–617. [Google Scholar] [CrossRef]
  58. Golini, R.; Moretto, A.; Caniato, F.; Caridi, M.; Kalchschmidt, M. Developing sustainability in the Italian meat supply chain: An empirical investigation. Int. J. Prod. Res. 2017, 55, 1183–1209. [Google Scholar] [CrossRef]
  59. Huerta, M.; Leiva, V.; Liu, S.; Rodriguez, M.; Villegas, D. On a partial least squares regression model for asymmetric data with a chemical application in mining. Chemom. Intell. Lab. Syst. 2019, 190, 55–68. [Google Scholar] [CrossRef]
  60. Saulo, H.; Leao, J.; Leiva, V.; Aykroyd, R.G. Birnbaum-Saunders autoregressive conditional duration models applied to high-frequency financial data. Stat. Pap. 2019, 60, 1605–1629. [Google Scholar] [CrossRef]
  61. Garcia-Papani, F.; Leiva, V.; Uribe-Opazo, M.A.; Aykroyd, R.G. Birnbaum-Saunders spatial regression models: Diagnostics and application to chemical data. Chemom. Intell. Lab. Syst. 2018, 177, 114–128. [Google Scholar] [CrossRef]
  62. Balakrishnan, N.; Gupta, R.; Kundu, D.; Leiva, V.; Sanhueza, A. On some mixture models based on the Birnbaum-Saunders distribution and associated inference. J. Stat. Plan. Inference 2011, 141, 2175–2190. [Google Scholar] [CrossRef]
  63. Kotz, S.; Leiva, V.; Sanhueza, A. Two new mixture models related to the inverse Gaussian distribution. Methodol. Comput. Appl. Probab. 2010, 12, 199–212. [Google Scholar] [CrossRef]
  64. Martin-Barreiro, C.; Ramirez-Figueroa, J.A.; Cabezas, X.; Leiva, V.; Martin-Casado, A.; Galindo-Villardon, M.P. A new algorithm for computing disjoint orthogonal components in the parallel factor analysis model with simulations and applications to real-world data. Mathematics 2021, 9, 2058. [Google Scholar] [CrossRef]
Figure 1. Proposed methodology.
Mathematics 10 02911 g001
Figure 2. Scheme of a computer application to register system demands and costs of products and to forecast stochastic lot sizes in pharmacies and FNS.
Mathematics 10 02911 g002
Figure 3. Boxplot for saving of inventory cost (in %) by organization (first panel) and category (second panel).
Mathematics 10 02911 g003
Figure 4. Scatterplot (first panel) and density plots (second and third panels) for saving of inventory cost (in %) versus MCDM RoCo SFSCM score (expressed as a proportion between zero and one) by organization.
Mathematics 10 02911 g004
Figure 5. Scatterplot (first panel) and density plots (second and third panels) for saving of inventory cost (in %) versus MCDM RoCo SFSCM score (expressed as a proportion between zero and one) by category.
Mathematics 10 02911 g005
Figure 6. Boxplots of criteria weight for items (first panel) and MCDM weight (second panel) that form the MCDM RoCo SFSCM score (expressed as a proportion between zero and one) in the study.
Mathematics 10 02911 g006
Table 1. Abbreviations and acronyms used in the present document.
Abbreviation/AcronymDefinition
AHPAnalytic hierarchy process.
APIApplication programming interface.
ARMAAutoregressive moving average.
COPRASComplex proportional assessment.
DPUTDemand per unit of time.
FNSFood and nutrition services.
GARMAGeneralized autoregressive moving average.
GLMGeneralized linear models.
GMSMGeneralized method of statistical moments.
HTTPSHypertext transfer protocol secure.
JSONJavascript object notation.
MCDMMulti-criteria decision-making.
MLMaximum likelihood.
MSDMinimum set of data.
RoCoRobust compromise.
SFSCMSuccess factors of supply chain management.
SPStochastic programming.
SURSeemingly unrelated regression.
SWARAStep-wise weight assessment ratio analysis.
TCTotal costs.
TOPSISTechnique for order of preference by similarity to ideal solution.
VIKORVlse-kriterijuska optimizacija I komoromisno resenje.
W2SLSWeighted two-stage least squares.
2SLSTwo-stage least squares.
3SLSThree-stage least squares.
Table 2. Definition of coefficients/variables of the optimization model.
Coefficient/VariableDefinition
E ( TC ) Expected total costs of inventory.
Ω Total set of demand scenarios.
ω A particular demand scenario, with ω Ω .
p t ω Probability of occurrence of demand scenario ω in period t.
TTotal number of planning periods.
tA particular period, with t { 1 , , T } .
C t Purchase budget in period t.
u t Unitary cost of purchase in period t.
o t Fixed order cost in period t.
h t Holding cost at the end of period t.
s t Shortage cost at the end of period t.
Z t Binary variable indicating whether a purchase is carried out in period t.
Q t Quantity of units to be purchased in period t.
I t ω Stock level at the end of period t on demand scenario ω .
S t ω Shortage level at the end of period t on demand scenario ω .
I 0 Initial stock level.
y t ω Forecasted DPUT in period t on demand scenario ω .
Table 3. Items and their descriptions adapted from scientific literature to evaluate the SFSCM model in pharmacies and FNS.
ItemDescription
1The actors in the supply chain must operate depending on each other,
with a coordinated chain management for the acquisition.
2The existence of technical data that support the use of a particular raw
material is helpful for decision-making of the service provider.
3The purchase decision and universal adoption of profitable raw materials
for use in FNS/pharmacy must be made by consensus of the supply team.
4For the acquisition of products, the supply chain participants must be
consolidated horizontally so that the pharmacies/FNS are merged with
each other or the systems are unified.
5The development of contractual or strategic alliance relationships with
FNS/pharmacy of the same type allows a provision of products with
greater hierarchical control.
6The collaborative partnership between organizations includes coordinated
production planning, reducing inventory levels and delays in the
availability of the products.
7The investment in updated information technology for the supply and
sourcing of products permits the effective supply chain management.
8The application of new technologies for the acquisition of producers
accelerates transactions, providing product visibility and information
throughout the entire chain.
9Integration and synchronization of supply data with purchasing systems
reduce processing errors.
Table 4. Descriptive statistics for saving of inventory cost (in %) by organization.
OrganizationMeanSDIQRMinimum P 25 P 50 P 75 Maximum
FNS72.4927.4035.910.0059.5181.0095.42100.00
Pharmacy22.751.511.7521.0021.7522.5023.5025.00
where SD denotes the standard deviation, IQR the interquartile range, and P q × 100 the q × 100 th percentile.
Table 5. Descriptive statistics for saving of inventory cost (in %) by category.
CategoryMeanSDIQRMinimum P 25 P 50 P 75 Maximum
Dairy76.6928.5539.8514.8856.0089.4395.8598.00
Drug22.751.511.7521.0021.7522.5023.5025.00
Fruit81.7410.998.8766.0077.5079.0286.37100.00
Grocery57.4835.2761.190.0034.8158.5096.0099.00
Meat86.6616.6615.9745.1783.5388.5099.50100.00
Vegetable63.3128.2520.250.0062.2572.9182.5085.43
Table 6. Pearson product-moment correlation of saving of inventory cost (in %) versus MCDM RoCo SFSCM score (expressed as a proportion between zero and one).
DatasetEstimatet-ValueDFp-Value
Full−0.49−5.0577< 0.001
Pharmacy−0.01−0.06260.94
FNS0.322.40490.02
Drug−0.01−0.06260.94
Fruit−0.44−1.3880.20
Vegetable−0.31−0.9380.38
Meat0.672.5180.04
Dairy−0.49−1.4970.18
Grocery0.612.42100.04
where t-value corresponds to the t-test and DF are the degrees of freedom of the Student-t distribution.
Table 7. Random-effects model considering multilevel and endogeneity: Saving Score . MCDM _ Scores . RoCo + factor . category + factor . organization + ( 1 organization ) + ( 1 category ) endo ( Score . MCDM _ Scores . RoCo ) .
CovariateEstimateStandard Errorz-Valuep-Value
intercept3.5744.480.080.94
Score.MCDM_Scores.RoCo143.9762.522.300.02
factor.organization.[T.pharmacy]−80.0043.76−1.830.07
factor.category.[T.drug]−70.2444.21−1.590.11
factor.category.[T.fruit]7.2631.800.230.82
factor.category.[T.grocery]−15.8131.70−0.500.62
factor.category.[T.meat]11.5131.800.360.72
factor.category.[T.vegetable]−7.2831.90−0.230.82
where z-value corresponds to the test based on the standard normal distribution.
Table 8. Omitted variable test for a random-effects model considering multilevel and endogeneity: Saving Score . MCDM _ Scores . RoCo + factor . category + factor . organization + ( 1 organization ) + ( 1 product ) endo ( Score . MCDM _ Scores . RoCo ) .
VariableDFChi-Square Valuep-Value
GMSM_L2_vs_REF7.000.001.00
GMSM_L3_vs_REF7.000.001.00
FE_L2_vs_REF3.002.000.57
FE_L3_vs_REF2.002.000.37
where chi-square value corresponds to the test and DF are the degrees of freedom of this distribution.
Publisher’s Note: MDPI stays neutral with regard to jurisdictional claims in published maps and institutional affiliations.

