
An Automatic Extraction Method of Rebar Processing Information Based on Digital Image


Abstract
:1. Introduction
2. Related Work
3. Framework for Extracting Rebars’ Processing Information
3.1. Preprocessing of Rebar Detail Drawing
3.2. Grayscale Image Processing
- Maximum priority principle
- The principle of substitution of average values
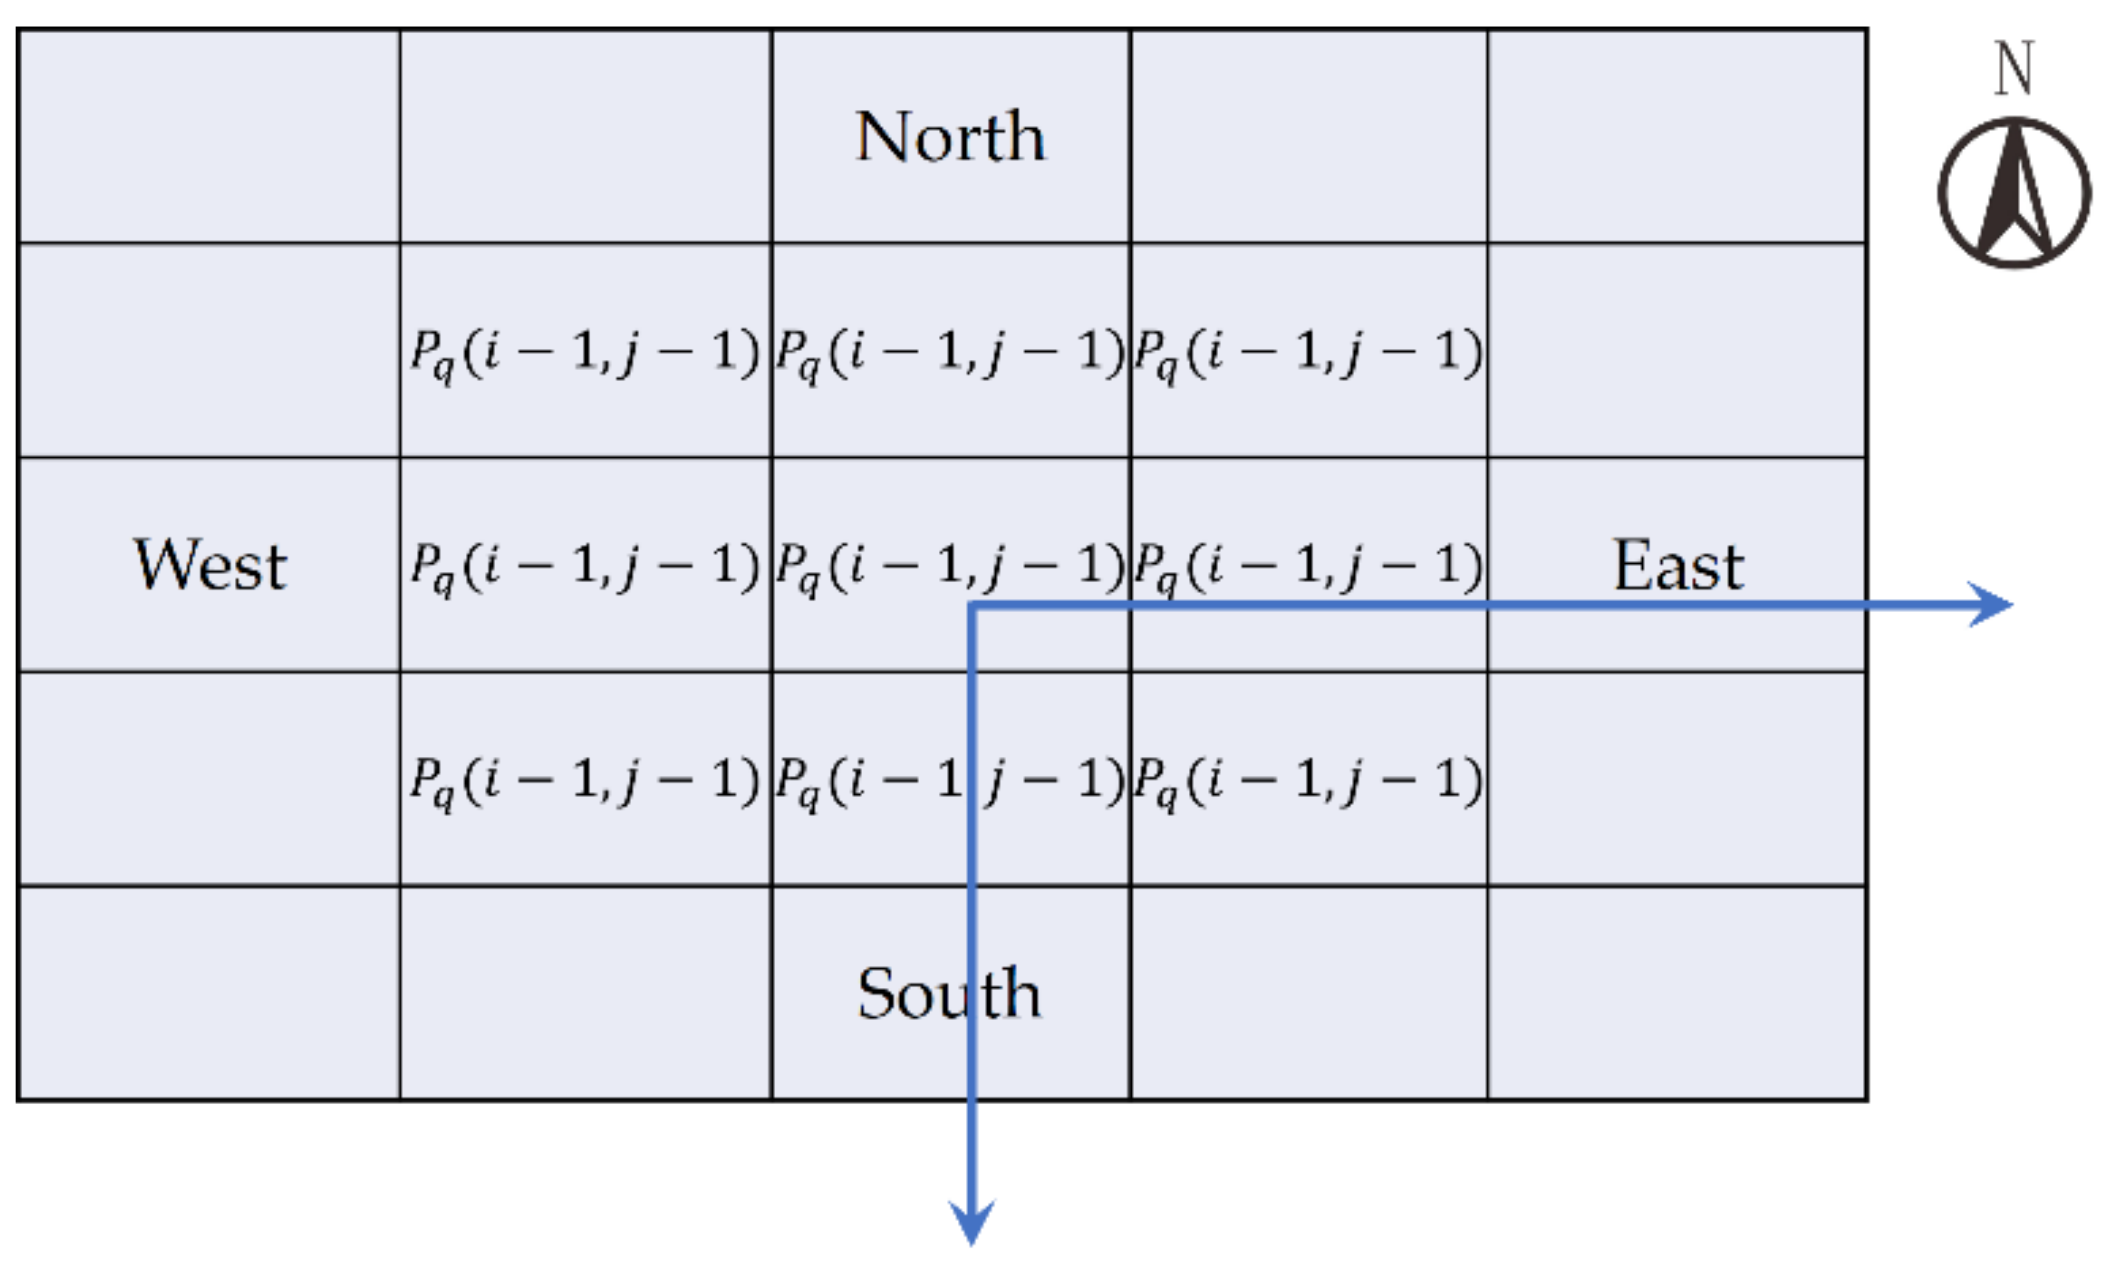
- Weighted Average Substitution Principle
3.3. Binary Image Processing
4. Extraction of the Rebars’ Processing Information
4.1. Design of a Segmentation Algorithm for Feature Regions of the Rebars’ Detail Drawing
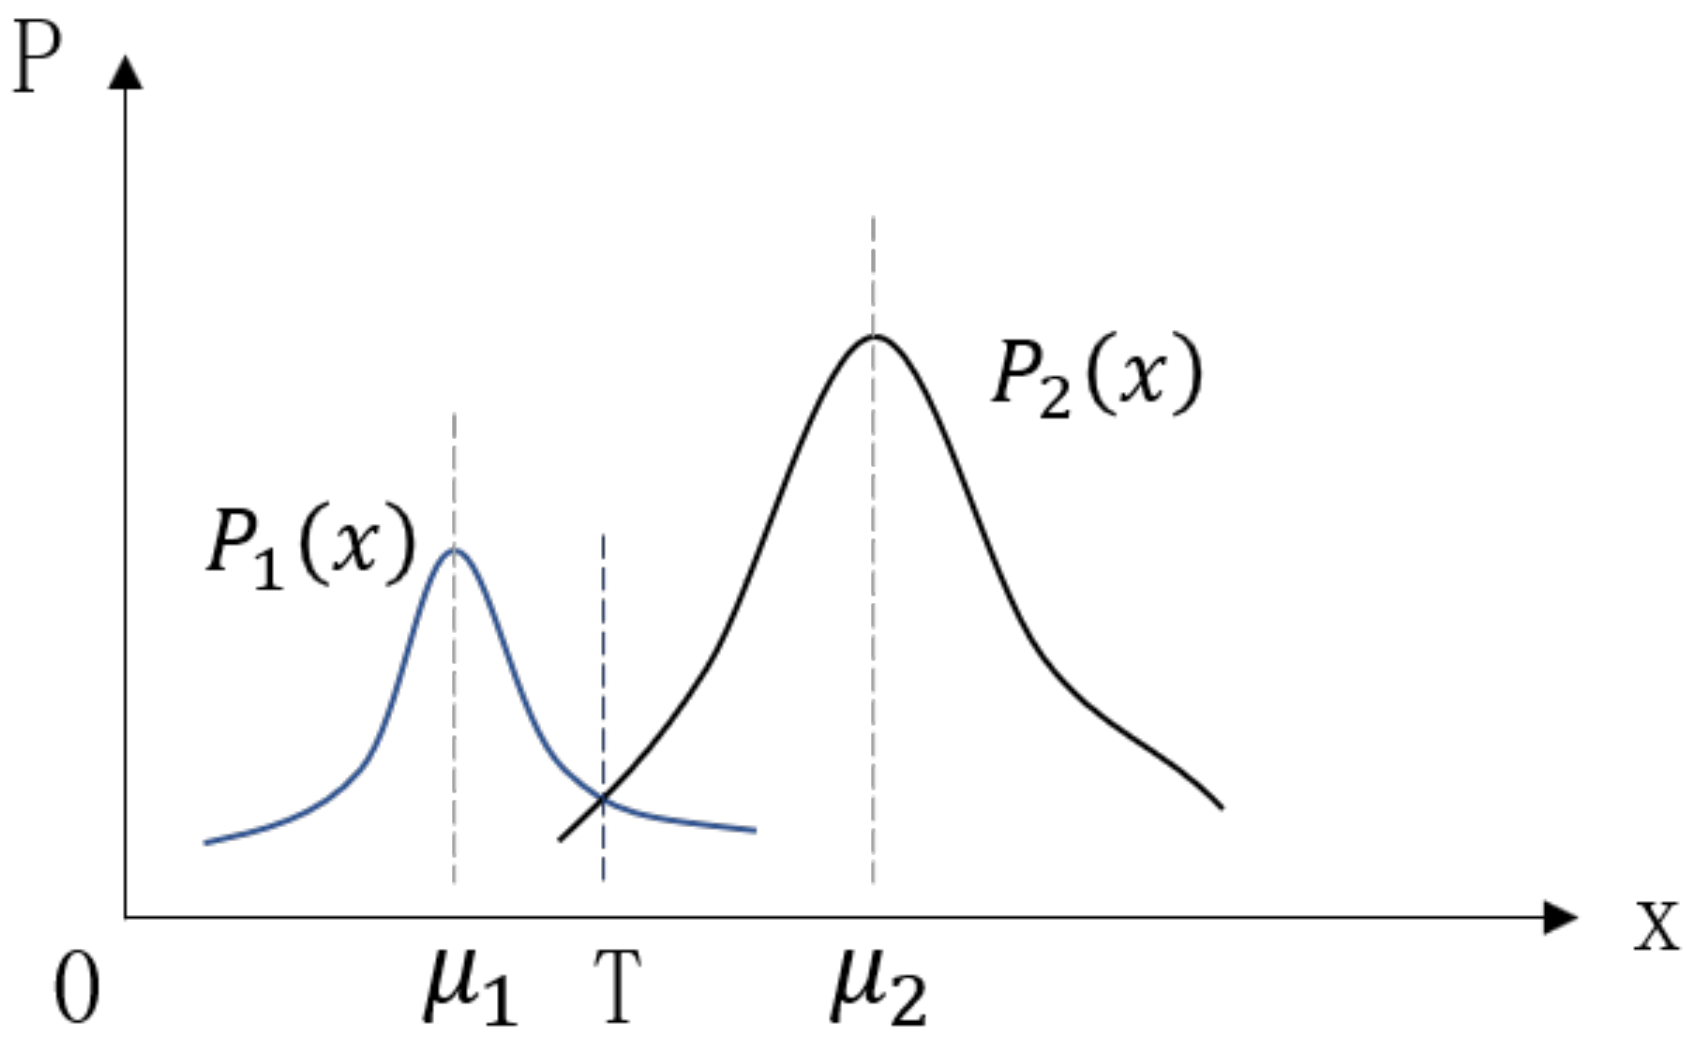
- Image segmentation based on thresholds
- Image segmentation based on edge detection
4.2. Extraction of the Rebar’s Bending Angle Information
4.2.1. Refinement of the Rebar’s Shape Area Image
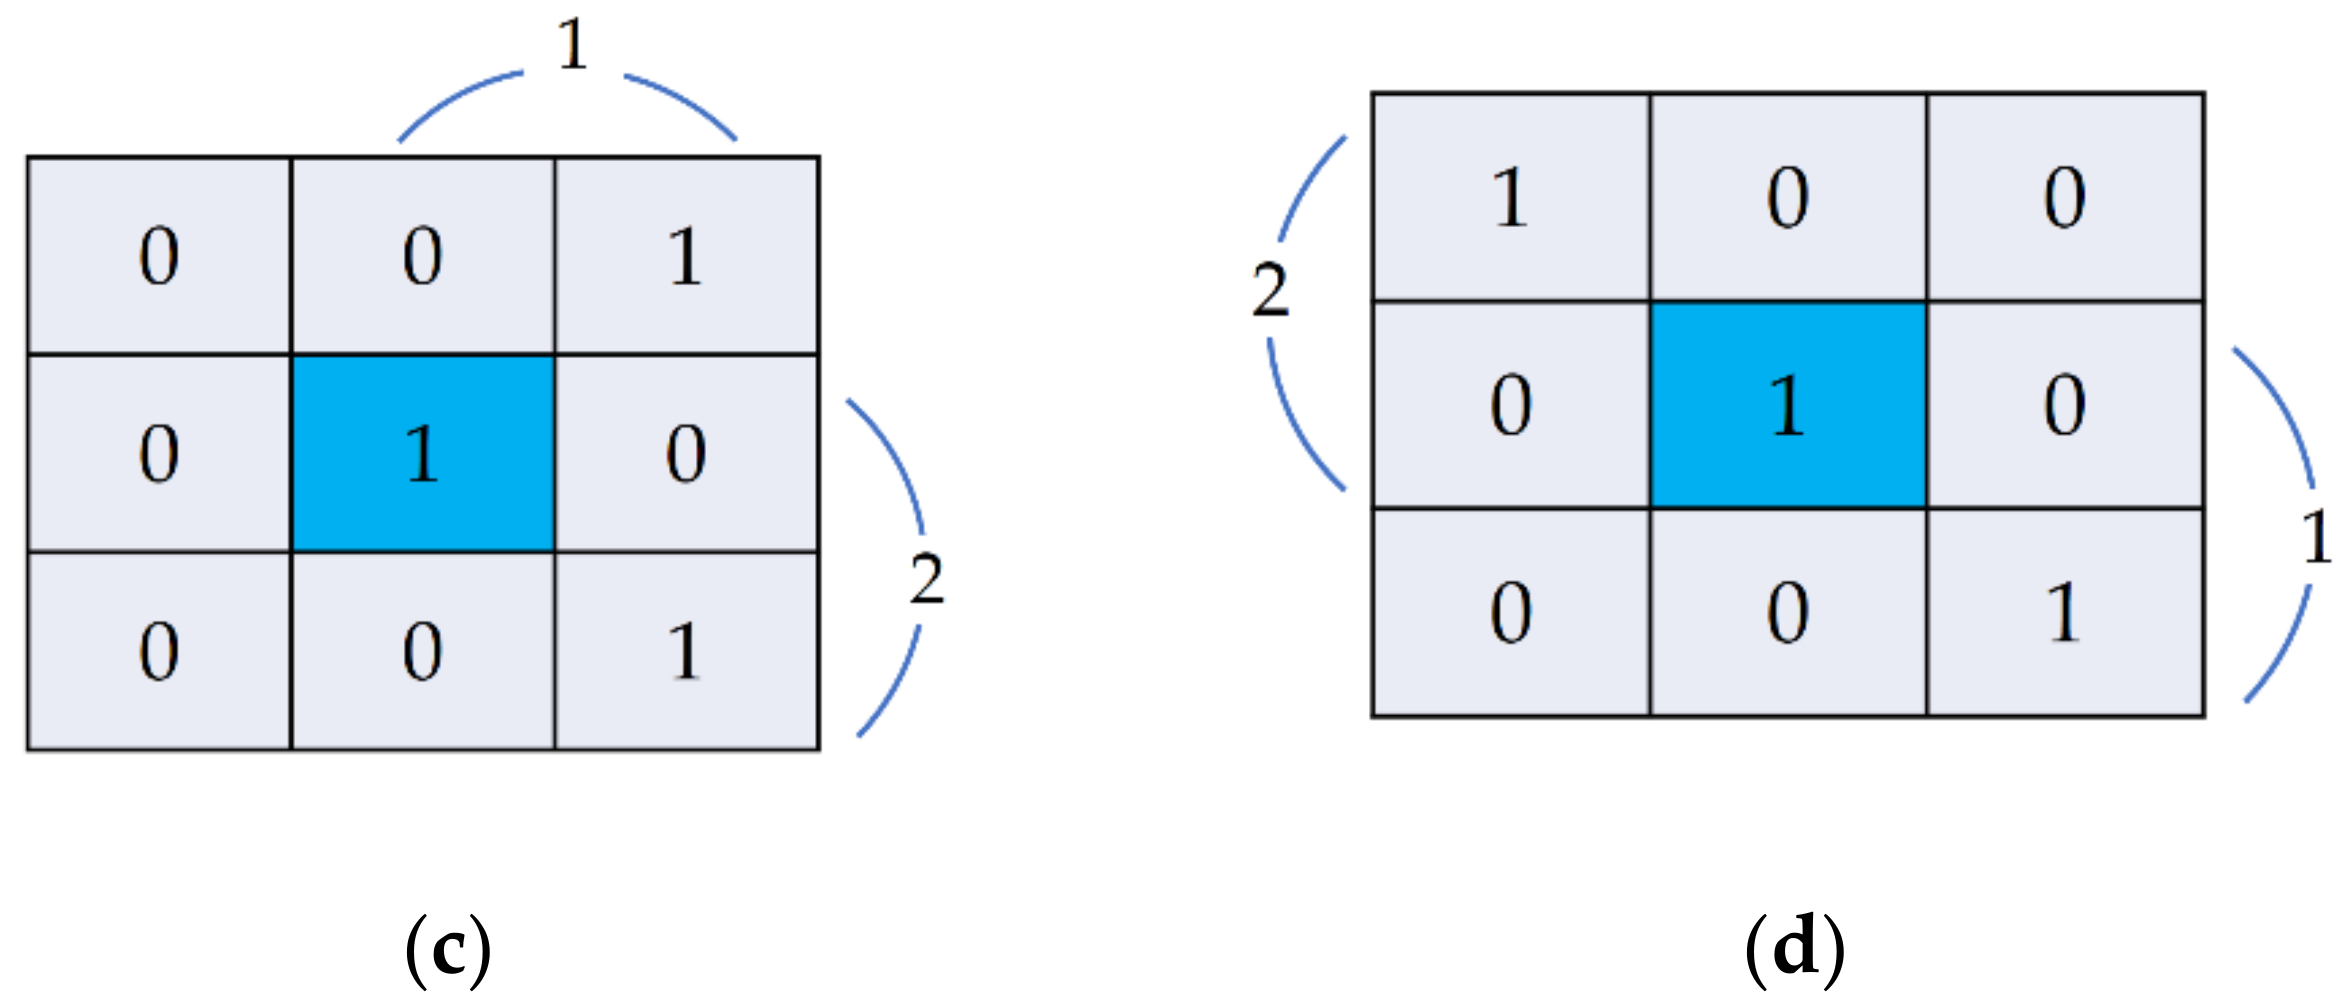
4.2.2. Detection of the Bending Feature Point
- (1)
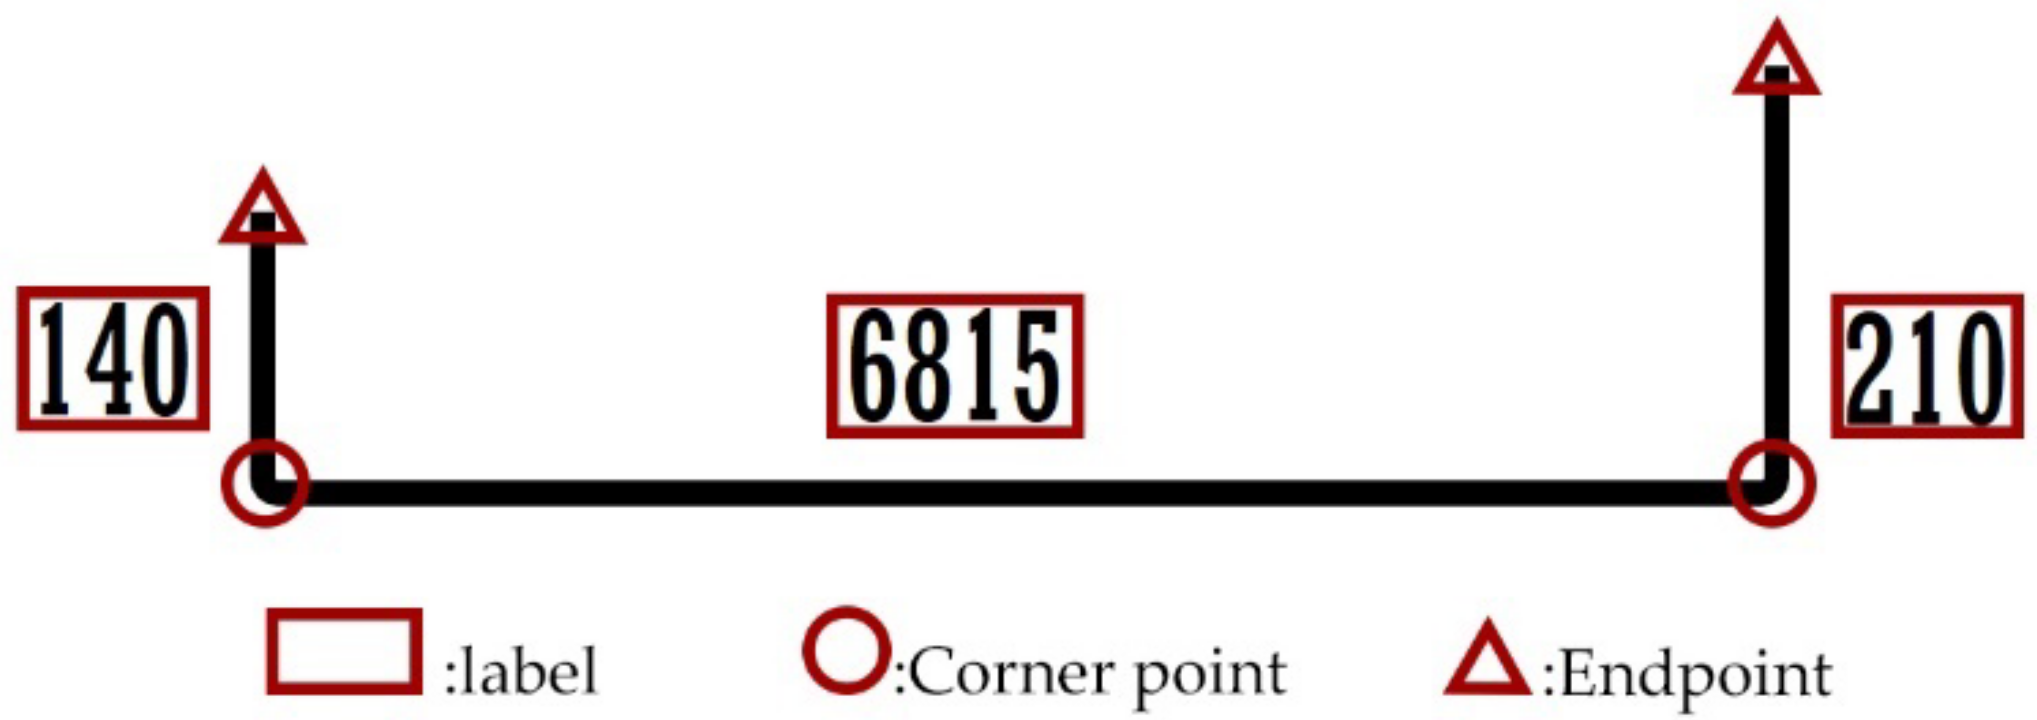
- Traversing pixels, based on the characteristics of the endpoint, are used to obtain the coordinates of the two endpoints. Let the starting coordinate be and the ending coordinate be .
- (2)
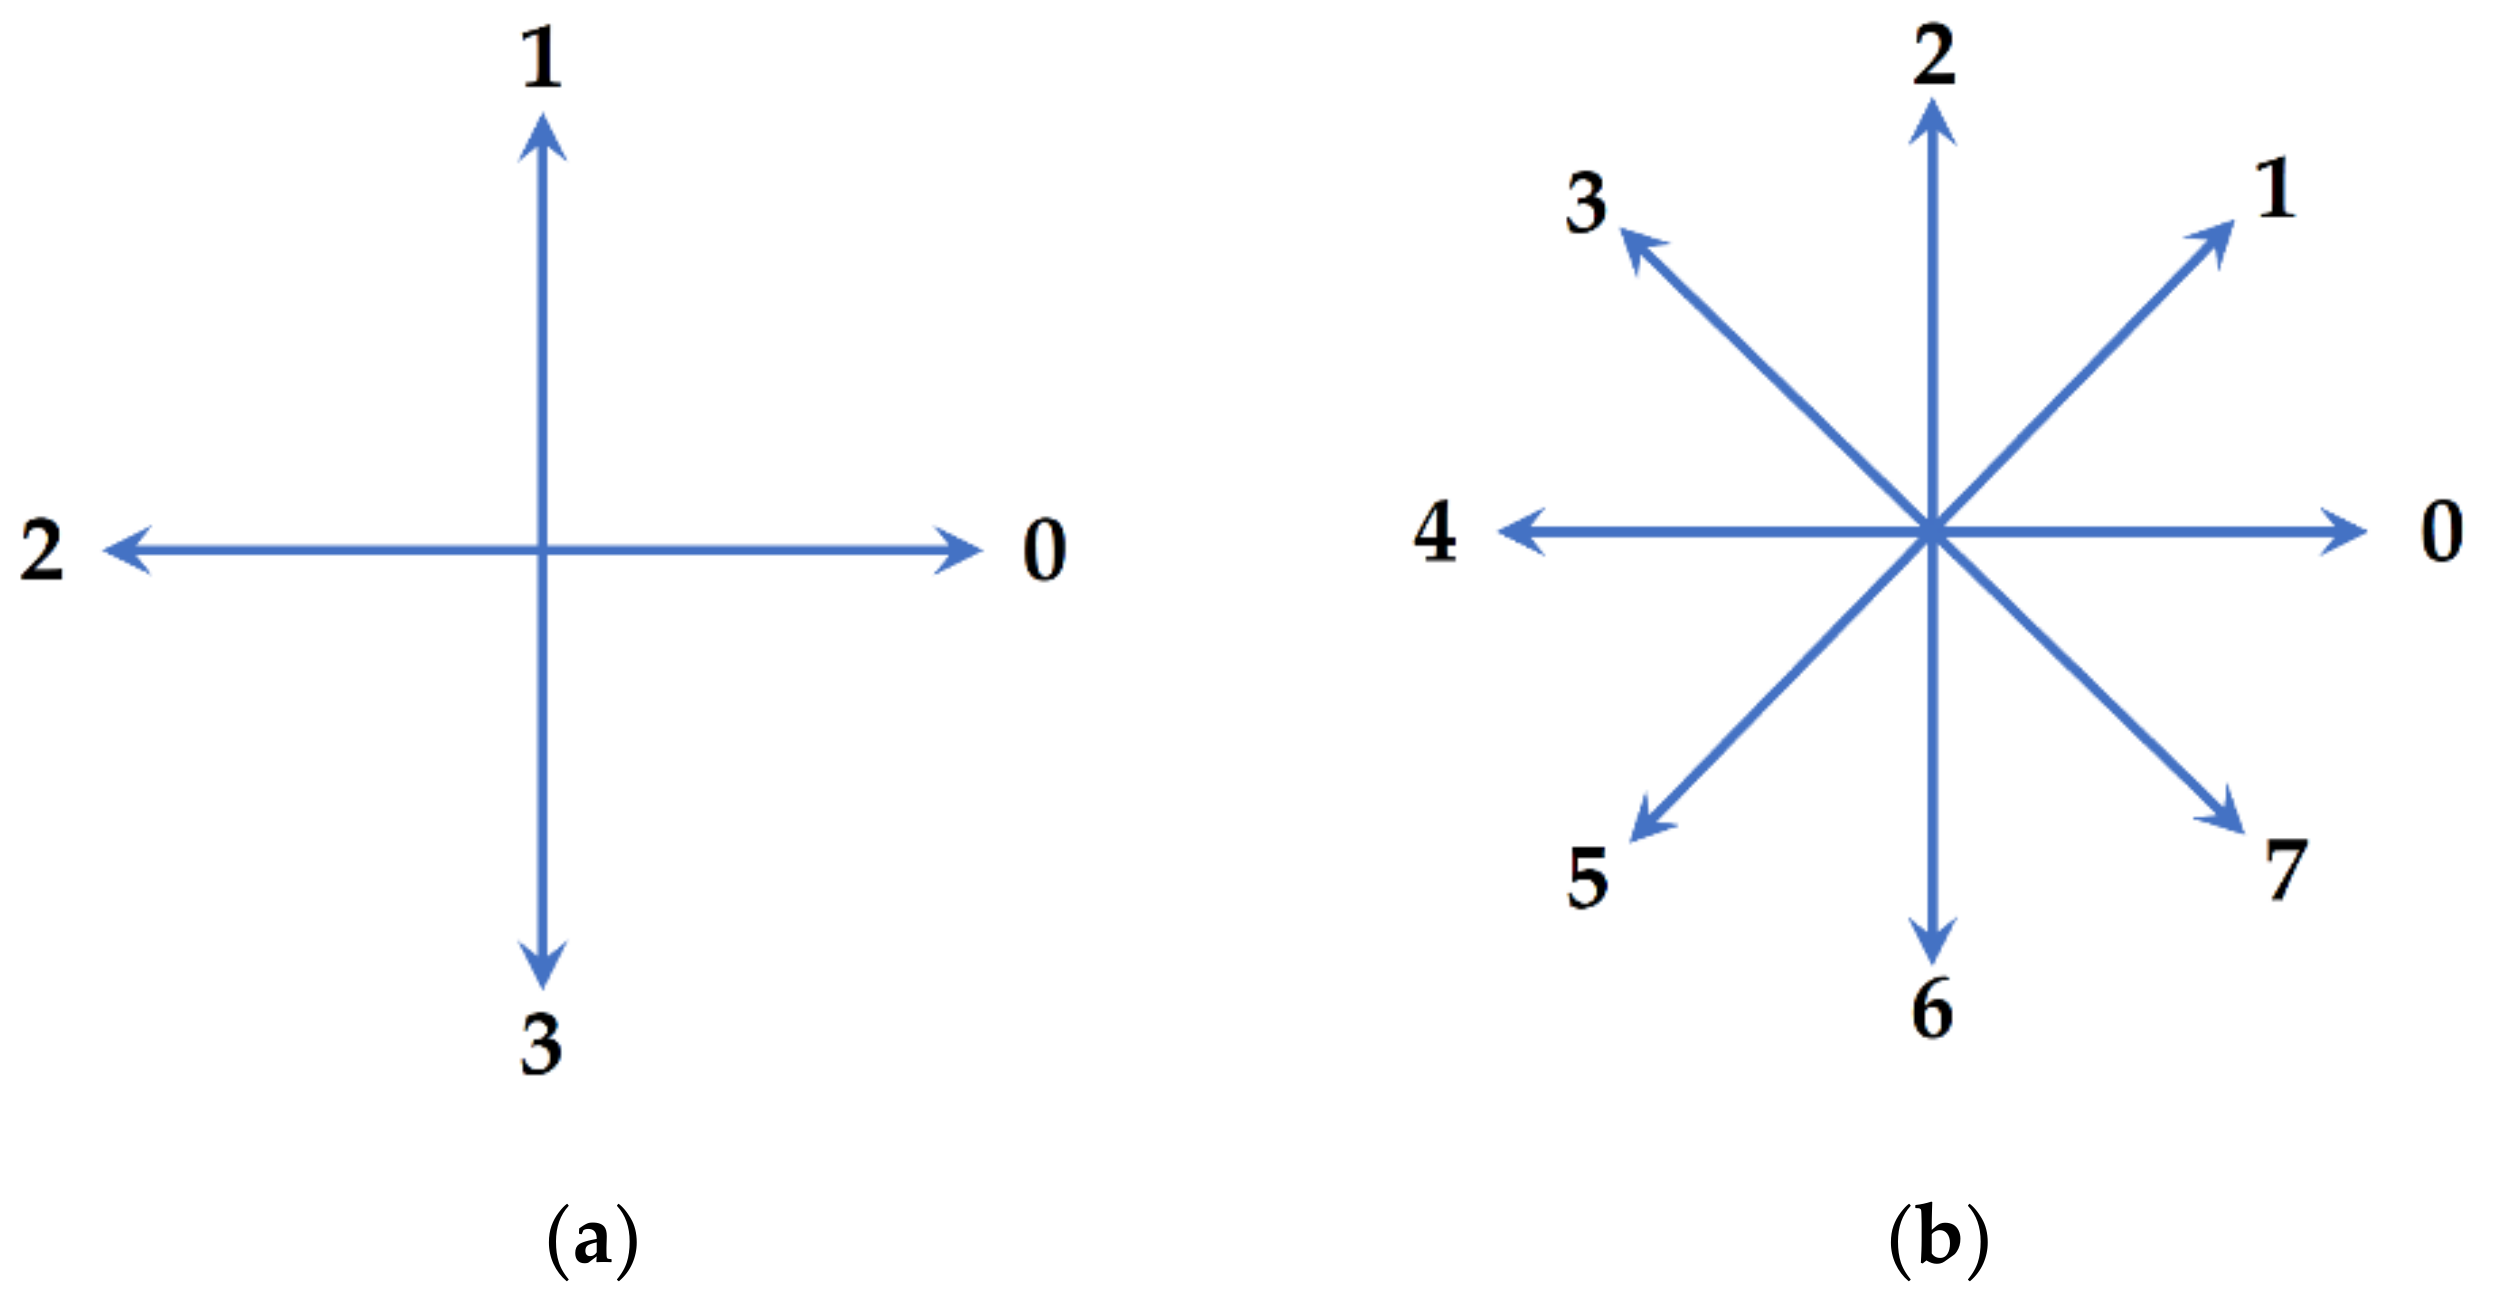
- Starting from the starting point to the end point, obtain the Freeman code of the foreground pixels and form the chain code set F: {} in order.
- (3)
- For detecting the circulating body, starting from the current element of the chain code collection 1, 2 ,..., n adjacent elements are selected sequentially to form the initial circulating body for determination, and the threshold of the number of cycles is set T = 5; when the number of cycles in the current chain code sequence is greater than or equal to T, the initial circulating body is regarded as a formal circulating body.
- (4)
- Match the loop body along the chain code set sequence.
- (5)
- If the current loop body does not match a certain sequence, the current matching process ends; at the same time, the pixel corresponding to the chain code value of the last matching sequence of the current loop body is set as a corner point, and its coordinates are recorded.
- (6)
- Repeat Step 3 until the entire chain code set F has been searched.
- (7)
- Calculate the distance between adjacent corner points. Eliminate the adjacent corner points whose distance is less than the threshold.
- (8)
- At the end of the algorithm, according to the search order, output the corner coordinates A: {, , ,…,}.
4.2.3. Rebar Bending Angle Calculation
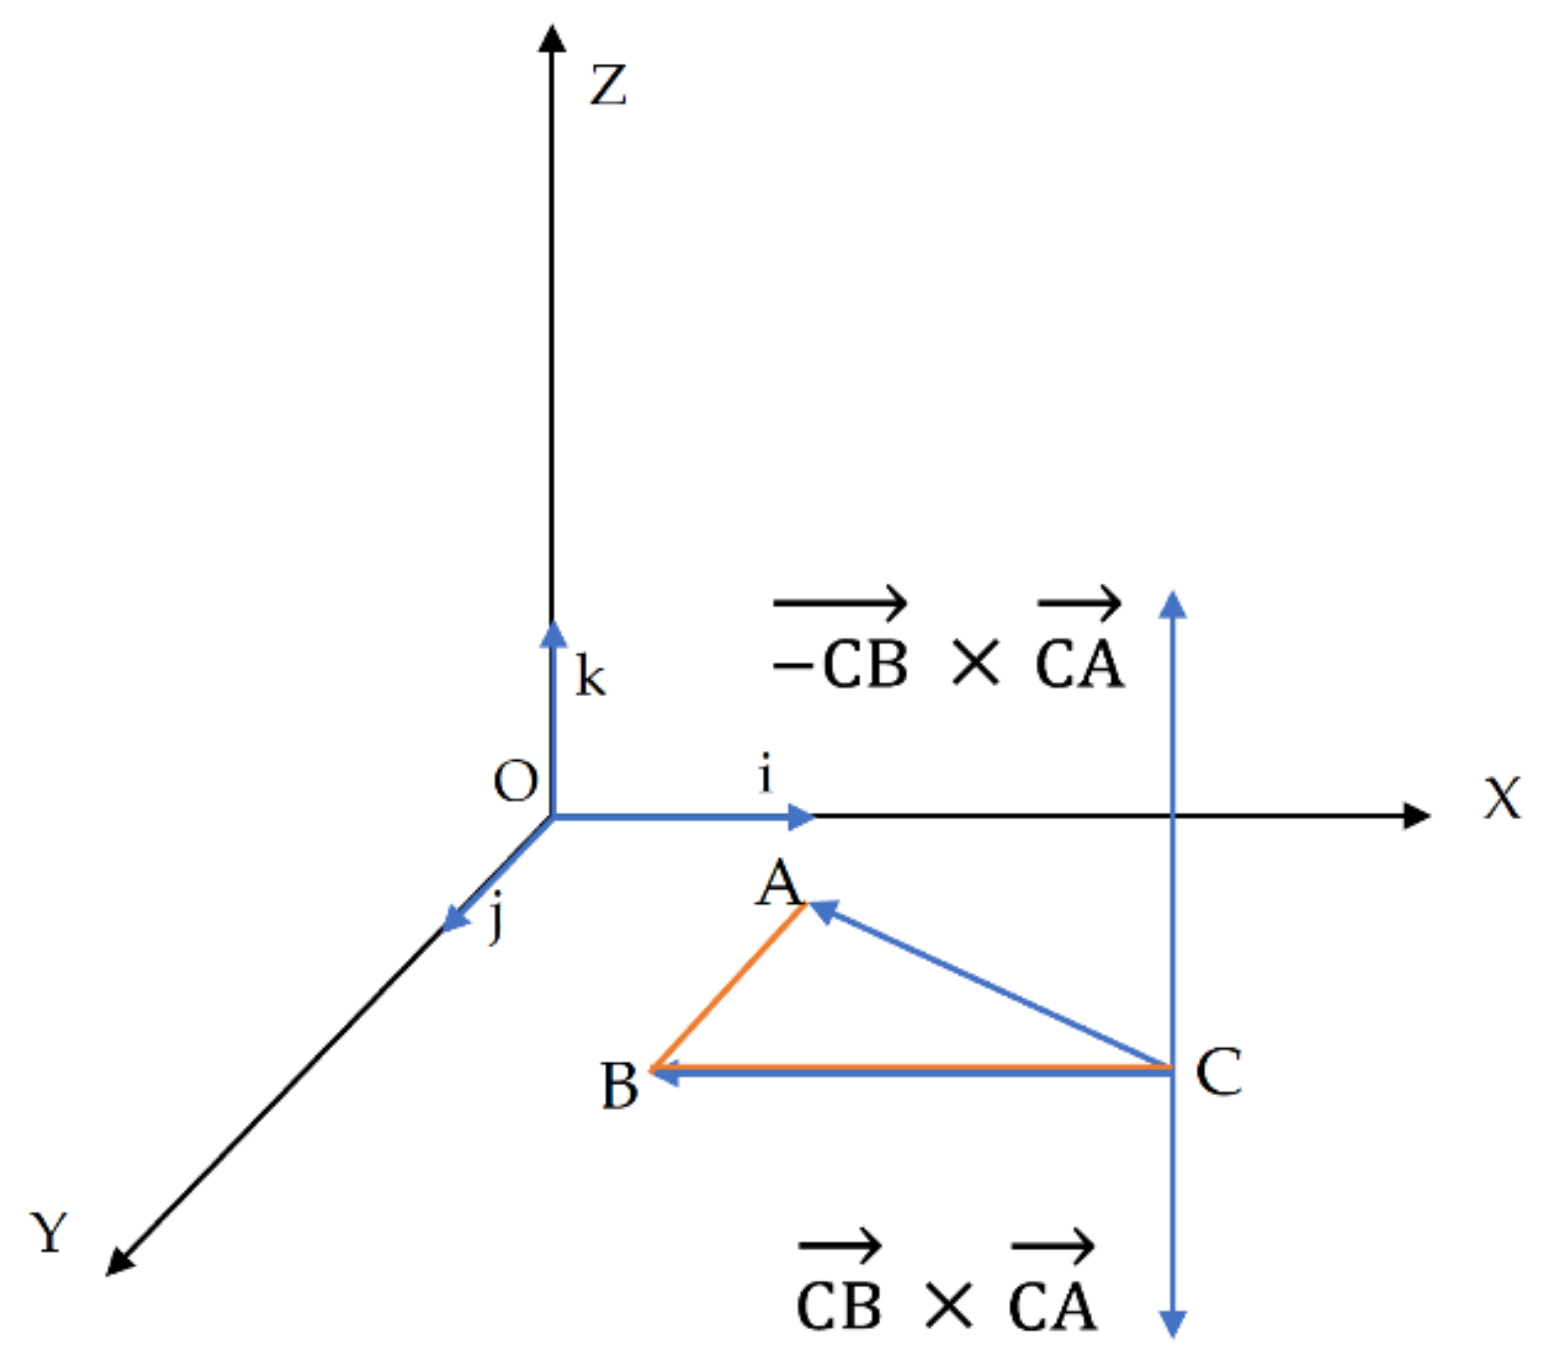
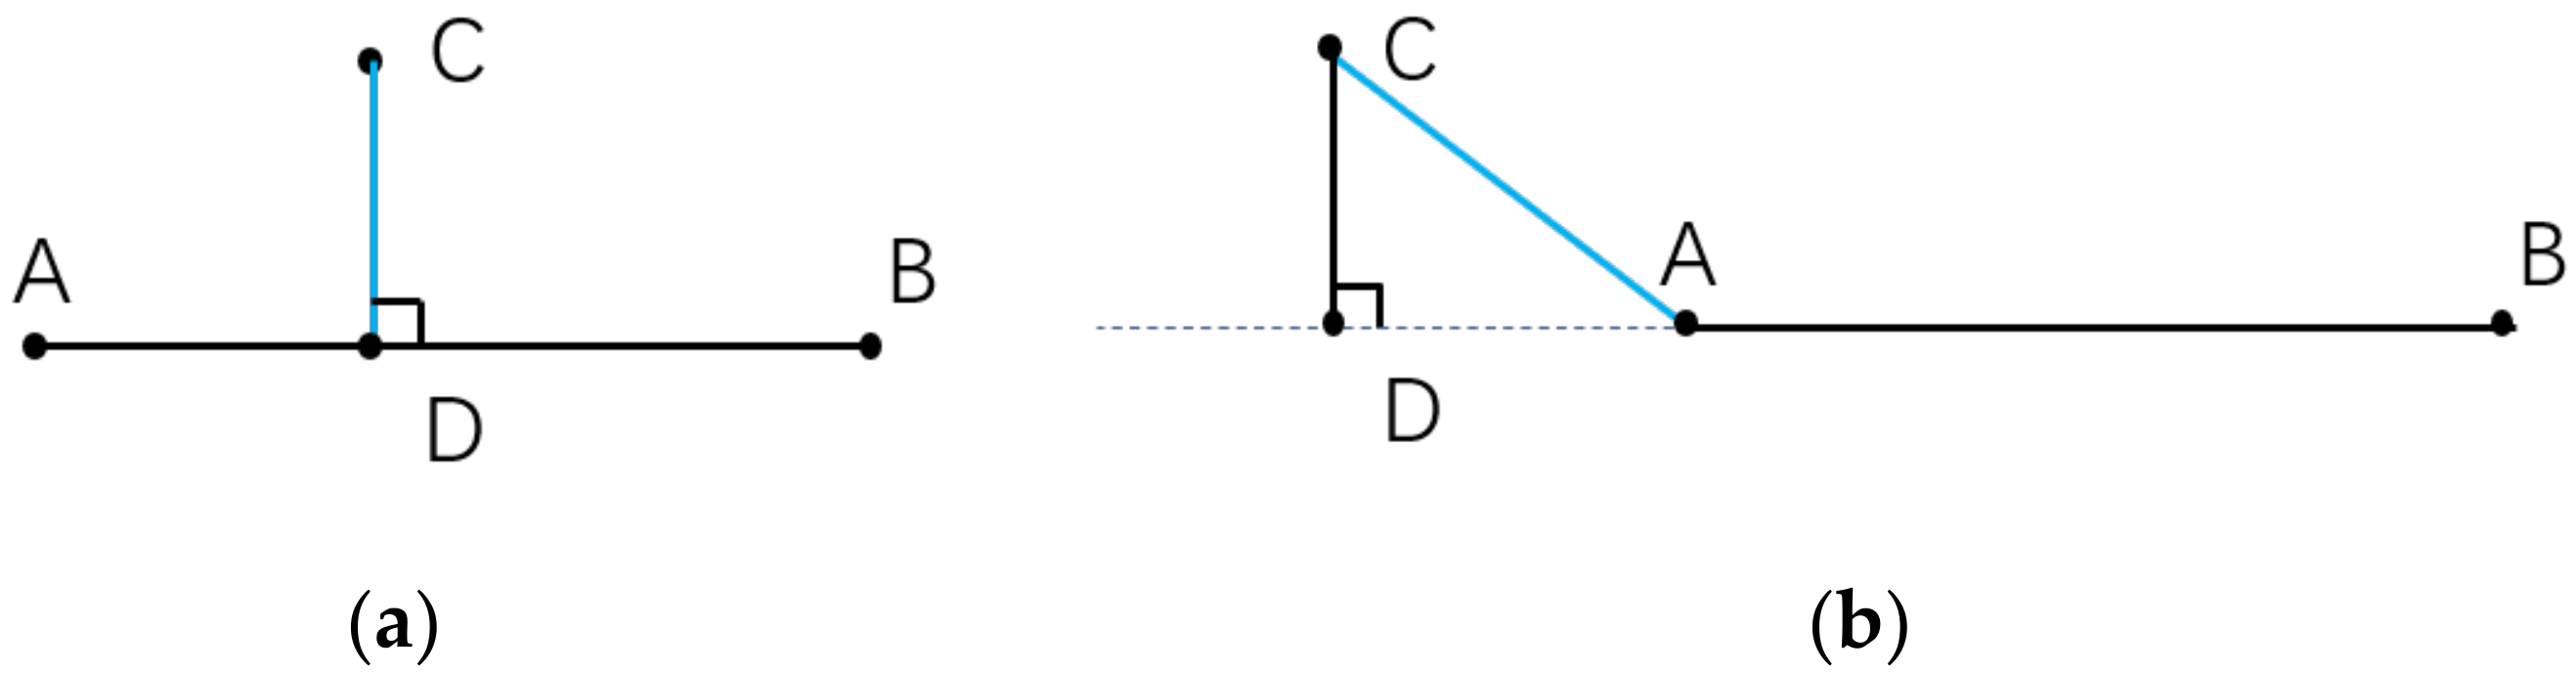
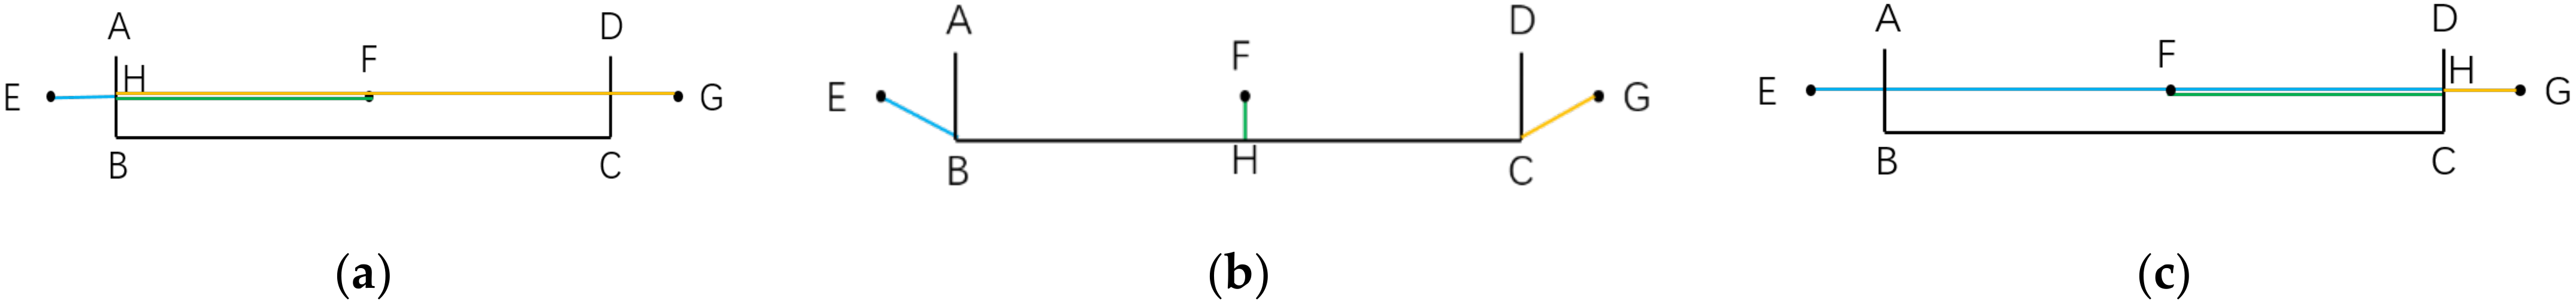
4.2.4. Determine the Bending Direction of the Steel Bar
4.3. Extract the Rebar’s Labeling Information
4.4. Establish the Mapping Relationship of the Steel Processing Information
5. Experimental Results and Analysis
5.1. Test Environment
5.2. Experimental Procedures
- Step 1: Get detail drawing of a rebar, input the image;
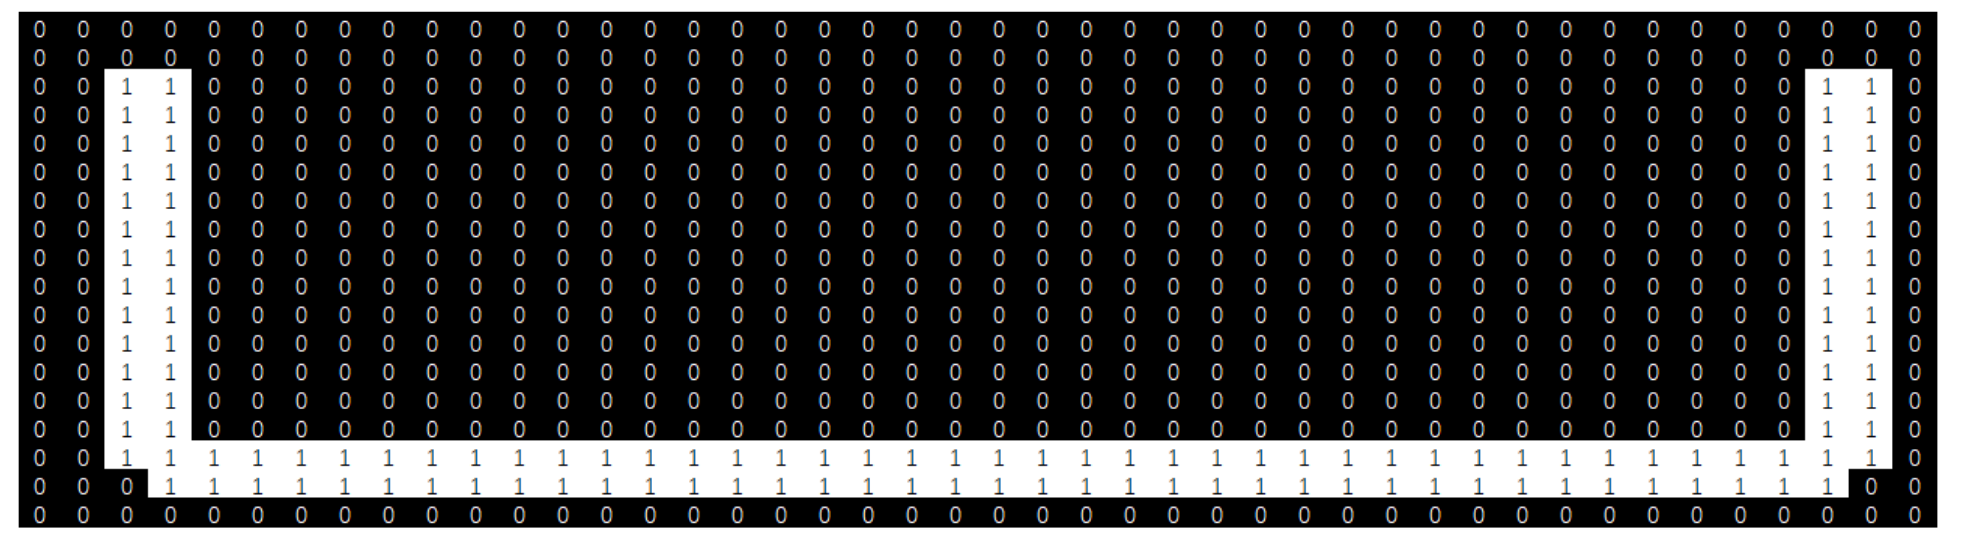
- Step 2: Image preprocessing, grayscale the input large sample image, and then compare the pixel value of each point in the grayscale image with the threshold k. The foreground pixels larger than the threshold k are uniformly set to 1, and the background pixels smaller than the threshold k are uniformly set to 0. Get the binary image of the rebar image;
- Step 3: Labeling and classification of connected domains for binary graphs. Take out the connected area with the largest area and determine whether its aspect ratio is also the largest. If the above two conditions are met, this area is retained, and other areas are deleted to complete image feature segmentation;
- Step 4: Extract feature points from the image, and then judge the bending angle and direction of the steel bar. Finally, the area of rebar labeling information is divided by the morphological method, and the labeling information is extracted;
- Step 5: By calculating the distance from the center point of the marked information area to the corresponding line segment, take the point with the smallest distance, and establish the mapping relationship between the geometric information and non-geometric information of the steel bar;
- Step 6: Output steel bar processing information.
- The computer is used to perform the above steps on each group of detail drawing of a rebar, and finally the extraction of rebar processing information can be completed.
5.3. Test Results
6. Conclusions
Author Contributions
Funding
Institutional Review Board Statement
Informed Consent Statement
Data Availability Statement
Conflicts of Interest
References
- Zheng, C.; Yi, C.; Lu, M. Integrated optimization of rebar detailing design and installation planning for waste reduction and productivity improvement. Autom. Constr. 2019, 101, 32–47. [Google Scholar] [CrossRef]
- Ma, Z.; Zhao, Q.; Cang, T.; Li, Z.; Zhu, Y.; Hei, X. An Intelligent Optimization Method of Reinforcing Bar Cutting for Construction Site. CMES-Comput. Modeling Eng. Sci. 2022. epub ahead of print. [Google Scholar] [CrossRef]
- He, H.-N.; Wang, X.-C.; Peng, G.-Z.; Xu, D.; Liu, Y.; Jiang, M.; Wu, Z.-D.; Zhang, D.; Yan, H. Intelligent logistics system of steel bar warehouse based on ubiquitous information. Int. J. Miner. Met. Mater. 2021, 28, 1367–1377. [Google Scholar] [CrossRef]
- Evtyukov, S. Improved Technology of Reinforcement Works and Technical Substantiation of Reinforcement Bar Oscillation Cutting. Contemp. Probl. Archit. Constr. 2014, 1020, 66–70. [Google Scholar] [CrossRef]
- Aram, S.; Eastman, C.; Sacks, R. Requirements for BIM platforms in the concrete reinforcement supply chain. Autom. Constr. 2013, 35, 1–17. [Google Scholar] [CrossRef]
- Applied Systems Associates (aSa), aSa Rebar Software, aSa Rebar Industry Partners. Available online: https://www.asahq.com/ (accessed on 6 June 2021).
- Navona, R.; Rubinovitzb, Y.; Cofflerc, M. Rebar computer aided design and manufacturing. Autom. Robot. Constr. 1994, 11, 155–162. [Google Scholar]
- Navon, R.; Rubinovitz, Y.; Coffler, M. RCCS: Rebar CAD/CAM System. Comput.-Aided Civil. Infrastruct. Eng. 1995, 10, 385–400. [Google Scholar] [CrossRef]
- Lee, H.S.; Kim, J.G.; Park, M.S.; Kim, H.S.; Hwang, S.J. Analysis of Bar in Coils Application to Rebar Work. Korean J. Constr. Eng. Manag. 2012, 13, 106–117. [Google Scholar] [CrossRef]
- Liu, Z.; Xiao, F.; Deng, Y.; Wang, Z.; Ren, J.; Li, H.; Wang, M.; Wen, J.; Zhang, G.; Yin, G.; et al. Technical Specification for Application of Fabricated Steel Bars of Concrete Structure, JGJ 366-2015.; China Architecture & Building Press: Beijing, China, 2015; pp. 6–16. [Google Scholar]
- Dejiang, W.; Youyang, H. Research on the Intelligent Construction of the Rebar Project Based on BIM. Appl. Sci. 2022, 12, 5596. [Google Scholar] [CrossRef]
- Chidambaram, S. The application of clash-detection processes in building information modelling for rebars. Smart Infrastruct. Constr. 2019, 172, 53–69. [Google Scholar] [CrossRef]
- Liu, Y.; Li, M.; Wong, B.; Chan, C.M.; Cheng, J.C.; Gan, V. Bim-bvbs integration with openbim standards for automatic prefabrication of steel reinforcement. Autom. Constr. 2021, 125, 103654. [Google Scholar] [CrossRef]
- Li, M.; Wong, B.C.; Liu, Y.; Chan, C.M.; Gan, V.J.; Cheng, J. Dfma-oriented design optimization for steel reinforcement using bim and hybrid metaheuristic algorithms. J. Build. Eng. 2021, 44, 103310. [Google Scholar] [CrossRef]
- Iano, Y.; Bonello, D.K.; Neto, U.B.; Dueñas, A.; Canahuire, F.; de Oliveira, G.G. Analysis of Results of Some Techniques for the Recognition of Circular Shapes in the Steel Bar Counting System Using Image Processing. In Proceedings of the 6th Brazilian Technology Symposium (BTSym’20), Campinas, Brazil, 26–28 October 2020; pp. 1006–1015. [Google Scholar]
- Zhao, J.; Xia, X.; Wang, H.; Kong, S. Design of real-time steel bars recognition system based on machine vision. In Proceedings of the 2016 8th International Conference on Intelligent Human-Machine Systems and Cybernetics (IHMSC), Hangzhou, China, 27–28 August 2016; pp. 505–509. [Google Scholar]
- Zhang, D.; Xie, Z.; Wang, C. Bar Section Image Enhancement and Positioning Method in On-Line Steel Bar Counting and Automatic Separating System. Congr. Image Signal. Processing 2008, 2, 319–323. [Google Scholar]
- Yan, X.; Chen, X. Research on the Counting Algorithm of Bundled Steel Bars Based on the Features Matching of Connected Regions. In Proceedings of the 2018 IEEE 3rd International Conference on Image, Vision and Computing (ICIVC), Chongqing, China, 27–29 June 2018; pp. 11–15. [Google Scholar]
- Zhu, Y.; Tang, C.; Liu, H.; Huang, P. End-face localization and segmentation of steel bar based on convolution neural network. IEEE Access 2020, 8, 74679–74690. [Google Scholar] [CrossRef]
- Ying, X.; Wei, X.; Yuan, P.X.; Han, Q.D.; Chen, C.H. Research on an Automatic Counting Method for Steel Bars’ Image. In Proceedings of the 2010 International Conference on Electrical and Control Engineering, Wuhan, China, 25–27 June 2010. [Google Scholar]
- Su, Z.; Fang, K.; Peng, Z.; Feng, Z. Rebar automatically counting on the product line. In Proceedings of the 2010 IEEE International Conference on Progress in Informatics and Computing (PIC), Shanghai, China, 10–12 December 2010. [Google Scholar]
- Wang, J.; Hao, C.; Xu, X. Pattern recognition for counting of bounded bar steel. In Proceedings of the Fourth International Conference on the Applications of Digital Information and Web Technologies (ICADIWT), Stevens Point, WI, USA, 4–6 August 2011. [Google Scholar]
- Oliva, D.; Abd Elaziz, M.; Hinojosa, S. Image Processing. In Metaheuristic Algorithms for Image Segmentation: Theory and Applications. Studies in Computational Intelligence; Springer: Berlin, Germany, 2019; Volume 825, pp. 27–45. [Google Scholar]
- Otsu, N. A threshold selection method from gray-level histograms. IEEE Trans. Syst. Man Cybern. 2007, 9, 62–66. [Google Scholar] [CrossRef]
- Cai, H.; Yang, Z.; Cao, X.; Xia, W.; Xu, X. A New Iterative Triclass Thresholding Technique in Image Segmentation. IEEE Trans. Image Process. 2014, 23, 1038–1046. [Google Scholar] [CrossRef] [PubMed]
- Xue, J.H.; Titterington, D.M. T-tests, f-tests and otsu’s methods for image thresholding. IEEE Trans. Image Process. 2011, 20, 2392–2396. [Google Scholar] [PubMed]
- Kaut, H.; Singh, R. A Review on Image Segmentation Techniques for Future Research Study. Int. J. Eng. Trends Technol. 2016, 35, 504–505. [Google Scholar] [CrossRef]
- Raffo, A.; Biasotti, S. Weighted Quasi-Interpolant Spline Approximations of Planar Curvilinear Profiles in Digital Images. Mathematics 2021, 9, 3084. [Google Scholar] [CrossRef]
- Yu, W.; Wang, G.; Liu, C.; Li, Y.; Zhang, Z.; Liu, K. An Algorithm for Corner Detection based on Contour. In Proceedings of the Chinese Automation Congress (CAC), Shanghai, China, 6–8 November 2020. [Google Scholar]
- Gu, J.; Liu, W. Polygon graphic recognition based on improved fast corner detection. In Proceedings of the 2nd International Conference on Applied Machine Learning and Data Science (ICAMLDS 2020), Chengdu, China, 21–23 August 2020. [Google Scholar]
- Fan, C.; Zhao, C.; Gao, Z.; Zhang, H.; Zhu, X. Xilinx Zynq 7000 SoC Based Character Feature Extraction System for OCR Inspection of Integrated Circuit Chips. In Proceedings of the 11th International Conference on Software Engineering and Service Science (ICSESS), Beijing, China, 16–18 October 2020. [Google Scholar]


| SMPTE “C” Colorimetry | CIE 1931 x | CIE 1931 y |
|---|---|---|
| primary red | 0.630 | 0.340 |
| primary green | 0.310 | 0.595 |
| primary blue | 0.155 | 0.070 |
| white point (CIE illuminant D65) | 0.3127 | 0.3290 |
| Rebar Detail Image | Recognition Result | Recognition Speed/s | Recognition Accuracy |
|---|---|---|---|
 | 9400 | 0.165 | True |
 | 100, 90, 3185 | 0.173 | True |
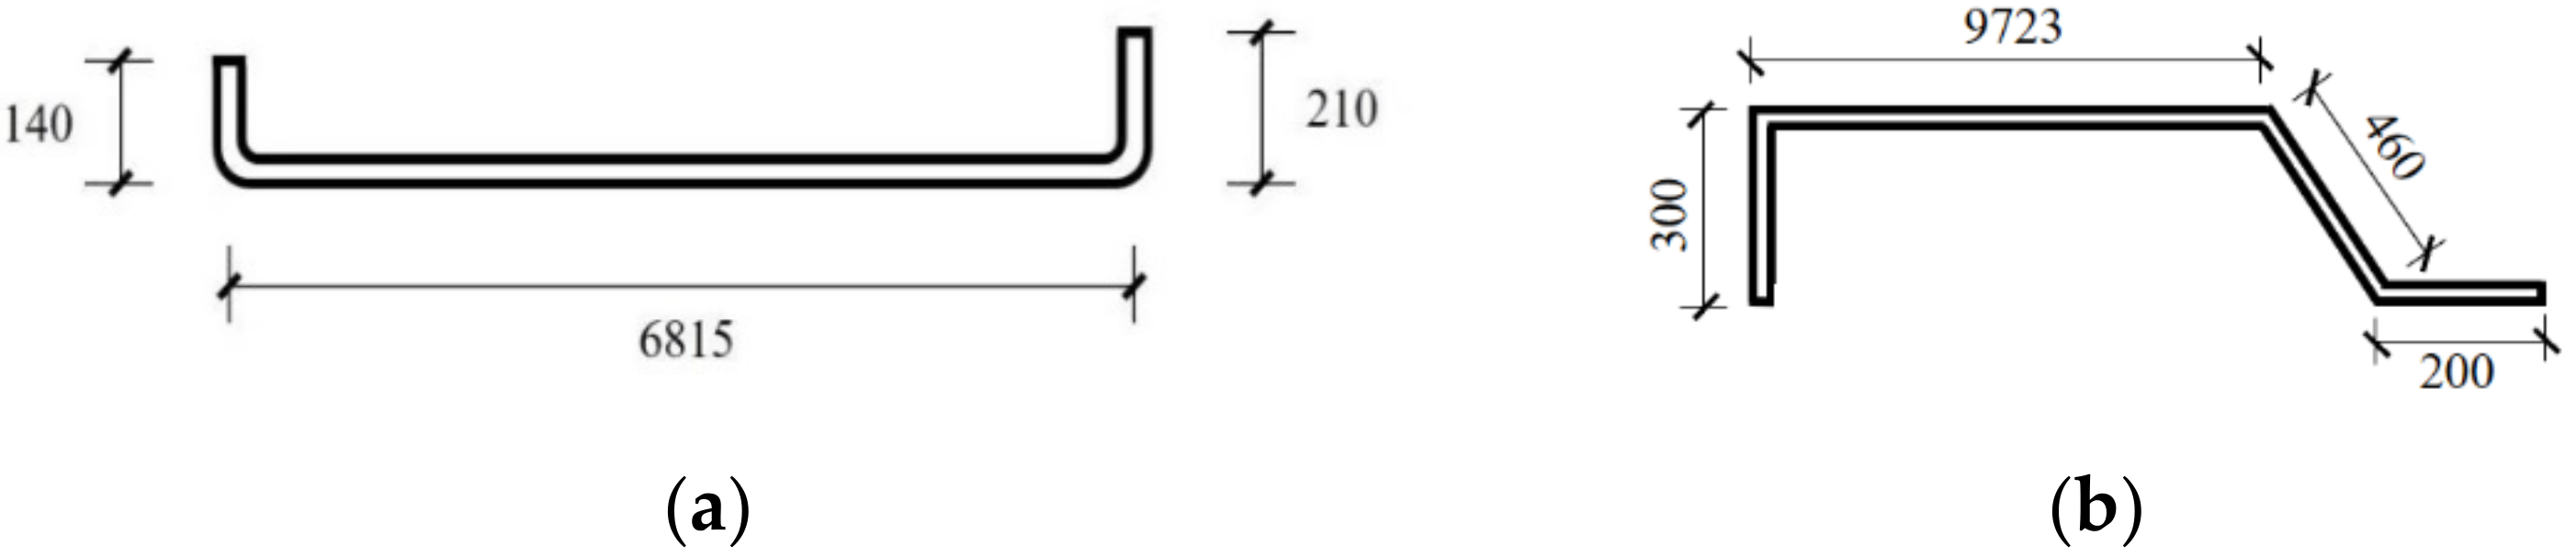
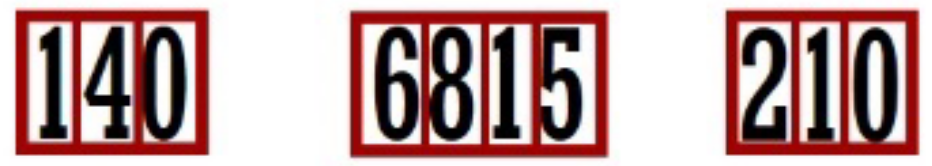
 | 140, 90, 6815, 90, 210 | 0.179 | True |
 | 40, −90, 90, −90, 3435 | 0.178 | True |
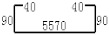
 | 40, 90, 90, 90, 5570, 90, 90, 90, 40 | 0.186 | True |
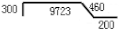
 | 300, −90, 9723, −45, 460, 45, 200 | 0.189 | True |
 | 210, −90, 1555, 90, 342, 0, 1026, −79, 120 | 0.196 | True |
 | 100, 90, 3185 | 0.165 | False |
| Total Number | Correct Quantity | Recognition Speed/s | Recognition Accuracy |
|---|---|---|---|
| 2000 | 1986 | 383.58 | 99.30% |
| 2000 | 1975 | 391.72 | 98.75% |
| 2000 | 1981 | 386.27 | 99.05% |
| 2000 | 1993 | 376.26 | 99.65% |
Publisher’s Note: MDPI stays neutral with regard to jurisdictional claims in published maps and institutional affiliations. |
© 2022 by the authors. Licensee MDPI, Basel, Switzerland. This article is an open access article distributed under the terms and conditions of the Creative Commons Attribution (CC BY) license (https://creativecommons.org/licenses/by/4.0/).
Share and Cite
Ma, Z.; Zhao, Q.; Zhu, Y.; Cang, T.; Hei, X. An Automatic Extraction Method of Rebar Processing Information Based on Digital Image. Mathematics 2022, 10, 2974. https://doi.org/10.3390/math10162974
Ma Z, Zhao Q, Zhu Y, Cang T, Hei X. An Automatic Extraction Method of Rebar Processing Information Based on Digital Image. Mathematics. 2022; 10(16):2974. https://doi.org/10.3390/math10162974
Chicago/Turabian StyleMa, Zhaoxi, Qin Zhao, Yiyun Zhu, Tianyou Cang, and Xinhong Hei. 2022. "An Automatic Extraction Method of Rebar Processing Information Based on Digital Image" Mathematics 10, no. 16: 2974. https://doi.org/10.3390/math10162974
APA StyleMa, Z., Zhao, Q., Zhu, Y., Cang, T., & Hei, X. (2022). An Automatic Extraction Method of Rebar Processing Information Based on Digital Image. Mathematics, 10(16), 2974. https://doi.org/10.3390/math10162974