
High-Speed Rail Network Structural Characteristics and Evolution in China

Abstract
:1. Introduction
2. Data and Methodology
2.1. Sample
2.2. Network Construction
3. The Characteristics and Evolution of the Global HSR Network Structure
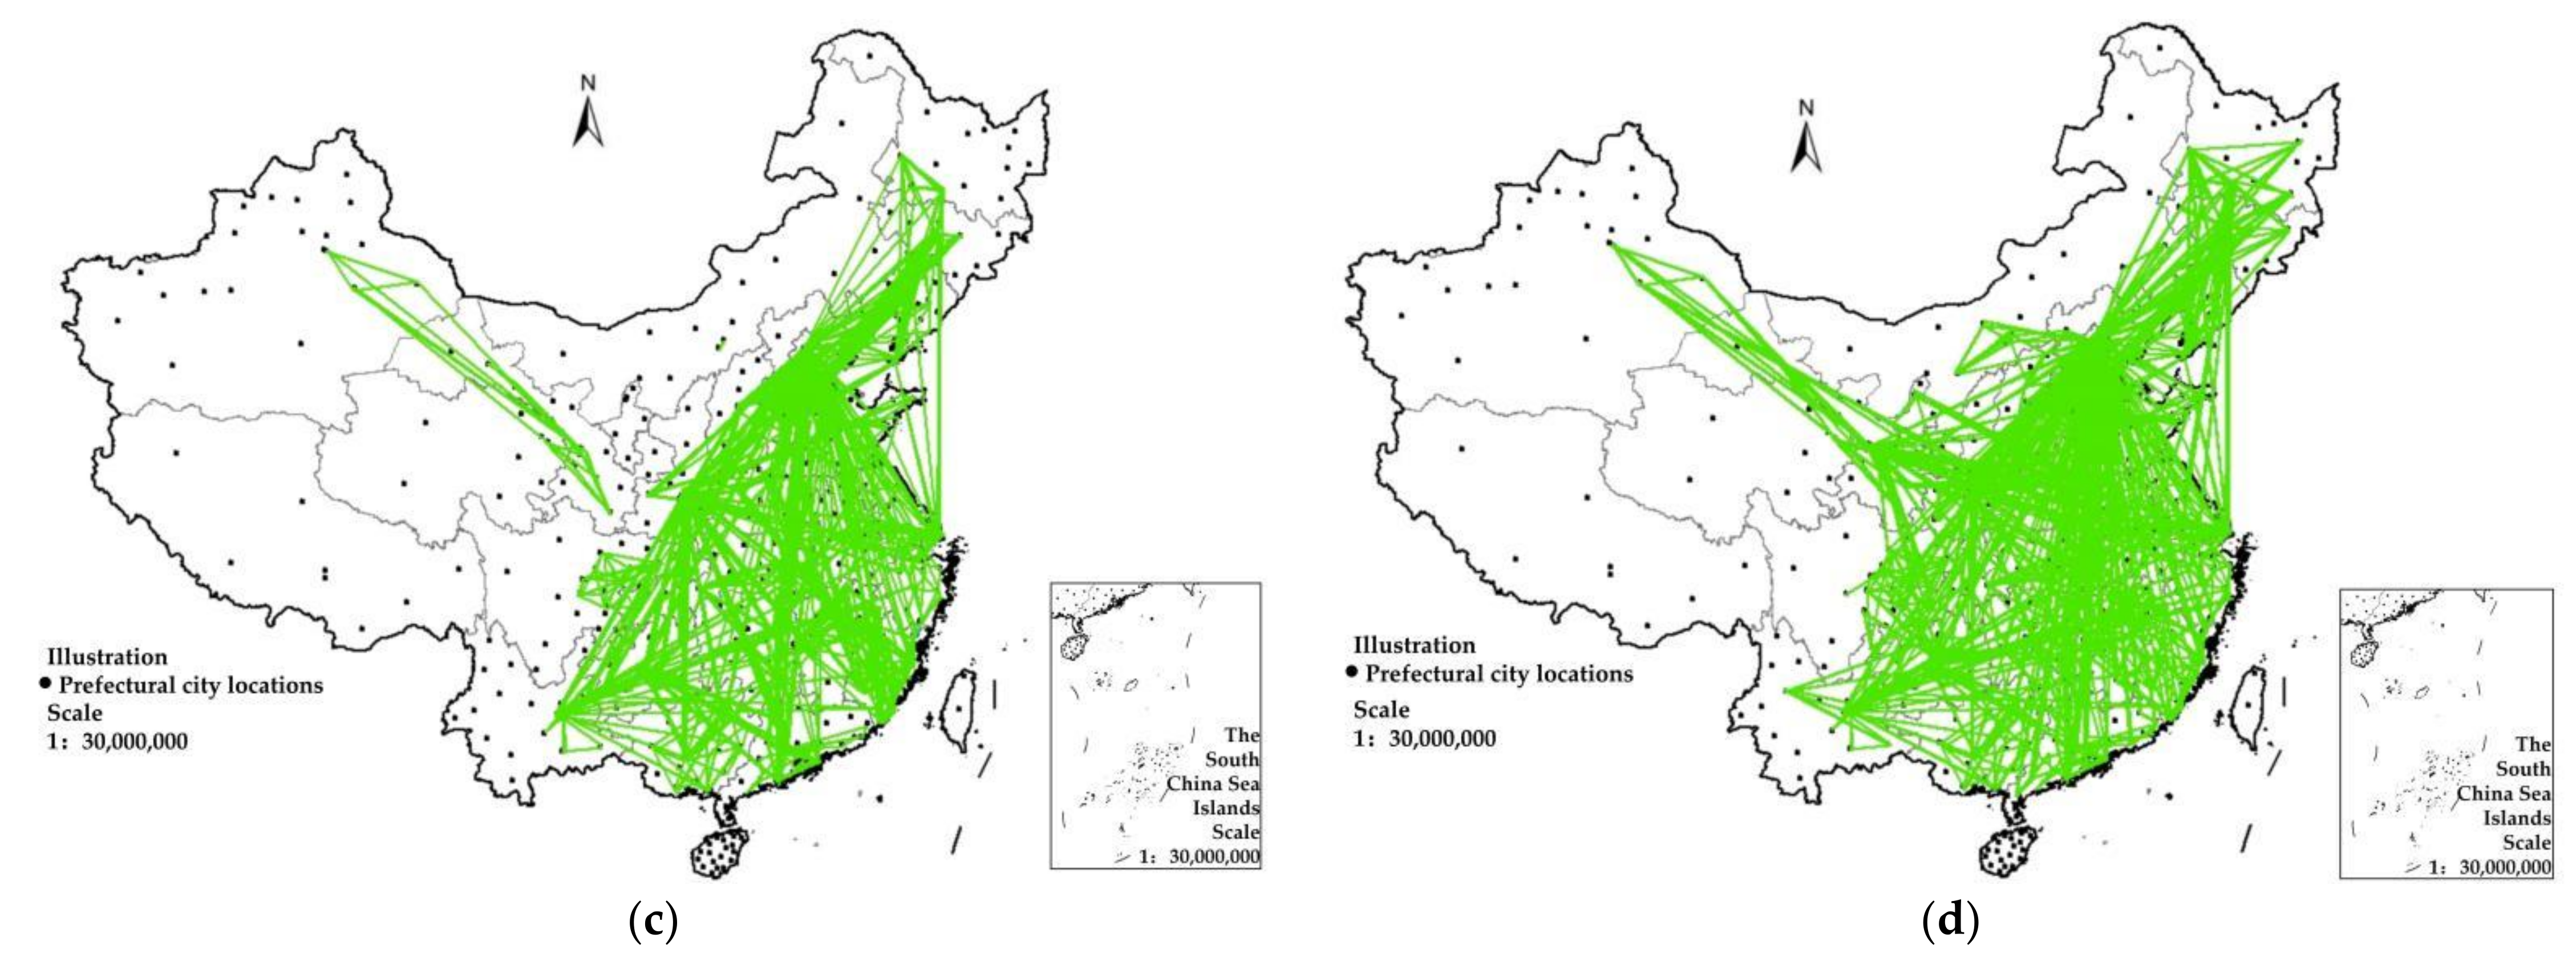
3.1. Network Density Analysis
3.2. Accessibility Evaluation
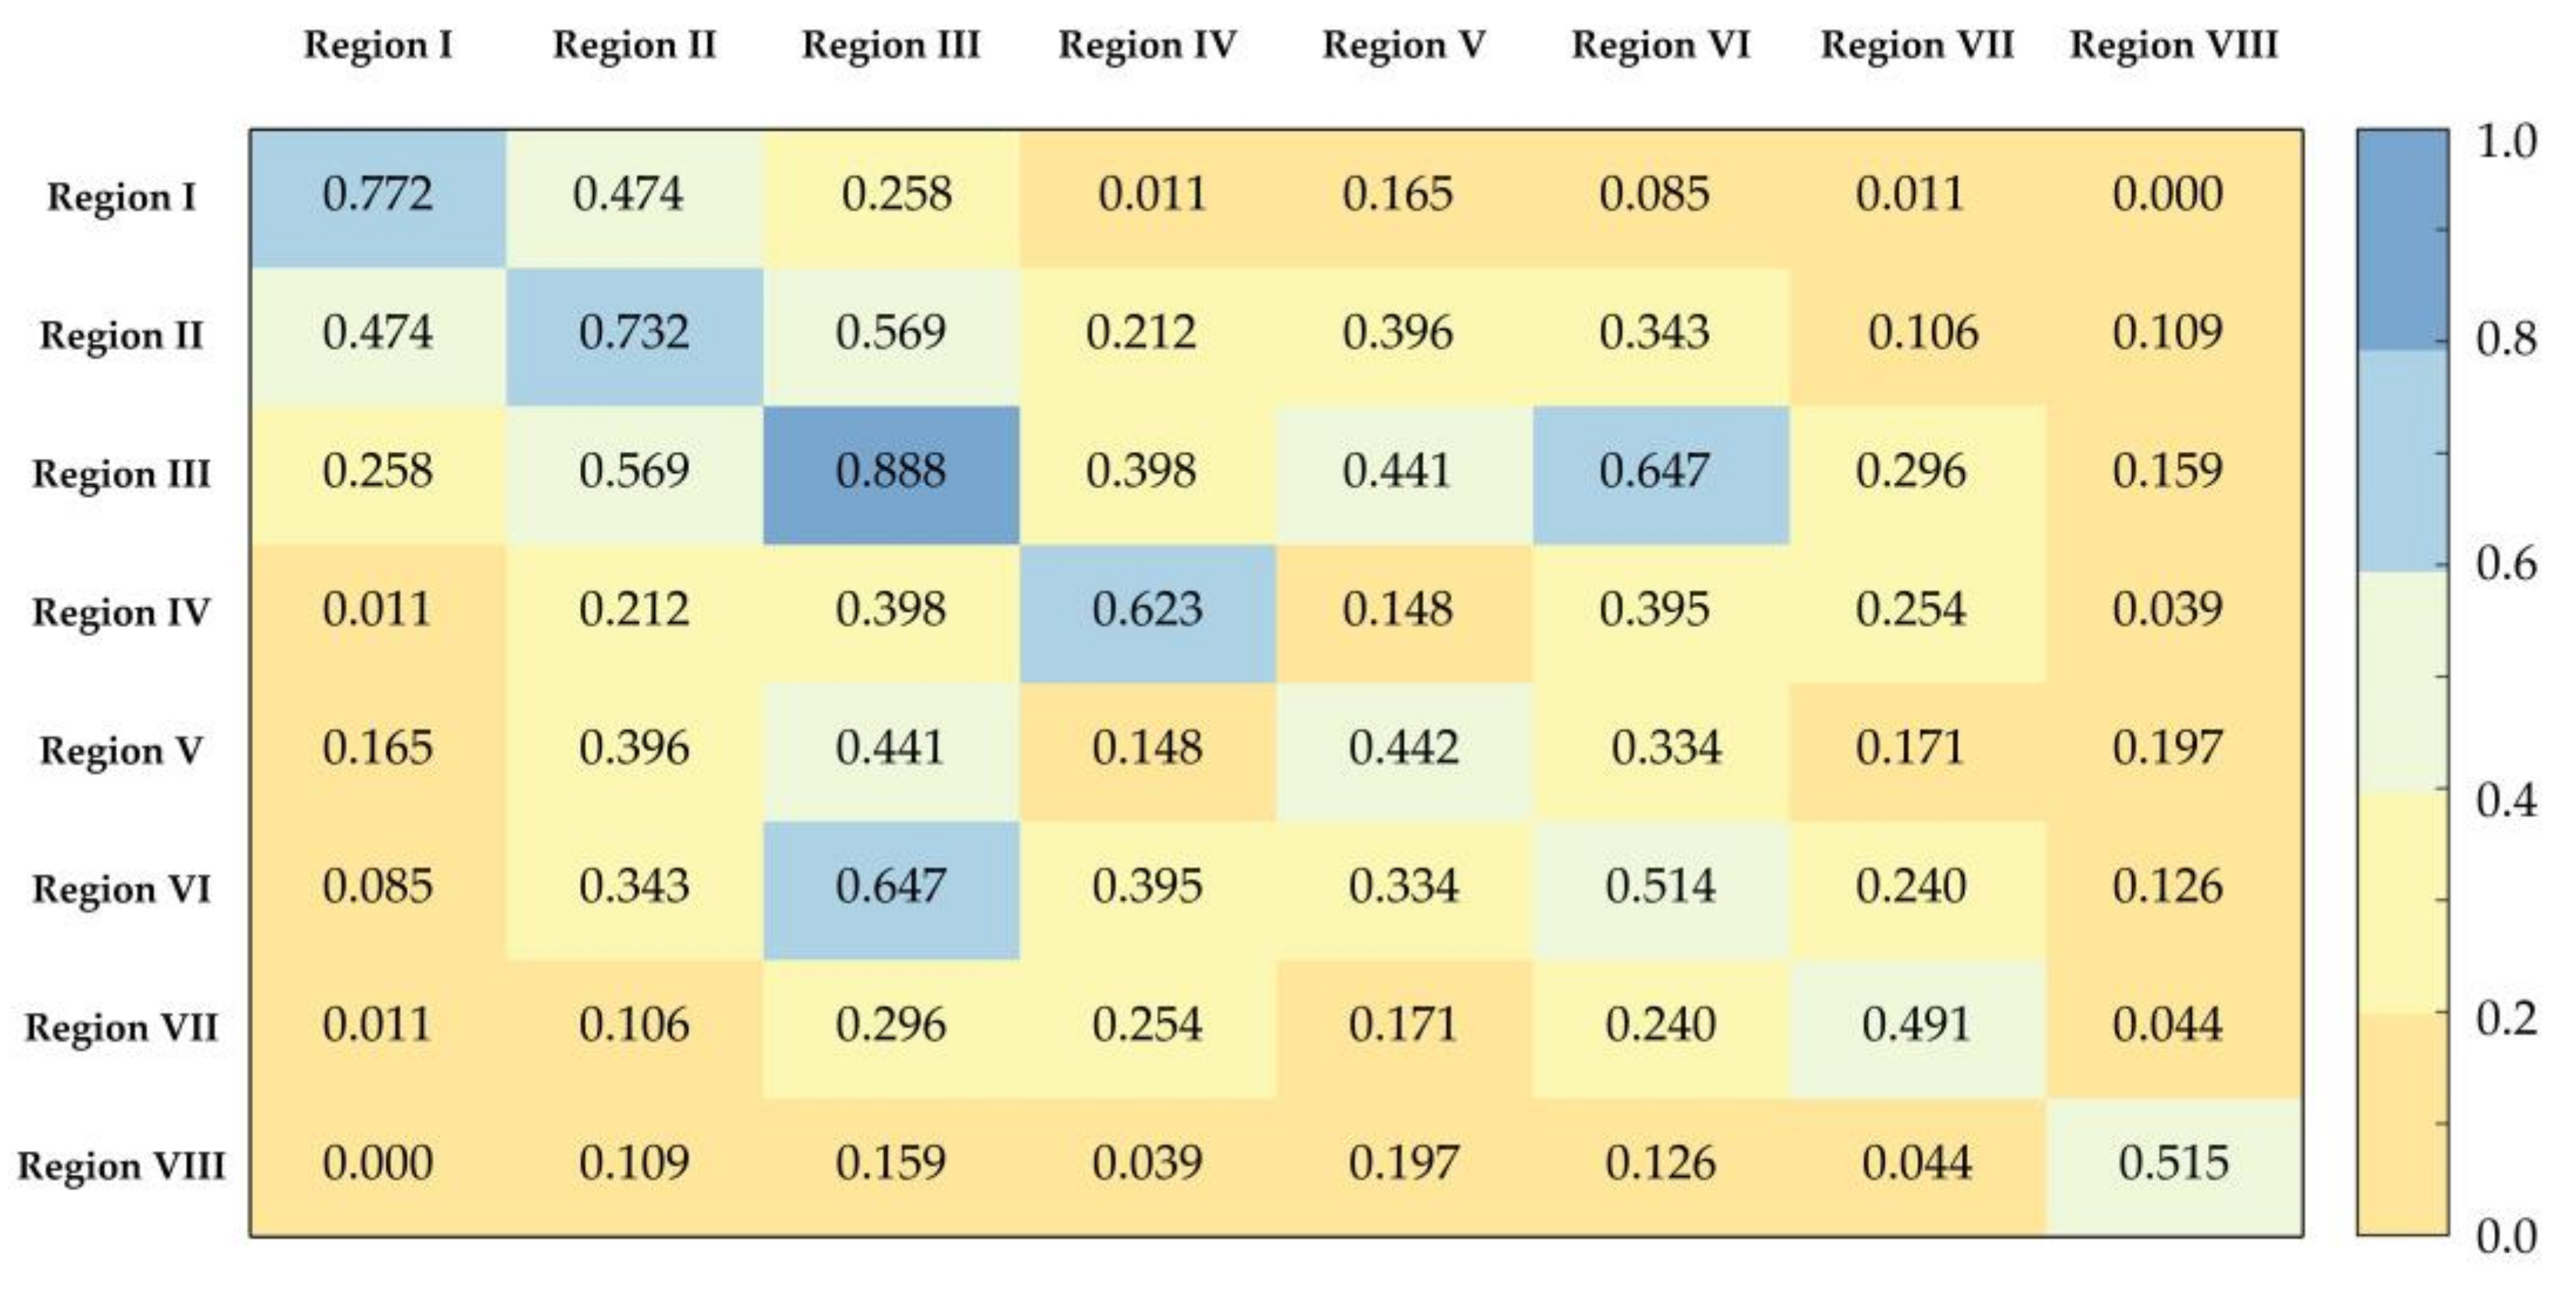
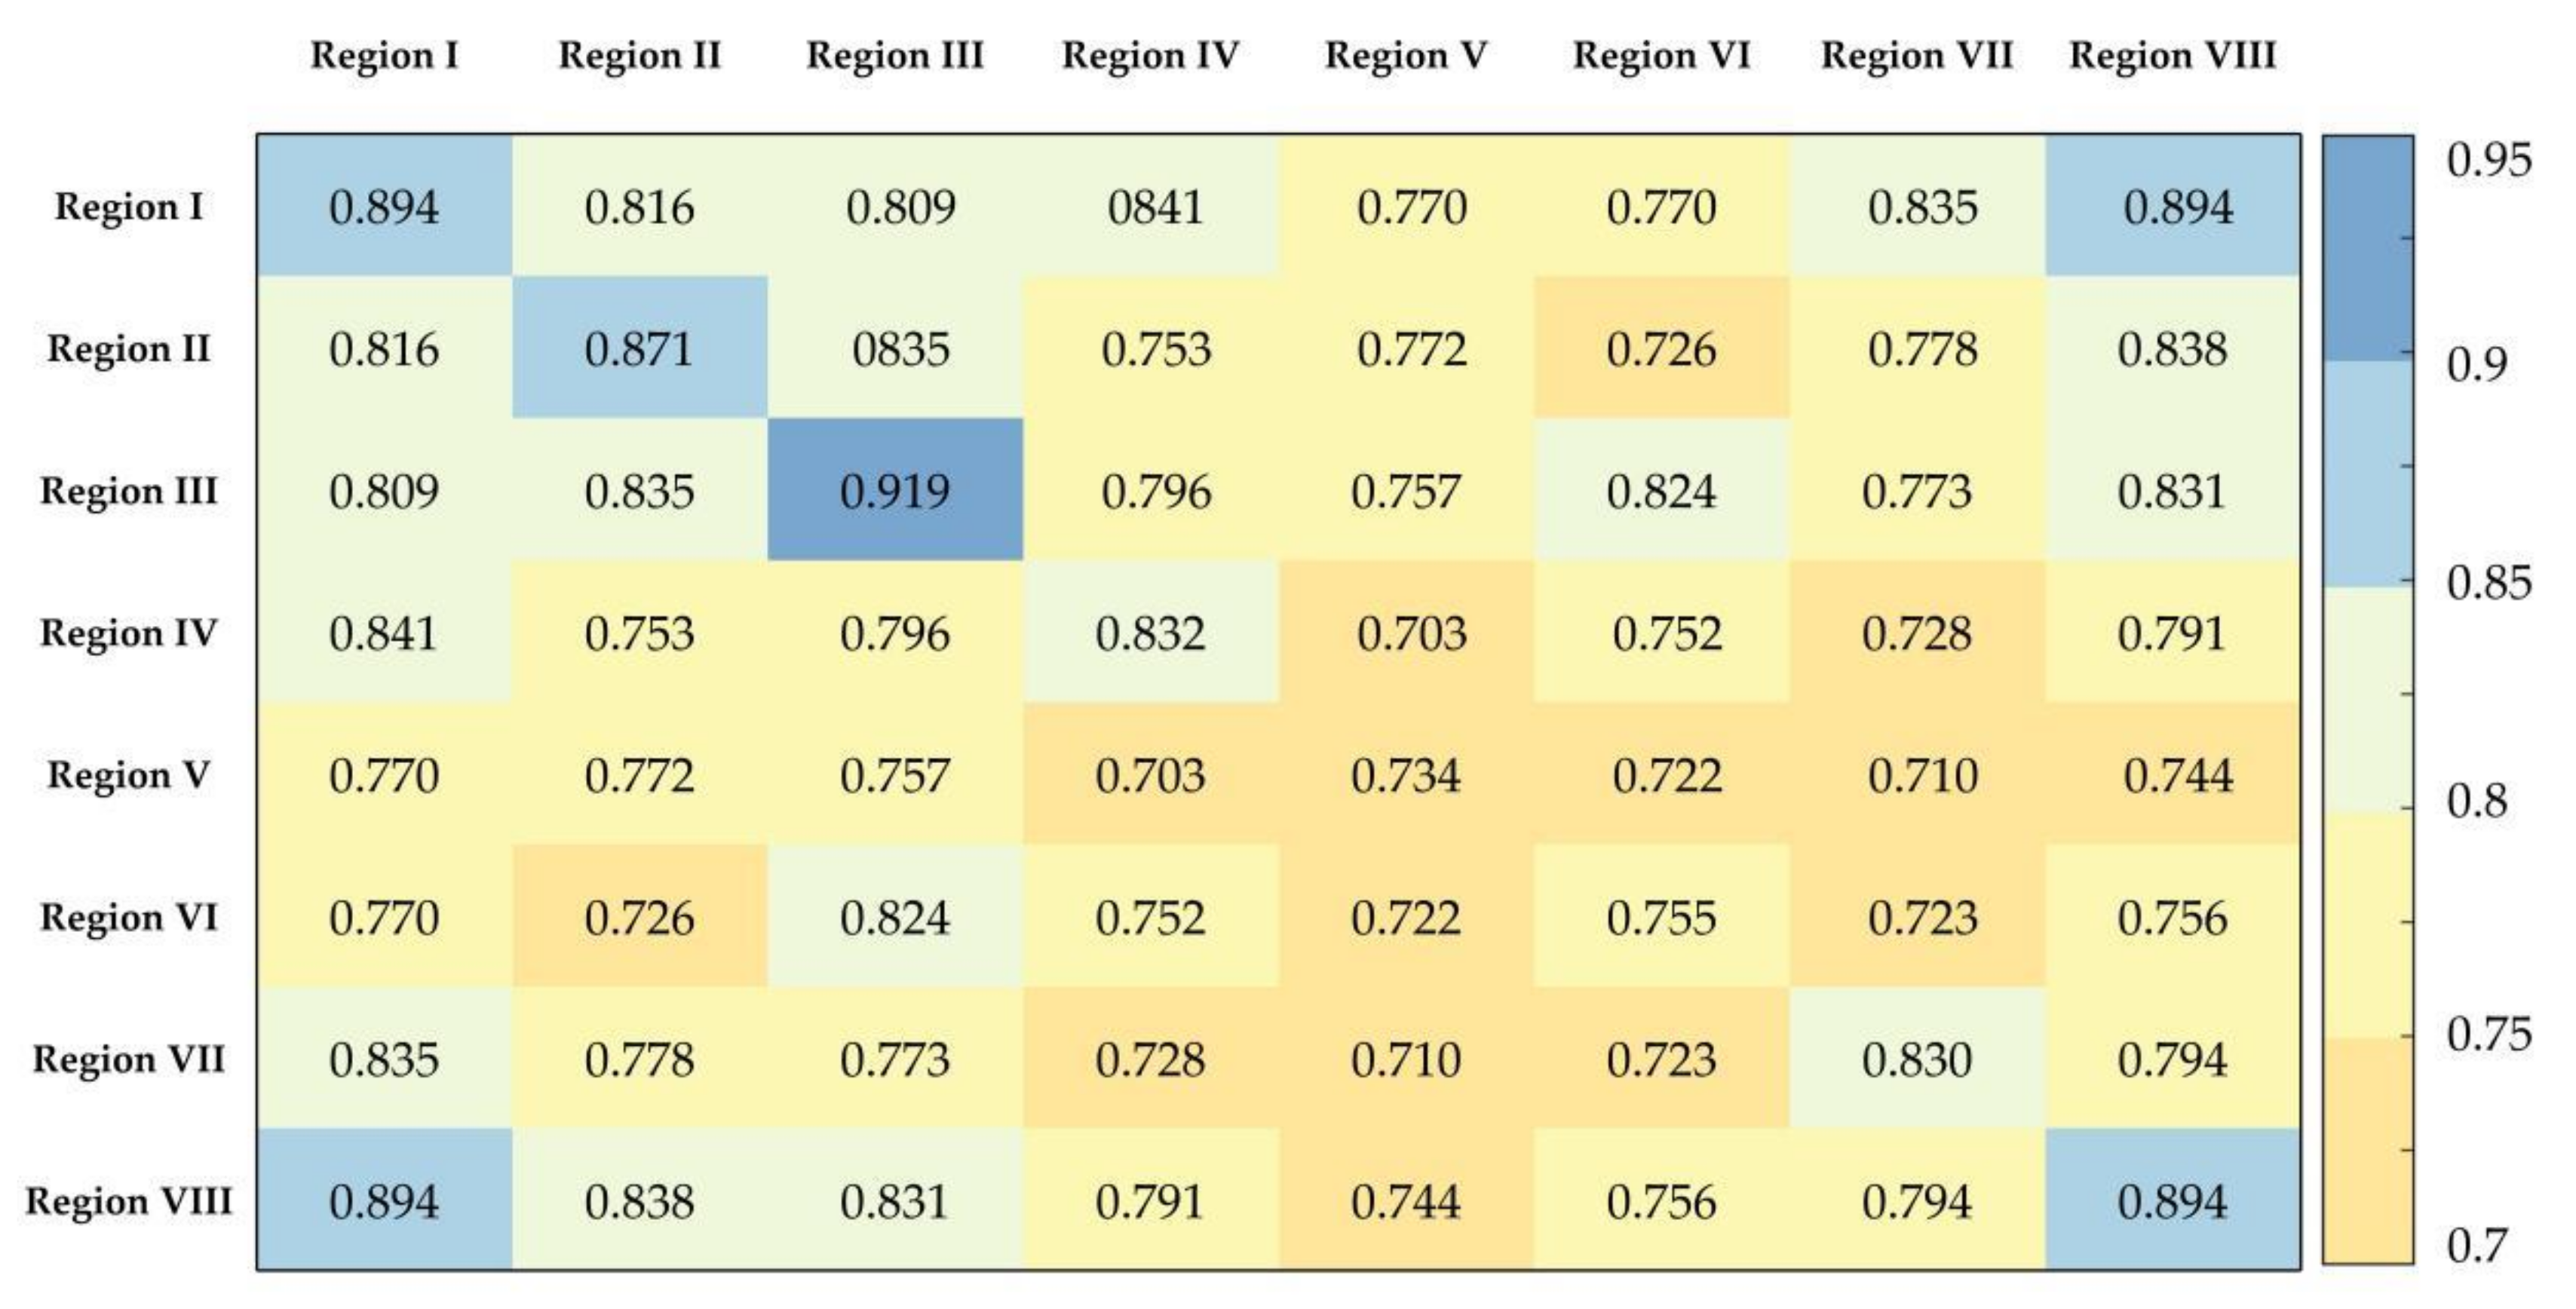
3.3. Network Cohesion
4. City Node Network Centrality
4.1. Measures
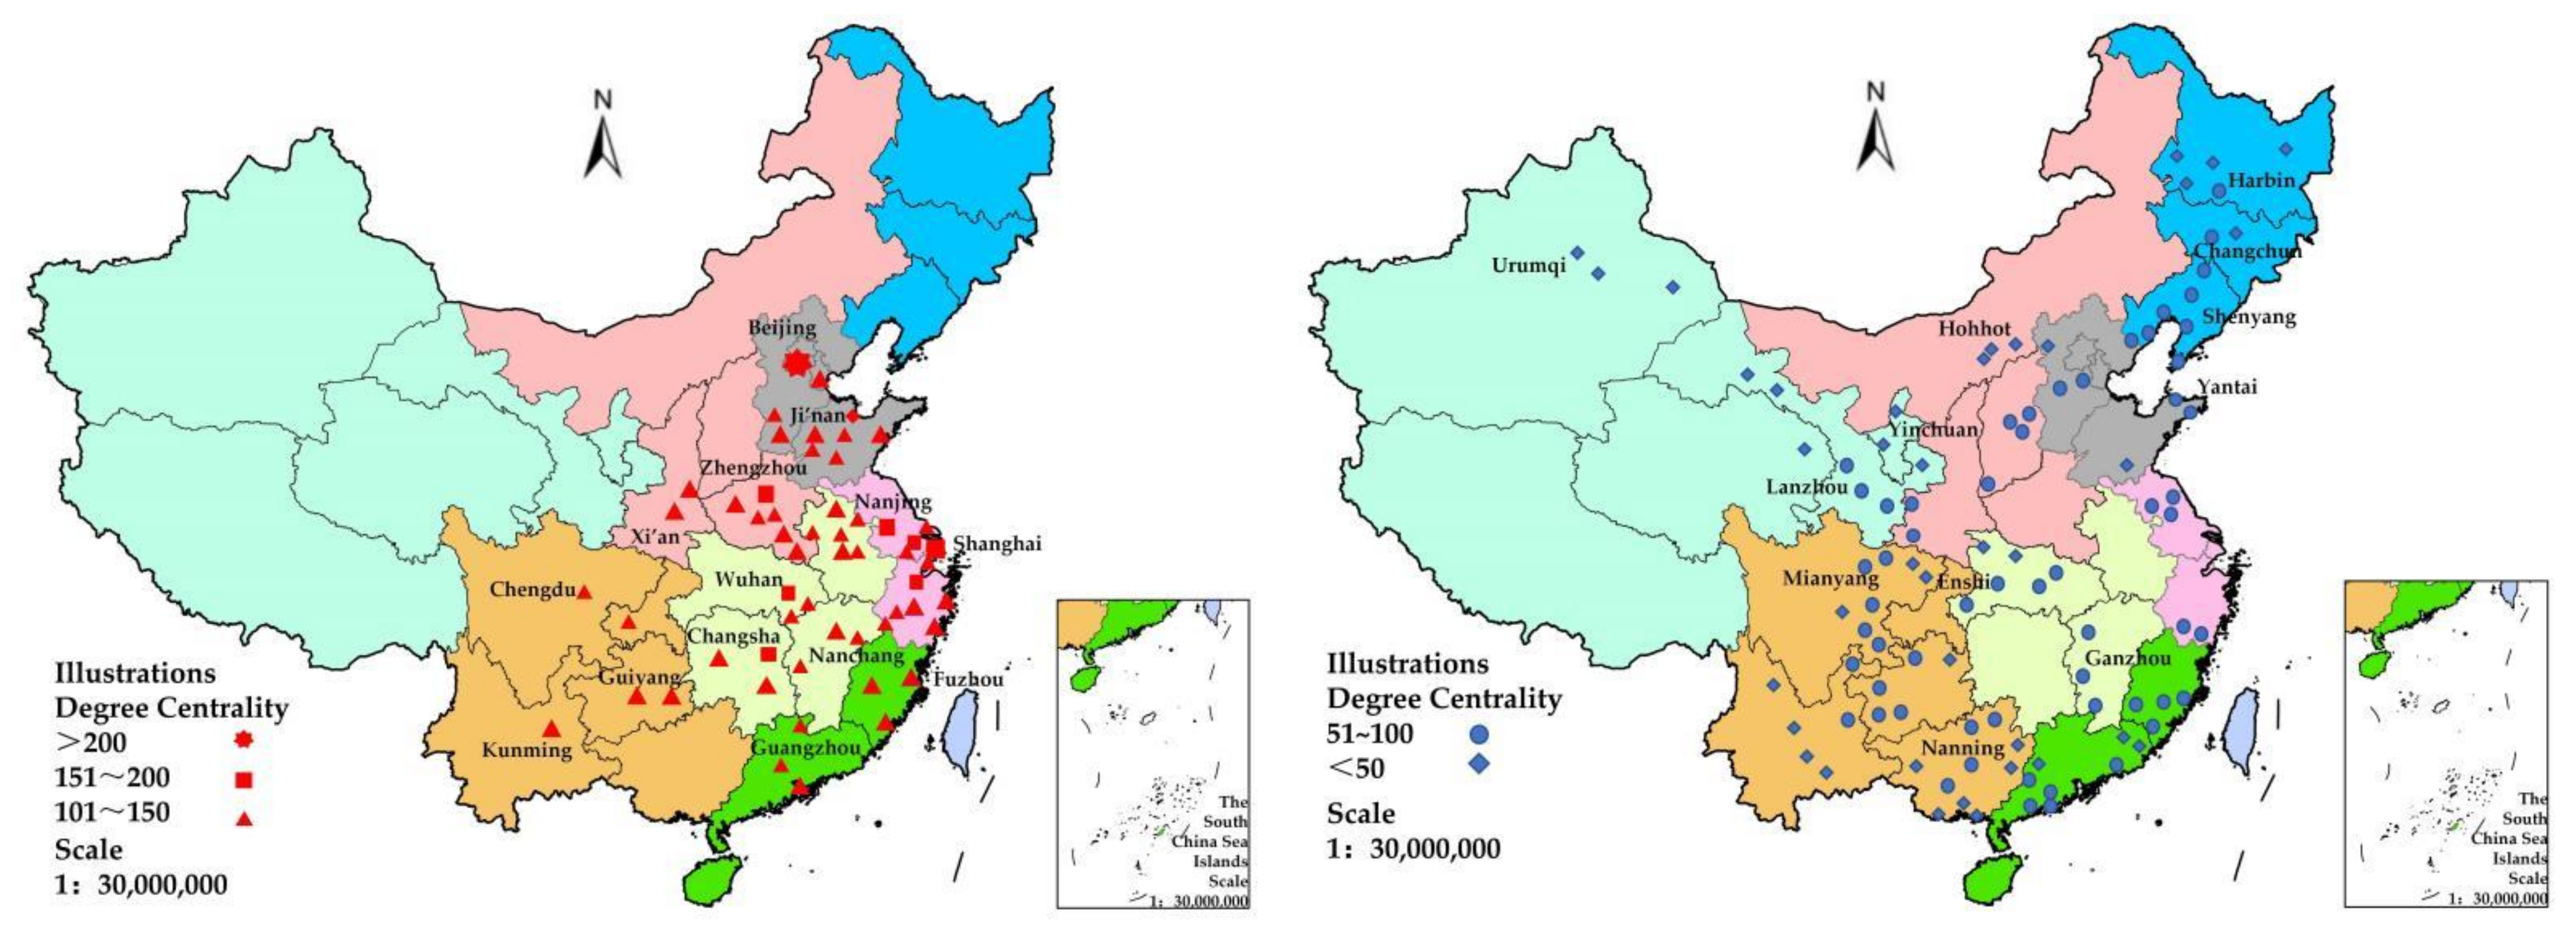
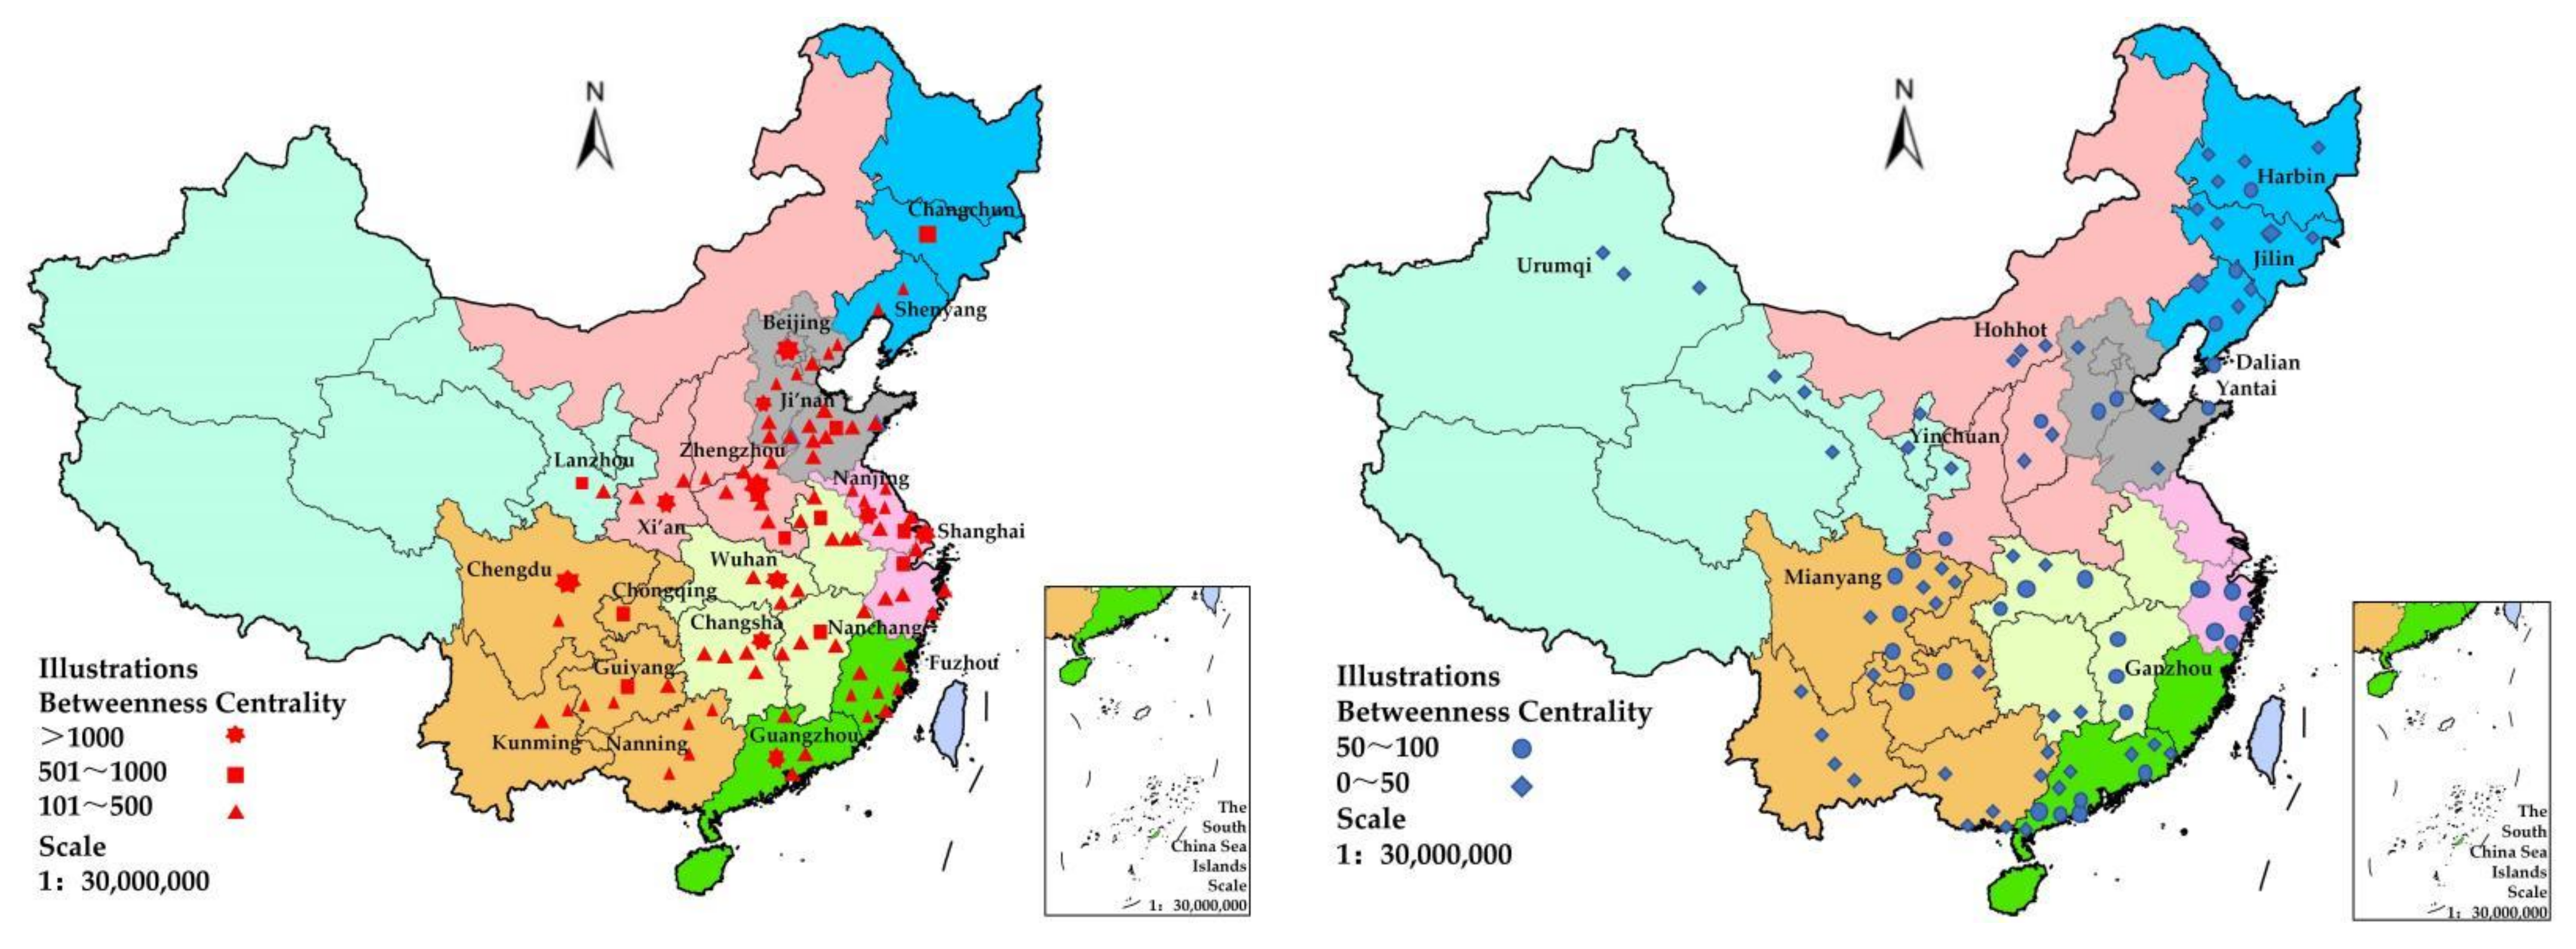
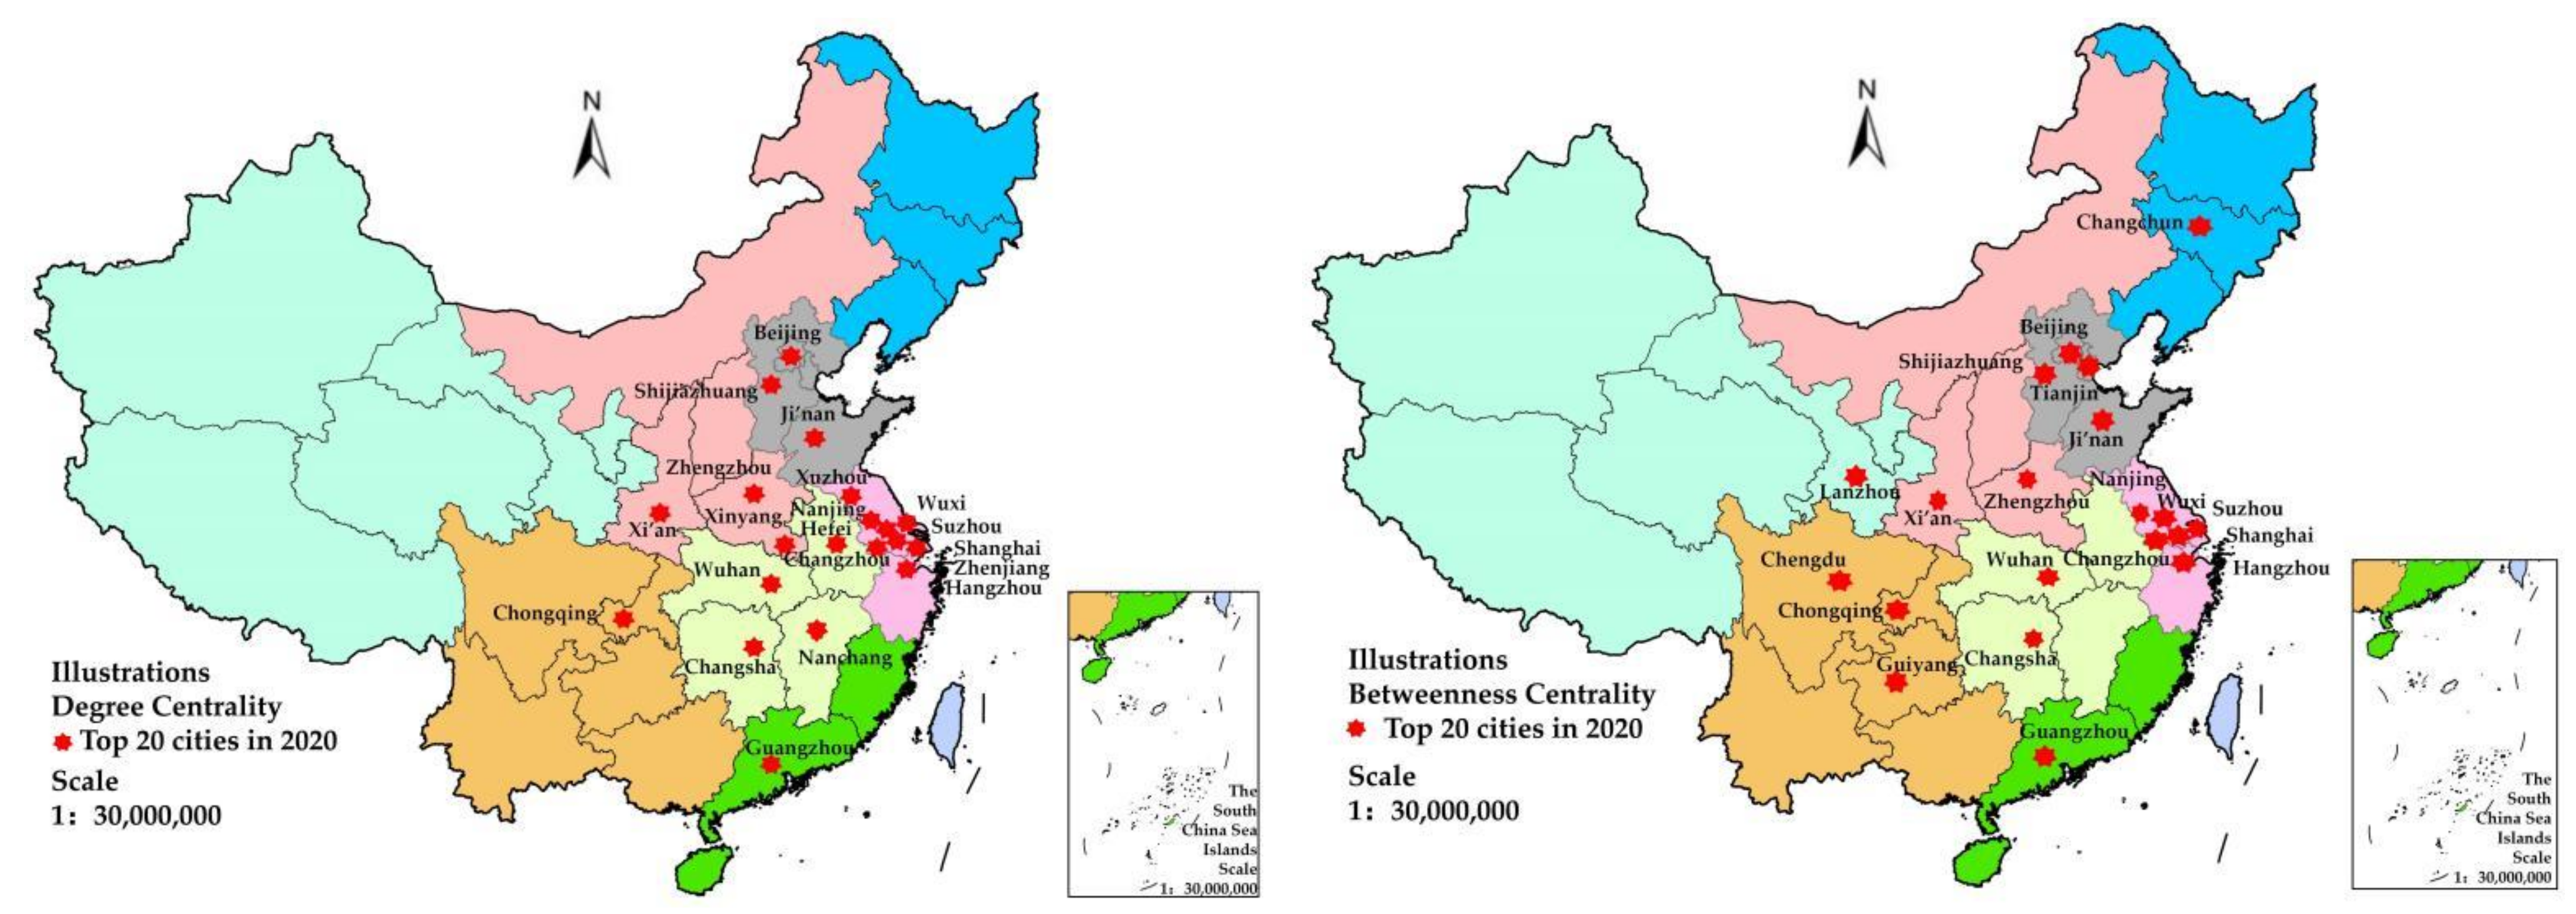
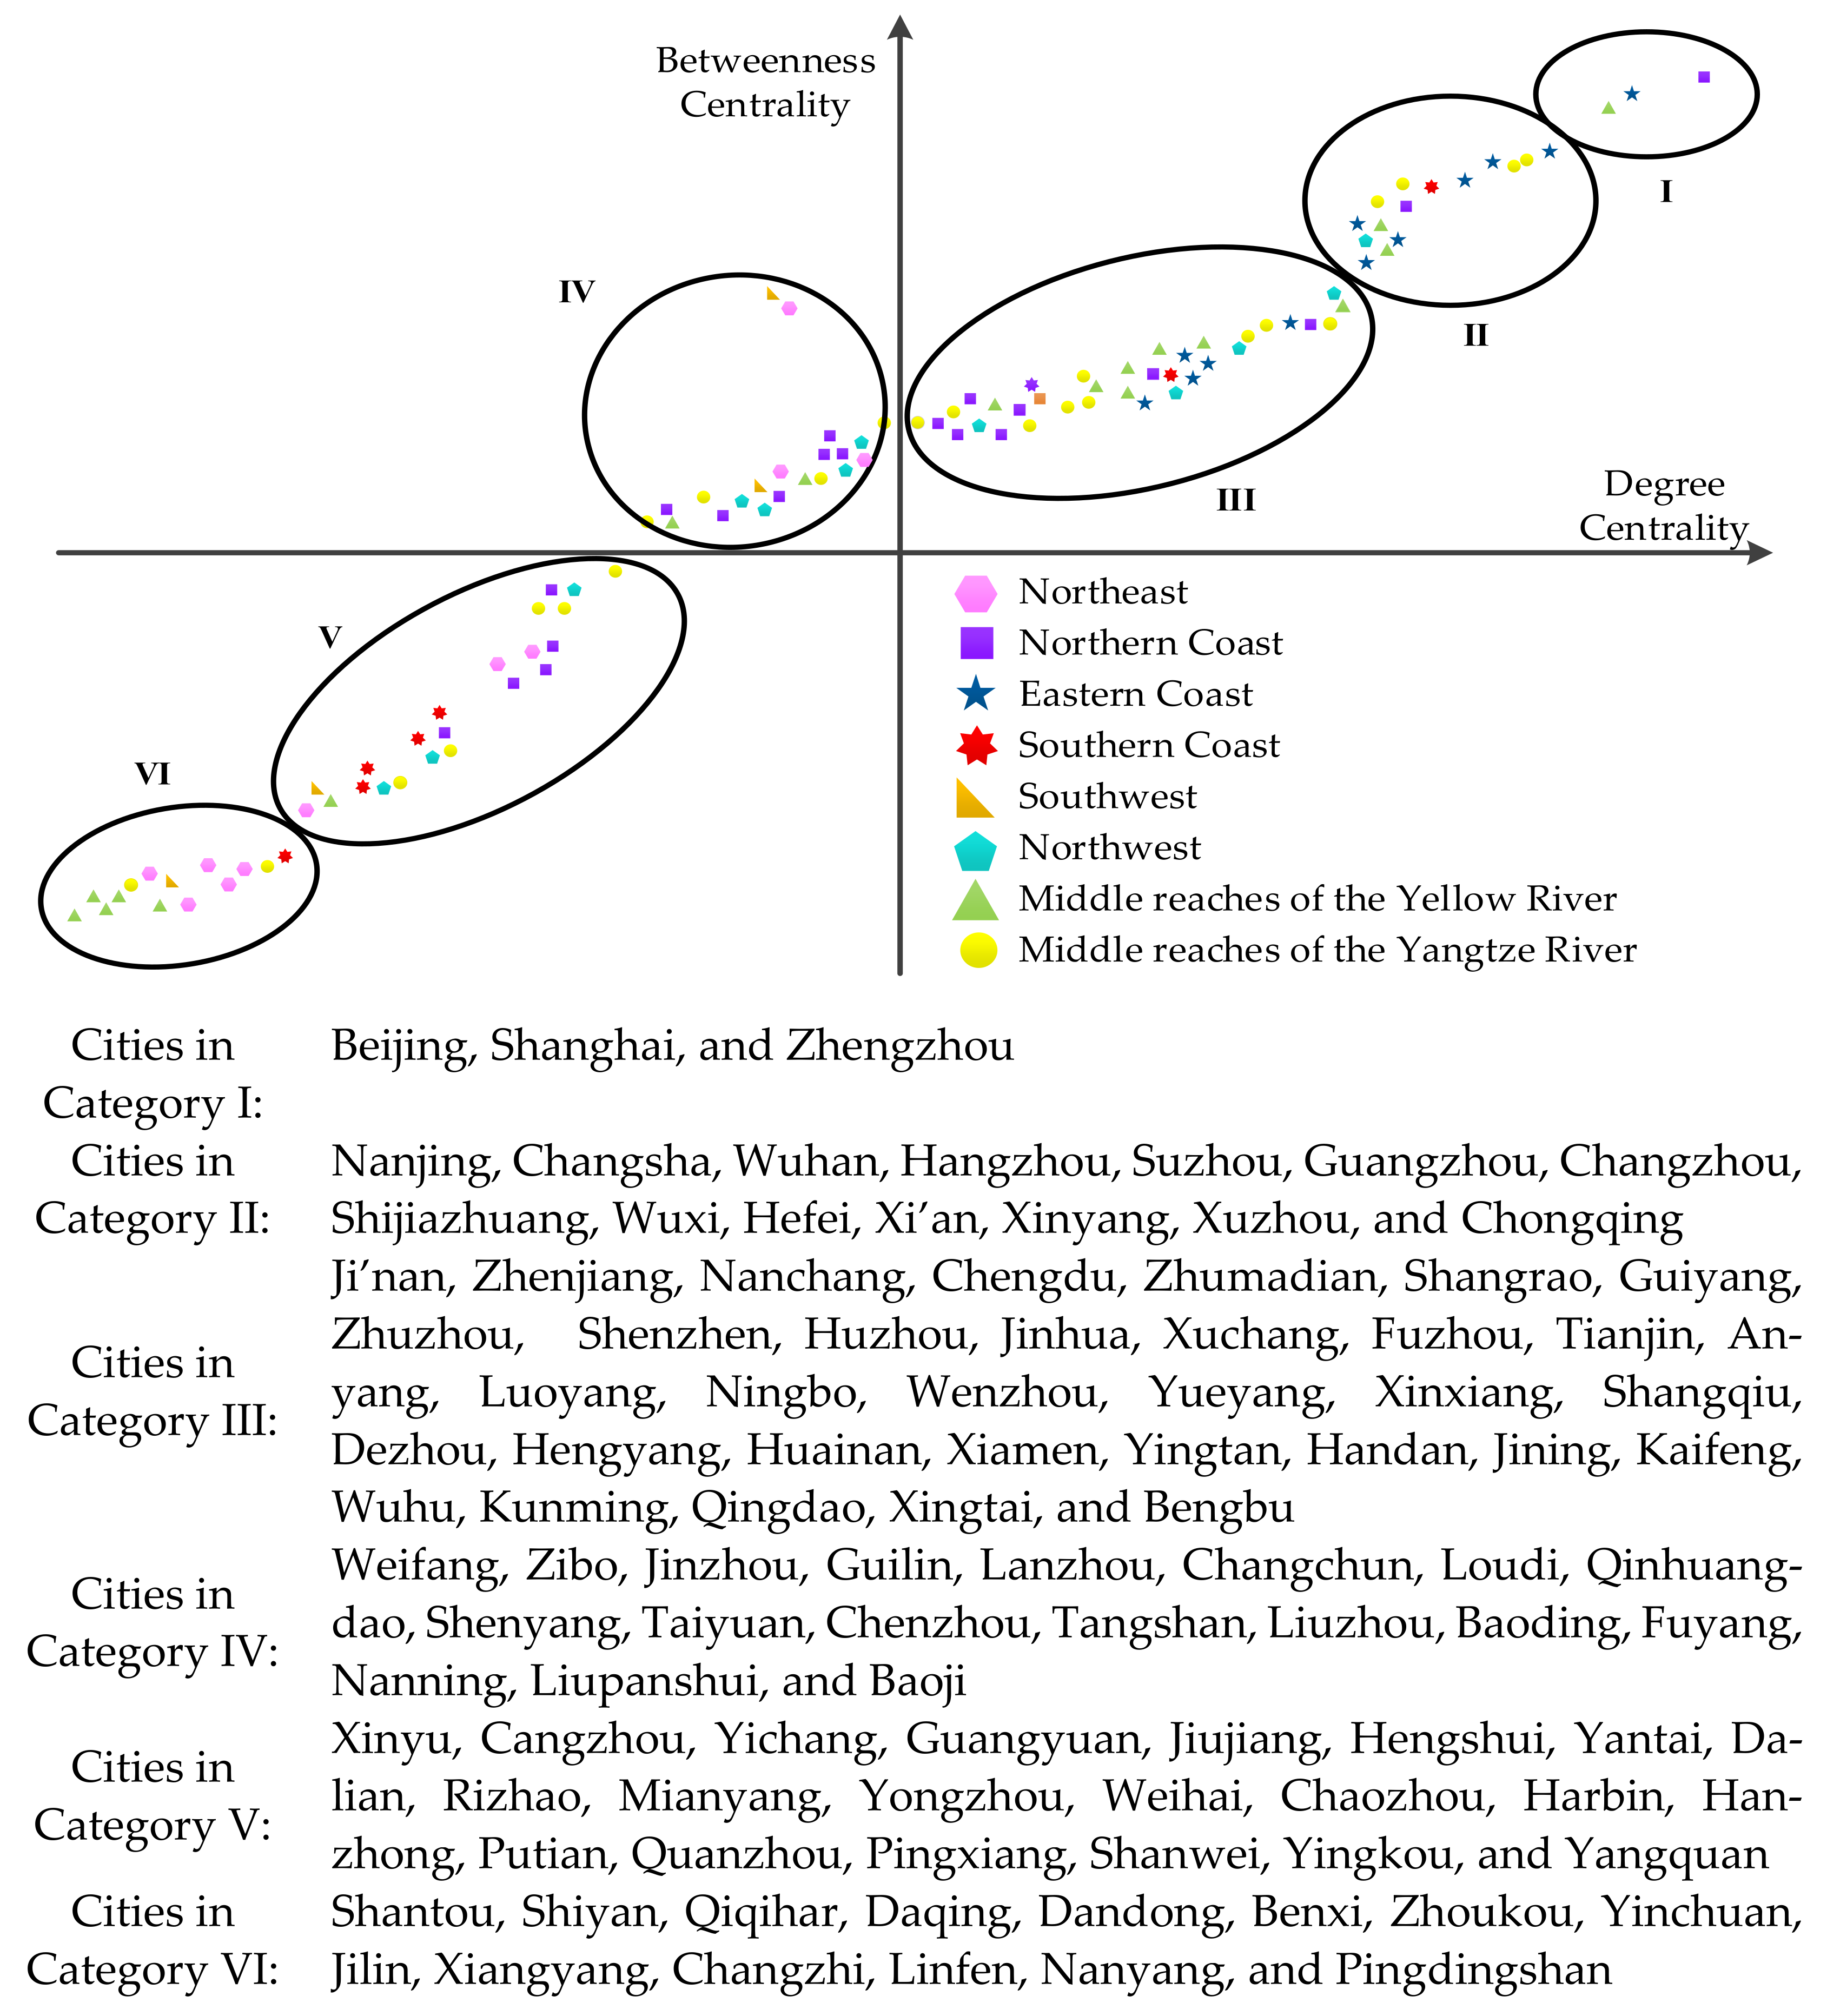
4.2. The Analysis
5. Conclusions
Author Contributions
Funding
Institutional Review Board Statement
Informed Consent Statement
Data Availability Statement
Conflicts of Interest
References
- National Bureau of Statistics. China Statistical Yearbook; China Statistics Press: Beijing, China, 2021. [Google Scholar]
- International Union of Railways. Available online: https://www.uic.org (accessed on 11 April 2021).
- Chen, C.; Hall, P. The impacts of high-speed trains on British economic geography: A study of the UK’s InterCity 125/225 and its effects. J. Transp. Geogr. 2011, 19, 689–704. [Google Scholar] [CrossRef]
- Meng, X.; Lin, S.; Zhu, X. The resource redistribution effect of high-speed rail stations on the economic growth of neighbouring regions: Evidence from China. Transp. Policy 2018, 68, 178–191. [Google Scholar] [CrossRef]
- Tang, Y.; Yu, F.; Lin, F.; Zhang, M. China’s High-speed railway, trade cost and firm export. Econ. Res. 2019, 54, 158–173. [Google Scholar]
- Li, Y.; Chen, Z.; Wang, P. Impact of high-speed rail on urban economic efficiency in China. Transp. Policy 2020, 97, 220–231. [Google Scholar] [CrossRef]
- Lu, J.; Li, H. Can high-speed rail improve enterprise capacity utilization? A perspective of supply side and demand side. Transp. Policy 2022, 115, 152–163. [Google Scholar] [CrossRef]
- Deng, T.; Wang, D.; Hu, Y.; Liu, S. Did high-speed railway cause urban space expansion?—Empirical evidence from China’s prefecture-level cities. Res. Transp. Econ. 2020, 80, 100840. [Google Scholar] [CrossRef]
- Cheng, Y.; Loo, B.P.Y.; Vickerman, R. High-speed rail networks, economic integration and regional specialisation in China and Europe. Travel Behav. Soc. 2015, 2, 1–14. [Google Scholar] [CrossRef]
- Wang, F.; Wei, X.; Liu, J.; He, L.; Gao, M. Impact of high-speed rail on population mobility and urbanisation: A case study on Yangtze River Delta urban agglomeration, China. Transp. Res. Part A Policy Pract. 2019, 127, 99–114. [Google Scholar] [CrossRef]
- Chen, C. Reshaping Chinese space-economy through high-speed trains: Opportunities and challenges. J. Transp. Geogr. 2012, 22, 312–316. [Google Scholar] [CrossRef]
- Liu, S.; Wan, Y.; Zhang, A. Does China’s high-speed rail development lead to regional disparities? A network perspective. Transp. Res. Part A Policy Pract. 2020, 138, 299–321. [Google Scholar] [CrossRef]
- Freeman, L.C. Centrality in social networks conceptual clarification. Soc. Netw. 1978, 1, 215–239. [Google Scholar] [CrossRef] [Green Version]
- Albert, R.; Barabási, A.L. Statistical mechanics of complex networks. Rev. Mod. Phys. 2002, 74, 47–97. [Google Scholar] [CrossRef]
- Newman, M.E.J. A measure of betweenness centrality based on random walks. Soc. Netw. 2005, 27, 39–54. [Google Scholar] [CrossRef]
- Abbasi, A.; Hossain, L.; Leydesdorff, L. Betweenness centrality as a driver of preferential attachment in the evolution of research collaboration networks. J. Inf. 2012, 6, 403–412. [Google Scholar] [CrossRef]
- Wang, J.; Li, C.; Xia, C. Improved centrality indicators to characterize the nodal spreading capability in complex networks. Appl. Math. Comput. 2018, 334, 388–400. [Google Scholar] [CrossRef]
- Zhao, D.; Xiao, G.; Wang, Z.; Wang, L.; Xu, L. Minimum Dominating Set of Multiplex Networks: Definition, Application, and Identification. IEEE Trans. Syst. Man Cybern. Syst. 2021, 51, 7823–7837. [Google Scholar] [CrossRef]
- Semenov, A.; Mantzaris, A.V.; Nikolaev, A.; Veremyev, A.; Veijalainen, J.; Pasiliao, E.; Boginski, V. Exploring Social Media Network Landscapeof Post-Soviet Space. IEEE Access 2018, 7, 411–426. [Google Scholar] [CrossRef]
- Wang, J.; Mo, H.; Wang, F.; Jin, F. Exploring the network structure and nodal centrality of China’s air transport network: A complex network approach. J. Transp. Geogr. 2011, 19, 712–721. [Google Scholar] [CrossRef]
- Su, M.; Luan, W.; Li, Z.; Wan, S.; Zhang, Z. Evolution and determinants of an air transport network: A case study of the Chinese main air transport network. Sustainability 2019, 11, 3933. [Google Scholar] [CrossRef]
- Chung, H.M.; Kwon, O.K.; Han, O.S.; Kim, H. Evolving network characteristics of the Asian international aviation market: A weighted network approach. Transp. Policy 2020, 99, 299–313. [Google Scholar] [CrossRef]
- Su, M.; Hu, B.; Jiang, Y.; Zhang, Z.; Li, Z. Relationship between the Chinese main air transport network and COVID-19 pandemic transmission. Mathematics 2022, 10, 2348. [Google Scholar] [CrossRef]
- Hossain, M.M.; Alam, S. A complex network approach towards modeling and analysis of the Australian airport network. J. Air Transp. Manag. 2017, 60, 1–9. [Google Scholar] [CrossRef]
- Xu, Z.; Harriss, R. Exploring the structure of the U.S. intercity passenger air transportation network: A weighted complex network approach. GeoJournal 2008, 73, 87–102. [Google Scholar] [CrossRef]
- Burghouwt, G.; Hakfoort, J. The evolution of the European aviation network, 1990–1998. J. Air Transp. Manag. 2001, 7, 311–318. [Google Scholar] [CrossRef]
- Ma, W.; Wang, Q.; Yang, H.; Zhang, A.; Zhang, Y. Effects of Beijing-Shanghai high-speed rail on air travel: Passenger types, airline groups and tacit collusion. Res. Transp. Econ. 2019, 74, 64–76. [Google Scholar] [CrossRef]
- Xu, L.; Fan, X.; Luan, W. Strategic corporate social responsibility of high-speed rail in China. China Econ. Rev. 2020, 62, 101499. [Google Scholar] [CrossRef]
- Zhang, Q.; Yang, H.; Wang, Q. Impact of high-speed rail on China’s Big Three airlines. Transp. Res. Part A Policy Pract. 2017, 98, 77–85. [Google Scholar] [CrossRef]
- Cao, J.; Liu, X.C.; Wang, Y.; Li, Q. Accessibility impacts of China’s high-speed rail network. J. Transp. Geogr. 2013, 28, 12–21. [Google Scholar] [CrossRef]
- Wang, L.; Liu, Y.; Sun, C.; Liu, Y. Accessibility impact of the present and future high-speed rail network: A case study of Jiangsu Province, China. J. Transp. Geogr. 2016, 54, 161–172. [Google Scholar] [CrossRef]
- Jiao, J.; Wang, J.; Jin, F. Impacts of high-speed rail lines on the city network in China. J. Transp. Geogr. 2017, 60, 257–266. [Google Scholar] [CrossRef]
- Guo, Y.; Cao, L.; Song, Y.; Wang, Y.; Li, Y. Understanding the formation of city-HSR network: A case study of Yangtze River Delta, China. Transp. Policy 2022, 116, 315–326. [Google Scholar] [CrossRef]
- Railway Customer Service Center of China. Available online: https://www.12306.cn (accessed on 31 December 2020).
- Chen, X.; Qian, J.; Han, D. Tree network under space L and space P model. Appl. Res. Comput. 2015, 32, 45–47. [Google Scholar] [CrossRef]
- Strategies and Policies for Coordinated Regional Development; Development Research Center of the State Council: Beijing, China, 2005; Volume 6.


| Year | 2011 | 2016 | 2020 |
|---|---|---|---|
| Density | 0.147 | 0.265 | 0.293 |
| Average path length | 1.979 | 1.708 | 1.800 |
| Clustering coefficient | 0.909 | 0.677 | 0.682 |
| City | 2020 | 2011 | City | 2020 | 2011 | ||
|---|---|---|---|---|---|---|---|
| 1 | Beijing ─ | 204 | 22 | 1 | Beijing ─ | 4767 | 35 |
| 2 | Shanghai ─ | 191 | 22 | 2 | Zhengzhou ↑ | 1695 | 6 |
| 3 | Zhengzhou ↑ | 189 | 4 | 3 | Xi’an ↑ | 1684 | 6 |
| 4 | Nanjing ↓ | 173 | 22 | 4 | Chengdu ↑ | 1540 | 0 |
| 5 | Changsha ↑ | 165 | 16 | 5 | Shanghai ↓ | 1506 | 35 |
| 6 | Wuhan ↓ | 164 | 16 | 6 | Guangzhou ↓ | 1409 | 20 |
| 7 | Hangzhou ─ | 162 | 14 | 7 | Shijiazhuang ↑ | 1078 | 6 |
| 8 | Suzhou ─ | 154 | 22 | 8 | Lanzhou ↑ | 997 | - |
| 9 | Guangzhou ↓ | 148 | 13 | 9 | Nanjing ─ | 793 | 35 |
| 10 | Changzhou ↑ | 146 | - | 10 | Changsha ↑ | 737 | 25 |
| 11 | Shijiazhuang ─ | 146 | 4 | 11 | Wuhan ↓ | 714 | 25 |
| 12 | Wuxi ─ | 146 | 22 | 12 | Ji’nan ↑ | 710 | 24 |
| 13 | Hefei ↑ | 146 | 18 | 13 | Changchun ↑ | 704 | 1 |
| 14 | Xi’an ↑ | 144 | 4 | 14 | Chongqing ↑ | 642 | - |
| 15 | Xinyang ↑ | 141 | - | 15 | Suzhou ↑ | 641 | 34 |
| 16 | Xuzhou ↓ | 141 | - | 16 | Hangzhou ↓ | 634 | 22 |
| 17 | Chongqing ↑ | 141 | - | 17 | Tianjin ↓ | 575 | 34 |
| 18 | Ji’nan ↓ | 137 | 15 | 18 | Wuxi ↑ | 540 | 34 |
| 19 | Zhenjiang ─ | 137 | 22 | 19 | Changzhou ─ | 516 | - |
| 20 | Nanchang ↑ | 136 | 1 | 20 | Guiyang ─ | 507 | - |
Publisher’s Note: MDPI stays neutral with regard to jurisdictional claims in published maps and institutional affiliations. |
© 2022 by the authors. Licensee MDPI, Basel, Switzerland. This article is an open access article distributed under the terms and conditions of the Creative Commons Attribution (CC BY) license (https://creativecommons.org/licenses/by/4.0/).
Share and Cite
Xu, L.; Su, F.; Zhang, J.; Zhang, N. High-Speed Rail Network Structural Characteristics and Evolution in China. Mathematics 2022, 10, 3318. https://doi.org/10.3390/math10183318
Xu L, Su F, Zhang J, Zhang N. High-Speed Rail Network Structural Characteristics and Evolution in China. Mathematics. 2022; 10(18):3318. https://doi.org/10.3390/math10183318
Chicago/Turabian StyleXu, Lili, Fanrui Su, Jie Zhang, and Na Zhang. 2022. "High-Speed Rail Network Structural Characteristics and Evolution in China" Mathematics 10, no. 18: 3318. https://doi.org/10.3390/math10183318
APA StyleXu, L., Su, F., Zhang, J., & Zhang, N. (2022). High-Speed Rail Network Structural Characteristics and Evolution in China. Mathematics, 10(18), 3318. https://doi.org/10.3390/math10183318