All articles published by MDPI are made immediately available worldwide under an open access license. No special
permission is required to reuse all or part of the article published by MDPI, including figures and tables. For
articles published under an open access Creative Common CC BY license, any part of the article may be reused without
permission provided that the original article is clearly cited. For more information, please refer to
https://www.mdpi.com/openaccess.
Feature papers represent the most advanced research with significant potential for high impact in the field. A Feature
Paper should be a substantial original Article that involves several techniques or approaches, provides an outlook for
future research directions and describes possible research applications.
Feature papers are submitted upon individual invitation or recommendation by the scientific editors and must receive
positive feedback from the reviewers.
Editor’s Choice articles are based on recommendations by the scientific editors of MDPI journals from around the world.
Editors select a small number of articles recently published in the journal that they believe will be particularly
interesting to readers, or important in the respective research area. The aim is to provide a snapshot of some of the
most exciting work published in the various research areas of the journal.
The random variable X is used to represent the normal process containing two important parameters—the process average and the process standard deviation. The variable is transformed using Y = (X − T)/d, where T is the target value and d is the tolerance. The average of Y is then called the accuracy index, and the standard deviation is called the precision index. If only the values of the accuracy index and the process precision index are well controlled, the process quality level as well as the process yield are ensured. Based on this concept, this paper constructed a control chart for the accuracy index and the precision index and derived the confidence intervals of the accuracy index and the precision index using in-control data, as the process was stable. This paper aims to control process quality via monitoring the accuracy and precision of the process. At the same time, fuzzy tests are developed for the indicators of process accuracy and precision to evaluate whether the process quality can reach the k-sigma quality level, as well as offer suggestions about directions of improvement when it fails to reach the k-sigma quality level. Obviously, the model in this paper cannot only evaluate whether the process meets the requirements of the quality level; it can also provide a decision regarding whether the process should be improved. It is very helpful for the enhancement of enterprises’ process capabilities.
Kane [1] proposed process capability index CPK with a bilateral specification for the nominal-the-better (NTB) type of quality characteristic. This index is widely used for process capability assessment and analysis [2,3,4]. It serves as a handy and useful means of communication between manufacturers and customers [5,6,7]. Based on the assumption of normality, the random variable X is said to be a normally distributed random variable with mean μ and standard deviation δ, shown as . The capability index CPK is then defined as follows:
where d (USL LSL)/2 refers to the half length of the specification interval, target T (USL LSL)/2 represents the middle point of the specification interval, USL represents the upper specification limit, and LSL represents the lower specification limit. Furthermore, based on the concept of the Taguchi loss function, Chan et al. [8] developed another bilateral-specification process capability index, CPM, for the NTB type of quality characteristic, as expressed below:
where the denominator of index CPM is the expected value of the Taguchi loss function.
Let , then Y is distributed as , where we can call δ the accuracy index and γ the precision index as follows:
and
Some studies note that the process quality approaches the k-sigma quality level if the absolute value of the accuracy index is smaller than or equal to 1.5/k ( and γ = 1/k) [9]. In addition, for a process with the NTB type of quality characteristic, the process yield p is expressed as follows:
We denote p(k) below as the process reaches the k-sigma quality level with :
Many studies have pointed out that process accuracy index δ and the process precision index γ are functions of all process capability indices; thus, they are two important parameters in the discussion of process capability. As these two indicators are the mean and standard deviation obtained from the transformations of variables from various specifications and tolerances, it is convenient to evaluate and analyze the quality characteristics of various tolerances at the same time [10,11]. When the process precision is higher (the value of k is larger, and the value of precision index γ is smaller), then the process yield is higher. Furthermore, the process yield is for a k-sigma process quality level where δ = 0. Thus, when the process accuracy is higher (the value of accuracy index δ is smaller) the process yield is higher.
Based on the above, two bilateral specification process capability indices, CPK and CPM, can be rewritten, respectively, as follows:
To sum up, when the process average μ deviates less from the target value T, then the process accuracy tends to be higher (the value of δ is smaller); or, as the process standard deviation is lower, the process precision increases (the value of γ becomes smaller). Based on Equations (5)–(8), the values of these two bilateral specification process capability indices and process yields increase accordingly. Therefore, if only the values of the accuracy index δ and the process precision index γ are well controlled, the values of the process capability index and the process yield are ensured. Based on this concept, this paper will construct the control chart for the indexes of accuracy and precision and perform fuzzy testing based on the confidence intervals via in-control data when the process is stable. When the test result indicates that the absolute value of the accuracy index is smaller than or equal to 1.5/k and the precision index is γ ≤ 1/k, it is understood that the process has reached the k-sigma process quality level. Otherwise, the process must be improved. This paper aims to control process quality by monitoring the accuracy and the precision of the process. In addition, fuzzy tests are constructed for the indicators of process accuracy and precision to evaluate whether the process quality can reach the k-sigma quality level, as well as offer suggestions about directions for improvement if it fails to reach the k-sigma quality level.
2. δ−γ Control Chart
As mentioned earlier, as long as the values of the accuracy index δ and the process precision index γ are well controlled, the values of the process capability index and the process yield are guaranteed. Hence, this paper will derive the δ−γ control chart to monitor process accuracy as well as process precision. According to the control chart’s operation model, at regular intervals, n samples are randomly selected from the normal process to form a subsample in a sample size of n; suppose there are m subsamples in total. According to some studies, the number m of subsamples is usually 20 or 25 groups (m = 20 or 25). The m subsamples and their observation values can be represented as follows:
Let , where is distributed as . The m subsamples and their observation values after variable transformation can then be expressed as follows:
Consequently, for each subsample, the subsample mean and subsample standard deviation, respectively, are denoted as follows:
and
Based on the assumption of normality, let and ; then, Z is distributed as the standard normal distribution, and K is distributed as the chi-square distribution with degree of freedom. As p(−3 ≤ Z ≤ 3) = 0.9973, then
The overall sample mean and the pooled sample standard deviation adopted by this paper are denoted below:
and
According to Equations (13)–(15), three standard deviation control charts of accuracy index δ can be represented as follows:
Similarly, as , then
Therefore, the upper control limit, the center control limit, and the lower control limit for precision index γ are presented as follows:
Next, the accuracy and precision of the process can be monitored according to Equations (16) and (18). As mentioned earlier, in-control data can be used to perform a fuzzy test based the confidence interval when the process is under statistical process control.
3. Fuzzy Evaluation Models for Accuracy and Precision Indices
As mentioned earlier, when the value of the accuracy index is between 1.5/k and 1.5/k () and the precision index is γ ≤ 1/k, it means that the process has reached the k-sigma process quality level. According to this standard, this paper develops a fuzzy evaluation model for the accuracy index δ in Section 3.1 and a fuzzy evaluation model for the precision index γ in Section 3.2.
3.1. Fuzzy Evaluation Model for the Accuracy Index
Based on Equations (11) and (14), we have , distributed as , where
Based on Equations (12) and (15), we have
Let
Tm is then distributed as . To obtain the confidence interval of the accuracy index δ, we have
Therefore, the confidence interval of the accuracy index δ is:
According to numerous studies, when Motorola was advancing their designed six-sigma improvement approach, it allowed the process average to shift from the process target by 1.5 sigma [11,12,13]. When the accuracy index is , it means that the process is overly skewed to the right and must be improved. Similarly, when the accuracy index is , it means that the process is overly skewed to the left and must be improved. As previously mentioned, the first condition required for quality to reach the k-sigma quality level is . Therefore, the fuzzy test assumptions of the accuracy index can be expressed as follows:
As described by the sum of studies, the α-cuts of the triangular fuzzy number is illustrated as follows:
where
The triangular fuzzy number is denoted as , where
and
Therefore, the membership function of fuzzy number is
where and are determined by and , respectively. According to Yu et al. [10], Chen and Yu [14], and Chen [15], let set be the area in the graph of , as displayed below:
In addition, let set be the area in the graph of but to the left of the vertical line x = 1.5/k for , and set be the area in the graph of but to the right of the vertical line 1.5/k for . We then have
and
where and . Let , then
Let , then
Similarly, let , then
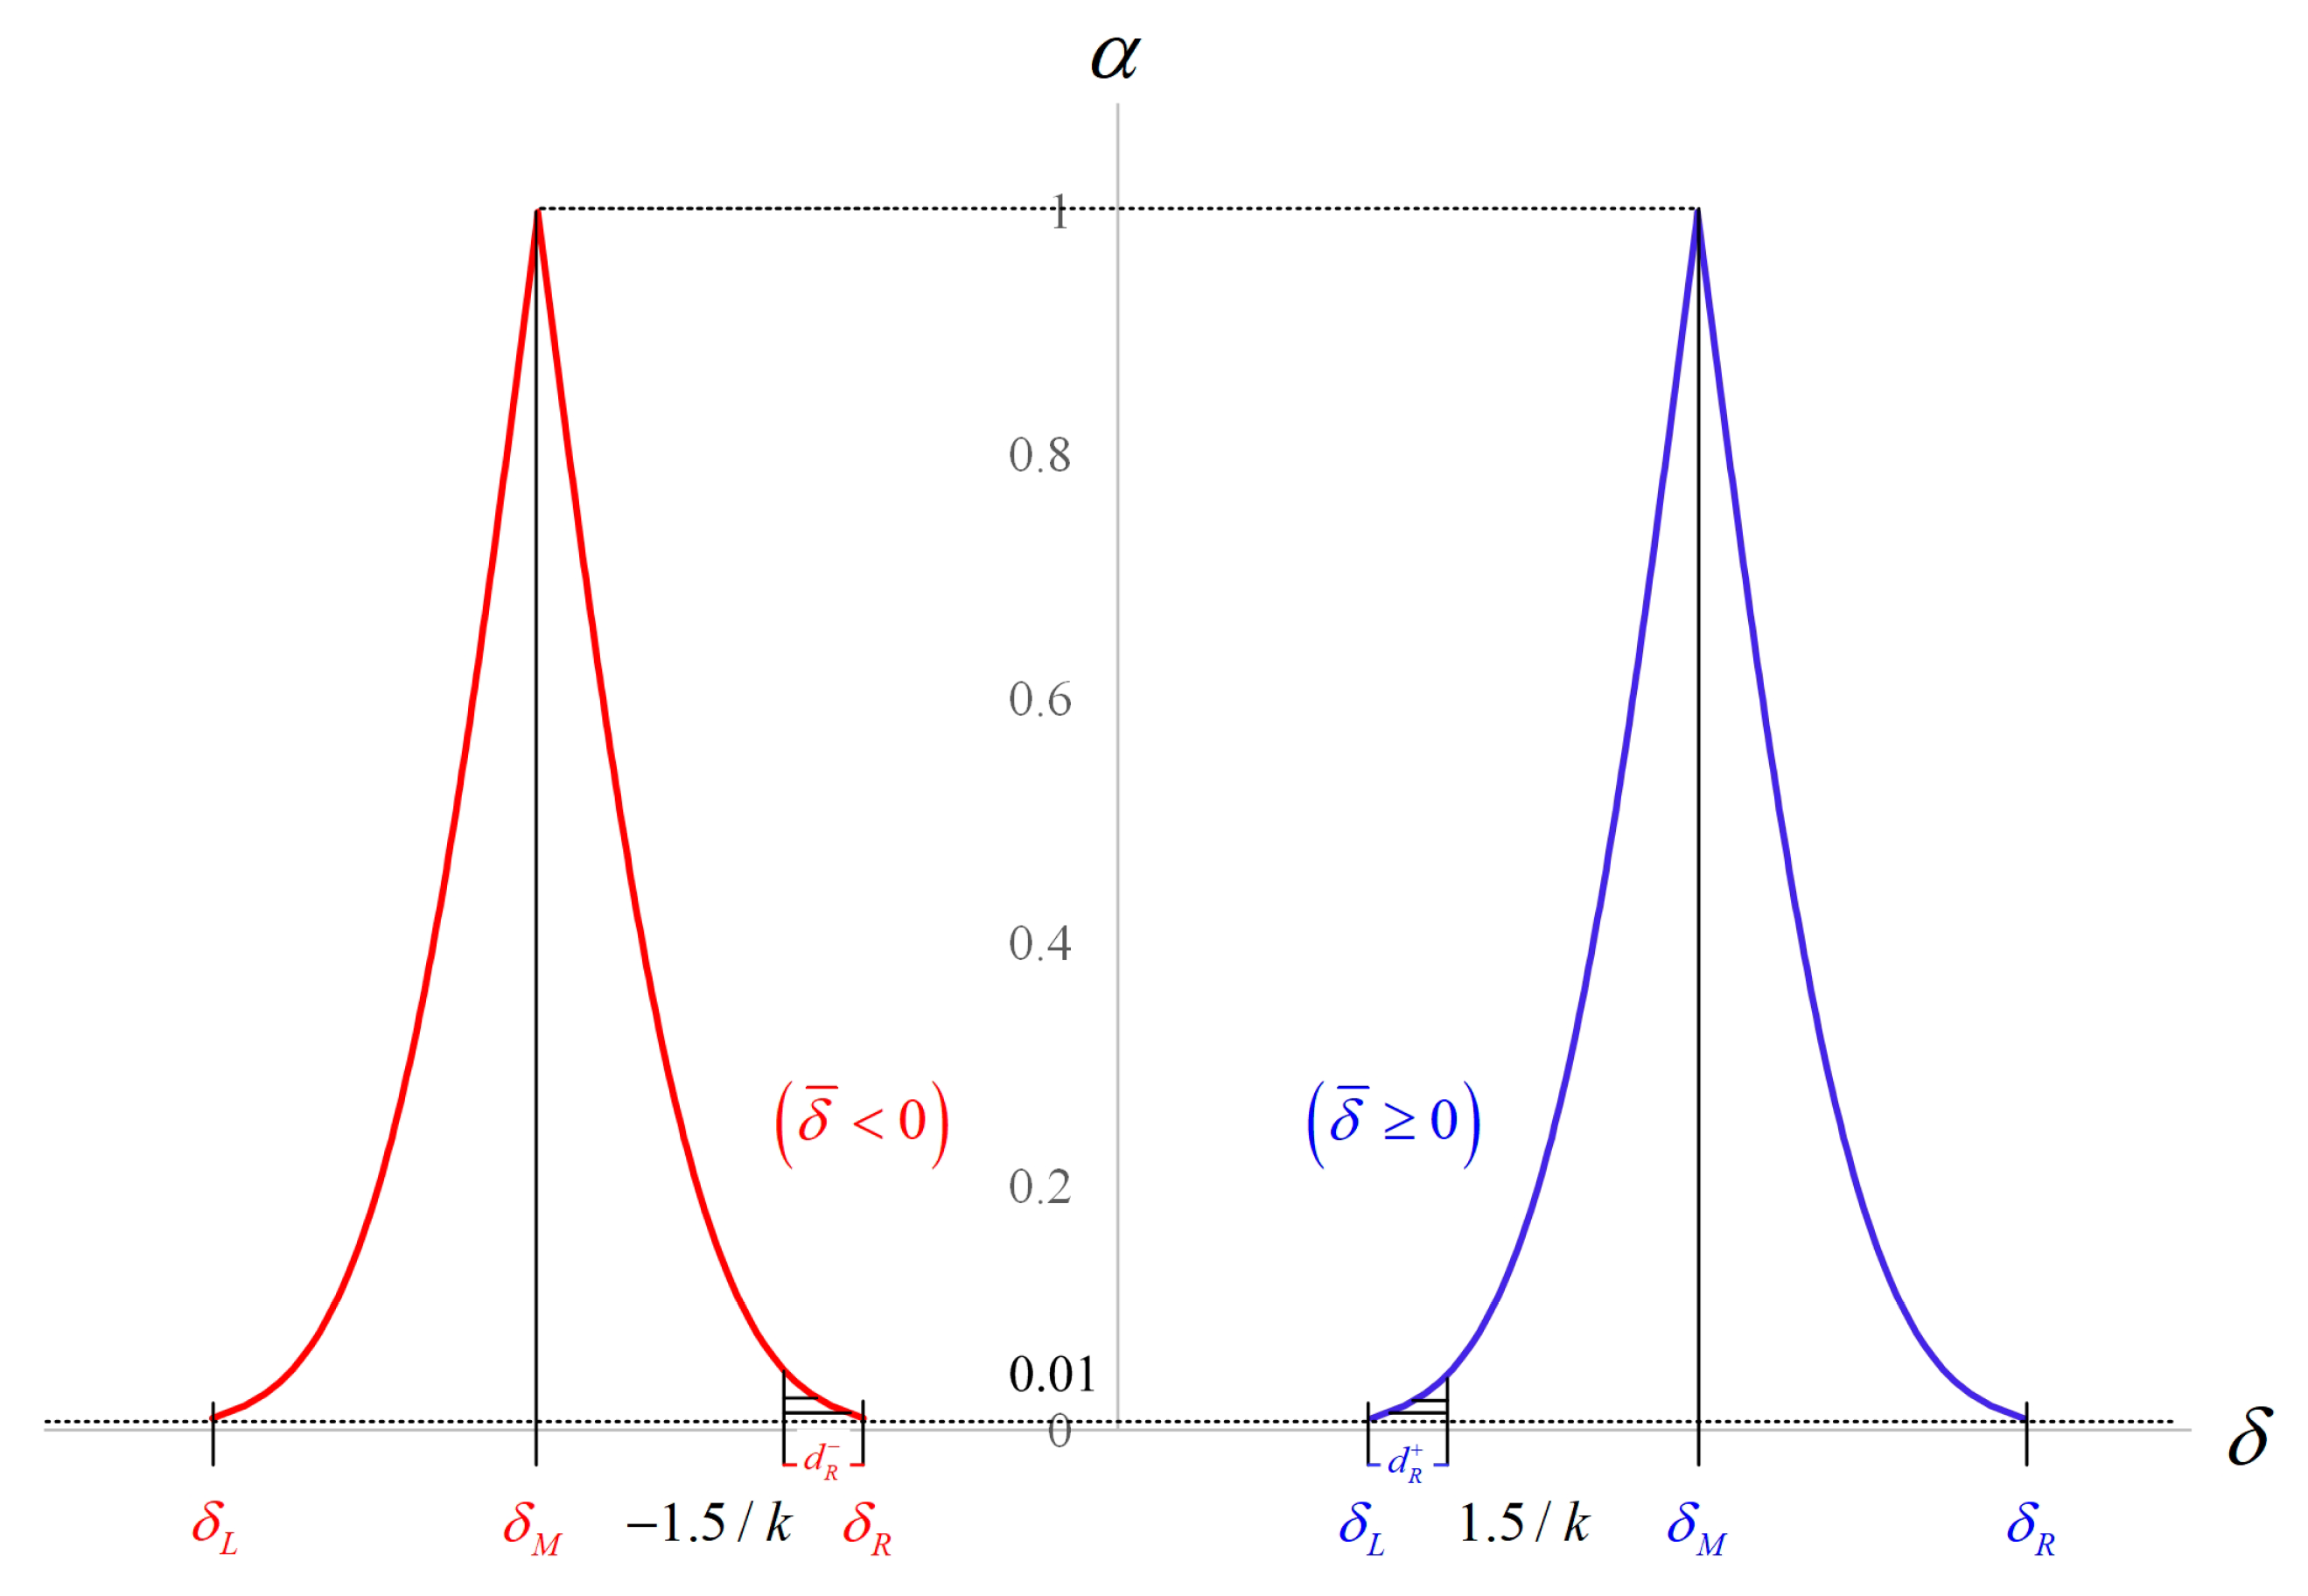
The membership function , relative to (, 0, ), is shown in Figure 1 as below:
According to many studies, process engineers can determine the values of ϕ based on accumulated production data or expert experience in the past [16,17,18,19,20]. The fuzzy evaluation rules and improvement countermeasures for the accuracy index δ are then made as follows:
When and , reject H0 and conclude that . This means that the process is overly skewed to the right; therefore, solutions, such as machine parameters, must be adjusted to move the average number to the left to enhance the accuracy of the process.
When and , reject H0 and conclude that . This means that the process is overly skewed to the left; therefore, solutions, such as machine parameters, must be adjusted to move the average number to the right to improve the process accuracy.
Except for the above two scenarios, do not reject H0 and conclude that . This means that the process accuracy meets the requirements.
3.2. Fuzzy Evaluation Model for the Precision Index
According to Equation (20), let
is then distributed as . Aiming to gain the confidence interval of precision index γ, we have
Therefore, the confidence interval of precision index γ is expressed as follows:
Similar to the accuracy index, the fuzzy evaluation hypothesis for precision index γ is illustrated below.
As mentioned earlier, the second condition required for the quality to reach the k-sigma quality level is γ ≤ 1/k. Therefore, the fuzzy test assumptions of the precision index can be expressed as follows:
As described by the sum of studies, the α-cuts of the triangular fuzzy number is as follows:
where
and
The triangular fuzzy number is represented by , where
and
Therefore, the membership function of the fuzzy number is
where and are determined by and , respectively. Let set be the area in the graph of and set be the area in the graph of but to the right of the vertical line . Figure 2 demonstrates the membership function with vertical line .
Therefore,
and
where . Let and , then
and
As noted above, process engineers can determine the values of based on past accumulated production data or expert experience. The fuzzy evaluation rules for precision index γ are then:
When , reject and conclude that . This shows that the process variation is too large and must be improved so as to enhance the process precision. Common improvement methods are (1) establishing standard operating procedures, (2) maintaining the homogeneity of processed materials, and (3) replacing old machines, etc.
When , do not reject and conclude that . This means that the process precision meets the requirements, and the original standard operating procedure should continue.
Next, the fuzzy evaluation steps of accuracy index and precision index are constructed as follows:
Accuracy Index δ
Step 1-1: Calculate and based on Equations (19) and (20).
Step 1-2: Calculate and based on Equations (27) and (29).
Step 1-3: Calculate (), , and based on Equations (34)–(36).
Step 1-4: Make decisions as follows:
(1)
When and , reject and conclude that .
(2)
When and , reject and conclude that .
(3)
Except for the above two scenarios, do not reject and conclude that .
Precision Index γ
Step 2-1: Calculate and based on Equations (43) and (45).
Step 2-2: Calculate , , and based on Equations (49) and (50).
Step 2-3: Make decisions as follows:
(1)
When , reject and conclude that .
(2)
When , do not reject and conclude that .
4. A Practical Application
Numerous studies have proposed confidence interval-based fuzzy tests to evaluate the process capabilities of component products, such as bearing connectors and gears [11,21]. Additionally, this method has also been used to evaluate satisfaction indicators, job performance indicators, physical fitness indicators, etc. [15,22]. These studies all noted that fuzzy tests based on confidence intervals are suitable for small samples, which can not only reduce the risk of misjudgment caused by sampling error, but also meet enterprises’ rapid response demands [14,15]. Subsequently, this paper uses bicycle components made in Taiwan as an example to explain the application of the proposed fuzzy evaluation models.
Taiwan has two well-known bicycle brands, Giant and Merida, and nearly a thousand spare-part manufacturers. Many famous bicycle spare-part manufacturers, such as Fast Line, SR Suntour, and Fox, have set up factories in Taiwan. Therefore, Taiwan can be said to be the kingdom of bicycles. Bicycles have many important components, and many studies note that all components must meet quality standards to ensure the quality of the final products. Among these key components, the 140 mm disc brake is a common road bike specification; it is an important component directly related to riding safety. Therefore, this paper uses the 140 mm disc brake as an example to demonstrate the proposed method’s practical application. Moreover, the proposed method is suitable for quality evaluation and improvement of all components in the bicycle industry chain; applying it will help improve the entire industry chain’s quality.
As 140 mm disc brakes are directly related to bicycle riding safety, a bicycle component manufacturer requires their manufacturing process to reach the 6-sigma quality level (k = 6). As stated earlier, when the value of accuracy index is between 1/4 and 1/4, and the precision index is γ ≤ 1/6, it means that the process is at the 6-sigma process quality level. In our example, to control process quality, a random sample (sample size, n 5) was selected every other time unit and transformed using the variable . The statistical process control was applied to 20 sample groups, and their various statistics were calculated as follows:
and
Therefore, assumptions for the fuzzy test of the accuracy index could be expressed as follows:
According to Equation (23), the 99% confidence interval of could be expressed as:
As 0.281 0, the values of and were calculated as follows:
The value of ϕ was 0.2(ϕ = 0.2), determined by the process engineer according to accumulated production data or expert experience. According to the fuzzy evaluation rule 1, we rejected H0 and summarized that δ > 1/4 for and . Obviously, the process was too skewed to the right; which indicated that the quality engineer must explore the cause and implement improvement strategies, such as adjusting machine parameters, to move the average to the left to enhance the process accuracy.
Furthermore, the fuzzy evaluation hypotheses for precision index γ could be shown as follows:
According to Equation (23), the 99% confidence interval of γ could be expressed below:
The values of and were then calculated as follows:
The value of 0.2 () was determined by the process engineers according to accumulated production data or expert experience. Based on the fuzzy evaluation rule 2, we did not reject for and concluded that γ ≤ 1/6, which indicated that the process precision met the requirement.
5. Conclusions, Limitations, and Future Research
5.1. Conclusions
Process capability indices CPK and CPM and the process yield are all functions of the accuracy index δ and the precision index γ. When the process accuracy is higher (the value of δ is smaller) or the process precision is higher (the value of γ is smaller), the values of the process capability index and the process yield both increase accordingly. Therefore, if only the values of the accuracy index δ and the process precision index γ are well controlled, the values of the process capability index and the process yield are ensured. First, this paper derived the δ−γ control chart to monitor the process accuracy and the process precision. Next, when the process was stable, the confidence intervals of the accuracy index and the precision index were deduced using data under the statistical process control. Subsequently, fuzzy evaluation models were developed using the confidence intervals of these two indicators. These fuzzy evaluation models can not only evaluate whether the process accuracy reaches the required level, but can also indicate the direction required for process improvement, which is greatly beneficial to improving enterprises’ process quality.
5.2. Limitations and Future Research
This paper established the δ−γ control chart to monitor the process accuracy and the process precision and assumed that the process distribution was in a normal state. When the process distribution is abnormal, the control chart proposed in this paper, that is, fuzzy evaluation models, are not applicable. This is the research limitation of this paper, as well as the focus of future research.
Author Contributions
Conceptualization, K.-S.C., T.-H.H. and R.-C.T.; methodology, K.-S.C., T.-H.H. and R.-C.T.; software, T.-H.H.; validation, T.-H.H. and W.-Y.K.; formal analysis, K.-S.C. and R.-C.T.; investigation, T.-H.H. and W.-Y.K.; resources, T.-H.H. and W.-Y.K.; data curation, T.-H.H.; writing—original draft preparation, K.-S.C., T.-H.H., R.-C.T. and W.-Y.K.; writing—review and editing, K.-S.C. and R.-C.T.; visualization, W.-Y.K.; supervision, K.-S.C.; and project administration, R.-C.T. All authors have read and agreed to the published version of the manuscript.
Funding
This research received no external funding.
Institutional Review Board Statement
Not applicable.
Informed Consent Statement
Not applicable.
Data Availability Statement
Not applicable.
Conflicts of Interest
The authors declare no conflict of interest.
References
Kane, V.E. Process capability indices. J. Qual. Technol.1986, 18, 41–52. [Google Scholar] [CrossRef]
Yalçın, S.; Kaya, I. Analyzing of process capability indices based on neutrosophic sets. Comput. Appl. Math.2022, 41, 287. [Google Scholar] [CrossRef]
Ramos, P.L.; Almeida, M.H.; Louzada, F.; Flores, E.; Moala, F.A. Objective bayesian inference for the capability index of the weibull distribution and its generalization. Comput. Ind. Eng.2022, 167, 108012. [Google Scholar] [CrossRef]
Costa, A.F.B. The use of the cpm index to monitor processes. Qual. Reliab. Eng. Int.2022, 38, 3632–3643. [Google Scholar] [CrossRef]
Lepore, A.; Palumbo, B.; Castagliola, P. A note on decision making method for product acceptance based on process capability indices Cpk and Cpmk. Eur. J. Oper. Res.2018, 267, 393–398. [Google Scholar] [CrossRef]
Besseris, G.J. Evaluation of robust scale estimators for modified Weibull process capability indices and their bootstrap confidence intervals. Comput. Ind. Eng.2019, 128, 135–149. [Google Scholar] [CrossRef]
Sanchez-Marquez, R.; Jabaloyes Vivas, J. Building a cpk control chart—A novel and practical method for practitioners. Comput. Ind. Eng.2021, 158, 107428. [Google Scholar] [CrossRef]
Chan, L.K.; Cheng, S.W.; Spiring, F.A. A new measure of process capability Cpm. J. Qual. Technol.1988, 20, 162–175. [Google Scholar] [CrossRef]
Chen, K.S.; Chen, H.T.; Chang, T.C. The construction and application of Six Sigma quality indices. Int. J. Prod. Res.2017, 55, 2365–2384. [Google Scholar] [CrossRef]
Yu, C.M.; Chen, K.S.; Hsu, T.H. Confidence-interval-based fuzzy testing for the lifetime performance index of electronic product. Mathematics2022, 10, 1405. [Google Scholar] [CrossRef]
Wu, M.F.; Chen, H.Y.; Chang, T.C.; Wu, C.F. Quality evaluation of internal cylindrical grinding process with multiple quality characteristics for gear products. Int. J. Prod. Res.2019, 57, 6687–6701. [Google Scholar] [CrossRef]
Breyfogle, F.W.; Cupello, J.M.; Meadows, B. Managing Six Sigma: A Practical Guide to Understanding, Assessing, and Implementing the Strategy That Yields Bottom-Line Success; Wiley: New York, NY, USA, 2001. [Google Scholar]
Linderman, K.; Schroeder, R.G.; Zaheer, S.; Choo, A.S. Six Sigma: A goal-theoretic perspective. J. Oper. Manag.2003, 21, 193–203. [Google Scholar] [CrossRef]
Chen, K.S.; Yu, C.M. Fuzzy decision-making model for process quality improvement of machine tool industry chain. J. Intell. Fuzzy Syst.2022, 42, 1547–1558. [Google Scholar] [CrossRef]
Chen, K.S. Fuzzy testing of operating performance index based on confidence intervals. Ann. Oper. Res.2022, 311, 19–33. [Google Scholar] [CrossRef]
Chang, T.C. Fuzzy process capability analysis for machined product with multiple characteristics of symmetric tolerance. Proc. Inst. Mech. Eng. Part B-J. Eng. Manuf2022. [Google Scholar] [CrossRef]
Huang, C.C.; Chang, T.C.; Chen, B.L. Fuzzy assessment model to judge quality level of machining processes involving bilateral tolerance using crisp data. J. Chin. Inst. Eng.2021, 44, 1–10. [Google Scholar] [CrossRef]
Lo, W.; Yang, C.M.; Lai, K.K.; Li, S.Y.; Chen, C.H. Developing a novel fuzzy evaluation model by one-sided specification capability indices. Mathematics2021, 9, 1076. [Google Scholar] [CrossRef]
Chen, K.S.; Yu, C.M.; Hsu, T.H.; Cai, S.R.; Chiou, K.C. A model for evaluating the performance of the bearing manufacturing process. Appl. Sci.2019, 9, 3105. [Google Scholar] [CrossRef] [Green Version]

