Abstract
The metro network plays a vital role in the urban transportation system. However, the metro network is easily damaged by humans and natural disturbances. This can cause serious economic damage, such as the suspension of metro station operations and line disruptions. Therefore, we conducted this study in order to minimize the loss caused by the damage to the metro network and improve the performance of the network after recovery. Based on the cascading failures of metro networks, this paper proposes a recovery model for metro networks considering the value of time. Then, considering the time value, a new node importance measure is proposed using the determination of maintenance priorities. The maintenance priorities of nodes with different importance values are investigated to minimize network losses. Lastly, the applicability of the method is verified by a metro network in Zhengzhou city.
MSC:
90B25
1. Introduction
1.1. Background
With the acceleration of urbanization and the rapid development of regional integration, residents’ commuting travel and daily travel demand have increased steadily [1]. The different public transportation routes form many complex transportation networks. Metro networks are usually the backbone of these transportation networks. It has become the most important public transport mode in modern cities [2]. However, accidents frequently occur in metro systems [3]. Accidents can cause lines or stations to close and shut down. For example, in October 2020, a cable fault in the Singapore Metro Network disrupted service on some metro network lines, affecting a total of approximately 123,000 passengers. Due to the unpredictability and great destructiveness of accidents, it is not possible to prevent all serious accidents in advance. An alternative solution is to consider recovery perspectives. The ability to recover quickly from disturbance events has become increasingly important for metro networks. Moreover, the recovery of metro networks is interlinked with socioeconomic conditions and individuals [4]. Therefore, this paper considers the value of time in the recovery process and proposes a performance variation model for metro networks. The optimal maintenance order of failed nodes of metro networks after cascading failure is investigated. The uses and advantages of this method are illustrated by one particular case [5].
1.2. Literature Reviews
In terms of network performance and reliability, Niu [6] developed an algorithm that iteratively separates capacity vectors, satisfying the required capacity level from the universal space to measure the performance of a multi-state flow network. Bisht et al. [7] studied the network reliability and the stability of the communication network system to identify the critical components in the network and also to quantify the impact of component failures. Wang et al. [8] modeled a high-speed railway as a three-layer network including topological, functional, and service layers and assessed the integrated network performance from the view of transportation accessibility. Zhang et al. [9] proposed a cascading reliability model to model, measure, and control coupling performances against cascading failures. Ma et al. [10] presented a technique for the probabilistic simulation of power transmission systems under hurricane events and provided fundamental insights into the modeling and quantification of power system performance and resilience. Wu and Baker [11] proposed a statistical learning technique, Random Forests, to efficiently estimate network performance in place of direct physical simulation. Levitin and Dai [12] introduced service reliability and performance indices and presented a fast numerical algorithm for their evaluation of arbitrary subtask distribution in a grid with star architecture. Levitin and Xing [13] presented an algorithm for evaluating the performance distribution of complex series-parallel multi-state systems with common cause failures caused by the propagation of failures in system elements. Xing and Dugan [14] proposed a generalized phased-mission system (GPMS) analysis methodology called GPMS-CPR to analyze GPMS reliability, performance, and sensitivity. Kumar et al. [15] used semi-Markov processes and the regenerative point technique to analyze probabilistically various performance measures of two redundant systems under Weibull failure, and repair activities using two stochastic models comprised of one original and one duplicate unit were developed with the provision of a single repair facility and priority. Consilvio et al. [16] presented a stochastic model for scheduling predictive and risk-based maintenance activities in the rail sector. The maintenance priorities are based on the criticality of assets, determined by the relevant failure probability, related to asset degradation conditions, and the consequent direct and indirect damages.
In terms of network failure, Lu et al. [17] proposed an improved Coupled Map Lattices model to address the evolution process of cascading failures on the rail transit network. Zhang and Ng [18] constructed an urban railway network (URN) as a directed weighted network at different times and studied the dynamic network robustness against the fluctuation of passenger flow-induced cascading failures under different failure modes. Huang et al. [19] established the cascading failure model based on disaster spreading theory and applied it to the Chengdu Metro Network. Xing [20] systematically reviewed cascading failure modeling and reliability analysis methodologies, as well as mitigation strategies for building the resilience of IoT systems against cascading failures. Xing and Levitin [21] consider the reliability analysis of binary-state systems, subject to propagated failures with global effect, and failure isolation phenomena. Yan et al. [22] proposed a signal momentum contrast for unsupervised representation learning. Wu et al. [23] investigated a resilience-based optimal maintenance strategy under the cascading failure of the cyber–physical power system. Levitin et al. [24] presented a method for evaluating expected damage associated with nodes’ deprivation of the supply of commodities in multi-commodity networks with a given topology as a result of an intentional attack on randomly chosen network links. Lin et al. [25] developed a method to measure the impact of correlated failures on network reliability, which is defined as the probability of demand satisfaction. For the cascaded faults in complex networks, Rawa [26] proposed a transmission expansion planning model to ensure the resilience of the power system and reduce the impact of cascaded faults.
The maintenance order can have an impact on the extent and speed of network performance recovery. In this paper, the importance measure is used in the determination of maintenance priorities. The node with a higher maintenance priority is maintained first in order to achieve better recovery results for the network.
In terms of the importance measure, Xu et al. [27] proposed a new resilience-based component importance ranking measure for multi-state networks from the perspective of a post-disaster restoration process. Levitin et al. [28] proposed an approach based on the universal generating function technique for the evaluation of the introduced importance measures. Dui et al. [29] proposed a new importance measure for analyzing the impact of external factors on system performance. Wu et al. [30] introduced an importance measure, called Component Maintenance Priority, which is used to select components for preventive maintenance. Wu and Coolen [31] proposed a new cost-based importance measure, which considers costs incurred by maintaining a system and its components within a finite time horizon. Almoghathawi and Barker [32] offered a means to study the importance of interdependent network components with a resilience-focused performance measure.
1.3. Motivation and Contribution of This Paper
In terms of metro network performance, most of the existing literature studies the performance measure from the perspective of reliability, convenience, accessibility, etc. The income level of the metro network can reflect the change in network performance more intuitively, but the existing literature rarely takes the income of the metro network as the index of network performance. In terms of metro network failure, the degree of nodes and the betweenness of nodes are often used as indicators to measure the node load in the study of network cascading failure. The existing literature rarely used passenger flow as an index to measure the node load in the study of network cascading failure. In terms of metro network recovery, the existing literature mainly considers the maintenance cost during the recovery process, and the time cost during the metro network recovery process has not been considered. In terms of the node importance measure, most of the existing literature focuses on the use of the node importance measure for determining critical nodes in metro networks. The existing literature does not consider the time value of the node recovery process.
This paper bridges the above-mentioned research gap and makes the following contributions:
- A new recovery measure model for metro networks considering the value of recovery time is developed. The model combines performance analysis and cascading failure into metro networks.
- The node importance measure is used for setting maintenance prioritization of the metro network. A new node importance measure considering the value of recovery time is proposed.
- The Zhengzhou metro network is selected as a case study for performance analysis. The applicability and effectiveness of the proposed methods are verified.
The rest of the paper is structured as follows. Section 2 presents a mathematical modelling of the metro network and develops a metro network cascading failure model. Section 3 proposes a new method to quantify the performance of metro networks considering the value of time. Section 4 proposes a new node importance measure to determine the maintenance priority and maintenance order. Section 5 applies a case study of Zhengzhou Metro to verify the applicability of the proposed methods. Section 6 summarizes the entire paper and proposes future work.
The meanings of the symbols in the text are shown in the Abbreviations.
2. Cascading Failure Model for Metro Networks
2.1. Metro Network Indicators
The L-space type of topological graphs is used to model metro networks. Figure 1 shows an example of the metro stations and lines.
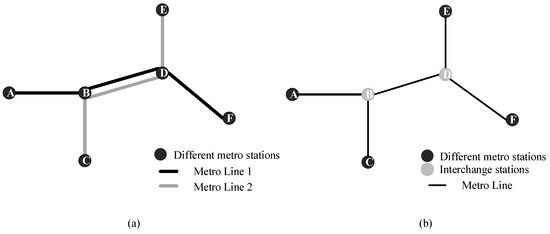
Figure 1.
Mathematical representation of stations and lines: (a) Metro stations and lines, (b) topology diagram corresponding to metro stations and lines.
The nodes in the network stand for metro stations and the lines between the different nodes stand for the metro lines. Figure 1a shows an example of metro stations and lines. Figure 1b is a topology diagram corresponding to metro stations and lines. The total amount of passenger flow in a metro network at time represents the total load on the network. The passenger flow at a station at time represents the load on the node at that time. This paper assumes that the metro network is a binary network. There are only two states for nodes in the network, normal operation and failure. The state of each node in the network is independent of each other.
The topology of the metro network can be represented by the vector , where is the set of all nodes in the network. is the set of edges in the network. The state of the connection between any two nodes is represented by an adjacency matrix . Some stations in the metro network are not directly connected to each other, while others are directly connected. represents two metro stations and are not directly connected. represents two metro stations and are directly connected. We denote the degree of node as , and denote the average network efficiency of the network as , , where is the total number of nodes in the network and is the shortest distance between node and node . In this paper, the topology of the metro network is analyzed without considering the length of the connection path between stations, the interchange time, the frequency of metro train departures, and other factors. Therefore, the metro network is represented by an undirected unweighted graph.
2.2. Cascading Failure Model
In this paper, the state of metro network nodes is categorized into two types: Normal and failed. The node state is indicated by . means the node is failed. means the node is normal. When the network is not attacked, each node works normally. Its state is normal. At time , node suffers an attack and its state changes from normal to failed. The load of this node is distributed to its neighboring nodes, which causes the load of its neighboring nodes to increase. When the load on its neighboring nodes exceeds their capacity (maximum load), the state of neighboring nodes changes from normal to failed.
Generally, the maximum passenger capacity of a metro station is limited at the beginning of its construction. The size of a station is closely related to its specified maximum passenger-carrying capacity. This paper constructs a cascading failure model for the metro network.
- (1)
- Initial load of nodes
In many previous studies, the node betweenness was mostly used as the initial load of nodes. However, passenger flow is an element of the metro network that cannot be ignored. Therefore, in this paper, the initial load of a node is expressed by the average daily passenger flow during the normal operation of the node. We assume that the average daily traffic at the node remains constant during normal operation.
- (2)
- Capacity of nodes
The design and construction of metro stations are influenced by a variety of factors such as cost and topography. This results in a limited capacity at each station, and there is some variation in the capacity of each station. According to the model proposed by Motter et al. [33], the capacity of node is proportional to the initial capacity of the node, as in Equation (1).
where is the tolerance factor, .
- (3)
- Distribution of node load
The load in the metro network can be redistributed. Passengers can select the appropriate travel path [19]. The state of all nodes in the network is normal before the attack occurs. At time , node suffers an attack and its state changes from normal to failed. At the same time, the passenger flow of node becomes 0. The failed node does not have the ability to maintain itself. Its load needs to be fully distributed to other neighboring nodes. In general, the load assigned to neighboring nodes is influenced by the size of their load-carrying capacity. The distribution rule for the load of failed nodes is as in Equation (2).
where denotes the amount of load shared by the neighboring nodes of the failed node. denotes the proportion of neighboring nodes sharing the load of the failed node. denotes the capacity of neighboring node . denotes the set of neighboring nodes of the failed node .
After the load redistribution is completed, the neighboring node receiving the load needs to determine whether the load it is carrying exceeds its own capacity. Huang et al. [19] pointed out that there is a state of failure at metro network stations due to passenger congestion in the analysis of the metro network cascading failure process using disaster spreading theory. Crowding at subway stations may lead to stampede accidents, operating elevator failures, etc. In this paper, if the load it carries exceeds its capacity, the node is overloaded and fails. It is expressed as . An overloaded node will distribute the load that exceeds its capacity to its neighboring nodes. The distribution rule for the load of the overloaded nodes is as in Equation (3).
where denotes the amount of load shared by the neighboring nodes of the overloaded node. denotes the set of neighboring nodes of overloaded node .
The overloaded failed nodes are closed and inspected for maintenance. The cascading failure process of the network ends when the own load of all nodes in the network is less than their own capacity. The process is shown in Figure 2.
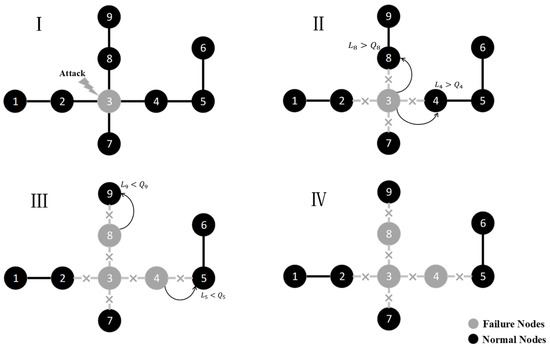
Figure 2.
Node cascading failure process.
- Stage 1. Node 3 is attacked. Its state is changed from normal to failed. Node 3 is the initial failed node.
- Stage 2. The line connected to node 3 is interrupted. The load of node 3 is distributed to its neighboring nodes according to Equation (2). Here it is assumed to be assigned to node 4 and node 8.
- Stage 3. After taking the load of node 3, node 4 and node 8 are loaded with more than their capacity. Node 4 and node 8 overload into failed nodes, and the lines connected to them are interrupted. Their loads are distributed to their neighboring nodes according to Equation (3).
- Stage 4. Node 9 takes the load of node 8. Node 5 takes the load of node 4. The loads on both node 5 and node 9 are less than their capacity. No new failed nodes appear in the network and the cascading failure ends.
3. Recovery Analysis for Metro Networks
In previous studies, the performance measure is studied from the perspective of reliability, convenience, accessibility, etc. The failure and recovery process of system performance is represented in Figure 3.
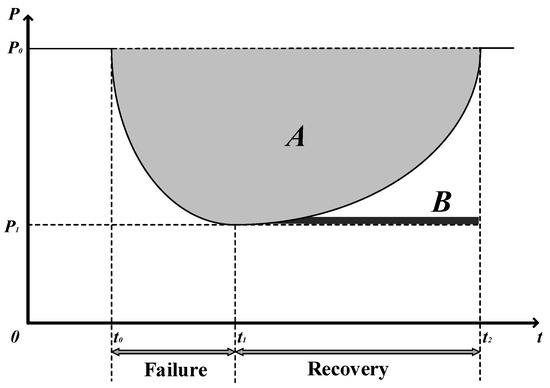
Figure 3.
The failure and recovery process of system performance.
In Figure 3, denotes the network performance. denotes the initial network performance. denotes the minimum performance after an attack on the network. denotes the time of the network attack. denotes the moment when the network performance starts to recover. denotes the moment when the network performance recovery is complete. to is the failure process of the network. to is the recovery process of the network. Area A indicates the loss of network performance. Area B indicates the performance of network recovery.
In this paper, the total revenue of the metro network is used to express the performance of the network. The revenue of the metro network is the number of passenger tickets sold. denotes the revenue from passenger tickets sold at station at time , as in Equation (4).
where is the average fare for a single ticket. denotes the load at station at time . The total load of the metro network at time is the sum of the loads at each station. is equal to . Node completely fails due to an attack at moment , causing a cascading failure of the network. Passenger flow and passenger ticket revenue at decrease significantly.
The network completes the cascading failure at . The maintenance of failed nodes starts at . In this paper, only one node can be maintained at the same time, and the node’s ability to carry the load can be restored to the level before the attack. The maintenance time of a failed node is related to the node degree. The maintenance time of failed node is denoted by , as in Equation (5).
where is a constant value indicating the maintenance time for a node of degree 2 (only one metro line crosses the node).
- Stage 1: Metro network normal operation
The performance measure equation for a node at time is . is the set of failed nodes. The total revenue of the metro network at time is the sum of the performance of all nodes in the network. The equation is expressed as .
- Stage 2: Metro network cascading failure
The performance measure equation for a failed node at time is , where time is the moment when node fails. The total revenue of the metro network at time is the sum of the performance of all nodes in the network. The equation is expressed as .
- Stage 3: Metro network recovery
Generally, the maintenance time for a metro station is longer. This paper considers the time cost of failed nodes in the recovery process, as in Equation (6).
The revenue for the failed node at time is as in Equation (7).
where denotes the revenue of node at moment . Substituting Equation (6) into Equation (7), we have
The total revenue of the metro network at time is the sum of the performance of all nodes in the network. The equation is expressed as .
The performance change process of the metro network is shown in Figure 4.
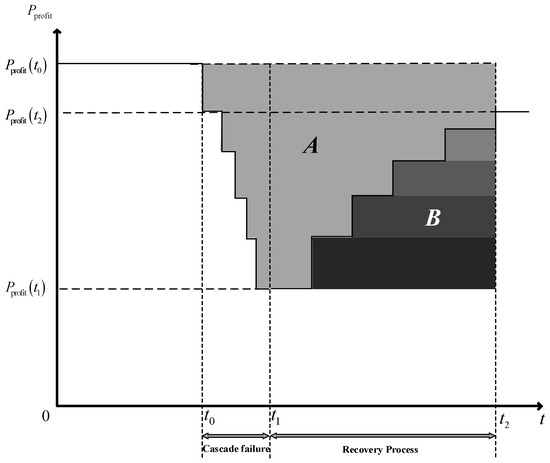
Figure 4.
The performance change process of the metro network.
In Figure 4, denotes the metro network performance. denotes the metro network’s initial performance. denotes the minimum performance after an attack on the metro network. denotes the performance of the metro network after recovery. The cascading failure occurs in the network at moment . denotes the moment when the network performance starts to recover. Network performance recovery is completed at time . Because only one node can be maintained in one stage of the recovery process, the network performance shows a step change. Because time cost exists in the recovery process, . Area A indicates the loss of network performance. Area B indicates the performance of network recovery. The rectangles of different colors in area B represent the maintenance order of different failed nodes, and the darker the color, the higher the maintenance priority.
4. Maintenance Priority Based on Node Importance
Different nodes in the metro network have different levels of importance. The higher the importance of the node, the more critical it is. The node maintenance sequence is based on the node importance order. The performance of the metro network can be improved by prioritizing the maintenance of nodes of high importance.
The Metro maintenance process takes a lot of time. Failed nodes are unable to carry passengers and have no revenue. Therefore, the time value in the recovery process cannot be ignored. In this paper, the value of time in the recovery process is incorporated into the node importance, and the performance importance of the nodes of the metro network is proposed. The importance of node is denoted by , as in Equation (9).
where is the performance of the node when it has completely failed. is the performance of node when it is maintained.
Substituting Equation (8) into Equation (9), we have
where a larger value of represents a greater value for that node after maintenance.
After an attack on the metro network, the government needs to immediately maintain the failed stations to ensure minimal damage. The resources are limited, so this paper assumes that only one node can be selected for maintenance at a time. The order in which nodes are maintained determines the level of performance of the recovered system.
The rule for determining maintenance priority based on the node importance is that the greater the performance importance of node , the higher the maintenance priority of node and the greater the performance of the network after maintenance.
After the cascading failure is completed, the metro network performance is reduced to the lowest level . For two different failed nodes and , we assume is the network performance by maintaining the failed node , and is the network performance by maintaining the failed node .
- If , from the definition of the node performance importance, we can obtain that the performance of node after maintenance is greater than the performance of node after maintenance. It is expressed as . The node has a higher maintenance priority.
- If , from the definition of the node performance importance, we can obtain that the performance of node after maintenance is greater than the performance of node after maintenance. It is expressed as . The node has a higher maintenance priority.
The steps to determine the maintenance priority of a node after a cascading failure of the metro network are as follows:
- Step 1: Determine the full number of failed nodes due to cascading failures in the metro network, and their initial load.
- Step 2: Calculate the degree of each failure node. Calculate their maintenance time based on their degree.
- Step 3: Based on the time cost calculation formula of the node repair process, calculate the maintenance time cost of each failure node.
- Step 4: Calculate the performance of each failed node after maintenance based on the node performance formula.
- Step 5: Calculate the performance importance of each failure node and rank them.
- Step 6: The nodes with the highest performance importance have the highest maintenance priority and are maintained first. Update the start maintenance moment of the remaining failed nodes.
- Step 7: Repeat step 3, step 4, step 5, and step 6 until all failed nodes are maintained. Calculate the final performance value of the metro network.
5. Application
The Zhengzhou Metro opened for operation on 28 December 2013. On 6 November 2020, the total number of operations of the Zhengzhou metro network exceeded 1.5 billion passengers. As of December 2021, there are six metro lines in operation, with a total line length of 198 km and 147 stations. The lines and stations are shown in Table 1.

Table 1.
Number of metro lines and stations.
The L-space type network topology of Zhengzhou Metro is established as shown in Figure 5.
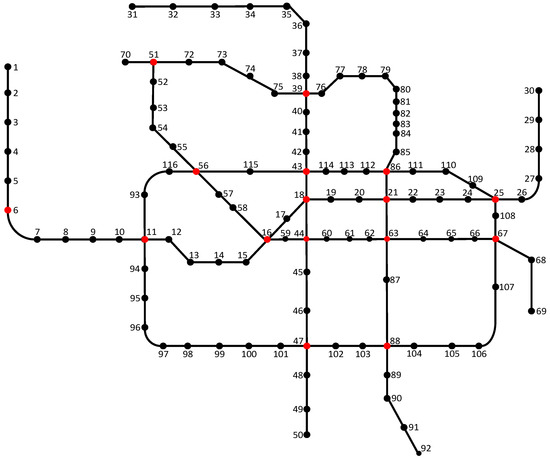
Figure 5.
Zhengzhou metro network.
Figure 5 shows the topology network of the Zhengzhou metro network, excluding suburban lines and uncompleted lines. The nodes are numbered. There are 116 sites.
Based on the connection of the nodes in Figure 5, the adjacency matrix of the Zhengzhou metro network is established. The size of the adjacency matrix is 116 × 116 and its value is
Using the adjacency matrix, a simulation is performed to obtain the degree of each node of the Zhengzhou metro network. A node with a degree of 1 means that only one station is connected to it. It is the end point of the metro line. A node with a degree of 2 indicates that two stations are connected to it. It is crossed by a metro line. A node with a degree greater than 2 indicates that there are multiple (more than 2) stations connected to it. It is an interchange station in the metro network. The average degree of the Zhengzhou metro network is 2.1897. Each station in the metro network is directly connected to an average of 2.1897 stations.
The maximum number of node degrees in the Zhengzhou metro network is 4 and the minimum is 1. The majority of the nodes in the network have a degree of 2. Figure 6 shows the probability distribution of the node degree of the Zhengzhou metro network.
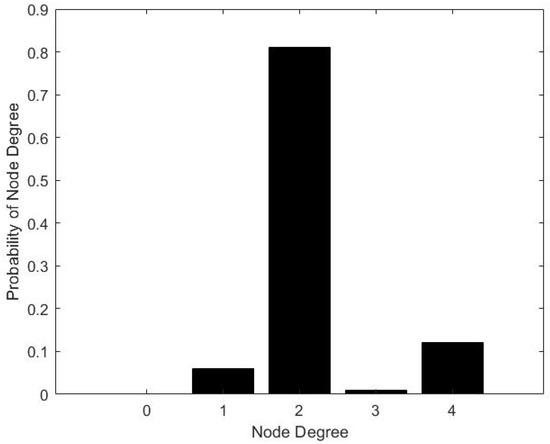
Figure 6.
Probability of node degree of Zhengzhou metro network.
As shown in Figure 6, there is approximately 6% of the total number of stations with a node degree of 1. Approximately 81% of the total number of stations have a node degree of 2. Approximately 0.8% of the total number of stations have a node degree of 3. Approximately 12% of the total number of stations have a node degree of 4.
Table 2 shows some characteristic values of the Zhengzhou metro network. The average path length of the network is 10.2157. The shortest path between any two sites in the network requires an average of 10.2157 sites to pass through. The network diameter is 32. The longest line in the metro network has 32 stations.
Table 2.
Zhengzhou metro network characteristics index.
In this paper, the average network efficiency is selected as a metric to reflect the degree of network impairment. The following are simulation steps of the cascading failure of the Zhengzhou metro network:
- Step 1: Collect the average daily traffic of each station of the Zhengzhou metro network in the past three months and take the average as the initial load of each station. Construct the initial load matrix. The adjacency matrix is used to calculate the network size and the average network efficiency under normal operating conditions.
- Step 2: Select a suitable tolerance factor . The capacity of each node is calculated according to Equation (1). Generate the capacity matrix of each node of the metro network.
- Step 3: The node is attacked according to different attack strategies. The state of the attacked node becomes failed. Add one to the number of failed nodes in the network. The load of the attacked node becomes 0.
- Step 4: Find the neighboring nodes of the attacked node based on the adjacency matrix. The load of the attacked node is transferred to its neighboring nodes according to Equation (2). The connection state of the attacked node in the adjacency matrix is all 0. The adjacency matrix and load matrix are updated, and the average network efficiency of the network is calculated at this time.
- Step 5: Compare the load of each node with its capacity. If there is a node with a load greater than its capacity, the node is overloaded. According to Equation (3), the load of the overloaded node is transferred to its neighboring nodes. The overload node is closed and the state changes to failed. Add one to the number of failed nodes in the network. The load becomes its capacity. Repeat Step 5. If the load of all nodes in the network is less than their capacity, then the cascading failure ends.
Based on the above steps, we draw a flowchart, as shown in Figure 7.
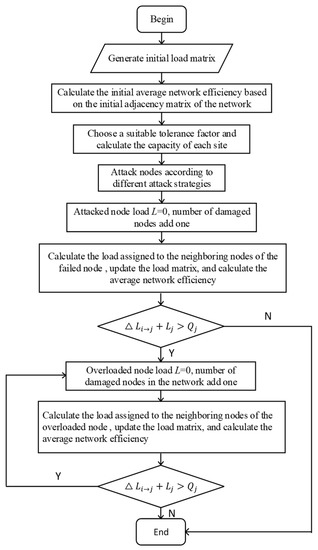
Figure 7.
Cascading failure simulation.
Different node attack strategies can cause different levels of damage to the metro network. In this paper, three different node attack strategies are selected, which are the random node attack strategy, the node degree-based attack strategy, and the node betweenness-based attack strategy. The random node attack strategy is set to randomly select nodes to attack until all the nodes in the network are failed. The node degree-based attack strategy is set to select nodes in order of their degree in the network, from highest to lowest, until all nodes in the network are failed. The node betweenness-based attack strategy is set to select nodes in order of their betweenness in the network, from highest to lowest, until all the nodes in the network are failed. The three attack strategies are simulated, from which a more targeted attack strategy is selected for the simulation of the metro network performance measure and its recovery strategy.
Figure 8 shows the simulation results of the cascading failure of the Zhengzhou Metro network caused by three different attack strategies with different tolerance factors.
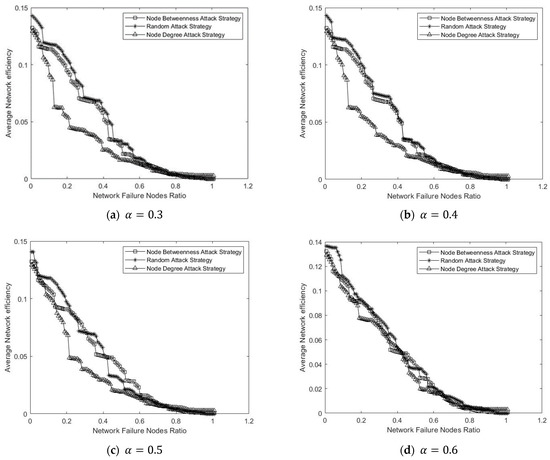
Figure 8.
Average network efficiency with different tolerance factors.
In Figure 8, the average network efficiency reflects the degree to which the network is affected. Lower average network efficiency indicates that the network is more affected. The network failure nodes ratio is the ratio of the number of failed nodes to the number of all nodes. The square represents the attack strategy based on the node betweenness, the asterisk represents the random attack strategy, and the triangle represents the attack strategy based on the node degree.
From Figure 8, the larger the value of the tolerance factor taken, the slower the average network efficiency of the network decreases. Comparing the three attack strategies, the node degree-based attack strategy has the greatest impact on the network, and the average network efficiency of the network decreases the fastest during the attack. The random attack strategy has the least impact on the network among the three attack strategies.
In conducting the performance assessment of the Zhengzhou metro network, the tolerance factor of the nodes was taken as 0.6. We know that the performance of the metro network greatly depends on the recovery strategy. The optimal maintenance order can improve network performance. The degree of interchange stations in the metro network is high. Interchange stations usually connect multiple lines and play an important role in metro networks. This paper analyzes the performance of the Zhengzhou Metro network and the optimal maintenance order from two aspects. The first aspect is a single interchange failure. The second aspect is multiple interchange failures. The average daily passenger flow of Zhengzhou Metro in 2021 was 1,380,400, and its average fare is approximately RMB 4 per person. In this paper, we assume that the average maintenance period for a station with a degree of 2 is 30 days. The average monthly interest rate is 0.25%. Only one station can be maintained in the same time period.
- (a)
- Single interchange failure
Node 11, “May Day Park Station”, has a node degree of 4, ranking first among all nodes in the network. It connects two of the top lines in terms of daily passenger traffic, Line 1 and Line 5, of which Line 5 is a loop line, and plays an important role in the Zhengzhou metro network. When node 11 is attacked, it causes a cascading failure in the network. According to the cascading failure model, the cascading failure caused by the failure of node 11 is shown in Figure 9.
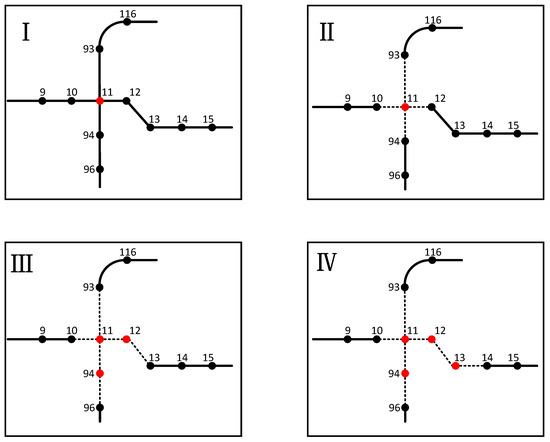
Figure 9.
Network cascading failure caused by node 11 failure.
In Figure 9, node 11 is attacked and its load is distributed to neighboring nodes. Node 12 and node 94 are overloaded and their excess load is distributed to neighboring nodes. Node 13 is overloaded, and its excess load is distributed to neighboring nodes. Eventually, all nodes in the network have less load than their capacity and the network cascading failure ends. The failure of node 11 causes cascading failure of nodes 12, 13, and 94. To maintain these four failed nodes, there are a total of 24 maintenance orders, each corresponding to a network performance value. The network performance values corresponding to these 24 maintenance strategies are ranked, and the maintenance order with the largest corresponding performance value is the best maintenance order. We use the metro node number to indicate the order of maintenance, e.g., 11-12-13-94, indicating that node 11 will be maintained first.
After the attack on node 11, the performance change of the network is calculated according to the network performance change model. The performance of the metro network at the beginning is 5.5216 million. After the failure of node 11, the performance of the metro network drops to 5.3176 million. Maintenance is performed for the failed nodes, and the maintenance time of the nodes is calculated according to Equation (5). The maintenance period for Node 11 is 60 days. Nodes 12, 13, and 94 all have a maintenance period of 30 days. The total time spent on the whole maintenance process is 150 days. Based on the node importance model of the metro network, the node performance importance of each maintenance phase is calculated, and the optimal maintenance sequence is determined, as in Figure 10.
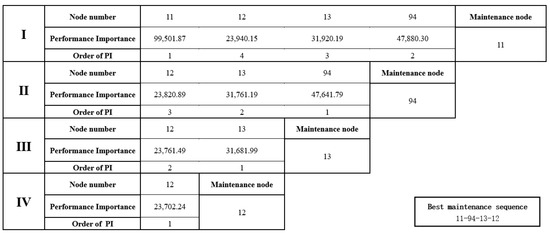
Figure 10.
Optimal maintenance order based on node importance.
In Figure 10, Roman numerals indicate the order of maintenance. Node 11 has the highest maintenance priority. Then, it is obtained that the best maintenance order is 11-94-13-12.
Figure 11 represents the change in network performance for the randomly selected maintenance order compared to the optimal maintenance order. As only one node at a time is selected for maintenance and the nodes in maintenance are closed, the performance of the system remains stable during maintenance and the maintenance process shows a step change.
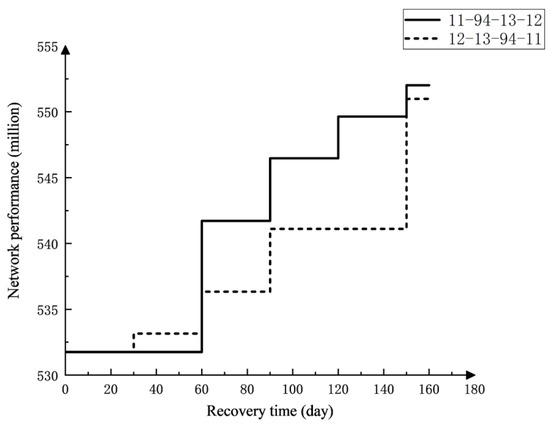
Figure 11.
Network performance variation with different maintenance orders.
From Figure 11, we can determine that the slope of the system performance curve over time is greater with the optimal maintenance order during the maintenance process. Moreover, the final performance of the recovered system is higher. The results of this simulation may be useful for making decisions about station maintenance when any interchange station has failed and causes a cascading failure in the metro network.
- (b)
- Multiple interchange station failures
For the case of multiple interchange failures, take the example of attacking two interchange stations at the same time. We select station 11 “Wuyi Park Station” and station 16 “Erqi Square Station”. Station No. 16 “Erqi Square Station” is surrounded by the Erqi Memorial Tower, a famous attraction in Zhengzhou. It is also connected to Zhengzhou Metro Line 1 and Line 3, and it is a representative station of the Zhengzhou Metro’s huge daily passenger flow. A simultaneous attack on site 11 and site 16 caused a cascading failure in the metro network. According to the cascading failure model, the cascading failure caused by the failures of node 11 and node 16 is shown in Figure 12.
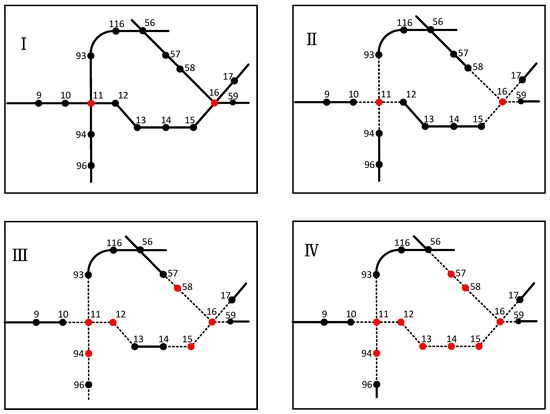
Figure 12.
Network cascading failure caused by node 11 and 16 failure.
In Figure 12, node 11 and node 16 are attacked and their load is distributed to neighboring nodes. Nodes 12, 15, 58, and 94 are overloaded and their excess load is distributed to neighboring nodes. Nodes 13, 14, and 57 are overloaded and their excess load is distributed to neighboring nodes. Eventually, all nodes in the network have less load than their capacity and the network cascading failure ends. The failures of node 11 and node 16 cause cascading failure of nodes 12, 13, 14, 15, 57, 58, and 94. To maintain nine failed nodes, there are tens of thousands of maintenance orders, each corresponding to a network performance value. The maintenance order with the largest corresponding performance value is the best maintenance order.
After the simultaneous attack on node 11 and node 16, the performance change of the network is calculated according to the network performance change model. The performance of the metro network at the beginning is 5.5216 million. After the failures of node 11 and node 16, the performance of the metro network drops to 5.142 million. Maintenance is performed for the failed nodes and the maintenance time of the nodes is calculated according to Equation (5). The maintenance period for Nodes 11 and 16 is 60 days. Nodes 12, 13, 14, 15, 57, 58, and 94 all have a maintenance period of 30 days. The total time spent on the whole maintenance process is 330 days. The node importance of each maintenance phase can be calculated, and the optimal maintenance sequence is determined. The results are shown in Figure 13.
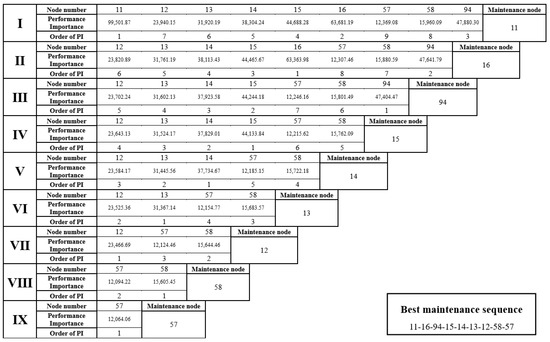
Figure 13.
Performance importance and optimal maintenance order.
In Figure 13, Roman numerals indicate the order of maintenance. Node 11 has the highest maintenance priority. It was determined that the best maintenance order is 11-16-94-15-14-13-12-58-57. The number of maintenance orders for nine node failures is huge, from which four different maintenance orders are randomly selected to calculate the performance change of the network.
Figure 14 represents the change in network performance for the randomly selected maintenance orders compared to the optimal maintenance order.
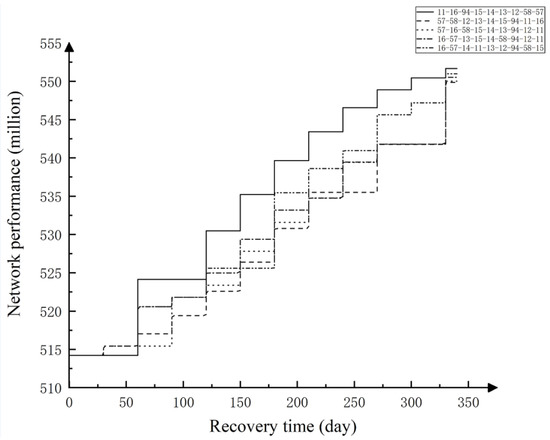
Figure 14.
Network performance variation with different maintenance orders.
From Figure 14, the number of phases recovered from an attack on multiple interchanges is greater than the number of phases recovered from an attack on a single interchange. Due to the different maintenance orders, the change curves of system performance at some time overlap, but there are differences in the degree of maintenance of system performance. The slope of the system performance curve over time is greater with the optimal maintenance order during the maintenance process. The final performance of the recovered system is higher. The results of this simulation may be useful for making decisions about station maintenance when multiple interchange stations have failed and caused a cascading failure in the metro network.
6. Conclusions and Future Work
- This paper regards a metro network as a mathematical network consisting of nodes and connecting lines. Network failures are modelled by a metro network cascading failure model.
- This paper proposes a framework for the network performance assessment of the metro network considering the value of time. This framework includes an assessment of the cascading failure of the metro network and a network performance assessment that takes into account the value of time.
- This paper establishes a maintenance priority method based on node importance. By evaluating the importance of each node, the most optimal maintenance order is determined. The higher the priority of maintenance for nodes, the higher the node importance. The most optimal maintenance order can improve the network performance.
- The proposed model is simulated and verified by an example of the Zhengzhou metro network system. The Zhengzhou metro network has 116 nodes and 127 connecting lines, with the highest node degree being 4 and the lowest node degree being 1. The failure of a single transfer station is simulated. Node 11 fails, leading to the cascade failure of nodes 12, 13, and 94. By calculating the importance of failed nodes, the maintenance priority of the node is judged, and the optimal maintenance sequence of 11-94-13-12 is obtained. The failure of multiple transfer stations is simulated. The failure of nodes 11 and 16 leads to the cascade failure of nodes 12, 13, 14, 15, 57, 58, and 94. By calculating the importance of failed nodes, the maintenance of nodes is judged, and the optimal maintenance sequence of 11-16-94-15-14-13-12-58-57 is obtained. The performance after network recovery is higher than other recovery sequences, which verifies the accuracy of the proposed model.
However, this paper has its limitations. The cost of the maintenance process is not considered in this paper, and the metro network revenue comes from multiple sources. In future work, more factors will be taken into account in the model to better fit the actual decision.
Author Contributions
Conceptualization, Y.-a.Z. and H.D.; methodology, Y.Y.; software, Y.Z.; validation, Y.Y. and H.D.; formal analysis, Y.-a.Z.; investigation, H.D. and Y.-a.Z.; resources, Y.Z.; data curation, Y.Y.; writing—original draft preparation, H.D. and Y.Y.; writing—review and editing, Y.-a.Z. and Y.Z.; supervision, H.D. and Y.-a.Z.; funding acquisition, H.D. All authors have read and agreed to the published version of the manuscript.
Funding
This research was funded by the Ministry of Education’s Humanities and Social Sciences Planning Fund (No. 20YJA630012), the Key Science and Technology Program of Henan Province (No. 222102520019), the Program for Science & Technology Innovation Talents in Universities of Henan Province (No. 22HASTIT022), and the Program for young backbone teachers in Universities of Henan Province (No. 2021GGJS007).
Institutional Review Board Statement
Not applicable.
Informed Consent Statement
Not applicable.
Data Availability Statement
The authors confirm that the data supporting the findings of this study are available within the article.
Conflicts of Interest
The authors declare no conflict of interest.
Abbreviations
| Set of all nodes in the network | |
| Set of edges in the network | |
| Adjacency matrix of the network | |
| Degree of node i | |
| Average network efficiency of the network | |
| Total number of nodes | |
| Shortest distance between node i and node j | |
| Node state | |
| Initial load of node i | |
| The capacity of node i | |
| Tolerance factor | |
| The load assigned to node j by failed node i | |
| Set of neighboring nodes of the failed node i. | |
| The load assigned to node h by failed overloaded node j | |
| Total revenue of the metro network | |
| Revenue from passenger tickets sold at station i at time t | |
| Total load of the network at time t | |
| Maintenance time of failed node i | |
| Maintenance time for a node of degree 2 | |
| Time cost of failed nodes | |
| Time cost of failed node i at time t | |
| The moment when node i starts to maintenance | |
| Average monthly interest rate | |
| Set of failed nodes | |
| Revenue of node i at time t | |
| Total revenue of the metro network at time t | |
| Performance importance of node i | |
| The moment when node i fails |
References
- Zheng, S.; Liu, Y.; Lin, Y.; Wang, Q.; Yang, H.; Chen, B. Bridging strategy for the disruption of metro considering the reliability of transportation system: Metro and conventional bus network. Reliab. Eng. Syst. Safe 2022, 225, 108585. [Google Scholar] [CrossRef]
- Zhang, J.; Wang, Z.; Wang, S.; Shao, W.; Zhao, X.; Liu, W. Vulnerability assessments of weighted urban rail transit networks with integrated coupled map lattices. Reliab. Eng. Syst. Safe 2021, 214, 107707. [Google Scholar] [CrossRef]
- Jing, W.; Xu, X.; Pu, Y. Route redundancy-based approach to identify the critical stations in metro networks: A mean-excess probability measure. Reliab. Eng. Syst. Safe 2020, 204, 107204. [Google Scholar] [CrossRef]
- Doorn, N.; Gardoni, P.; Murphy, C. A multidisciplinary definition and evaluation of resilience: The role of social justice in defining resilience. Sustain. Resilient Infrastruct. 2018, 4, 112–123. [Google Scholar] [CrossRef]
- Fan, D.; Zhang, A.; Feng, Q.; Cai, B.; Liu, Y.; Ren, Y. Group maintenance optimization of subsea Xmas trees with stochastic dependency. Reliab. Eng. Syst. Safe 2021, 209, 107450. [Google Scholar] [CrossRef]
- Niu, Y. Performance measure of a multi-state flow network under reliability and maintenance cost considerations. Reliab. Eng. Syst. Safe 2021, 215, 107822. [Google Scholar] [CrossRef]
- Bisht, S.; Kumar, A.; Goyal, N.; Ram, M.; Klochkov, Y. Analysis of Network Reliability Characteristics and Importance of Components in a Communication Network. Mathematics 2021, 9, 1347. [Google Scholar] [CrossRef]
- Wang, Z.; Jia, L.; Ma, X.; Sun, X.; Tang, Q.; Qian, S. Accessibility-oriented performance evaluation of high-speed railways using a three-layer network model. Reliab. Eng. Syst. Safe 2022, 222, 108411. [Google Scholar] [CrossRef]
- Zhang, L.; Wen, H.; Lu, J.; Lei, D.; Li, S.; Ukkusuri, S.V. Exploring cascading reliability of multi-modal public transit network based on complex networks. Reliab. Eng. Syst. Safe 2022, 221, 108367. [Google Scholar] [CrossRef]
- Ma, L.; Christou, V.; Bocchini, P. Framework for probabilistic simulation of power transmission network performance under hurricanes. Reliab. Eng. Syst. Safe 2022, 217, 108072. [Google Scholar] [CrossRef]
- Wu, J.; Baker, J.W. Statistical learning techniques for the estimation of lifeline network performance and retrofit selection. Reliab. Eng. Syst. Safe 2020, 200, 106921. [Google Scholar] [CrossRef]
- Levitin, G.; Dai, Y. Service reliability and performance in grid system with star topology. Reliab. Eng. Syst. Safe 2007, 92, 40–46. [Google Scholar] [CrossRef]
- Levitin, G.; Xing, L. Reliability and performance of multi-state systems with propagated failures having selective effect. Reliab. Eng. Syst. Safe 2010, 95, 655–661. [Google Scholar] [CrossRef]
- Xing, L.; Dugan, J.B. Analysis of generalized phased-mission system reliability, performance, and sensitivity. IEEE Trans. Reliab 2002, 51, 199–211. [Google Scholar] [CrossRef]
- Kumar, I.; Kumar, A.; Saini, M.; Devi, K. Probabilistic analysis of performance measures of redundant systems under Weibull failure and repair laws. Comput. Netw. Sustain. 2017, 12, 11–18. [Google Scholar]
- Consilvio, A.; Di Febbraro, A.; Sacco, N. Stochastic scheduling approach for predictive risk-based railway maintenance. In Proceedings of the 2016 IEEE International Conference on Intelligent Rail Transportation (ICIRT), Birmingham, UK, 23–25 August 2016; pp. 197–203. [Google Scholar]
- Lu, Q.; Zhang, L.; Xu, P.; Cui, X.; Li, J. Modeling network vulnerability of urban rail transit under cascading failures: A Coupled Map Lattices approach. Reliab. Eng. Syst. Safe 2022, 221, 108320. [Google Scholar] [CrossRef]
- Zhang, Y.; Ng, S.T. Robustness of urban railway networks against the cascading failures induced by the fluctuation of passenger flow. Reliab. Eng. Syst. Safe 2022, 219, 108227. [Google Scholar] [CrossRef]
- Huang, W.; Zhou, B.; Yu, Y.; Sun, H.; Xu, P. Using the disaster spreading theory to analyze the cascading failure of urban rail transit network. Reliab. Eng. Syst. Safe 2021, 215, 107825. [Google Scholar] [CrossRef]
- Xing, L. Cascading failures in internet of things: Review and perspectives on reliability and resilience. IEEE Internet Things J. 2021, 8, 44–64. [Google Scholar] [CrossRef]
- Xing, L.; Levitin, G. Combinatorial analysis of systems with competing failures subject to failure isolation and propagation effects. Reliab. Eng. Syst. Safe 2010, 95, 1210–1215. [Google Scholar] [CrossRef]
- Yan, Z.; Liu, H. SMoCo: A Powerful and Efficient Method Based on Self-Supervised Learning for Fault Diagnosis of Aero-Engine Bearing under Limited Data. Mathematics 2022, 10, 2796. [Google Scholar] [CrossRef]
- Wu, G.; Li, M.; Li, Z.S. Resilience-based optimal recovery strategy for cyber–physical power systems considering component multistate failures. IEEE Trans. Reliab. 2021, 70, 1510–1524. [Google Scholar] [CrossRef]
- Levitin, G.; Gertsbakh, I.; Shpungin, Y. Evaluating the damage associated with intentional supply deprivation in multi-commodity network. Reliab. Eng. Syst. Safe 2013, 119, 11–17. [Google Scholar] [CrossRef]
- Lin, Y.; Chang, P.; Fiondella, L. A study of correlated failures on the network reliability of power transmission systems. Int. J. Electr. Power Energy Syst. 2012, 43, 954–960. [Google Scholar] [CrossRef]
- Rawa, M. Towards Avoiding Cascading Failures in Transmission Expansion Planning of Modern Active Power Systems Using Hybrid Snake-Sine Cosine Optimization Algorithm. Mathematics 2022, 10, 1323. [Google Scholar] [CrossRef]
- Xu, Z.; Ramirez-Marquez, J.E.; Liu, Y.; Xiahou, T. A new resilience-based component importance measure for multi-state networks. Reliab. Eng. Syst. Safe 2020, 193, 106591. [Google Scholar] [CrossRef]
- Levitin, G.; Podofillini, L.; Zio, E. Generalised importance measures for multi-state elements based on performance level restrictions. Reliab. Eng. Syst. Safe 2003, 82, 287–298. [Google Scholar] [CrossRef]
- Dui, H.; Si, S.; Wu, S.; Yam, R.C.M. An importance measure for multistate systems with external factors. Reliab. Eng. Syst. Safe 2017, 167, 49–57. [Google Scholar] [CrossRef]
- Wu, S.; Chen, Y.; Wu, Q.; Wang, Z. Linking component importance to optimisation of preventive maintenance policy. Reliab. Eng. Syst. Saf. 2016, 146, 26–32. [Google Scholar] [CrossRef]
- Wu, S.; Coolen, F.P.A. A cost-based importance measure for system components: An extension of the Birnbaum importance. Eur. J. Oper. Res. 2013, 225, 189–195. [Google Scholar] [CrossRef]
- Almoghathawi, Y.; Barker, K. Component importance measures for interdependent infrastructure network resilience. Comput. Ind. Eng. 2019, 133, 153–164. [Google Scholar] [CrossRef]
- Motter, A.E.; Lai, Y.C. Cascade-based attacks on complex networks. Phys. Rev. E 2002, 66, 065102. [Google Scholar] [CrossRef]


Publisher’s Note: MDPI stays neutral with regard to jurisdictional claims in published maps and institutional affiliations. |
© 2022 by the authors. Licensee MDPI, Basel, Switzerland. This article is an open access article distributed under the terms and conditions of the Creative Commons Attribution (CC BY) license (https://creativecommons.org/licenses/by/4.0/).