1. Introduction
Gas hydrates are solid crystalline compounds of water and gas (most often methane) formed under certain thermobaric conditions [
1]. Interest in the study of such compounds is due, in particular, to the need to solve such problems such as gas production from gas hydrate deposits, transportation and storage of natural gas, utilization of industrial gases, etc. [
2,
3]. Since there is currently a great interest in the use of natural gas as an energy resource and raw material for the chemical industry, methods for developing gas hydrate deposits are being studied [
4,
5,
6,
7,
8]. In particular, article [
4] gives estimates of natural gas reserves in the composition of gas hydrate deposits. The works [
5,
6] present an experimental study of gas hydrate dissociation upon depressurization. It is shown that the dissociation of gas hydrate occurs throughout its volume. At the same time, it was found that at temperatures below the freezing point of water, the gas hydrate decomposition rate decreases sharply. Therefore, the authors of [
6], based on experiments, concluded that at the initial stage of development of gas hydrate deposits, it is advisable to apply the method of depressurization of a reservoir, and at a later stage, to use thermal methods of influencing the reservoir. Experiments on the decomposition of gas hydrate during injection of hot water and ethylene glycol solution are considered in [
7] and [
8], respectively.
An innovative method of gas production is a method based on the injection of industrial gases (mainly carbon dioxide) into a gas hydrate reservoir [
9,
10,
11,
12]. This possibility is due to the fact that carbon dioxide hydrate is thermodynamically more stable than methane hydrate with the same parameters [
13,
14,
15]. Article [
9] presents a quantitative assessment of the intensity of carbon dioxide replacement of methane in the gas hydrate composition. In particular, it was shown that the intensity of CH
4-CO
2 replacement depends, first of all, on the initial hydrate saturation of a porous medium, its texture, as well as the presence in the pores of free water and its salinity. It was shown in [
11] that the injection of nitrogen together with carbon dioxide into gas hydrate samples significantly increases the intensity of the replacement process. The injection of carbon dioxide into porous media saturated with gas and methane was considered in [
12]. The results of the work of a number of researchers show that the CH
4-CO
2 replacement technology makes it possible to accumulate industrial gases in a solid gas hydrate form at very low economic costs, as well as to solve the problem of extracting natural gas. Experiments on the replacement of methane in the gas hydrate composition with carbon dioxide, carried out for samples of small length, showed this possibility [
16,
17,
18,
19].
In addition, in our time of huge demand for natural gas, effective ways of storing it are needed [
3,
20,
21]. The storage of methane in a gas hydrate state has a number of advantages, which creates conditions for the creation of new technologies [
3,
21]. For the effective use of the technology of storing natural gas in the gas hydrate state in a porous reservoir, mathematical modeling of the processes under consideration and calculations are necessary [
20,
22]. Mathematical models of the processes of formation and decomposition of gas hydrates in porous reservoirs are presented, in particular, in [
11,
20,
23,
24,
25,
26,
27,
28,
29,
30,
31,
32,
33,
34]. At the same time, articles [
11,
23,
24,
25,
26] present studies on the replacement of methane in gas hydrate with carbon dioxide, and in [
20,
27,
28,
29,
30,
31,
32,
33,
34], studies of the processes of formation and decomposition of gas hydrates in porous systems under thermal and depression effects. In particular, it was shown in [
24] that the replacement of methane in gas hydrate by carbon dioxide can occur both with and without release of free water in a porous reservoir. Implementation maps of various replacement models in the case of injection of liquid carbon dioxide into a porous reservoir are presented in [
26]. In [
20,
27,
28,
29,
30,
31,
32,
33,
34], mathematical models were built on the assumption that the processes of formation and decomposition of gas hydrate are thermodynamically equilibrium. This means that in the process of formation or decomposition of gas hydrate, the heterogeneous system “gas–water–gas hydrate” is in a state of phase equilibrium, and the pressure and temperature of the system are uniquely related by the condition of phase equilibrium. In this case, the pressure of the gas phase in the zone of phase transitions coincides with the equilibrium pressure of hydrate formation, and the process of hydrate formation itself is limited only by heat and mass transfer in the reservoir (the rate of filtration supply of gas mass to the zone of gas hydrate formation and the rate of removal of energy released during the formation of gas hydrate). However, the formation of gas hydrate in a natural reservoir can be considered as an equilibrium phase transition only for the “slow” processes of redistribution of pressure and temperature in the reservoir that occur over long periods. When accelerating the processes of redistribution of pressure and temperature in the reservoir (for example, due to a very intense thermal or hydrodynamic effect on the reservoir), in order to build adequate mathematical models of the processes observed in this case, it is necessary to consider the formation of gas hydrate as a nonequilibrium phase transition. In this case, the pressure of the gas phase in the zone of phase transitions differs from the equilibrium pressure of hydrate formation, and the driving force of the process of hydrate formation is the difference between the pressure of the gas phase and the equilibrium pressure of hydrate formation.
This work presents a mathematical model of the non-equilibrium process of hydrate formation during the injection of methane into a porous reservoir, initially saturated with gas and water. Unlike works [
20,
27,
28,
29,
30,
31,
32,
33,
34], the mathematical model presented in this work is closer to the real characteristics of reservoir systems, since it additionally takes into account a number of important factors: the filtration flow of water and gas, real gas properties, Joule–Thomson effect and adiabatic compression.
2. Problem Statement and Basic Equations
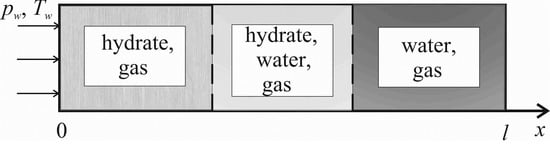
Consider a porous layer of length l (0 ≤ x ≤ l), the roof and bottom of which are impermeable and are thermally insulated. Assume that at the initial time, the reservoir is saturated with methane and water, the pressure p0 and temperature T0 of which correspond to the conditions for the stable existence of a heterogeneous mixture of gas and water, i.e., T0 > Teq(p0), where Teq(p) is the equilibrium temperature of hydrate formation corresponding to the pressure p. We assume that gas (methane) is injected through the left boundary of the reservoir (x = 0) under pressure pw and temperature Tw. These parameters correspond to the conditions for the stable existence of a heterogeneous mixture of gas, its hydrate and water, i.e., Tw < Teq(pw). As a result of this impact, the formation of gas hydrate from gas and water begins in the reservoir.
For small pressure and temperature drops, the values of the equilibrium temperature
Teq depending on the pressure
p are approximated by the dependence [
35]:
where
Teq0 is the equilibrium temperature corresponding to the pressure
ps0;
T* is an empirical parameter depending on the type of gas hydrate.
When describing the process accompanied by the formation of gas hydrate from gas and water, we take the following assumptions: the porous medium skeleton and hydrate are incompressible and immobile; porosity is constant; the temperature of the porous medium and saturating it with substances coincide. The hydrate is a two-component system with a mass fraction of gas G.
The mass conservation equations for gas, gas hydrate, and water in a one-dimensional plane approximation can be represented as [
36]:
where
t is time;
m is the skeleton porosity;
ρi,
Si,
Ji (
i =
l,
h,
g) are, respectively, the density, volume saturation of pores, and intensity of consumption of the
i-th phase. Here and below, the subscripts
i =
sk,
l,
h,
g refer to the skeleton, water, hydrate, and gas, respectively.
The energy conservation equation, taking into account the Joule-Thomson effect and adiabatic compression, can be represented as [
37]:
where
υi,
ci,
εi (
i =
g,
l) are, respectively, the speed, specific heat capacity and differential throttling coefficient of the
i-th phase;
ηg is the coefficient of adiabatic cooling of the gas. We assume that the specific volumetric heat capacity
ρc and the thermal conductivity coefficient
λ of the system are functions of the current values of saturations:
Darcy’s filtering law has the form:
where
k is the absolute reservoir permeability coefficient;
kri and
µi (
i =
g,
l) are the coefficients of relative phase permeability and dynamic viscosity of the
i-th phase, respectively. The relative phase permeabilities for gas and water are determined on the basis of the following empirical dependencies [
38]:
We assume that methane has the properties of a real gas, and water is incompressible:
where
Rg is the specific gas constant;
zg is the coefficient of gas (methane) supercompressibility, depending on pressure and temperature and determined on the basis of the Latonov–Gurevich equation [
38]:
where
pc and
Tc are the critical pressure and temperature of the gas (methane), respectively.
For the coefficients of differential throttling (gas and water) and adiabatic gas cooling, we can write:
The intensity of gas consumption per unit volume
Jg for the formation of gas hydrate can be represented, according to [
39], as:
here,
Mg is the molar mass of the hydrate-forming gas (methane);
K is the parameter of the decomposition reaction or hydrate formation;
As is the surface area of the phase transition reaction per unit volume of the porous medium;
feq and
f are the gas fugacity corresponding to the equilibrium and current pressures at the corresponding temperature.
In the case of the gas hydrate formation, according to [
39], it is assumed that
K = 5.875∙10
−12 mol/(m
2∙Pa∙s),
In the case of the gas hydrate decomposition:
where
K0 = 3.6 × 10
4 mol/(m
2∙Pa∙s), ∆
E/
R = 9752.73 K.
In this case, since the hydrate is a two-component system with a gas mass concentration G, for the rates of consumption water
Jl and gas
Jg for the formation of hydrate with the intensity
Jh per unit volume of the porous medium, the following relations can be written:
The real gas fugacity
f, corresponding to the pressure
p, is found on the basis of the expression:
where
pst = 10
5 Pa.
We assume that at the initial time the reservoir is saturated with gas and water, the pressure and temperature of which are
p0 and
T0, respectively. In this case, the initial saturation of pores with water is
Sl0, and there is no gas hydrate. These conditions can be represented as:
Since the paper considers cases corresponding to high values of the initial water saturation (
Sl0 > 0.2), when gas is injected through the left reservoir boundary (
x = 0) with pressure pw and temperature
Tw, water will flow to the right boundary of the reservoir. In accordance with this, we assume that the values of water saturation and, as a consequence, hydrate saturation on the left boundary of the reservoir are equal to zero:
As conditions on the right reservoir boundary, we use conditions of the form:
3. Calculation Results
The presented system of Equations (1)–(14) is closed; in its numerical solution, the implicit finite-difference method was used [
40,
41]. When constructing a finite-difference analogue of the system of Equations (1)–(14), a uniform space–time grid with spatial step
h (
h =
l/
N,
N is the number of partition segments) and time step
τ is used. To solve Equation (3), a splitting scheme for physical processes is used. For each time layer, the constructed difference scheme is a system of nonlinear algebraic equations; this system was solved using the method of simple iterations. The iterative process at each time layer continued until the specified accuracy was achieved in all considered quantities: pressure, temperature, phase saturations. After reaching the specified accuracy for all quantities, a transition to the next time layer took place. In this work, a computational code was developed based on the universal C++ programming language in the Visual Studio 2019 integrated development environment. The maximum calculation time was about 1.5 days for AMD Ryzen 5 3500U, 4.0 GB RAM.
Figure 1 shows the distributions of pressure, temperature, hydrate saturation, and water saturation for the time
t = 1 h. Curves 1, 2, and 3 correspond to pressures
pw = 10, 12 and 14 MPa. For the remaining parameters characterizing the system, the following values were adopted [
15,
20,
33,
34,
39,
42]:
p0 = 5 MPa;
T0 = 280 K;
Tw = 278 K;
Sl0 = 0.32;
m = 0.2;
k0 = 10
−12 m
2;
λsk = 1.5 W/(m·K);
λl = 0.6 W/(m·K);
λh = 0.5 W/(m·K);
csk = 1000 J/(kg·K);
cl = 4200 J/(kg·K);
ch = 2000 J/(kg·K);
cg = 1560 J/(kg∙K);
ρl = 1000 kg/m
3;
ρh = 900 kg/m
3;
G = 0.13;
Lh = 5∙10
5 J/kg;
Th0 = 280 K;
T* = 10 K;
ps0 = 5.5 MPa;
µg = 10
−5 Pa∙s; µL = 1.5∙10
−3 Pa∙s;
M = 16∙10
−3 kg/mol;
Rg = 520 J/(kg∙K);
l = 50 m. As follows from the figure, the pressure of the system becomes almost uniform over a short period. At the same time, the maximum values of temperature and hydrate saturation of the reservoir increase with an increase in injection pressure. This is due to the fact that, according to Equation (8), the driving force of the hydrate formation process is the difference between the pressure in the reservoir and the equilibrium pressure of hydrate formation. With an increase in pressure, the intensity of hydrate formation increases. Since the process of formation of gas hydrate is accompanied by the release of heat, there is an increase in temperature in the reservoir.
As a remark, when considering
Figure 1 (as well as
Figure 2,
Figure 3 and
Figure 4), the greatest changes in parameters occur near the left boundary of the reservoir (
x = 0), and then, these changes become less significant. Therefore, for a better visualization of the results, the reservoir area adjacent to the left boundary was identified (at
x ≈ 1.3 m, the graphs break). In the first part of the graphs (
x < 1.3 m), one division corresponds to 0.5 m, and in the second part (
x > 10 m), one division corresponds to 20 m. Therefore, at the scale of the first part of the graphs, the changes in parameters at
x > 0.5 m are visually imperceptible, and at the scale of the second part, these changes already become visually noticeable. Thus, the visual effect of some stabilization of the parameters in the first part of the graphs is due to the difference in the scales in the first and second parts of the graphs.
In
Figure 2, for the time point
t = 1 h, the distributions of pressure, temperature, hydrate saturation and water saturation are presented. Curves 1, 2, and 3 correspond to the injected gas temperature
Tw = 274, 276 and 278 K; gas injection pressure
pw = 14 MPa. Other parameters are the same as for
Figure 1. As follows from
Figure 2, with an increase in the injection temperature, the hydrate saturation in the reservoir decreases. This is due to the fact that with an increase in the temperature, the equilibrium pressure of hydrate formation increases. Therefore, the driving force of hydrate formation, i.e., the difference between the reservoir pressure and the equilibrium pressure of hydrate formation decreases. This leads to a decrease in the intensity of hydrate formation and, accordingly, to a decrease in the value of hydrate saturation in the reservoir. At a relatively large distance from the reservoir left boundary, the temperature and hydrate saturation distributions constructed for different injection temperatures coincide. This is due to the low value of the thermal conductivity of natural reservoirs. Therefore, the injection temperature affects the reservoir temperature distribution and, accordingly, the intensity of hydrate formation only near its left boundary (boundary of gas injection).
Figure 3 shows dependencies similar to
Figure 2 and
Figure 3. Here, curves 1, 2 and 3 correspond to the values of the absolute permeability of the reservoir
k0 = 10
−12, 10
−13 and 10
−14 m
2. Gas injection pressure
pw = 12 MPa, and other parameters correspond to
Figure 1. According to
Figure 3, near the reservoir left boundary, with an increase in permeability, the hydrate saturation and temperature increase, and at a relatively large distance from the left boundary, with an increase in permeability, the hydrate saturation and temperature decrease. This is due to the fact that, according to Equation (8), the intensity of hydrate formation is proportional to the surface area of the phase transition reaction
As, which according to Equation (9), decreases with an increase in the porous medium permeability. Therefore, near the left reservoir boundary, the intensity of hydrate formation decreases with an increase in the permeability. At a relatively large distance from the left boundary, the role of heat and mass transfer in the reservoir increases significantly. Therefore, at a relatively large distance from the left boundary, with an increase in the permeability, i.e., with an increase in the rate of heat and mass transfer, the intensity of hydrate formation also increases.
Figure 4 shows for the time point
t = 1 h the distributions of pressure, temperature, hydrate saturation and water saturation in the reservoir. Curves 1, 2, and 3 correspond to porosity
m = 0.1, 0.15 and 0.2. Gas injection occurs at a pressure
pw = 12 MPa, and other parameters correspond to
Figure 1. As follows from
Figure 4 with increasing porosity, the reservoir temperature increases, and the pressure decreases. The decrease in pressure is explained by the fact that with an increase in porosity, the reservoir piezoconductivity coefficient decreases and, accordingly, a slower propagation from the left boundary into the reservoir depth of the high pressure front occurs. The increase in temperature is explained by the fact that with an increase in porosity, the amount of water per unit volume of the reservoir increases and, accordingly, the amount of heat released during the transition of water and gas to the gas hydrate state increases.
Figure 5 shows change over time in for pressure (a), temperature (b), hydrate saturation (c) and water saturation (d) for the parameters of
Figure 1. Curves 1 and 2 correspond to dots with coordinates
x = 0.25 and 25 m. From
Figure 5, it follows that the pressure in the system for a short period becomes almost uniform and equal to the injection pressure
pw. The reservoir temperature at the initial moment of time is significantly lower than the equilibrium temperature, and then, over time, tends to the equilibrium value of the hydrate formation temperature corresponding to the current reservoir pressure.
Figure 6 shows the change in time of the formed hydrate mass at various pressures (a) and temperatures (b) of injection, permeability (c) and porosity (d) of the reservoir. The parameters for the different lines in this figure coincide with the parameters of
Figure 1,
Figure 2,
Figure 3 and
Figure 4. As follows from
Figure 6 with an increase in the injection pressure, porosity, and with a decrease in the injection temperature, the mass of the formed hydrate increases. At short values of time after the start of injection in the case of high reservoir permeability, the rate of hydrate formation is lower than in the case of low permeability, and at high values of time, on the contrary, with an increase in permeability, the intensity of hydrate formation increases. This is explained by the fact that at small values of time after the start of gas injection, the intensity of hydrate formation is limited by the kinetics of this process. Therefore, according to Equations (8) and (9), with an increase in permeability, the intensity of hydrate formation decreases.
Figure 7a shows for the time point
t = 10 min the dependence of the maximum temperature on the absolute reservoir permeability at
pw = 12 MPa and
Tw = 276 K. The rest of the parameters correspond to the parameters of
Figure 1. As follows from
Figure 7a, as the reservoir permeability increases, the system temperature decreases. This is due to the fact that the highest intensity of hydrate formation and, accordingly, the highest reservoir temperature is observed near its left boundary, where the main factor limiting hydrate formation is the kinetic mechanism. Since the intensity of hydrate formation is proportional to the surface area of the phase transition reaction As, which decreases with an increase in the permeability of the porous medium, the intensity of hydrate formation decreases with an increase in the permeability of the porous medium. Since this reduces the amount of heat released during hydrate formation, the increase in permeability is accompanied by a decrease in the reservoir temperature.
Figure 7b shows for the time point
t = 10 min, the dependence of the maximum system temperature on the injection pressure at
Tw = 276 K and
k0 = 10
−12 m
2. The dashed line shows the equilibrium temperature for the current pressure. As follows from
Figure 7b, as the injection pressure increases, the maximum temperature of the system slightly increases. According to
Figure 7b, at relatively high injection pressures, the maximum temperature in the reservoir is well below the equilibrium temperature of hydrate formation. In this case, the higher the injection pressure, the higher the difference between the indicated temperatures. Since the maximum values of the reservoir temperature at the considered time value are realized near the reservoir left boundary, this indicates that at high values of pressure
pw, the nature of the hydrate formation process near the left boundary is significantly non-equilibrium.
4. Discussion the Results
The process of hydrate formation in an extended porous reservoir is limited by two main factors. The first factor is heat and mass transfer in the reservoir, i.e., the rate of filtration supply of a mass of gas to the zone of gas hydrate formation and the rate of removal of energy released during the formation of gas hydrate. In other words, to start the process of hydrate formation at some given point, the pressure must exceed the equilibrium value of the hydrate formation pressure at this point, i.e., part of the time between the start of gas injection into the reservoir and the end of hydrate formation is spent on the arrival of the high pressure front at the considered point. The duration of this time is determined by the rate of heat and mass transfer in a porous medium. The second factor limiting hydrate formation is the kinetics of this process. Near the left reservoir boundary, where the thermobaric conditions necessary for hydrate formation have already been formed, the main factor limiting the formation of gas hydrate is the kinetic mechanism.
At the initial time stage, the process of hydrate formation proceeds in a nonequilibrium mode. Then, over time, the nature of the hydrate formation process is increasingly approaching equilibrium, in which the “gas–water–gas hydrate” system is in a state of phase equilibrium, and the pressure and temperature of the system are uniquely related by the phase equilibrium condition. In this case, the pressure of the gas phase in the zone of phase transitions coincides with the equilibrium pressure of hydrate formation, and the process of hydrate formation itself is limited only by heat and mass transfer in the reservoir (the rate of filtration supply of gas mass to the zone of gas hydrate formation and the rate of removal of energy released during the gas hydrate formation).
At long time values after the start of injection, the effect of heat and mass transfer on the process of hydrate formation increases significantly, i.e., by the value of the total mass of hydrate formed in a reservoir during the considered period. In this regard, at large time values, with an increase in permeability, the intensity of heat and mass transfer in a reservoir increases and, accordingly, increases the value of the total mass of the hydrate formed.
The higher the injection pressure, the more significant the role of the process kinetics (as one of the two factors limiting hydrate formation) in the near zone of a reservoir (adjacent to its left boundary) compared to heat and mass transfer in the reservoir. Thus, even for extended natural reservoirs at the initial time stage and with intense hydrodynamic impact on the reservoir, in order to build adequate mathematical models, it is necessary to consider the formation of gas hydrate as a nonequilibrium phase transition.
5. Conclusions
A mathematical model of the gas hydrate formation process that occurs when methane is injected into a natural reservoir saturated with methane and water was constructed. The dependences of pressure, temperature, hydrate saturation and water saturation on the coordinate and time are obtained for various values of the reservoir permeability, porosity, pressure, as well as injection pressure and temperature. It is shown that the intensity of hydrate formation increases with increasing pressure and decreasing the temperature of the injected gas. It has been established that near the left reservoir boundary (injection boundary), with an increase in permeability, hydrate saturation and reservoir temperature increase, and at a relatively large distance from the left boundary, with increasing permeability, hydrate saturation and reservoir temperature decrease. It is shown that with an increase in porosity, the reservoir temperature increases, and the pressure decreases. The pressure in the system for a short period becomes almost uniform and equal to the injection pressure. An analysis of the influence of the time of gas injection into a porous medium on the features of the processes in the reservoir showed that at the initial stage of time, the process of hydrate formation proceeds in a non-equilibrium mode. Then, over time, the nature of the process of hydrate formation more and more approaches equilibrium. At relatively short time values after the start of gas injection into the reservoir, in the case of high reservoir permeability, the rate of hydrate formation is lower than in the case of low permeability, and at longer time values, on the contrary, with an increase in permeability, the intensity of hydrate formation increases. The degree of influence of the kinetics of hydrate formation and heat and mass transfer in the reservoir, as two main factors limiting hydrate formation, on the rate of growth of the total mass of hydrate formed in the reservoir was also analyzed. It has been established that the role of the kinetics of the hydrate formation process in comparison with heat and mass transfer in the reservoir increases under the following conditions: with an increase in gas injection pressure; approaching the reservoir boundary through which gas is injected into the porous medium; with a decrease in time after the start of the process of gas injection into the reservoir.


