Article

Stochastic Modeling of Within-Host Dynamics of Plasmodium Falciparum

1
School of Mathematics and Statistics, University of Melbourne, Parkville, VIC 3010, Australia
2
Centre for Epidemiology and Biostatistics, Melbourne School of Population and Global Health, University of Melbourne, Parkville, VIC 3010, Australia
*
Authors to whom correspondence should be addressed.
Mathematics 2022, 10(21), 4057; https://doi.org/10.3390/math10214057
Submission received: 20 September 2022 / Revised: 25 October 2022 / Accepted: 28 October 2022 / Published: 1 November 2022
(This article belongs to the Special Issue Stochastic Models in Mathematical Biology)

Abstract

:
Malaria remains a major public health burden in South-East Asia and Africa. Mathematical models of within-host infection dynamics and drug action, developed in support of malaria elimination initiatives, have significantly advanced our understanding of the dynamics of infection and supported development of effective drug-treatment regimens. However, the mathematical models supporting these initiatives are predominately based on deterministic dynamics and therefore cannot capture stochastic phenomena such as extinction (no parasitized red blood cells) following treatment, with potential consequences for our interpretation of data sets in which recrudescence is observed. Here we develop a stochastic within-host infection model to study the growth, decline and possible stochastic extinction of parasitized red blood cells in malaria-infected human volunteers. We show that stochastic extinction can occur when the inoculation size is small or when the number of parasitized red blood cells reduces significantly after an antimalarial treatment. We further show that the drug related parameters, such as the maximum killing rate and half-maximum effective concentration, are the primary factors determining the probability of stochastic extinction following treatment, highlighting the importance of highly-efficacious antimalarials in increasing the probability of cure for the treatment of malaria patients.

1. Introduction

Malaria is a major vector-borne infectious disease threatening public health in tropical and subtropical regions and may cause symptoms such as fever, vomiting, or even coma or death [1]. Plasmodium (P.) falciparum is the most pathogenic and deadly species that can infect humans. Although P. falciparum is treatable by antimalarials such as artemisinins (often used in combination therapies with longer half-life partner drugs) [2], the emergence and spread of antimalarial resistance threaten our efforts on malaria elimination [3]. Therefore, a better understanding of the infection dynamics of P. falciparum in human hosts is important for developing novel regimens for treatment. Pharmacokinetic-Pharmacodynamics mathematical modelling is an established and invaluable element of research supporting malaria treatment and elimination strategies [4], providing quantitative insights into biological processes and making predictions on the optimisation of treatment strategies [5,6,7,8,9].
A Volunteer infection study (VIS) is a type of human challenge clinical trial in which malaria-naive human volunteers (i.e., volunteers have never been infected by malaria) are infected with malaria. A VIS is designed to study within-host infection dynamics and evaluate treatment efficacy by generating in vivo data (using high-sensitive qPCR) for analysis and modelling [10,11,12,13]. In a recent VIS, Collins et al. collected parasitemia data (parasite number per ml blood) from 17 volunteers, of which seven volunteers developed recrudescence after treatment [12]. The data were analysed by Cao et al. who developed a deterministic mathematical model to capture the infection dynamics in the volunteers. The model was fit to parasitemia data using hierarchical Bayesian inference [9]. The analyses demonstrated an excellent fit of the model to the data. However, a deterministic model cannot be used to study stochastic phenomena such as extinction of parasitized red blood cells (pRBCs) following treatment, which may occur when the number of pRBCs is small, e.g., with a small inoculation size or after antimalarial treatment, as in the VIS conducted by Collins et al. In addition to model suitability, stochastic extinction may be a mechanism leading to the observations in some volunteers who did not develop recrudescence in the VIS. Therefore, the development of a stochastic model to study the VIS data provides substantial practical benefits because stochastic models are anticipated to provide mechanistically different interpretations of the VIS data compared to the insight obtained through a deterministic model-based analysis. Findings may have substantial impact on the predictions for experimental design through optimised inoculation procedures, and extend our understanding of recrudescence, a major issue for public health policy on treatment strategies for malaria [4,8,9].
In this work, we study the probability of stochastic extinction over the infection period in the VIS by constructing a stochastic model of within-host malaria infection based on the aforementioned deterministic model developed by Cao et al [9]. We show that stochastic extinction can happen and is responsible for complete resolution of pRBCs in some VIS volunteers. We also identify the factors that primarily determine the extinction probability, which may suggest potential ways of maximising the extinction probability to increase the chance of cure.

2. Materials and Methods

2.1. The Stochastic Model of Within-Host Malaria Dynamics

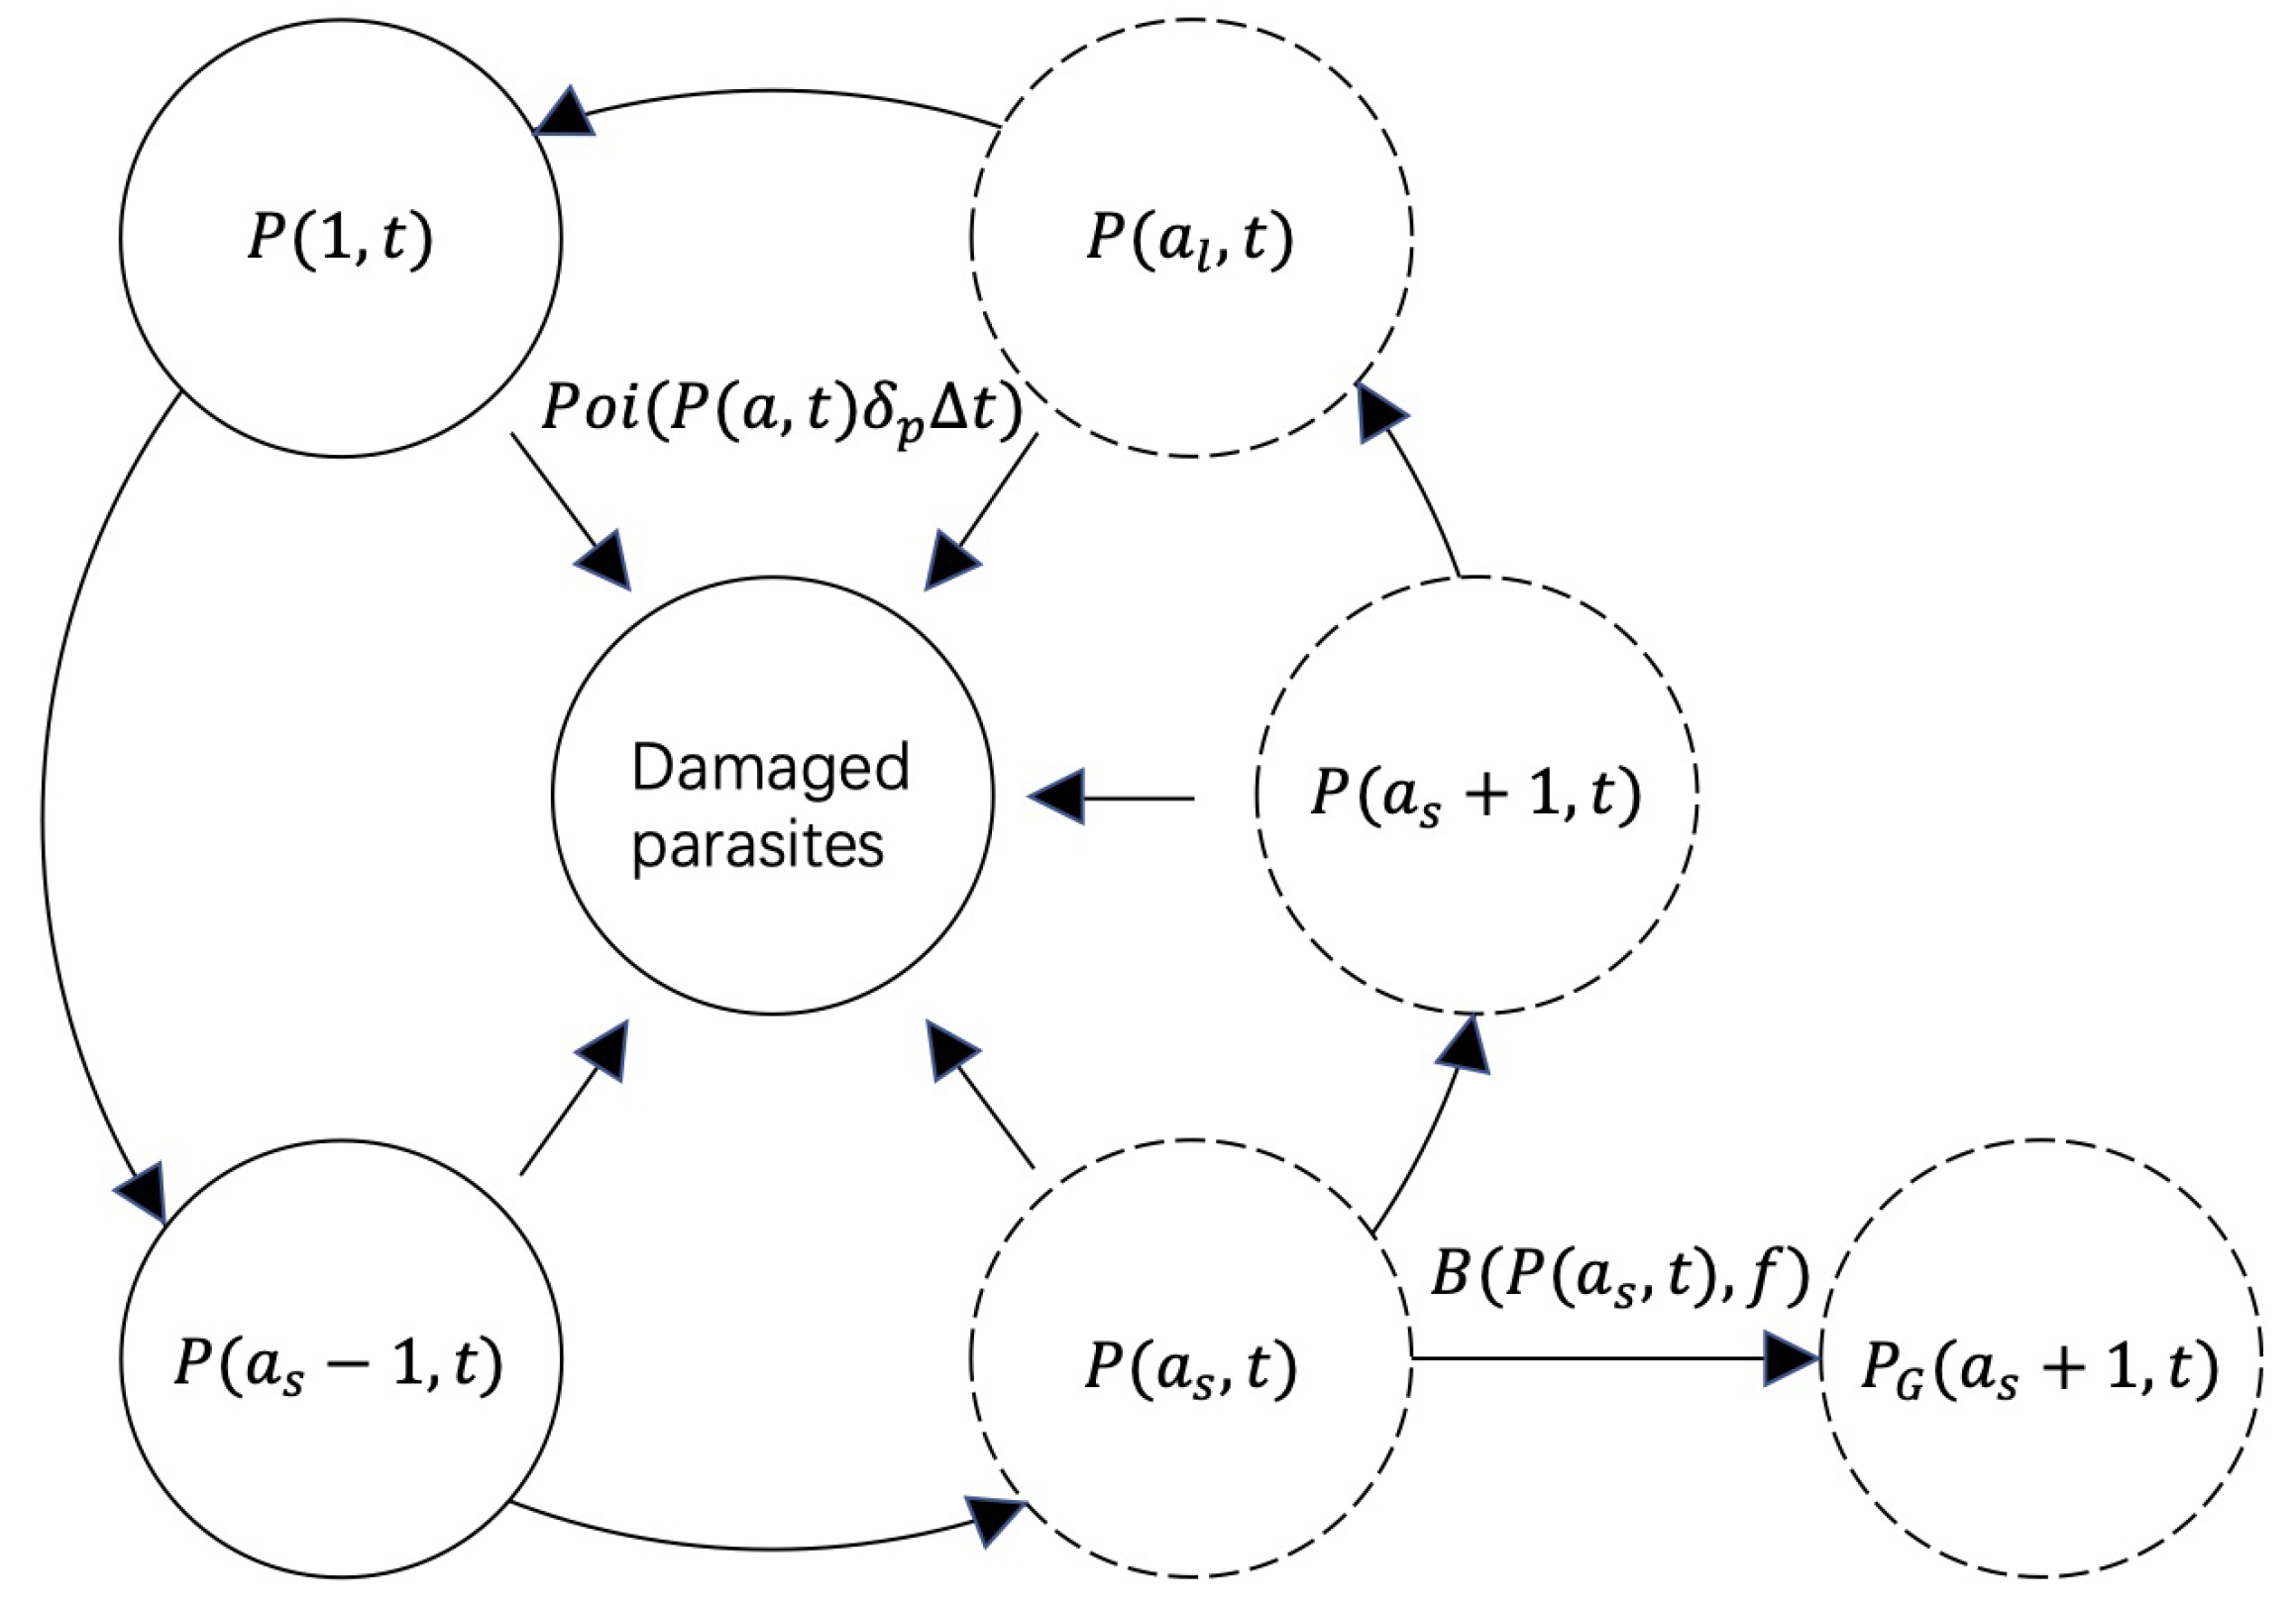
The stochastic model is developed based on the discrete-time deterministic model proposed by Cao et al. This model captures the development of the asexual parasite population and of the sexually committed gametocytes, both of which are biologically important and for which rich time-series data are available [9]. The schematic diagram of the deterministic model is shown in Figure 1. Upon entering the bloodstream, parasites will invade RBCs and initiate a life cycle of a L hours. P ( a , t ) represents the number of parasites with age a at time t. At the end of the life cycle, pRBCs will rupture, releasing merozoites that then invade new RBCs and initiate another life cycle. The evolution of asexual parasites is governed by,
P ( a , t ) = P ( a 1 , t 1 ) e k d ¯ δ p , a = 2 , 3 , , a s 1 , a s + 1 , , a L r p P ( a L , t 1 ) e k d ¯ δ p , a = 1
δ p is the rate of nature death of asexual parasite. a L is the length of each asexual replication cycle. a s is the age where sexual conversion occurs. r p is parasite replication rate and k d ¯ is the rate of parasite killing by an antimalarial drug (i.e., piperaquine in the VIS), which is approximated by the average value of the instantaneous killing rate k d ( t ) at the boundaries of the time step from t 1 to t, k d ¯ = ( k d ( t 1 ) + k d ( t ) ) / 2 . The instantaneous killing rate k d ( t ) is given by k d ( t ) = k m a x C ( t ) γ / ( C ( t ) γ + E C 50 γ ) where C ( t ) is the concentration of piperaquine in the central compartment and is determined by a pharmacokinetic (PK) model (details of the PK model are provided in [9]) and k m a x , E C 50 and γ are the maximum killing rate, the half-maximal effective concentration and Hill coefficient respectively. During the maturation and replication of asexual parasites, a small fraction will differentiate into sexually committed form, which will mature in the tissue before eventually becoming female and male gametocytes. Accounting for this process is important as the loss of asexual parasites due to sexual commitment (as studied in detail in Cao et al. [9]) directly impacts on the estimated number of asexual parasites in circulation and so the extinction probability of asexual parasites. Note that the deterministic model developed by Cao et al. contains a chain of compartments starting from P G to model the developmental of gametocytes. While the development of gametocytes is not the focus of our study and therefore not shown in Figure 1, we include the compartment P G because the process of sexual commitment leads to a small loss of asexual parasites during each life cycle and therefore ignoring this process would bias our results. The process of sexual commitment is modelled by
P ( a s + 1 , t ) = ( 1 f ) P ( a s , t 1 ) e k d ¯ δ p , P G ( a s + 1 , t ) = f P ( a s , t 1 ) e k d ¯ δ p .
where f is probability of sexual commitment for each parasite [9].
The stochastic model is developed by changing two of the deterministic transitions to Poisson processes [14]: the death of parasite during the life cycle; and the differentiation of a small fraction of parasites into sexual development (i.e., from P ( a s , t ) to P G ( a s + 1 , t ) ). The parasite maturation process, i.e., the transition from P ( a , t ) to P ( a + 1 , t ) , remains a deterministic process because all the surviving parasites of age a will become age a + 1 in the next hour.
To simulate the model, we first allocate the number of parasites at the time of inoculation P ( a , 0 ) , into a L age bins by a truncated normal distribution N [ 1 , a L ] ( μ , σ 2 ) and the number of parasites in each age bin is rounded to integer values. The number of parasites then evolves by the following equation:
P ( a , t ) = P ( a 1 , t 1 ) D , a = 2 , 3 , , a s 1 , a s + 1 , , a L r p [ P ( a L , t 1 ) D ] , a = 1
where D is sampled from a Poisson distribution P o i ( P ( a 1 , t 1 ) ( k d ¯ + δ p ) ) for each age group and each time step. For the sexual commitment process, suppose B is the random variable representing the number of parasites becoming sexually-committed, then we have
P ( a s + 1 , t ) = P ( a s , t 1 ) D B , P G ( a s + 1 , t ) = B .
B is sampled from a Binomial distribution B i n ( n , f ) with n = P ( a s , t 1 ) D where f is the probability of sexual commitment for each parasite. The first equation describes the parasites remaining in the asexual life cycle while the second equation describes the number of sexually committed parasites. Table 1 provides all the model parameters with their units and descriptions as estimated in [9]. Note that the initial number of parasites in Cao et al. is a density that represents the number of parasites per ml blood, so we convert the density value to the total number of parasites P i n i t by multiplying by an assumed blood volume of 4L in stochastic simulations.

2.2. Method for Calculating Extinction Probability

To calculate the extinction probability for a given set of model parameter values, we take a Monte Carlo approach. We simulate the stochastic model 100 times. The extinction probability for a certain time point is given by the proportion of the 100 realisations in which extinction occurred before that time point. If we calculate the extinction probability at a series of time points post-infection, we can generate a time series of extinction probabilities which shows how the extinction probability changes over time. Since our stochastic model is based on the deterministic model developed by Cao et al. [9], for the choice of model parameter values in Table 1 (except for two fixed parameters (i.e., a s and a L )), we simply use the parameter values provided by Cao et al. Their parameter estimates are publicly available as per [9]. In the work by Cao et al., model parameter values are provided in the form of 5000 posterior samples (in a Bayesian framework) where each posterior sample contains model parameter values for all 17 volunteers and population mean and standard deviation parameters. Note that each volunteer has 12 values corresponding to the 12 model parameters, which can be used in our study to simulate the stochastic model and calculate the extinction probability for the volunteer. To generate the time series of extinction probabilities with uncertainties, we select 1000 samples from the 5000 posterior samples for each volunteer and use the 1000 sets of parameter values to generate 1000 time series of the extinction probability. The results will be shown by the median and 95% (and 25%, 50%, 75%) prediction interval (PI) of the extinction probabilities.
To study the relationship between extinction probability and inoculation size, we set the inoculation size P i n i t to be a fixed value (between 1 and 12) and set other model parameters to be the values drawn from the work by Cao et al. For each P i n i t , we run the stochastic model 100 times (we assume k d ¯ = 0 , i.e., no drug is involved) and calculate the extinction probability at t = 42 h (which is the length of one replication cycle). For the calculation of uncertainties, we take a similar approach to that used in calculating the time series of extinction probabilities. That is, we select 1000 samples from aforementioned 5000 posterior samples for each value of P i n i t (note that in this case we use the population mean parameter values) and calculate 1000 extinction probabilities using the 1000 sets of parameter values. The results will be shown by the median and 95% PI of the extinction probability.

2.3. Method for Calculating the Correlations between Model Parameters and Extinction Probability

A partial rank correlation coefficient (PRCC) analysis is used to quantify the correlations between model parameters and the extinction probability. We choose the PRCC because it is designed to identify the correlation of two variables after removing any linear dependence on all other variables in a model with multiple parameters [15]. Our PRCC analysis is implemented in R (version 4.2.1). The computer code is publicly available at https://github.com/XSSUN2/Stochastic_Modeling_Malaria (accessed on 9 September 2022).

3. Results

3.1. Stochastic Effect and Extinction Probability

We first demonstrate that our stochastic model can generate trajectories for parasitemia that either show recrudescence or extinction.
Figure 2A shows two examples of stochastic simulations: one simulation displays recrudescence after two doses of piperaquine treatment on day 7 and 12 (the red curve) while the other shows a very quick drop in parasitemia followed by extinction after one dose of piperaquine treatment on day 7 (the green curve; note that the second dose of piperaquine was not given because the volunteer did not develop recrudescence after the frist treatment). Figure 2B shows more stochastic simulations that result in extinction. In the close-up of Figure 2B, we observe that for some realization of the model, a further round of clonal expansion occurred prior to extinction occurring. This feature of the model, reflecting the synchronised population-biology of infection, contributes to a large variance in the extinction time when the number of pRBCs is small (see the circled part in Figure 2B).
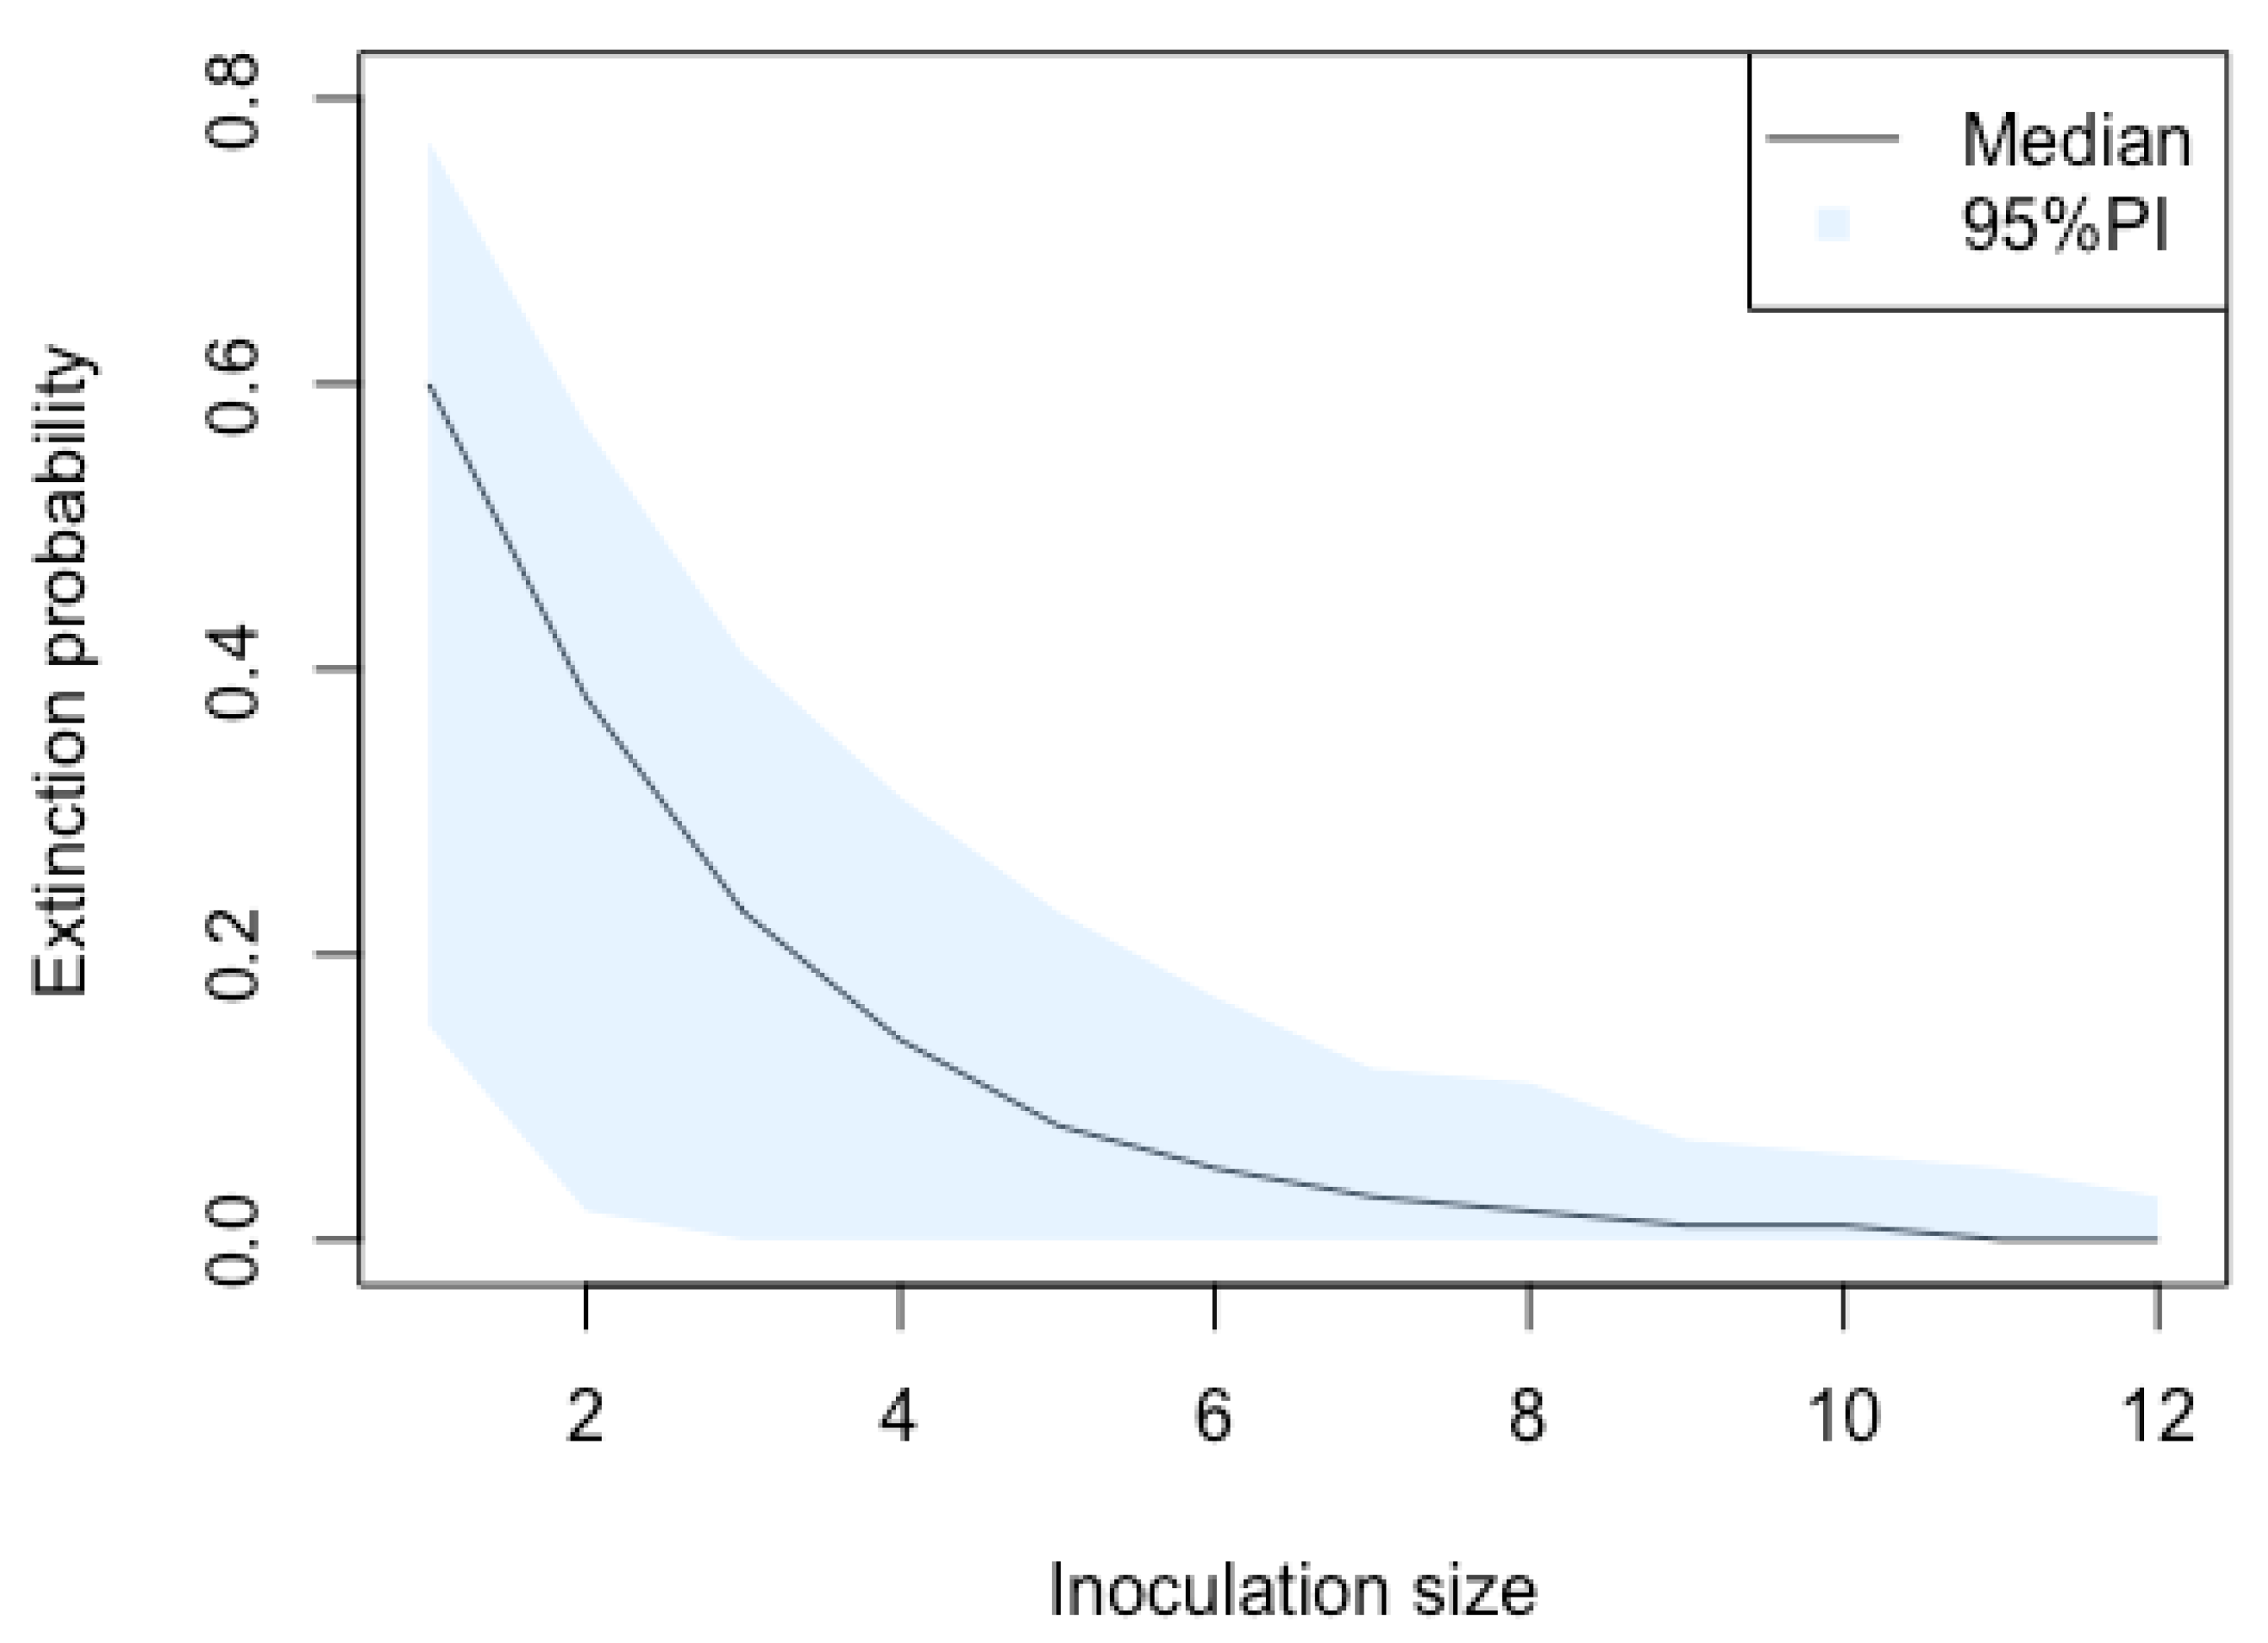
We now focus on two infection periods where there is a low number of pRBCs and so extinction is relatively more likely to occur. The first is the period immediately following inoculation. During the period, drugs have not yet been administered and thus k d ¯ = 0 in the model simulation. We examine the extinction probability for different inoculation sizes (Figure 3). The extinction probability decreases as the inoculation size increases and becomes very low when the inoculation size is more than 10 pRBCs (e.g., 97.5% of the predicted extinction probability is less than 1% for an inoculation size of 12 pRBCs based on the 95% PI). The result suggests that stochastic extinction immediately following inoculation is unlikely to occur when the inoculation size is larger than 12 pRBCs, which likely explains why stochastic extinction immediately post-inoculation has not been observed in the VIS volunteers who were inoculated with a much higher number of pRBCs (approximately 2800 pRBCs [12]).
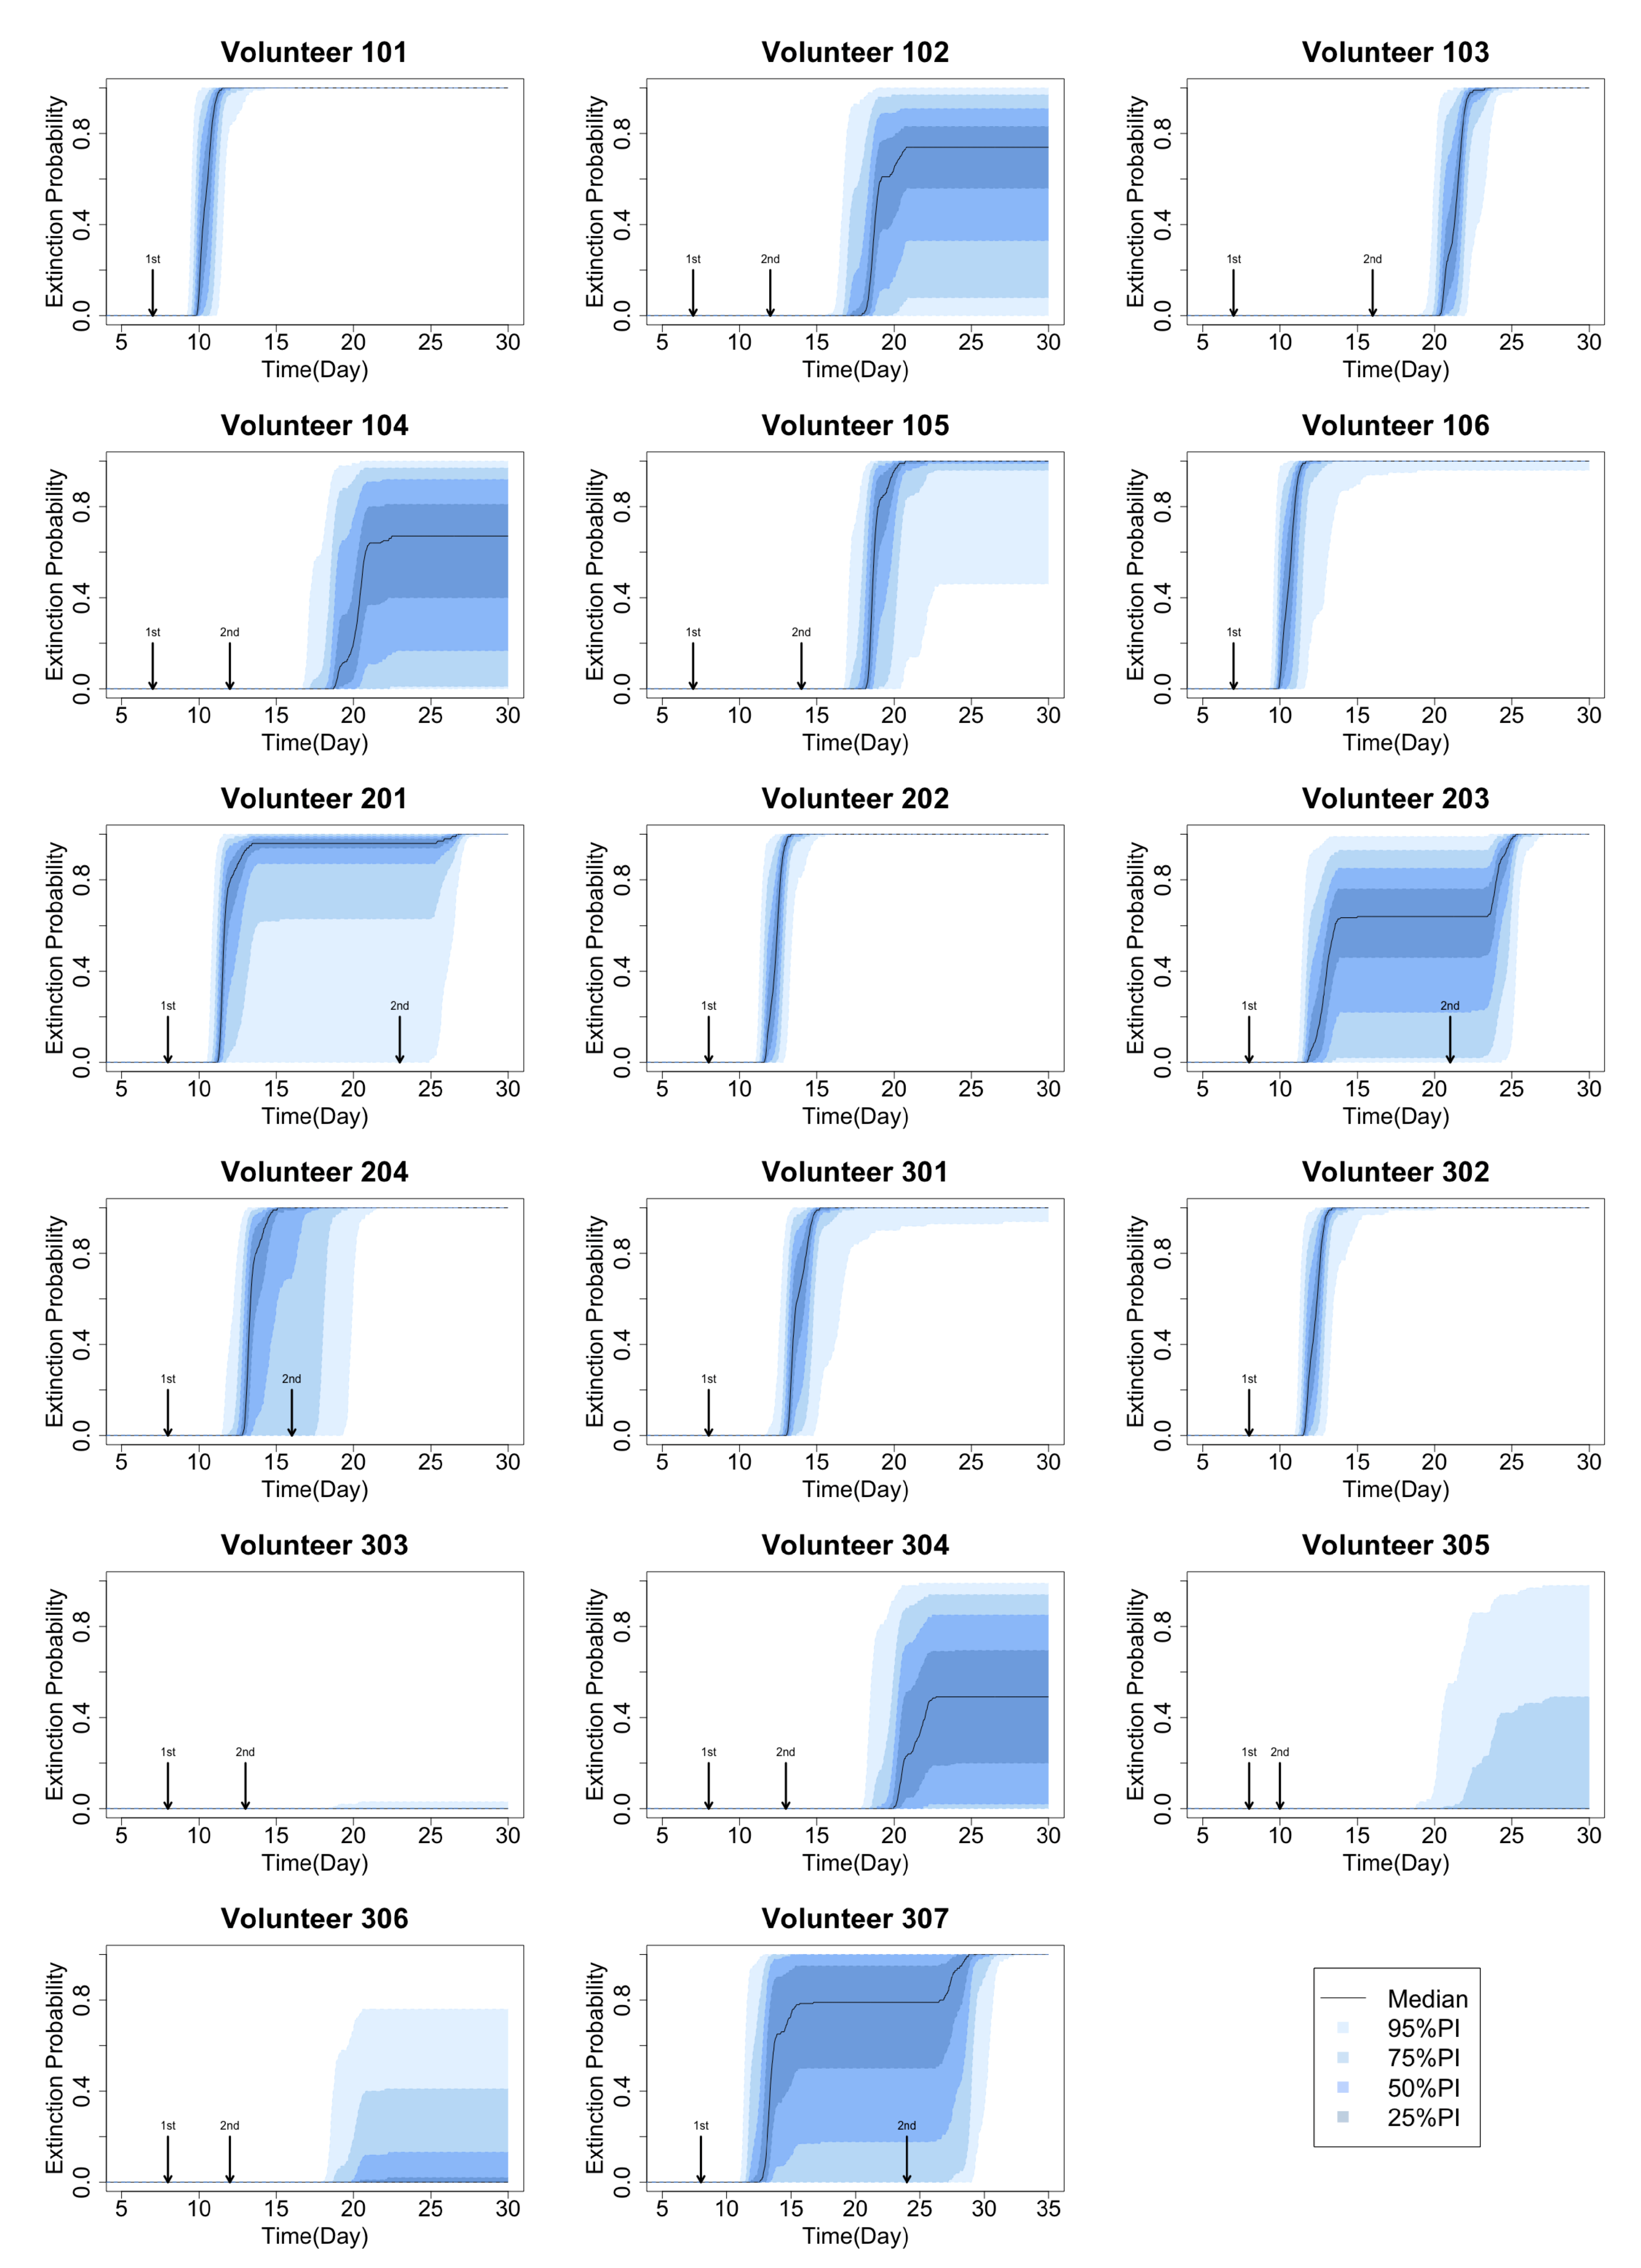
The second is the period after antimalarial treatment. In the VIS, volunteers were treated with one dose of piperaquine on day 7 or 8 and a second dose was given to those who developed recrudescence, this is, parasitemia was detected and inreased post treatment. Here we focus on examining how the extinction probability changes over time after treatment for all 17 volunteers in the VIS and identify the role of stochastic extinction in influencing the treatment outcomes. Figure 4 shows the extinction probability profiles for four volunteers which have been selected to represent the different types of behaviour observed in all 17 volunteers (results for all 17 volunteers are provided in Figure A1 in the Appendix A). In detail, Figure 4A shows the scenario in which the extinction probability jumps to approximately 100% (e.g., 2.5% of the predicted extinction probability is larger than 0.99 for Volunteer 101) after the first dose of piperaquine treatment, suggesting that residual parasites are almost certainly successfully cleared after the first treatment. Those volunteers are unlikely to experience recrudescence (a similar behaviour is seen in Volunteer 106, 202, 301 and 302; see Figure A1). There is a lag of approximately three days before the extinction probability starts increasing due to the time required for drug to reduce the number of viable parasites down to a sufficiently low level such that stochastic extinction occurs. A different behaviour is observed in Volunteer 307 where the first dose of piperaquine did not lead to a certainly high extinction probability (which is consistent with the occurrence of recrudescence). A second dose of piperaquine is required to further reduce parasitemia and in turn increase the extinction probability to approximately 100% (Figure 4B; also see Figure A1 for a similar behaviour in Volunteer 103, 105, 201, 203 and 204).
The probability of stochastic extinction does not always increase after the first dose of piperaquine at all. Figure 4C shows such a scenario where the extinction probability remains small after the first dose of piperaquine (e.g., the median of the predicted extinction probability is smaller than 1% before the second dose is given). The median prediction of extinction probability only increases significantly after the second dose of piperaquine (a similar behaviour is seen in Volunteer 102 and 103; see Figure A1). Figure 4D shows a situation in which the predicted extinction probability remains low after the second dose of piperaquine (the median predicted extinction probability is below 1%), suggesting that Volunteer 303 had a low chance of stochastic extinction (a similar behavior seen in Volunteer 305 and 306). Cure required additional treatment [12].

3.2. Primary Parameters Affecting Extinction Probability

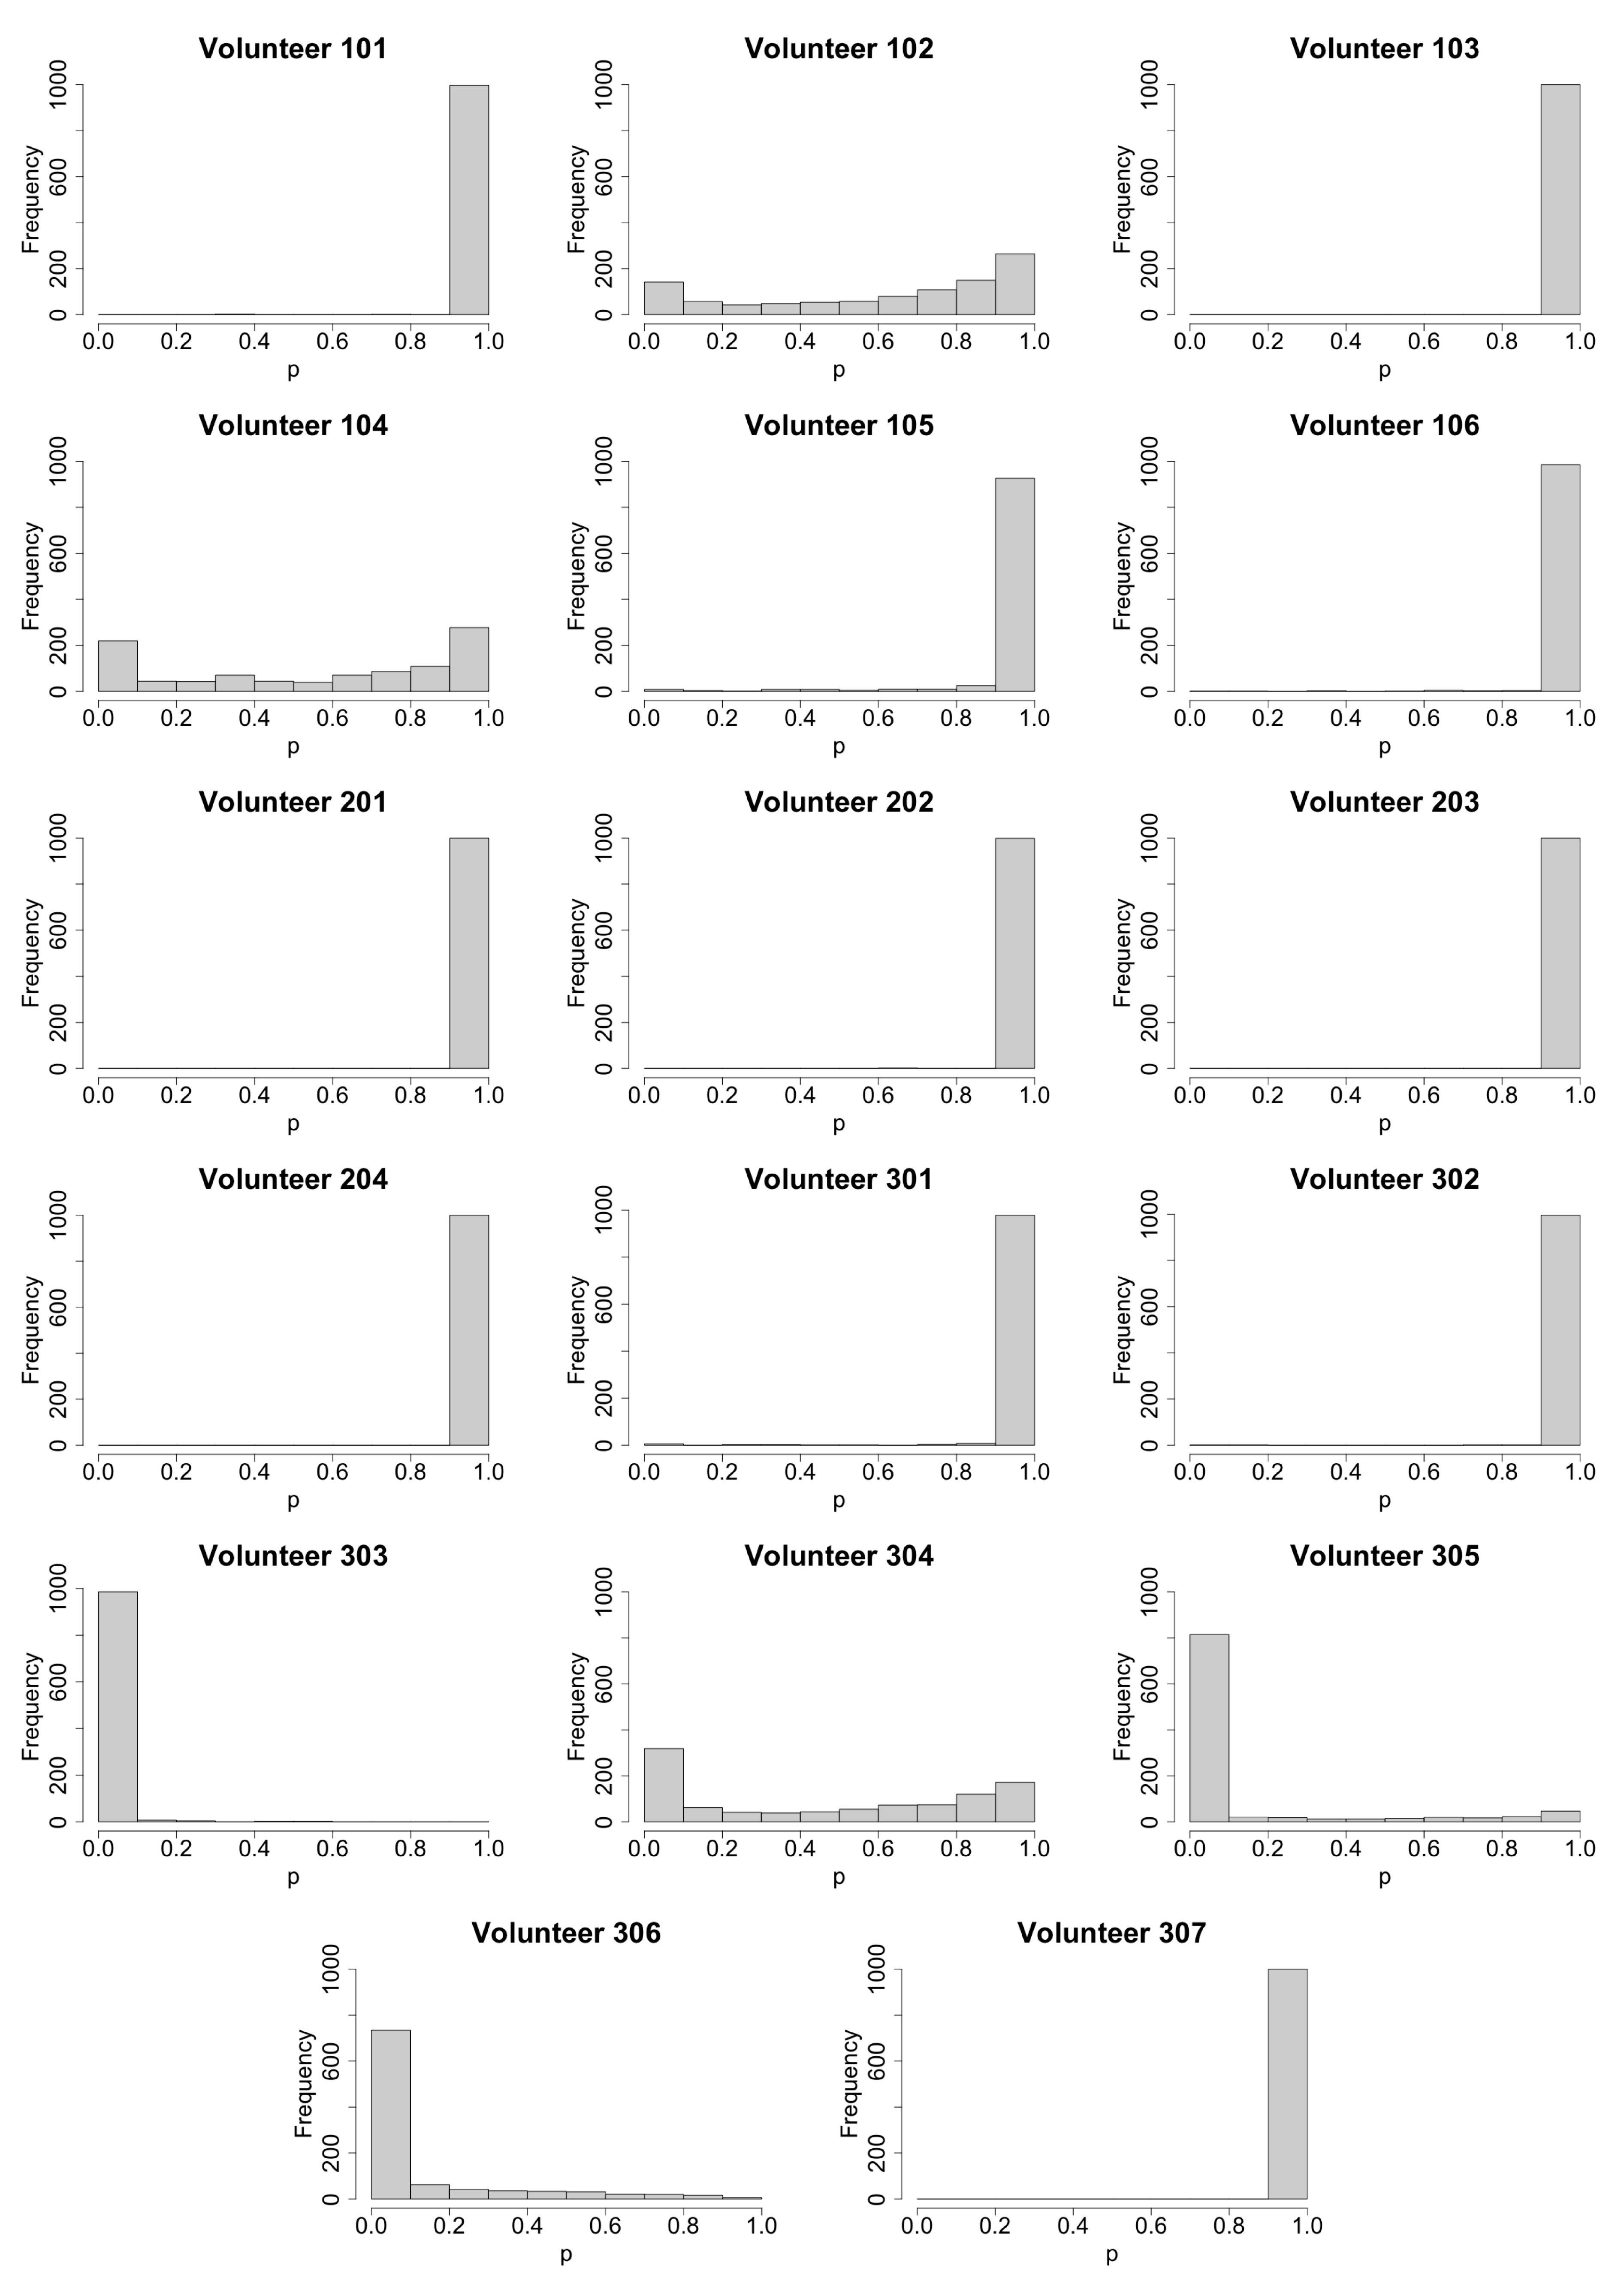
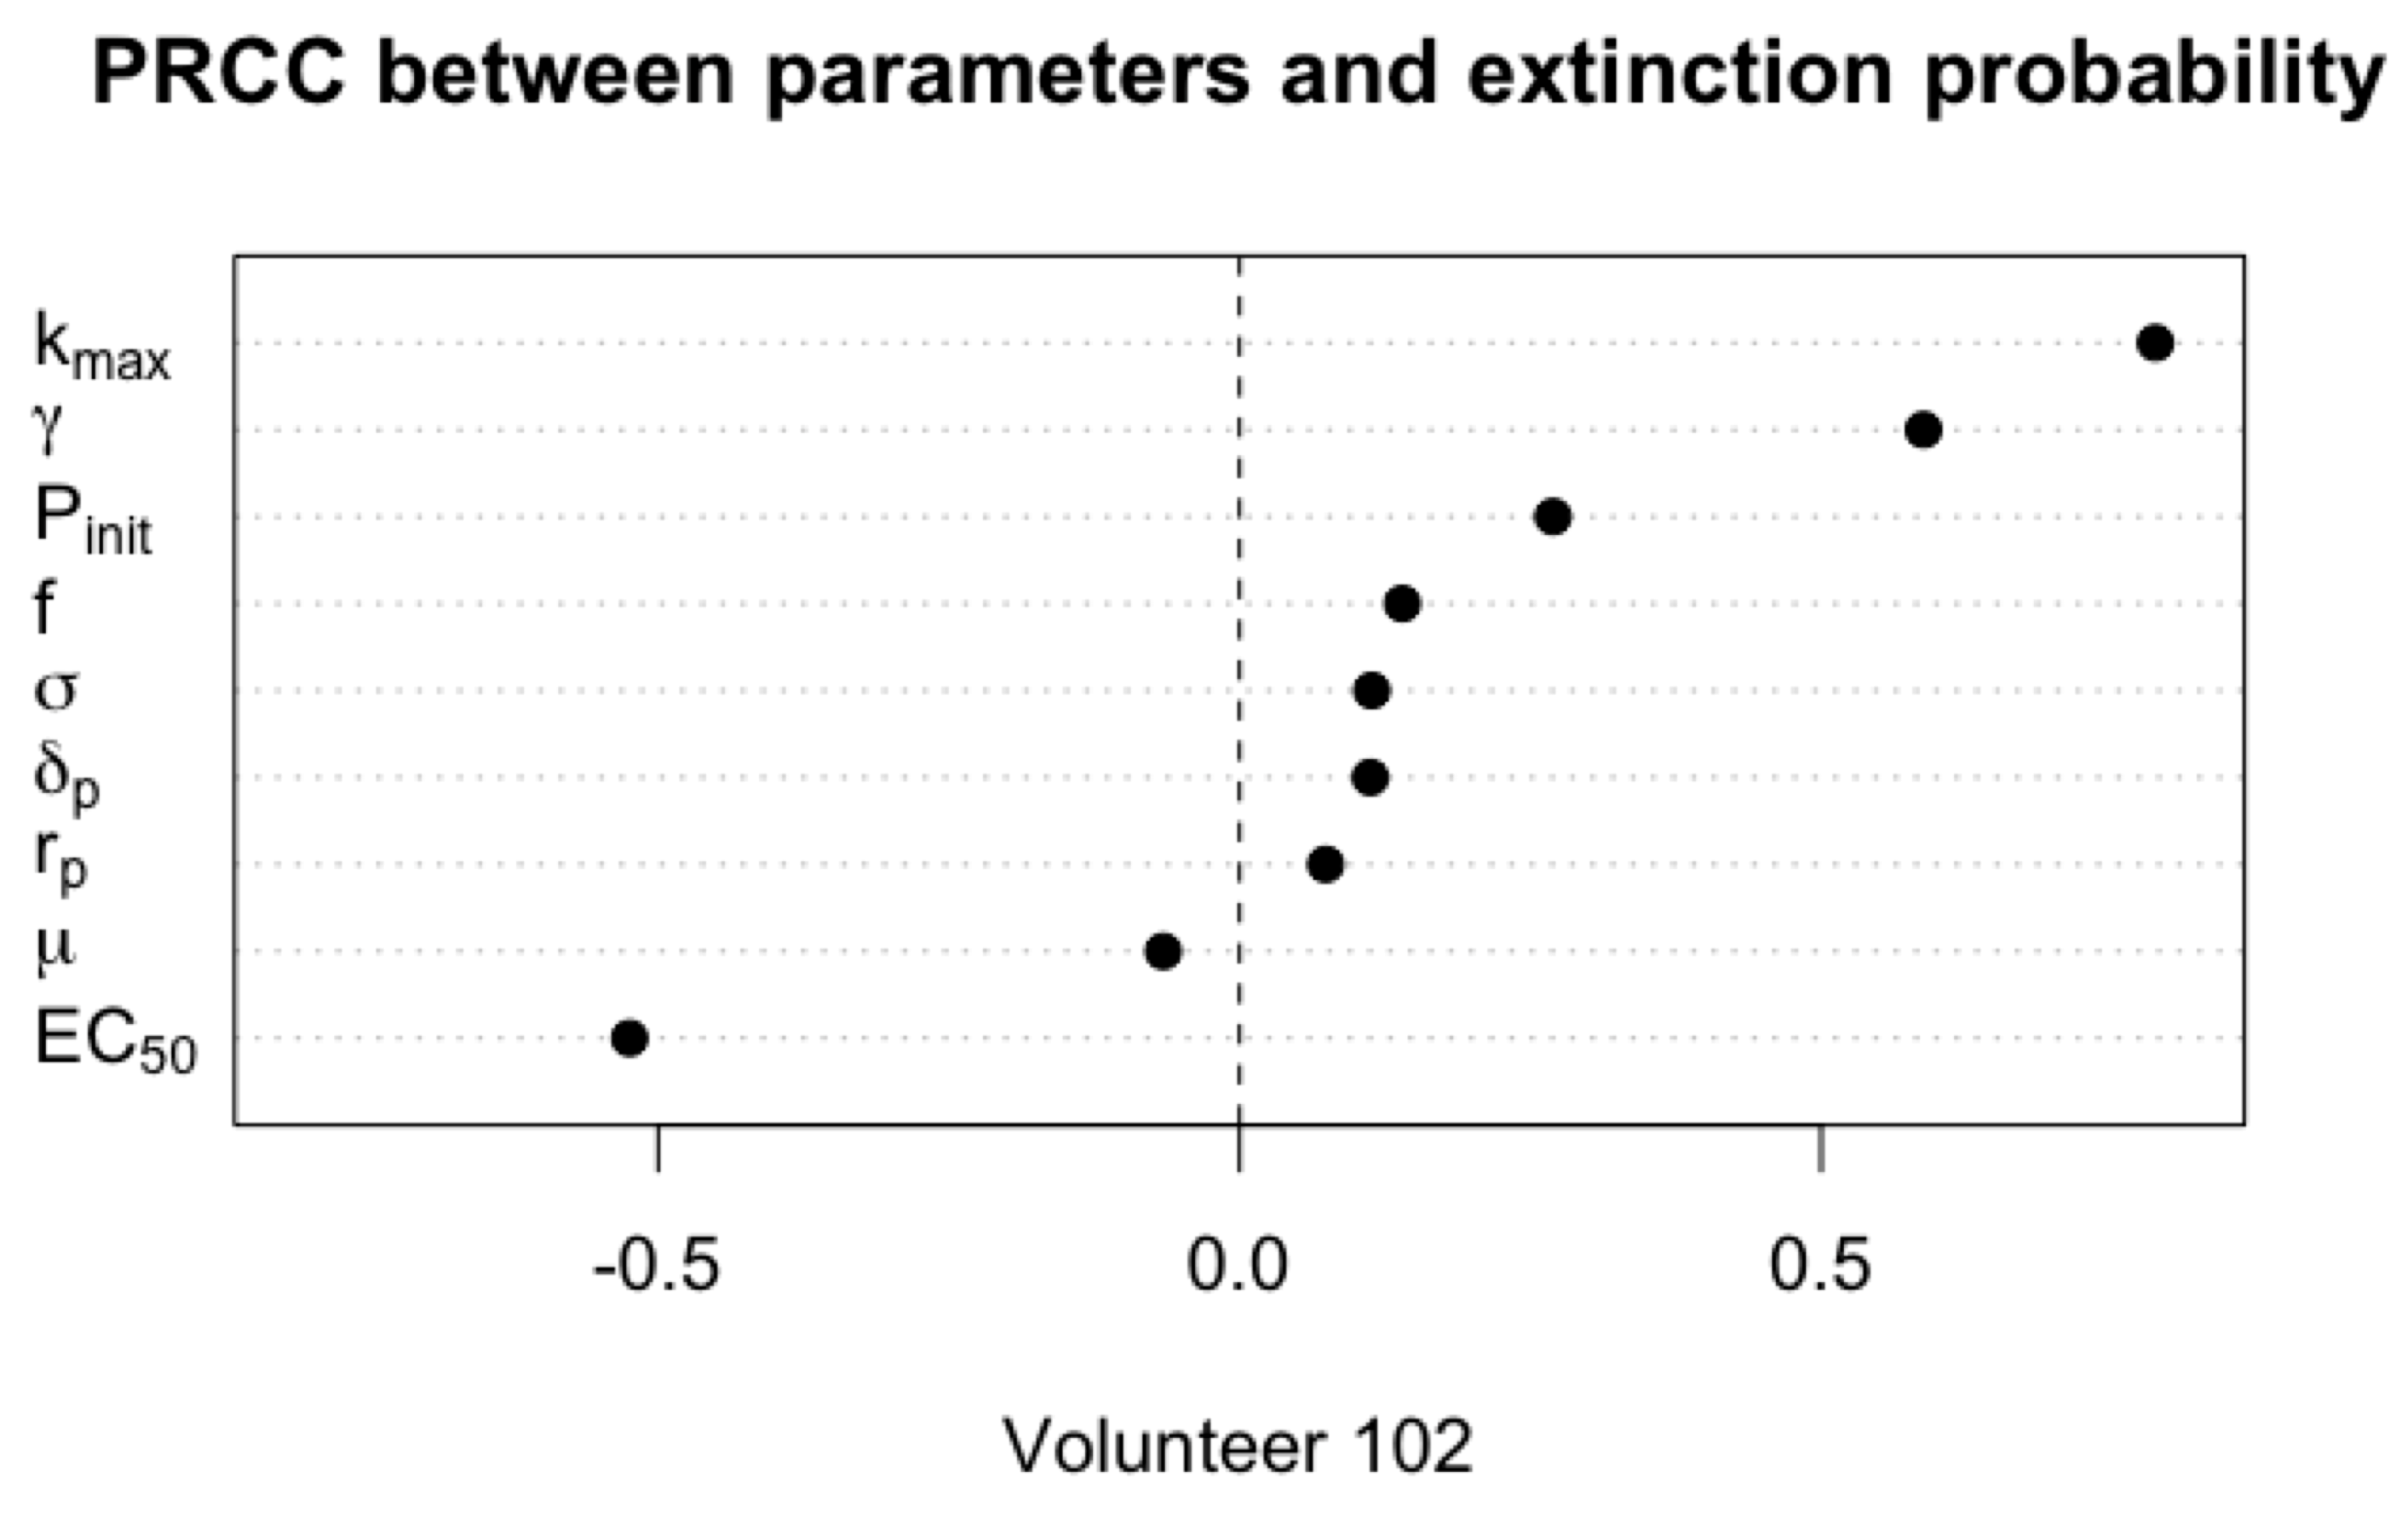
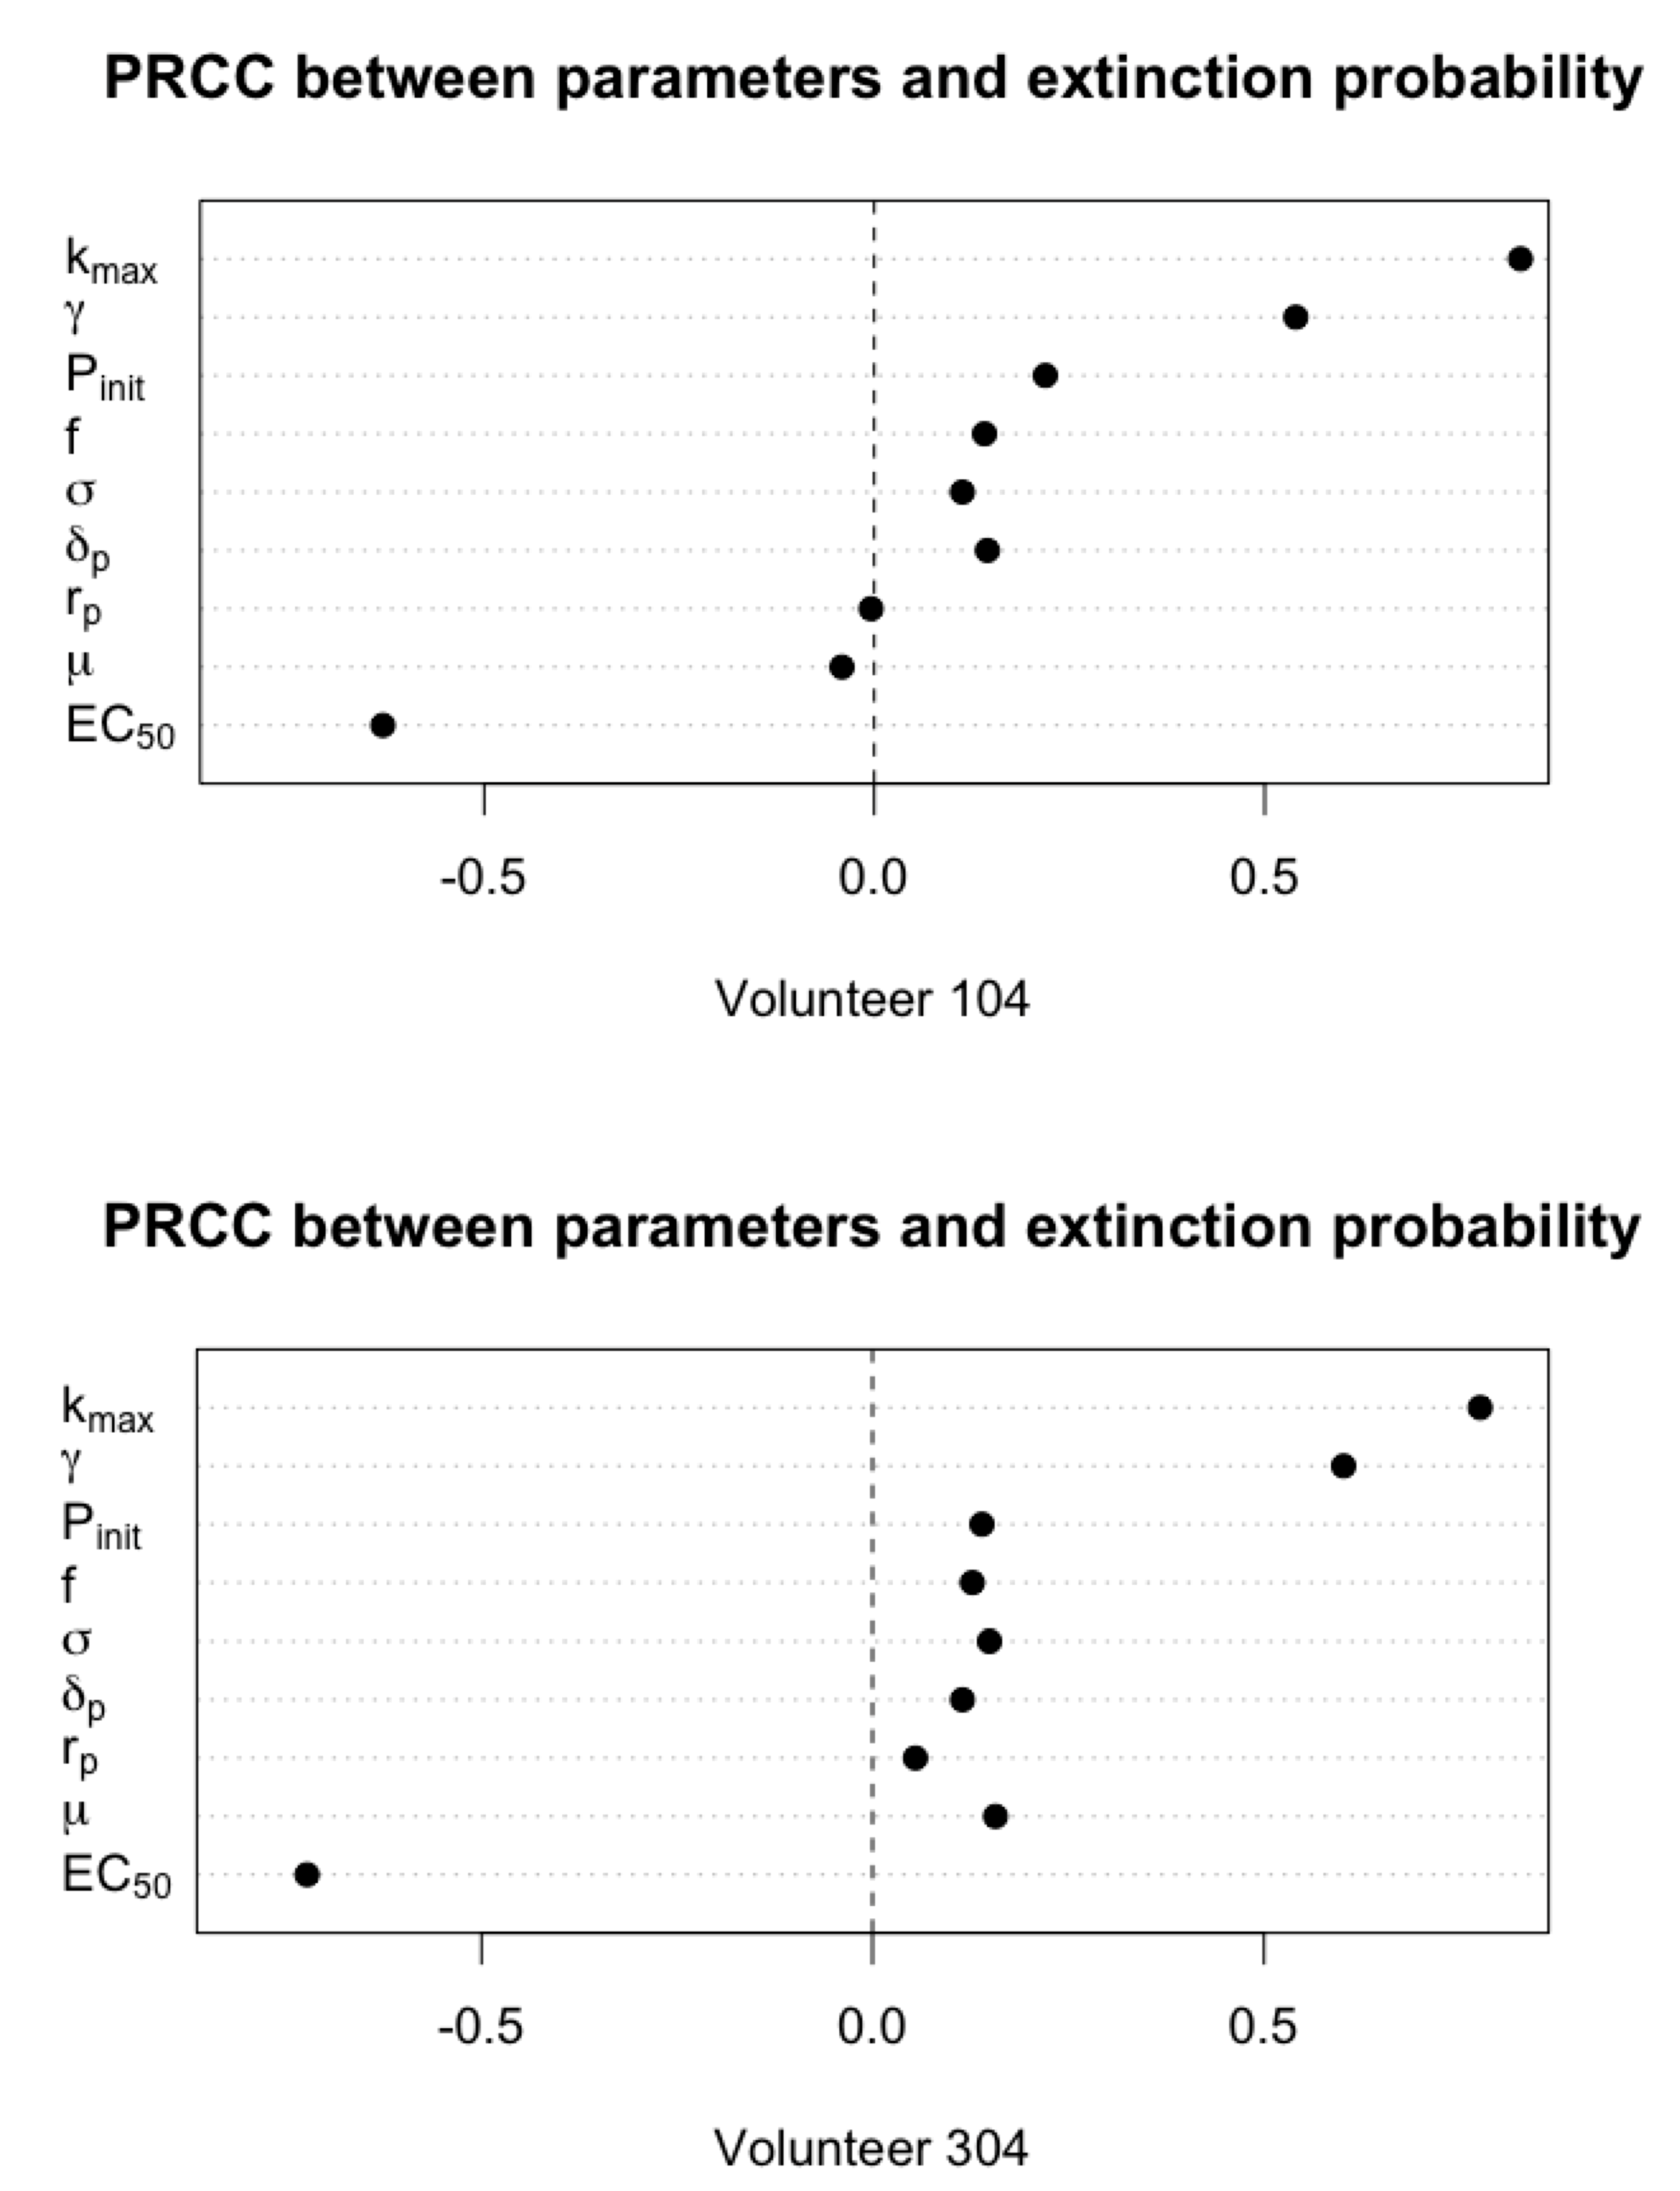
Having examined different extinction probability profiles, we look at the distribution of the extinction probability at the end of simulation time for all volunteers (see Figure A2). The distributions of extinction probability for the volunteers exhibit three different patterns (three representatives are shown in Figure 5). Fourteen volunteers’ distributions (all volunteers except Volunteer 102, 104 and 304) are concentrated at either end of the interval (indicating either a very high or very low chance of stochastic extinction) while three are distributed more evenly (e.g., Volunteer 104 in Figure 5). In order to identify the parameters determining the extinction probability using PRCC, we conduct a sensitivity analysis using the samples of the extinction probability distribution from three volunteers who belong to the third case (i.e., Volunteer 102, 104 and 304).
Figure 6 shows the results of PRCC analysis for the three volunteers whose extinction probability distributions are shown in Figure 5. We can see that the top three absolute PRCC values are k m a x , E C 50 and γ , suggesting that the parameters primarily affecting the extinction probability are those directly related to the drug effect, and whether a patient can clear the parasites by stochastic extinction well depends strongly on the efficacy of applied antimalarial drug.
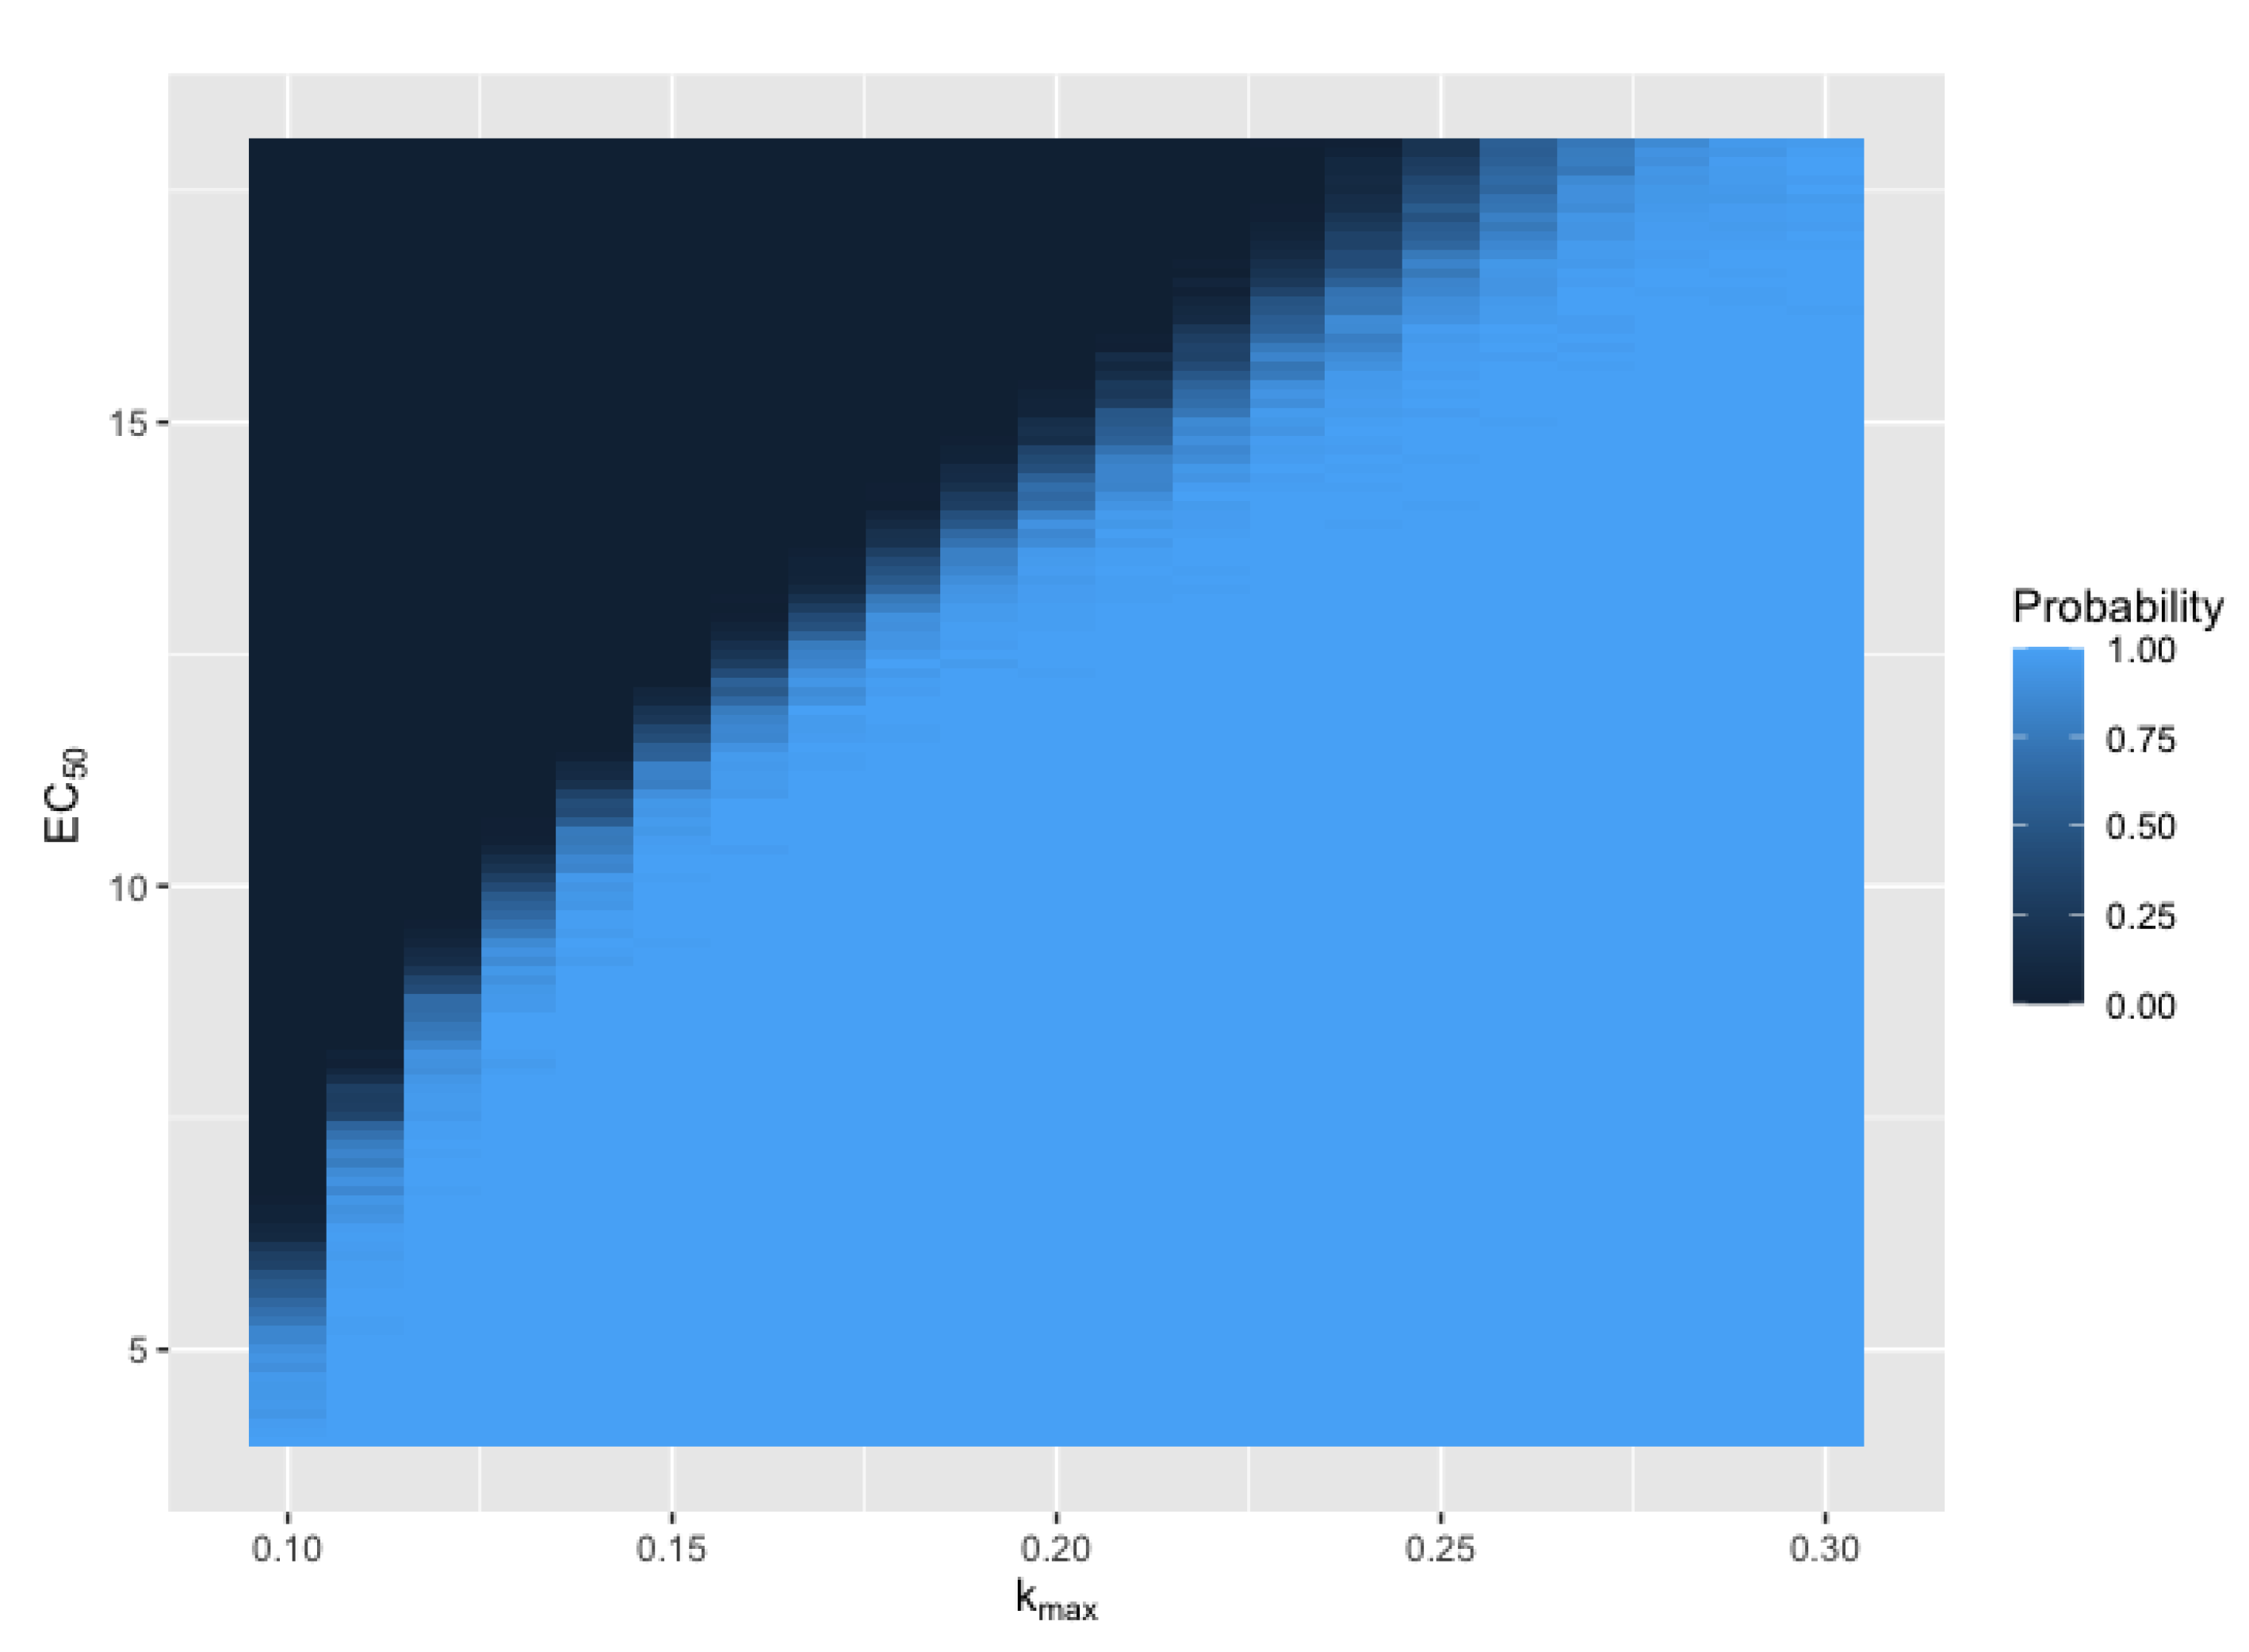
Here we focus on the effect of k m a x and E C 50 on the extinction probability. Although the Hill coefficient γ may exhibit a stronger correlation with the extinction probability for Volunteer 102, this parameter is generally less variable than k m a x and E C 50 based on earlier modelling work [8,16]. Figure 7 shows the dependence of the extinction probability on k m a x and E C 50 . There is a clear transition curve that divides the extinction probability into two regions. Below the curve ( k m a x is high and E C 50 is low (i.e., a strong antimalarial effect)), the extinction probability is close to 1, suggesting that stochastic extinction would be the dominant mechanism for clearing residual parasites. In the region above the curve, stochastic extinction plays little role in parasite clearance because the antimalarial drug is less effective and unable to reduce parasitemia to a sufficiently low level such that stochastic extinction is likely to occur. Only a small region of ( k m a x and E C 50 ) parameter space supports intermediate values for the extinction probability.

4. Discussion

In this study, we constructed a stochastic model of within-host malaria infection based on the deterministic model developed by [9]. We used the model to study the probability of stochastic extinction in malaria-infected human volunteers in a VIS. Based on sampling from the posterior distribution for parameters determined by Cao et al, we showed that stochastic extinction could occur when the number of pRBCs was reduced significantly due to antimalarial treatment (Figure 2). We further showed that drug related parameters, such as the maximum killing rate k m a x and half-maximal effective concentration E C 50 , are two primary factors determining the probability of stochastic extinction. A very sharp transition from high probability to low probability of extinction as k m a x and E C 50 are varied was identified. Our results demonstrate the important role of highly-efficacious antimalarials in increasing the chance of complete resolution of infection for malaria patients. Furthermore, accurate estimation of k m a x and E C 50 for an individual may allow the recrudescence probability for an individual to be accurately anticipated, suggesting treatment strategy. Cure or recrudescence following drug treatment is a major open challenge in malaria treatment research, with studies investigating these complex phenomena contributing to World Health Organisation policy on drug regimens [4,8,9].
Our stochastic model shows that stochastic extinction leading to complete resolution of parasites that can occur after the first treatment. Given the new properties introduced by the stochastic model, it may be necessary to re-estimate the biological parameters by fitting the stochastic model to the same set of VIS data. Fitting a complex stochastic model to data in a Bayesian hierarchical framework is still a challenging and time-consuming task, and a potentially feasible method is the one developed by Alahakoon et al. [17], which has been shown to be able to estimate the parameters in a simple epidemiological model. Refitting the stochastic model to VIS data and examining the parameter estimates are left for future work.
Our stochastic model can be extended to include gametocyte dynamics to study malaria transmission from humans to mosquitoes. The human-to-mosquito transmission is not only determined by the level of gametocytemia (i.e., the number of circulating gametocytes in the peripheral blood), but also by the probability of transmission per mosquito bite. The latter is related to the density and ratio of female and male gametocytes [18]. Mulder et al. found that the percentage of successful infections after human-to-mosquito transmission increased as the level of gametocytemia increased though there were some exceptions where low gametocyte density might also lead to high chance of infections [19]. Extending our stochastic model to include the dynamics of male and female gametocytes will allow us to study the transimission data and contribute to studying malaria transmission with multiscale models.
In conclusion, we have shown that a stochastic model of within-host dynamics of P. falciparum provides novel insight into the mechanism of parasite clearance, contributing to current effort to both understand the drives of clinical observations and develop improved treatment strategies. With extension to include novel antimalarial treatment and gametocyte dynamics, the stochastic model will be a valuable tool to predict optimal dosing regimens and study human-to-mosquito transmission, contributing to the progress of malaria elimination.

Author Contributions

Conceptualization, X.S., J.M.M. and P.C.; methodology, X.S., J.M.M. and P.C.; formal analysis, X.S.; writing—original draft preparation, X.S.; writing—review and editing, X.S., J.M.M. and P.C.; All authors have read and agreed to the published version of the manuscript.

Funding

This research was funded by the National Health and Medical Research Council Centre for Research Excellence (grant number 1134989). Xiao Sun is supported by a Melbourne Research Scholarship from the University of Melbourne, Australia.

Institutional Review Board Statement

Not applicable.

Informed Consent Statement

Not applicable.

Data Availability Statement

No clinical data are used in this work. The study includes many simulations of a stochastic model, and computer code for performing model simulations is publicly available at https://github.com/XSSUN2/Stochastic_Modeling_Malaria (accessed on 9 September 2022).

Acknowledgments

We thank the editor and reviewers for providing useful comments. This research is supported by use of the Nectar Research Cloud, a collaborative Australian research platform supported by the National Collaborative Research Infrastructure Strategy (NCRIS).

Conflicts of Interest

The authors declare that there is no conflict of interest.

Abbreviations

The following abbreviations are used in this manuscript:
P.Plasmodium
RBCRed blood cell
pRBCparasitized red blood cell
VISVolunteer infection study
PRCCPartial rank correlation coefficient

Appendix A

Figure A1. The extinction probability over time after treatment for all 17 volunteers.
Mathematics 10 04057 g0a1
Figure A2. Distribution of the extinction probability at the end of simulation time for 17 volunteers.
Mathematics 10 04057 g0a2

References

  1. Caraballo, H.; King, K. Emergency department management of mosquito-borne illness: Malaria, dengue, and West Nile virus. Emerg. Med. Pract. 2014, 16, 1–23. [Google Scholar] [PubMed]
  2. Lin, J.T.; Juliano, J.J.; Wongsrichanalai, C. Drug-Resistant Malaria: The Era of ACT. Curr. Infect. Dis. Rep. 2010, 12, 165–173. [Google Scholar] [CrossRef] [Green Version]
  3. Alonso, P.L.; Brown, G.V.; Arévalo-Herrera, M.; Binka, F.N.; Chitnis, C.E.; Collins, F.; Doumbo, O.K.; Greenwood, B.; Hall, B.F.; Levine, M.M.; et al. A Research Agenda to Underpin Malaria Eradication. PLoS Med. 2011, 8, e1000406. [Google Scholar] [CrossRef] [PubMed]
  4. Simpson, J.A.; Zaloumis, S.G.; DeLivera, A.M.; Price, R.N.; McCaw, J.M. Making the Most of Clinical Data: Reviewing the Role of Pharmacokinetic-Pharmacodynamic Models of Anti-malarial Drugs. AAPS J. 2014, 16, 962–974. [Google Scholar] [CrossRef] [PubMed] [Green Version]
  5. Hoshen, M.B.; Heinrich, R.; Stein, W.D.; Ginsburg, H. Mathematical modelling of the within-host dynamics of Plasmodium falciparum. Parasitology 2000, 121, 227–235. [Google Scholar] [CrossRef] [PubMed]
  6. Smith, T.A.; Dietz, K.; Vounatsou, P.; Muller, I.; English, M.; Marsh, K. Bayesian age-stage modelling of Plasmodium falciparum sequestered parasite loads in severe malaria patients. Parasitology 2004, 129, 289–299. [Google Scholar] [CrossRef] [PubMed]
  7. Saralamba, S.; Pan-ngum, W.; Maude, R.J.; Lee, S.J.; Tarning, J.; Lindegårdh, N.; Chotivanich, K.; Nosten, F.H.; Day, N.P.J.; Socheat, D.; et al. Intrahost modeling of artemisinin resistance in Plasmodium falciparum. Proc. Natl. Acad. Sci. USA 2010, 108, 397–402. [Google Scholar] [CrossRef] [PubMed] [Green Version]
  8. Zaloumis, S.G.; Humberstone, A.J.; Charman, S.A.; Price, R.N.; Moehrle, J.J.; Gamo-Benito, J.; McCaw, J.M.; Jamsen, K.M.; Smith, K.; Simpson, J.A. Assessing the utility of an anti-malarial pharmacokinetic-pharmacodynamic model for aiding drug clinical development. Malar. J. 2012, 11, 303. [Google Scholar] [CrossRef] [PubMed] [Green Version]
  9. Cao, P.; Collins, K.A.; Zaloumis, S.; Wattanakul, T.; Mccaw, J.M. Modeling the dynamics of Plasmodium falciparum gametocytes in humans during malaria infection. eLife 2019, 8, e49058. [Google Scholar] [CrossRef] [PubMed]
  10. Ockenhouse, C.; Regules, J.A.; Tosh, D.M.; Cowden, J.J.; Kathcart, A.K.; Cummings, J.F.; Paolino, K.M.; Moon, J.E.; Komisar, J.L.; Kamau, E.; et al. Ad35.CS.01 - RTS,S/AS01 Heterologous Prime Boost Vaccine Efficacy against Sporozoite Challenge in Healthy Malaria-Naïve Adults. PLoS ONE 2015, 10, e0131571. [Google Scholar] [CrossRef] [PubMed]
  11. Gómez-Pérez, G.P.; Legarda, A.; Muñoz, J.; Sim, B.K.L.; Ballester, M.R.; Dobaño, C.; Moncunill, G.; Campo, J.J.; Cisteró, P.; Jiménez, A.; et al. Controlled human malaria infection by intramuscular and direct venous inoculation of cryopreserved Plasmodium falciparum sporozoites in malaria-naïve volunteers: Effect of injection volume and dose on infectivity rates. Malar. J. 2015, 14, 1–13. [Google Scholar] [CrossRef] [PubMed] [Green Version]
  12. Collins, K.A.; Wang, C.Y.T.; Adams, M.; Mitchell, H.; Rampton, M.; Elliott, S.; Reuling, I.J.; Bousema, T.; Sauerwein, R.W.; Chalon, S.; et al. A controlled human malaria infection model enabling evaluation of transmission-blocking interventions. J. Clin. Investig. 2018, 128, 1551–1562. [Google Scholar] [CrossRef] [PubMed] [Green Version]
  13. Chughlay, M.F.; Gaaloul, M.E.; Donini, C.; Campo, B.; Berghmans, P.J.; Lucardie, A.; Marx, M.W.; Cherkaoui-Rbati, M.H.; Langdon, G.; Angulo-Barturen, I.; et al. Chemoprotective Antimalarial Activity of P218 against Plasmodium falciparum: A Randomized, Placebo-Controlled Volunteer Infection Study. Am. J. Trop. Med. Hyg. 2021, 104, 1348–1358. [Google Scholar] [CrossRef]
  14. Gillespie, D.T. Approximate accelerated stochastic simulation of chemically reacting systems. J. Chem. Phys. 2001, 115, 1716–1733. [Google Scholar] [CrossRef] [Green Version]
  15. Marino, S.; Hogue, I.B.; Ray, C.J.; Kirschner, D.E. A methodology for performing global uncertainty and sensitivity analysis in systems biology. J. Theor. Biol. 2008, 254, 178–196. [Google Scholar] [CrossRef] [PubMed] [Green Version]
  16. Cao, P.; Klonis, N.; Zaloumis, S.G.; Dogovski, C.; Xie, S.C.; Saralamba, S.; White, L.J.; Fowkes, F.J.I.; Tilley, L.; Simpson, J.A.; et al. A Dynamic Stress Model Explains the Delayed Drug Effect in Artemisinin Treatment of Plasmodium falciparum. Antimicrob. Agents Chemother. 2017, 61, e00618-17. [Google Scholar] [CrossRef] [PubMed] [Green Version]
  17. Alahakoon, P.; McCaw, J.M.; Taylor, P.G. Estimation of the probability of epidemic fade-out from multiple outbreak data. Epidemics 2022, 38, 100539. [Google Scholar] [CrossRef]
  18. Bradley, J.; Stone, W.; Da, D.F.; Morlais, I.; Dicko, A.; Cohuet, A.; Guelbéogo, W.M.; Mahamar, A.; Nsango, S.E.; Soumare, H.M.; et al. Predicting the likelihood and intensity of mosquito infection from sex specific Plasmodium falciparum gametocyte density. eLife 2018, 7, e34463. [Google Scholar] [CrossRef] [PubMed]
  19. Mulder, B.; Tchuinkam, T.; Dechering, K.J.; Verhave, J.P.; Carnevale, P.; Meuwissen, J.H.; Robert, V. Malaria transmission-blocking activity in experimental infections of Anopheles gambiae from naturally infected Plasmodium falciparum gametocyte carriers. Trans. R. Soc. Trop. Med. Hyg. 1994, 88, 121–125. [Google Scholar] [CrossRef]
Figure 1. Schematic diagram showing the model compartments and transitions. P ( a , t ) represents the number of asexual parasites with age a at time t, where a denotes the developmental stage of parasites, a [ 0 , a L ] and t denotes the time of interest, t [ 0 , + ) . The history and contribution of mathematical models for the population biology of malaria infection and treatment has been reviewed in [4], which provides an overview of the developmental process and need for models that account for the age a of parasites. The loop of P ( a , t ) represents the a L -hour life cycle of asexual parasites. During the life cycle, parasites may die and become damaged parasites, which can be modelled deterministically as in Equation (1) or stochastically by a Poisson process with a rate P ( a , t ) δ p Δ t where δ p is the natural death rate of parasites. Sexual commitment occurs at age a s where a small fraction f of the asexual parasites enter the sexual development to become sexually committed parasites P G ( a s + 1 , t ) . The compartments with a dashed boundary represent the stages of parasites that are sequestered to tissues and thus not measurable by blood smear.
Mathematics 10 04057 g001
Figure 2. Examples of stochastic model trajectories. (A) shows two examples of extinction (green) and recrudescence (red). To mimicking the VIS clinical trial, for the extinction simulation, the parameter values used are P i n i t = 440 , μ = 4.0 , σ = 5.5 , r p = 92 , k m a x = 0.24 , E C 50 = 3.0 , γ = 7.0 , f = 0.0047 , δ p = 0.035 and PK curve C ( t ) is obtained from Cao et al. (Volunteer 101). For the recrudescence simulation, we used P i n i t = 0.11 , μ = 6.0 , σ = 5.3 , r p = 76 , k m a x = 0.12 , E C 50 = 13 , γ = 11 , f = 0.0088 , δ p = 0.038 , and PK curve C ( t ) is obtained from Cao et al. (Volunteer 102). All the parameter values are chosen based on the posterior estimates from [9]. (B) shows 30 more realisations of stochastic extinction using the same parameter values as that generating the green curve in (A). A close-up is shown on the top-right corner.
Mathematics 10 04057 g002
Figure 3. Relationship between extinction probability and inoculation size. We set P i n i t to be a fixed value (between 1 and 12) and the other parameters are selected from the 5000 posterior samples (population mean parameter values) generated by Cao et al. The median (solid line) and 95% PI (blue area) are generated by simulating the stochastic model 100 times to calculate the extinction probability by the proportion of extinction events in the 100 realisations as described in Materials and methods.
Mathematics 10 04057 g003
Figure 4. Model-predicted time series of extinction probabilities for volunteer 101 (panel A), 307 (panel B), 304 (panel C) and 303 (panel D). The median (solid curve) and 25%, 50%, 75% and 95% PI (shaded area) were generated by simulating the stochastic model using 1000 samples selected from the 5000 posterior samples generated by Cao et al. [9] For each of the 1000 selected samples the stochastic model was simulated 100 times and the extinction probability was given by the proportion of extinction events in the 100 realisations as described in Materials and methods. Arrows indicate the administration times of the first or the second (if any) dose of piperaquine.
Mathematics 10 04057 g004
Figure 5. Distribution of the extinction probability at the end of simulation time for volunteer 101, 104 and 303.
Mathematics 10 04057 g005
Figure 6. PRCC results for volunteer 102, 104 and 304. The top three parameters with the largest absolute values of PRCC are k m a x (PRCC = 0.7874), γ (PRCC = 0.5880) and E C 50 (PRCC = 0.5245 ) for volunteer 102, k m a x (PRCC = 0.8279), E C 50 (PRCC = 0.6299 ) and γ (PRCC = 0.5399) for volunteer 104 and k m a x (PRCC = 0.7764), E C 50 (PRCC = 0.7232 ), γ (PRCC = 0.6017) for volunteer 304.
Mathematics 10 04057 g006aMathematics 10 04057 g006b
Figure 7. Sensitivity analysis showing the dependence of extinction probability on the k m a x and E C 50 . We take k m a x every 0.01 from 0.1 to 0.3 and E C 50 every 0.1 from 4 to 18. The other parameter values used are P i n i t = 350 , μ = 7.5 , σ = 5 , r p = 80 , γ = 12 , f = 0.004 , δ p = 0.03 .
Mathematics 10 04057 g007
Table 1. Model parameters, unit and descriptions.
ParameterDescriptionUnit
P i n i t Inoculation sizeunitless
μ Mean of the initial age distributionh
σ SD of the initial age distributionh
r p Replication numberunitless
k m a x Maximum rate of parasite killing by drugh 1
E C 50 Half-maximum effective concentration of drugng/mL
γ Hill coefficient for drugunitless
fFraction of parasites entering sexual developmentunitless
δ p Death rate of asexual and sexual parasitesh 1
a s Sequestration age of asexual parasites (fixed to be 25)h
a L Length of life cycle of asexual parasites (fixed to be 42)h
Publisher’s Note: MDPI stays neutral with regard to jurisdictional claims in published maps and institutional affiliations.