Article

Quality Evaluation for Reconstructing Chaotic Attractors

Faculty of Electronics, Telecommunications and Information Technology, University Politehnica of Bucharest, 061071 Bucharest, Romania
Mathematics 2022, 10(22), 4229; https://doi.org/10.3390/math10224229
Submission received: 15 September 2022 / Revised: 1 November 2022 / Accepted: 2 November 2022 / Published: 12 November 2022
(This article belongs to the Special Issue Dynamical Systems and Optimal Control, 2nd Edition)

Abstract

:
Dynamical systems are used in various applications, and their simulation is related with the type of mathematical operations used in their construction. The quality of the system is evaluated in terms of reconstructing the system, starting from its final point to the beginning (initial conditions). Deciphering a message has to be without loss, and this paper will serve to choose the proper dynamical system to be used in chaos-based cryptography. The characterization of the chaotic attractors is the most important information in order to obtain the desired behavior. Here, observability and singularity are the main notions to be used for introducing an original term: quality observability index (q.o.i.). This is an original contribution for measuring the quality of the chaotic attractors. In this paper, the q.o.i. is defined and computed in order to confirm its usability.

1. Introduction

The characterization of the chaotic system [1] is a huge challenge in terms of implementing a system which generates such behavior. In this paper, a new manner of quantifying this behavior is presented. The observability [2] is the first way to obtain information about the quality of a dynamical system. The singularity [3] of the systems is a collection of critical points, and the manifold created has to be avoided in terms of using dynamical systems in applications.
The influence of the singular manifold of non-observable states in reconstructing chaotic attractors [4] is an open problem because of the computational approximation [5] or even the classical operation used to implement systems. In chaos-based cryptography [6], the reconstruction [7] of the system is critical, and the work presented in this paper can solve this problem. In quantum applications [8], the computational precision will serve to avoid unpredictable losses.
The computational implementation is the most used part in terms of dynamical system implementation. Additionally, many types of measurements are realized in order to characterize the systems [9].
The characterization of a system based on time series [10] is related to the application where the system will be used.
In 1971, David Ruelle and Floris Takens [11] described a phenomenon they called strange attractor. The “strange” part is what they called the phase space (geometric representation of a system state space–mathematical space, where each dimension corresponds to a system with multiple state variables) and thus arose a new concept of chaos theory. The strange attractor shows areas where the system is periodic, has cycles of different periods, and areas where it is chaotic. These behaviors are present together in the same spatial area.
Chaotic behavior has many applications in various domains, such as communications [12], control theory [13], music [14], meteorology or blockchain [15].
This paper aims to define a concept meant to characterize the quality of dynamical systems. This characterization is necessary to choose the right system when building an application based on chaotic behavior.
The novelty of the paper consists in proposing a means of evaluating the quality of 3D dynamical systems. The paper proposes a numerical calculation method to evaluate the quality of the systems. This numerical value is compared with a visual analysis and with coefficients that evaluate the observability of the systems.
In Section 2, the investigated systems are recalled, and their attractor is presented. Section 3 gives the mathematical approach defined for characterization of the chaotic behavior. In Section 4, some experimental results are carried out in order to show the performance of the proposed coefficient. Some conclusions are given in the end.

2. Systems under Investigation

This paper is focused on continuous dynamical systems [16]. This systems are built using differential equations, which are known as continuous dynamical systems. Most of the dynamical systems, encountered in practice with more complex behaviors, are chaotic. They are characterized by a system of differential equations of the form
x ˙ = f ( x , t )
where x ( t ) = ( x 1 ( t ) , x 2 ( t ) , , x n ( t ) ) T n , t + , t t 0 is the state vector, with t 0 significance as the initialization moment of the system. The other meanings from (1) are as follows:
  • x ( t 0 ) is the initial condition;
  • x ˙ ( t ) = d x ( t ) d t = d x 1 ( t ) d t , d x 2 ( t ) d t , , d x n ( t ) d t T is the first order derivative state vector;
  • f = ( f 1 , f 2 , , f n ) T , f : n × + n is the vector field which defines the dynamical evolution of the system; + means that the time t is positive.
Because of the complexity of their behavior [17] and of the computational measurements, continuous dynamic systems are usually studied by computer so that the systems of differential equations are transformed into systems of equations with finite differences. Under these circumstances, it becomes important to choose the method of integration used for solving systems of differential equations and the precision with which numbers are represented on a computer for faithful playback as real continuous dynamic system behavior. This also stands for practical implementation by using FPGA [18].
Here, two systems designed by Lorenz and Rössler come to mind. Various investigations were performed by using chaotic behavior, and in this paper, a new method is proposed.

2.1. Lorenz System

The Lorenz system, see [19], is a three-dimensional system defined by
x ˙ = σ ( y x ) y ˙ = x ( ρ z ) y z ˙ = x y β z
where ( x , y , z ) 3 are the state variables which characterize the system evolution, and σ , ρ , β are the system parameters.
This system of differential equations is due to a U.S. meteorologist, Edward Lorenz, who, in 1963, made a simple mathematical model of changes in temperature and wind speed using three nonlinear differential equations. Surprisingly, the results of computer simulations showed a complex behavior of this system. The behavior is described by some relatively simple equations, showing the system dependence on initial conditions. This is because a small change in initial conditions leads to completely different results. The study of this system showed that these solutions could always be found in the same region of phase space (determined by the size x ( t ) , y ( t ) , z ( t ) ) and evolved around a structure called a strange attractor fractal. Thus, the attractor of the system (2) parameters σ = 10 , ρ = 28 , β = 8/3 is present in Figure 1.
The Lorenz system can be analyzed in multiple ways. The statistical investigations [20] on such a system have to take into consideration the proper implementation.
Chaotic systems are special cases of dynamical systems characterized by the existence of strange attractor-type trajectories [21]. This path is not the only defining feature of the system, but it is chaotic. Their evolutionary complexity of the task makes it difficult to provide a comprehensive definition of the chaotic system.
One can say that a dynamic system is called chaotic if solutions are found in a permanently bordered area B n of the phase space and have the following fundamental characteristics:
  • Fourier transform (power spectrum) of any of the state variables is similar to white noise. This property indicates the appearance of a non-periodic chaotic trajectory [22].
  • Trajectories which are initially very close to each other diverge exponentially over time. This feature translates into a high sensitivity to initial conditions [23] and also implies the impossibility of predicting the long-term evolution of chaotic systems.
  • Solutions of deterministic chaotic systems are generated by precise mathematical laws. This implies that chaotic systems can be reproduced [24], even if their evolution cannot be completely predicted.

2.2. Rössler System

The Rössler system (3), [25]:
x ˙ = y z y ˙ = x + a y z ˙ = b + z ( x c )
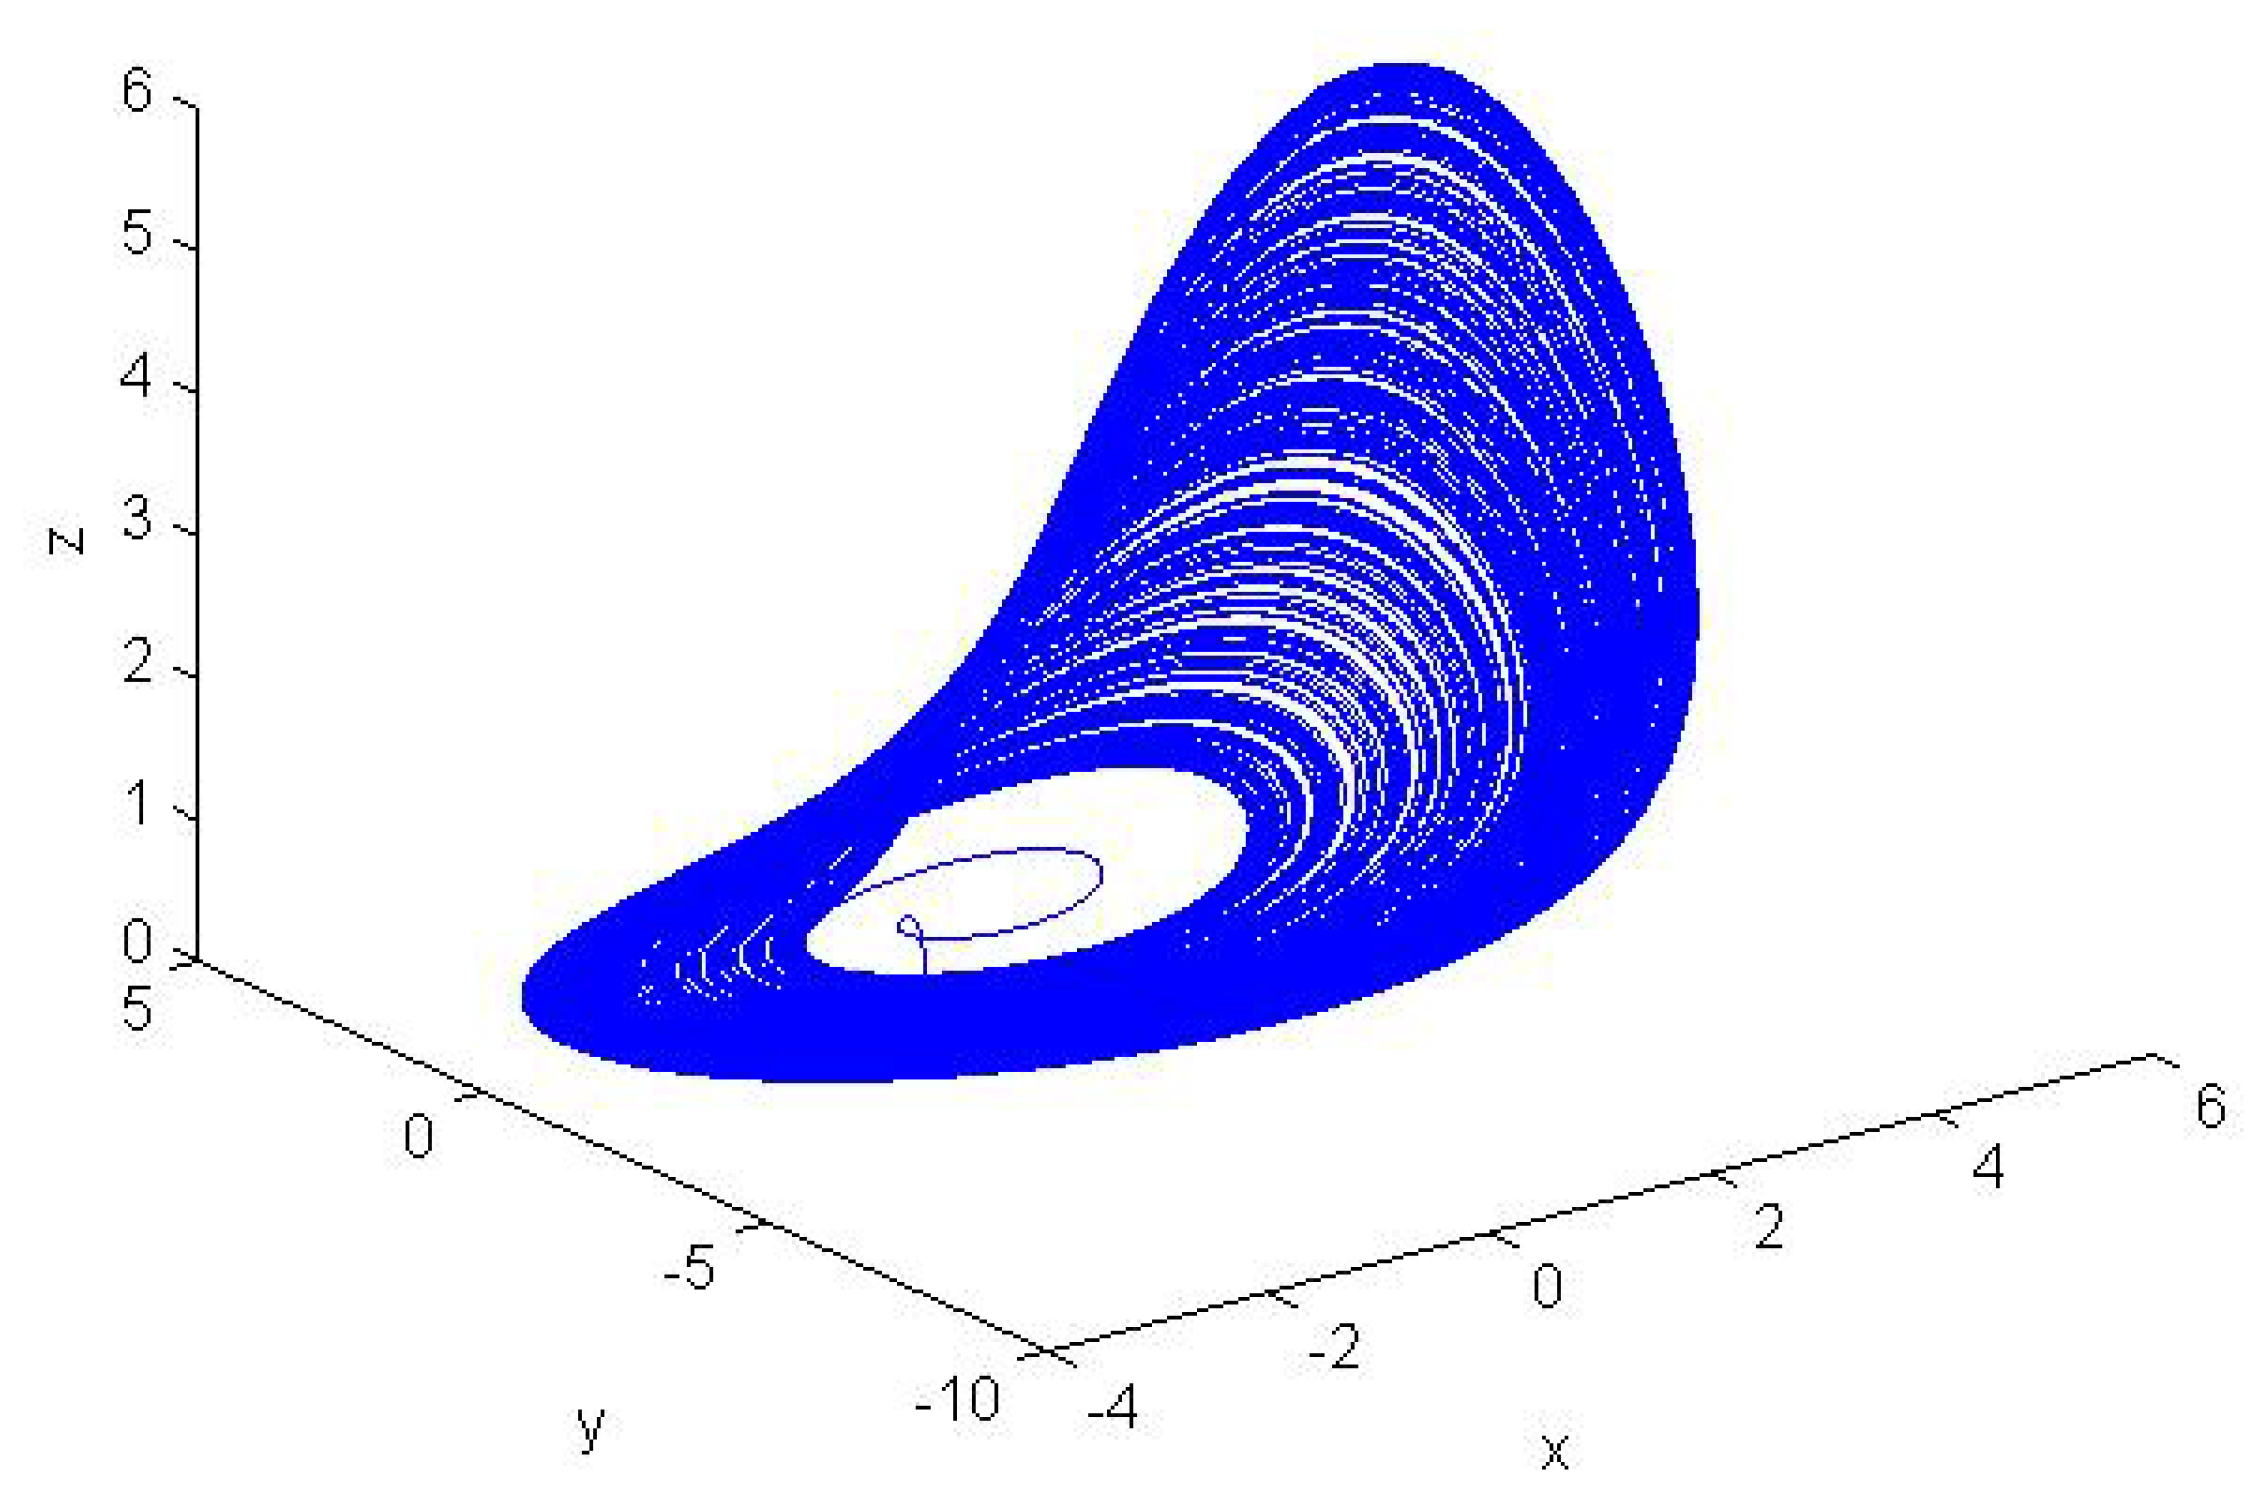
For the Rössler system, the attractor, for parameters a = 0.398 , b = 2 and c = 4 , is given in Figure 2:
The Rössler attractor seems to be designed in connection with the Lorenz system by creating quite similar trajectories. The quality of (3) is easier to evaluate, and in Section 4, by computing expressions (12) and (13), the value for the quality observability index (q.o.i.) is obtained. By analyzing the topology of this system, the singularity will be quite simple and easy to avoid. The attractor has only one manifold and is similar to the Lorenz attractor. The equations found by Otto Rössler are useful to describe the modeling equilibrium in chemical reactions. This reveals the interdisciplinarity of the dynamical systems domain.

3. Quality Observability Index

The index is designed by using the definitions of observability and the singularity [26]. The discrete case of dynamical systems is easier to compute; see [27].
To give the definition of the quality observability index (q.o.i.), one will consider a trajectory of a state variable as in Figure 3.
S O ¯ is the singularity manifold [28], v N is the normal speed, v t a n is the tangent speed at S O ¯ and v is the global speed of the trajectory. The trajectory is on the singularity manifold S O ¯ between the two points • (I and E), where the speed corresponding to each of them is represented. For any point of the considered trajectory contained on the singularity manifold, the global speed v is v t a n and the normal speed v N is 0 (i.e., the exemplification for point I in Figure 3), except the “exit” point from S O ¯ (i.e., for the point E in Figure 3, where E is in the vicinity of the singularity manifold).
Remark 1.
The algorithm which computes v N and v takes into consideration the idea of clusters on the state trajectory; the goal is to take into account only one time v N for each crossway sequence. For example, in Figure 3, v will be taken as equal to v N = 0 , which is the value of v in the middle of the [ I E ] segment.
The quality observability index (q.o.i.) is defined as
r = 1 q · r 0 r 0 = m i n i = 1 m v N ( i ) ( m + 1 ) E { v A } + 1 m + 1 , 1
where r 0 ; 1 is the q.o.i.; q is called a no-intersection coefficient; and m denotes the number of clusters resulted from the intersection between the whole attractor A and the singularity manifold S O ¯ . The variable i means that v N is computed once on each cluster, and when m 1 results:
r 0 m i n E { v N } E { v A } , 1
In (4), E { v N } is the expectation of v N (considering all the tangent speeds at the singularity manifold), and E { v A } is the expectation for the speed of the whole attractor A . Through the definition of q.o.i., one can find that situations where r 0 = 1 the quality cannot be higher than q value. The size r 0 was defined by using the symbol m i n because its aim was to give a correction to q. The correction is given only when the trajectory leaves S O ¯ slowly. When v S O ¯ , then E { v N } 0 . Finally r will give information about the impact of the singularity observability manifold [29] on the quality of the observability.
The most convenient situation is when r = 0 (no influence of S O ¯ on A , maximum quality), and this happens when q = 1 . The coefficient q equal to 1 corresponds to the fact that there are no intersections between the strange attractor A and the singularity manifold S O ¯ . This means that m = 0 (there are no clusters) and v N = 0 . The worst situation is when r = 1 (the observability is damaged by the influence of S O ¯ on A , lowest quality), and this can happen if q = 0 (the intersection is huge). At the same time, v S O ¯ or v is tangent to S O ¯ .
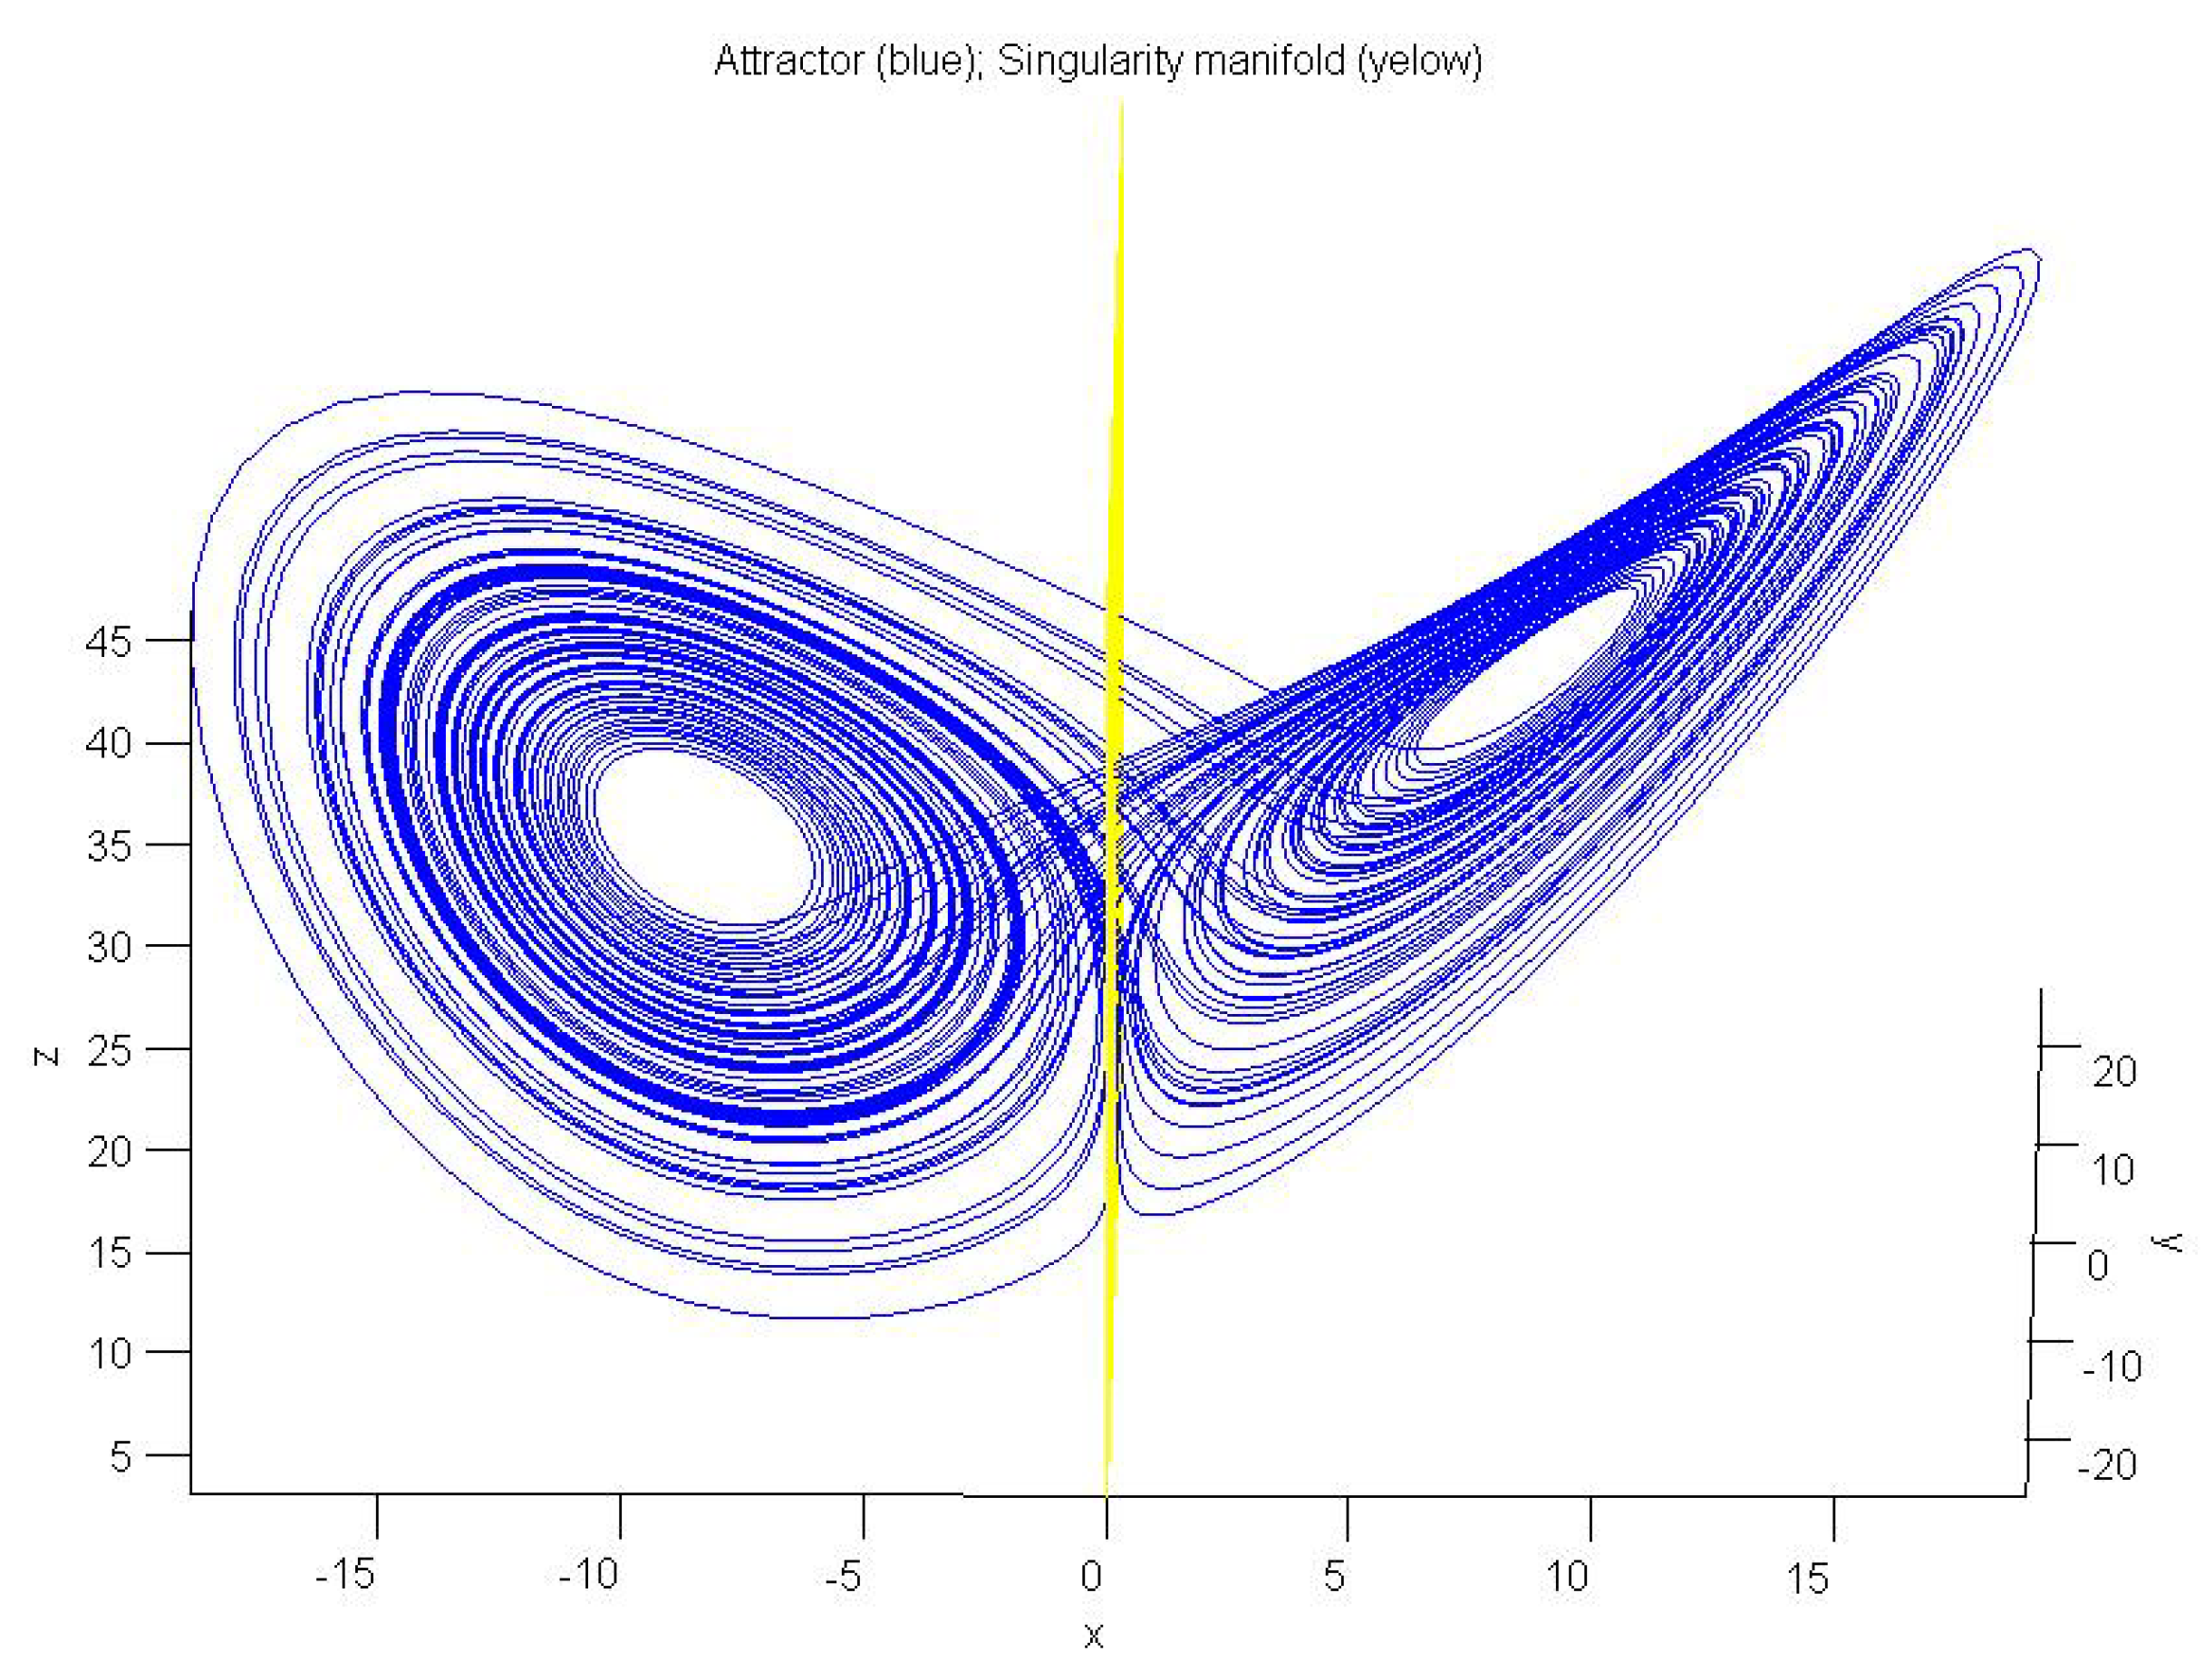
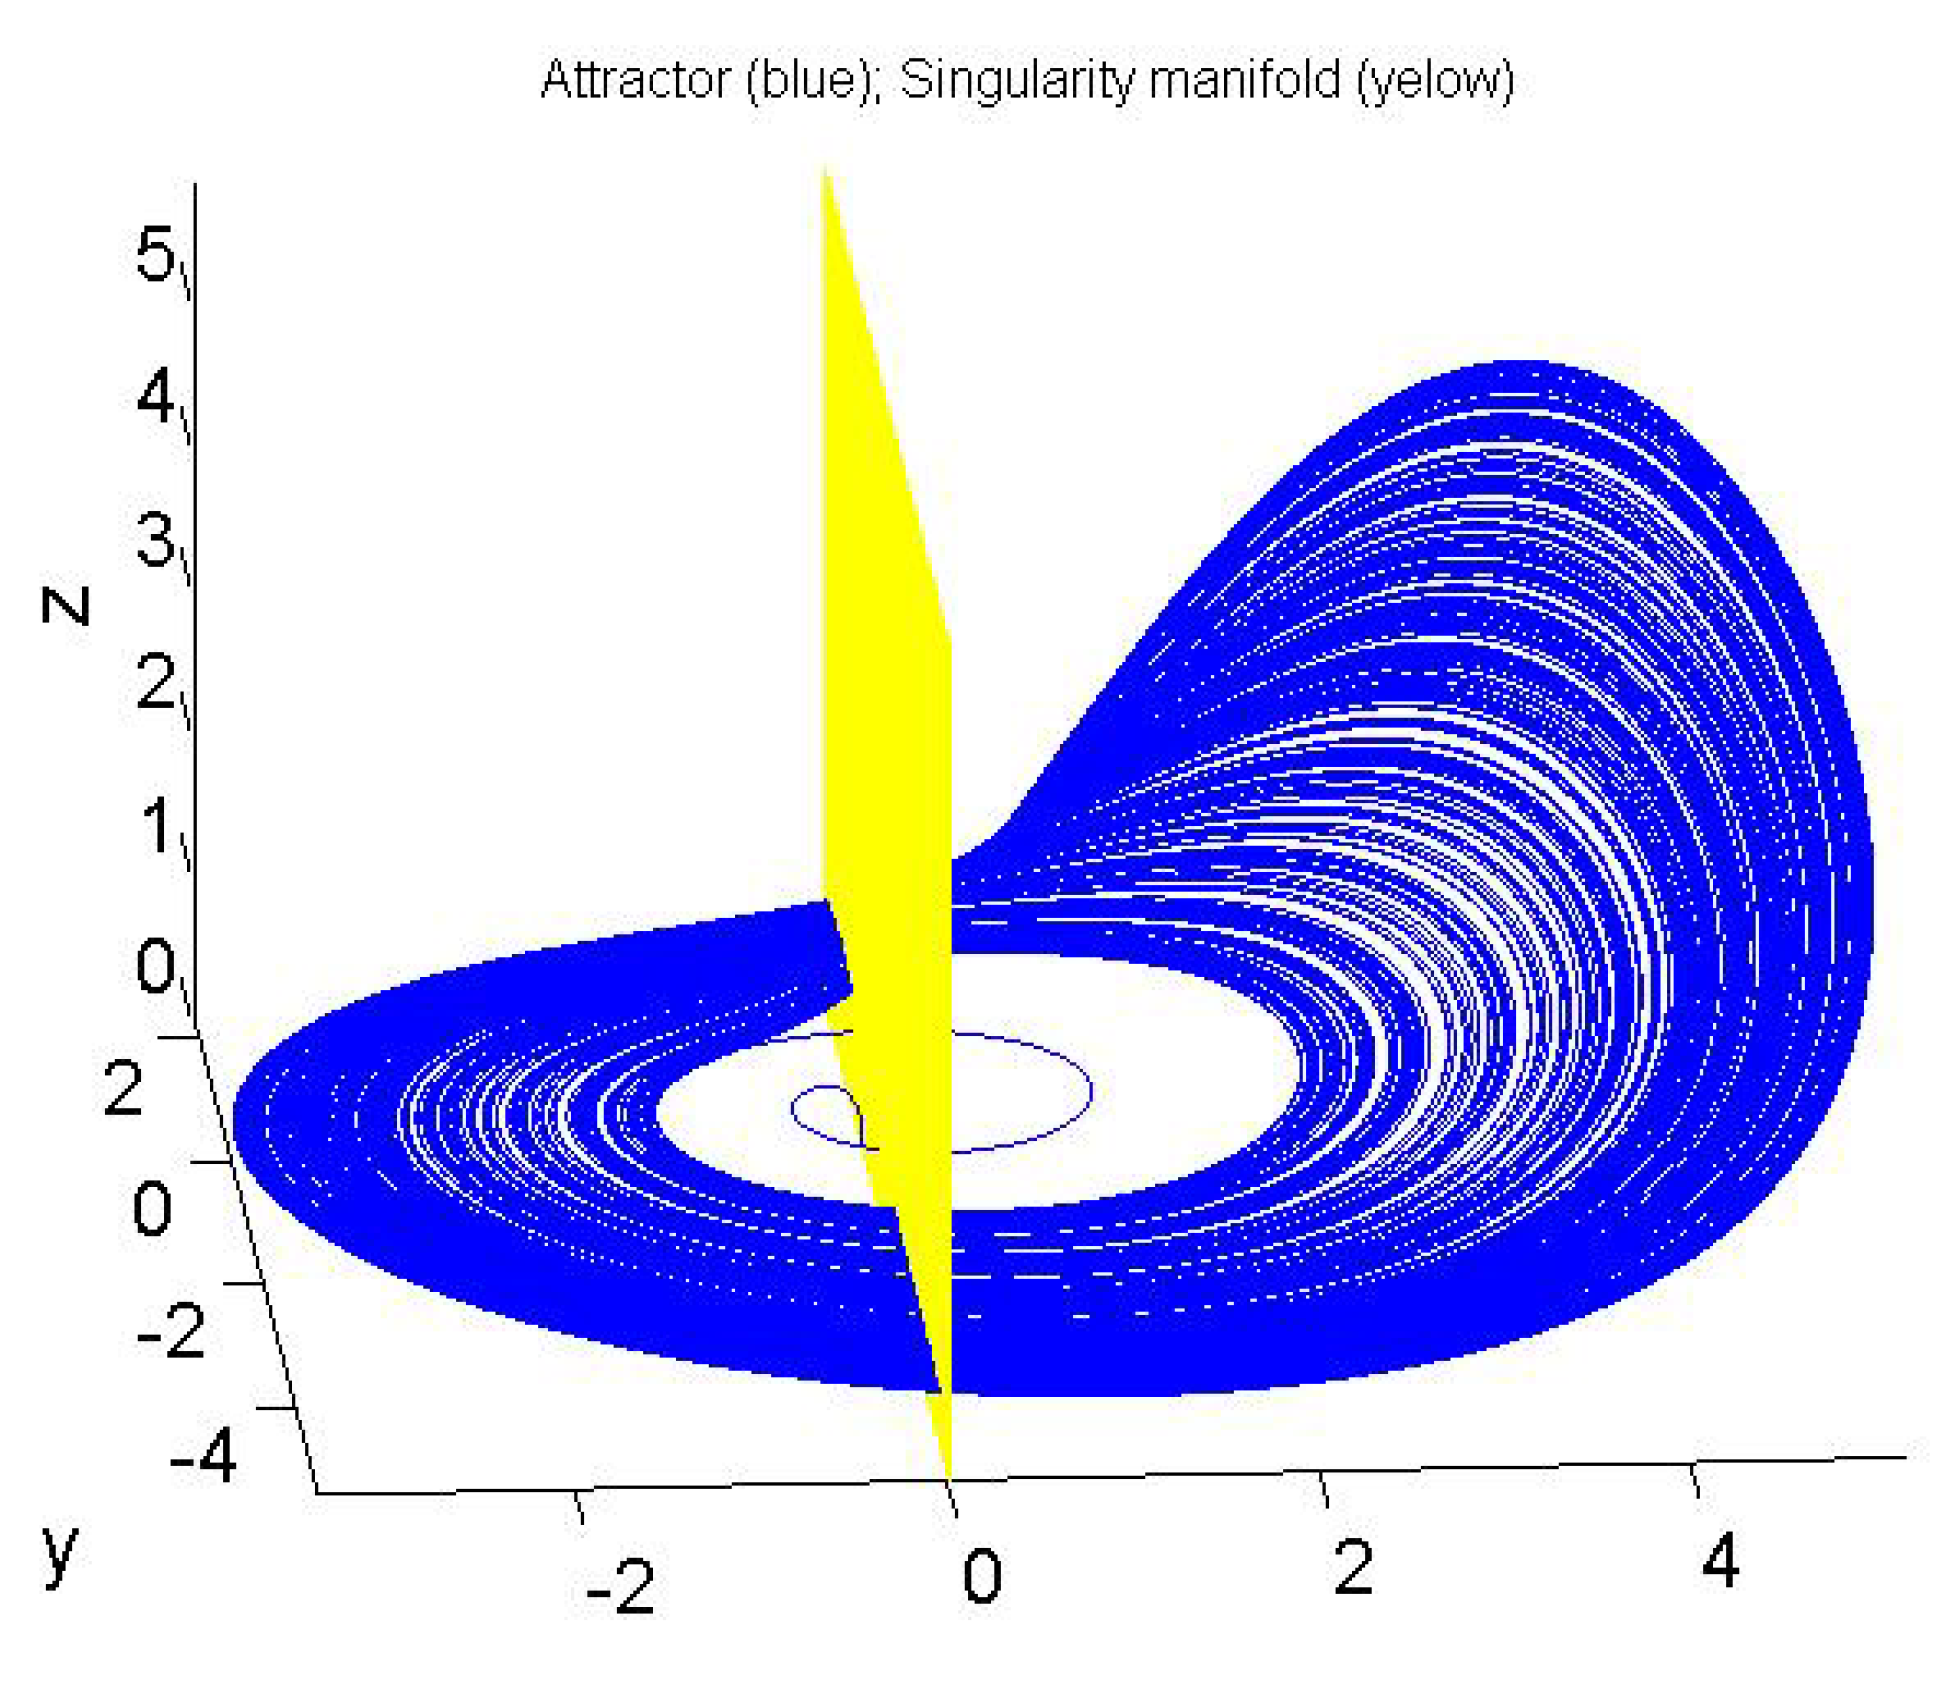
In this case, for the system (2) with the parameters σ = 10 , β = 8 / 3 and ρ = 28 , considering x as output, the singularity manifold resulted is
S O ¯ , x = ( x , y , z ) 3 | Δ x = 0 S O ¯ , x = ( x , y , z ) 3 | σ 2 x = 0
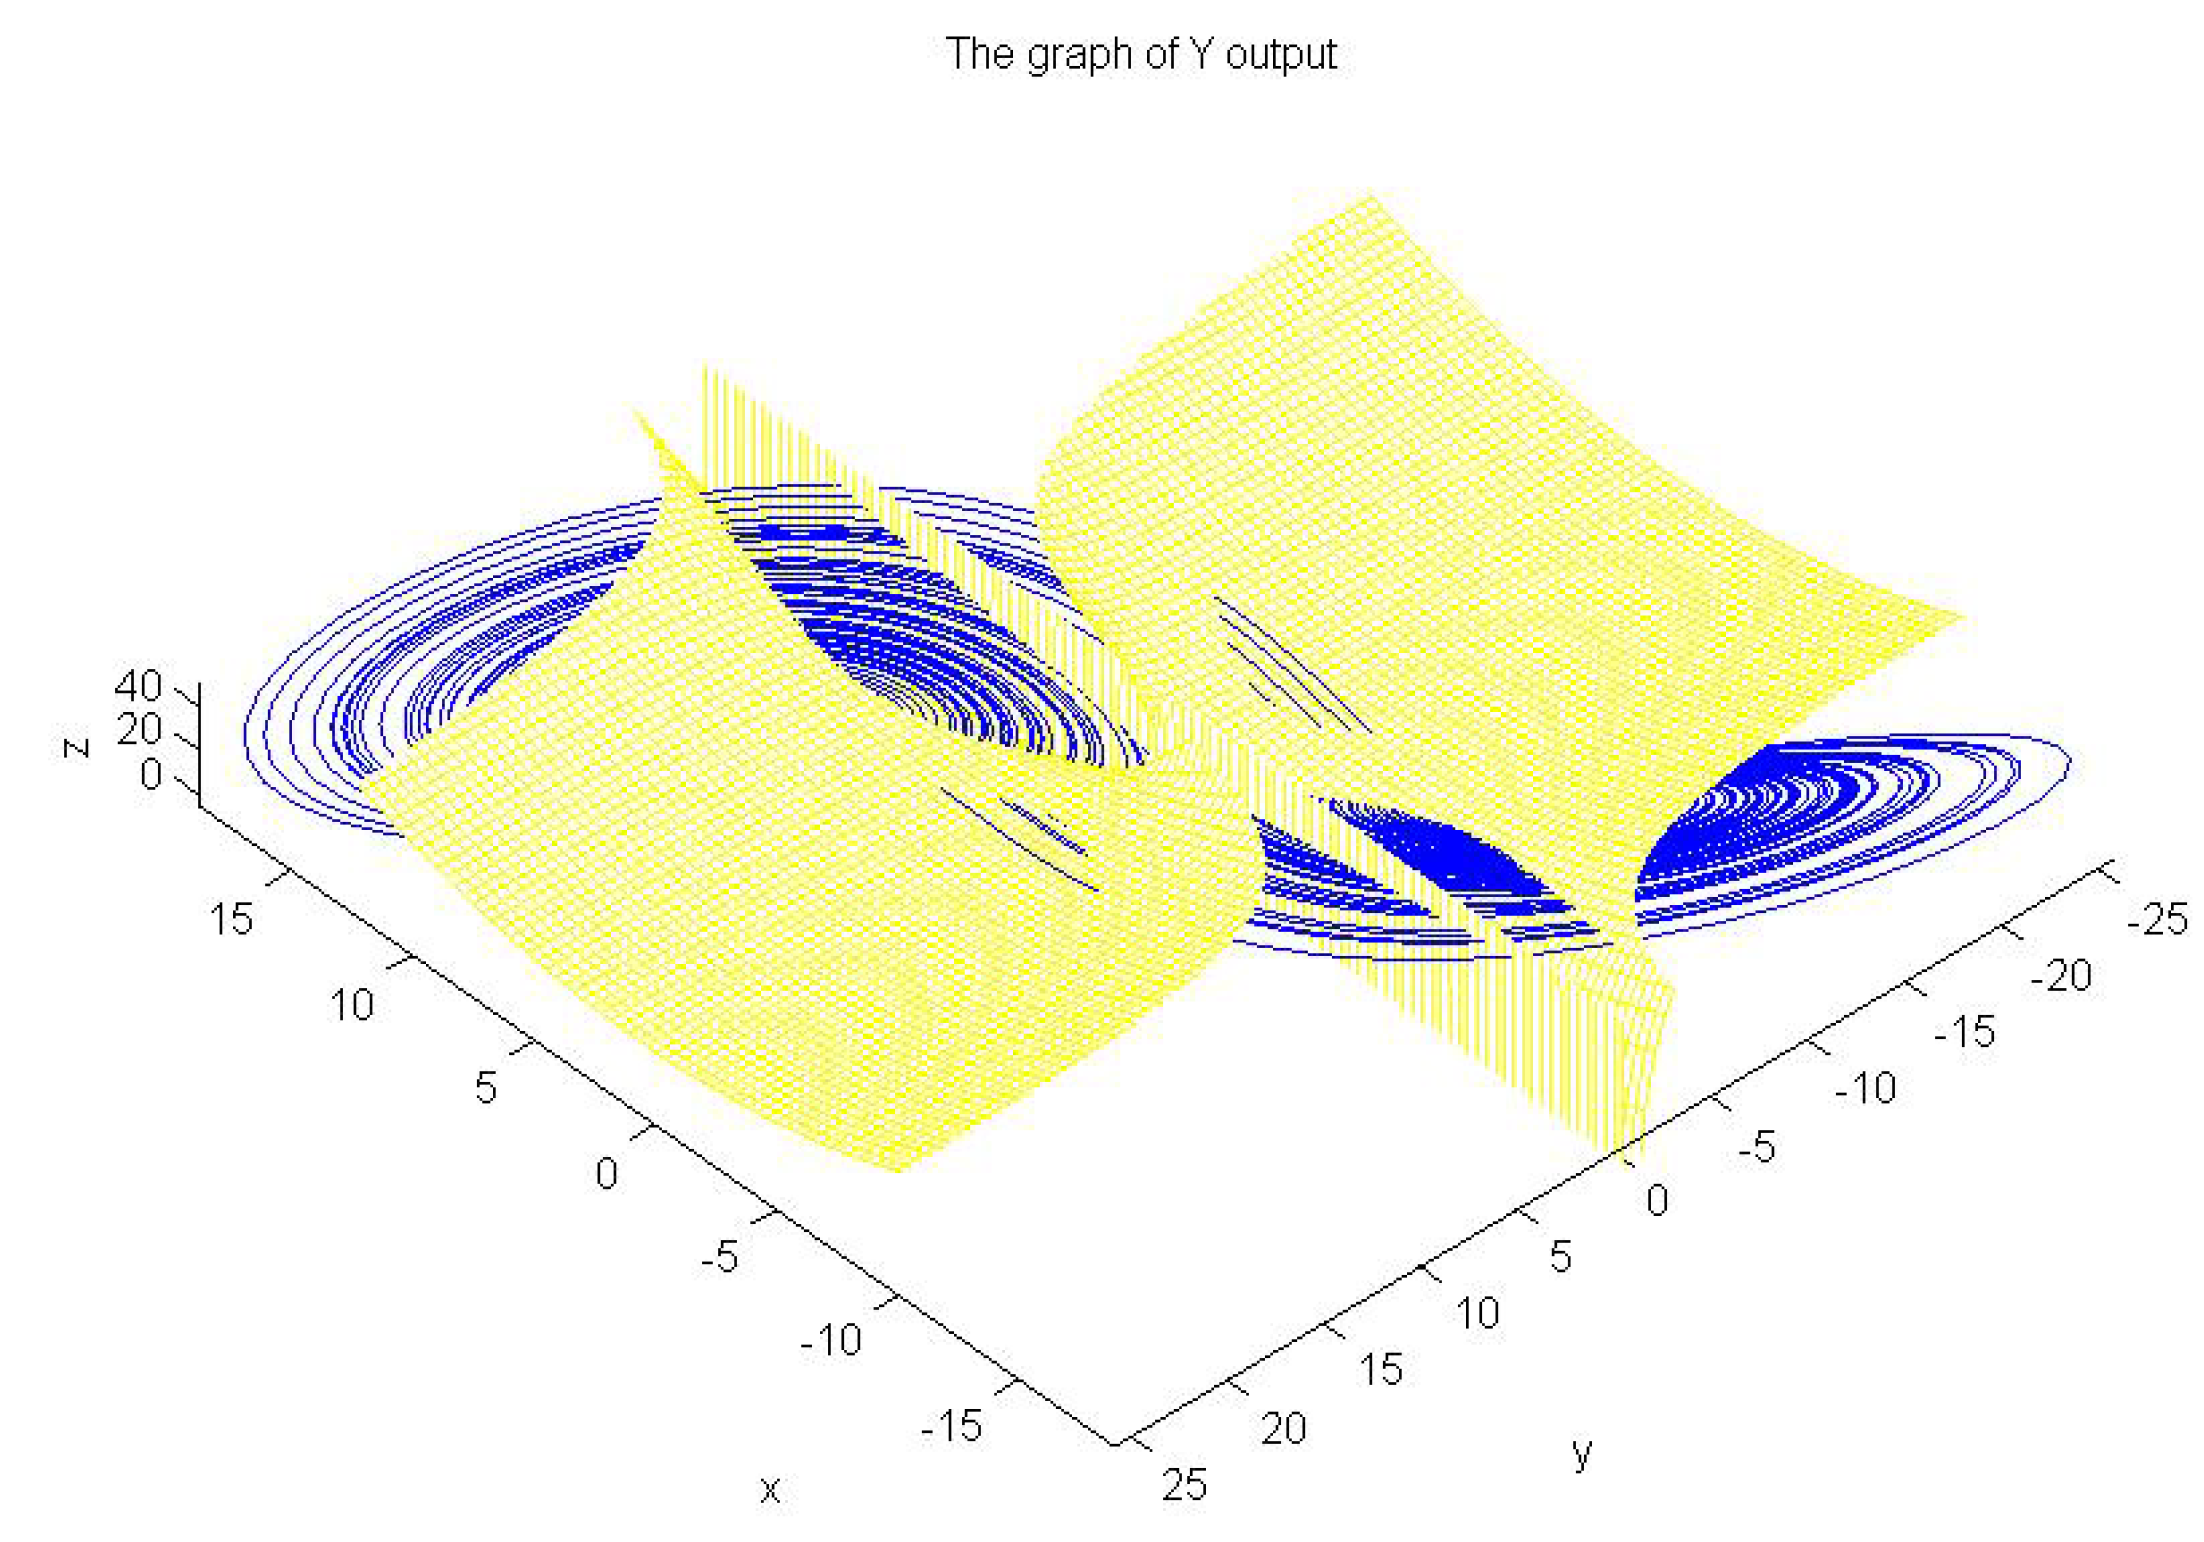
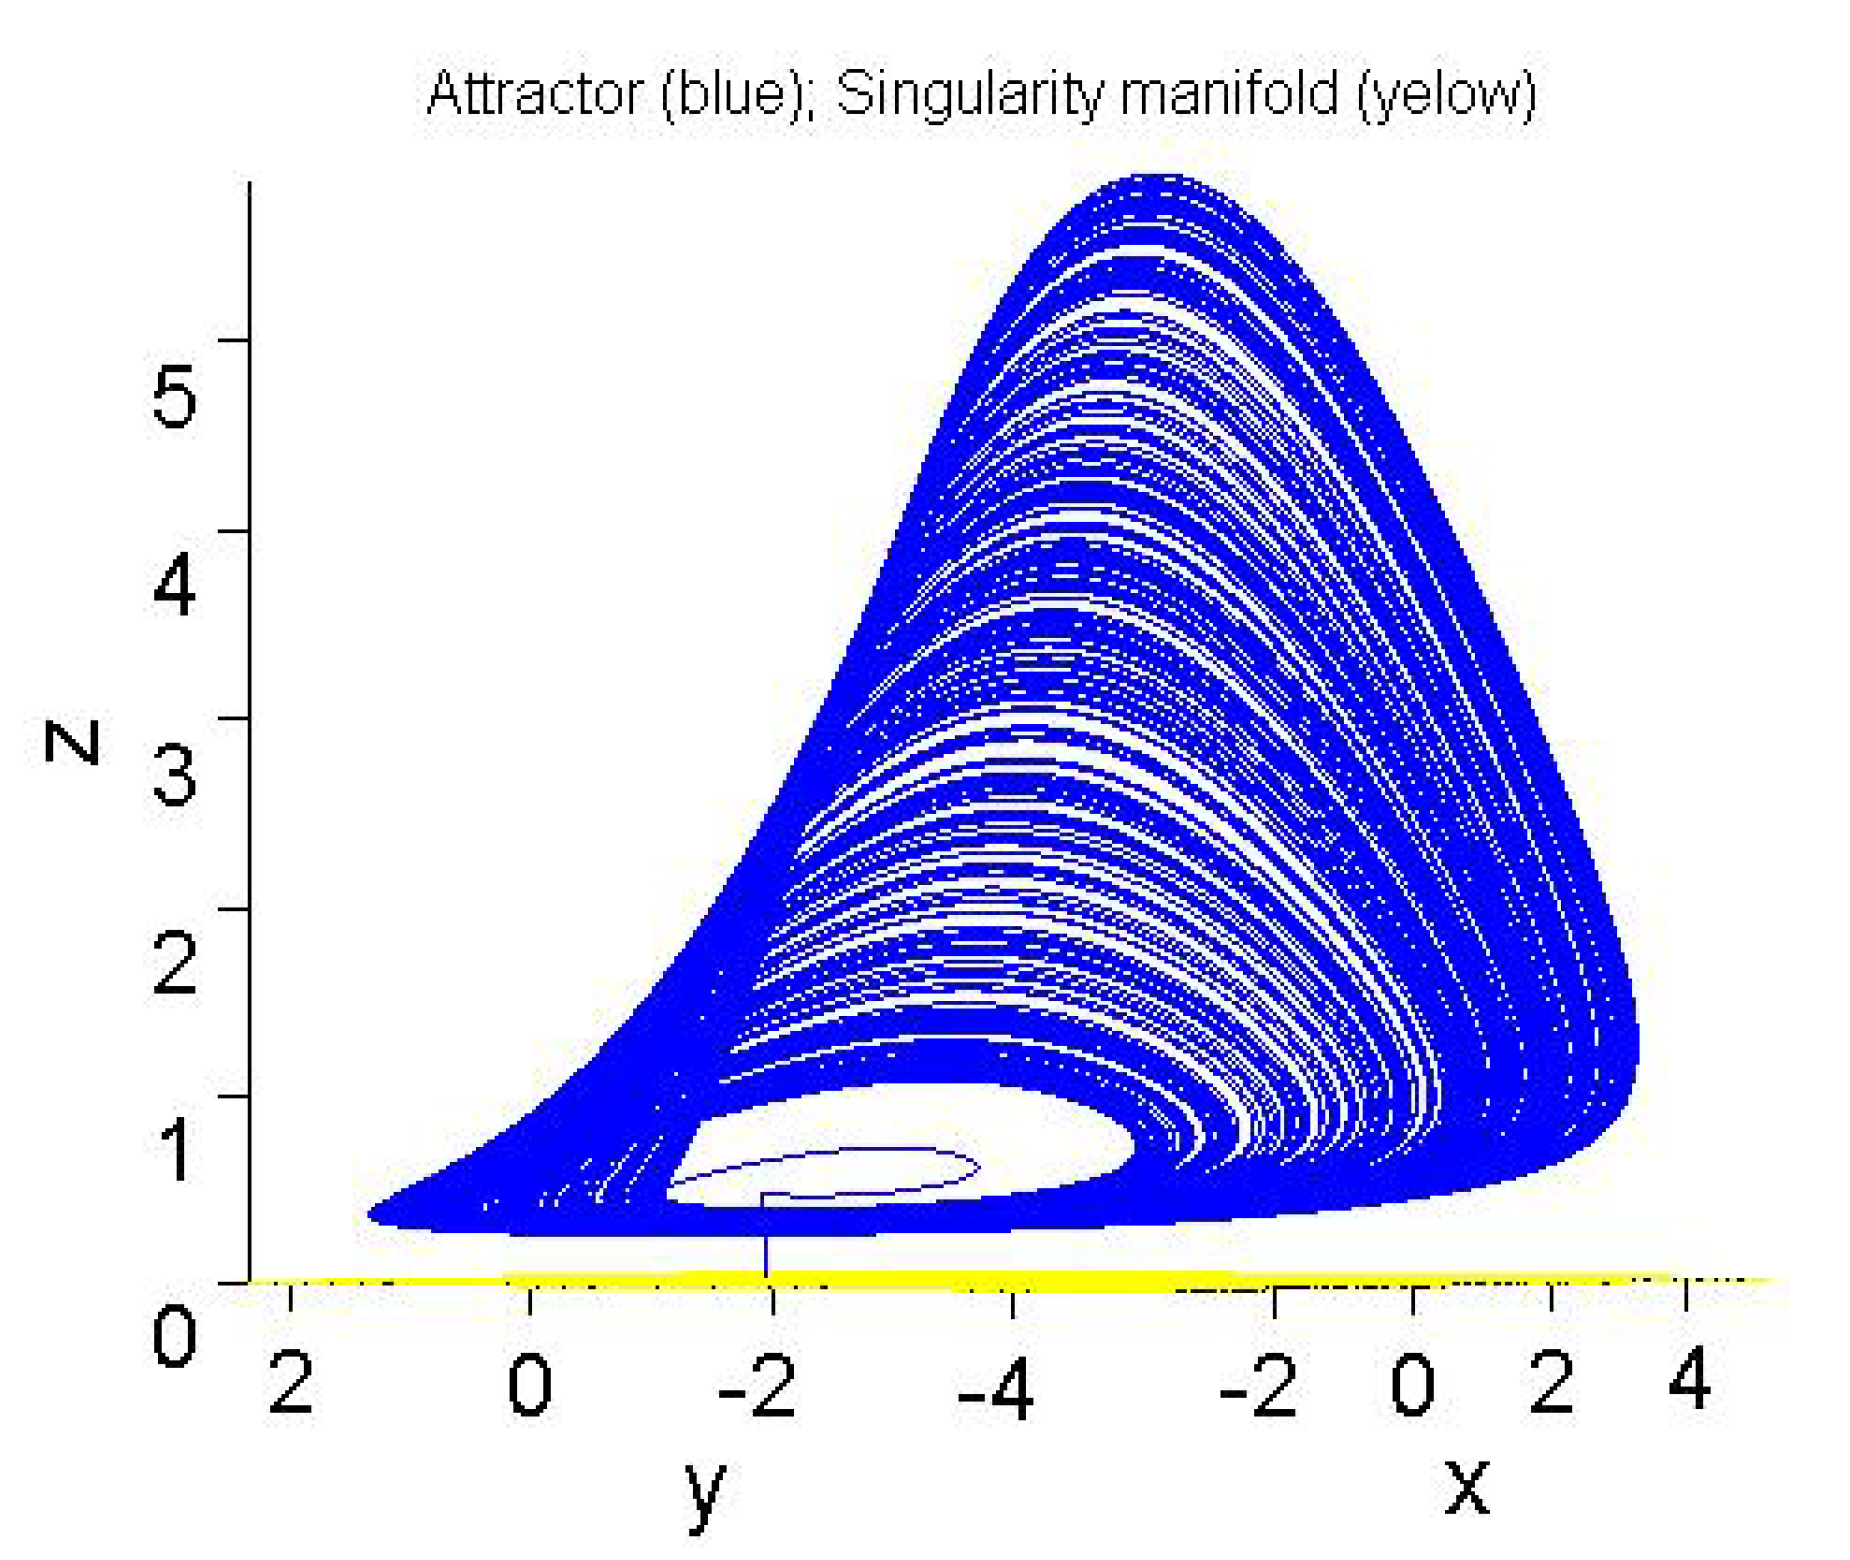
If y is selected as the output, S O ¯ is given by
S O ¯ , y = ( x , y , z ) 3 | Δ y = 0 S O ¯ , y = ( x , y , z ) 3 | z = ρ ρ β x σ y + 2 x 2 σ
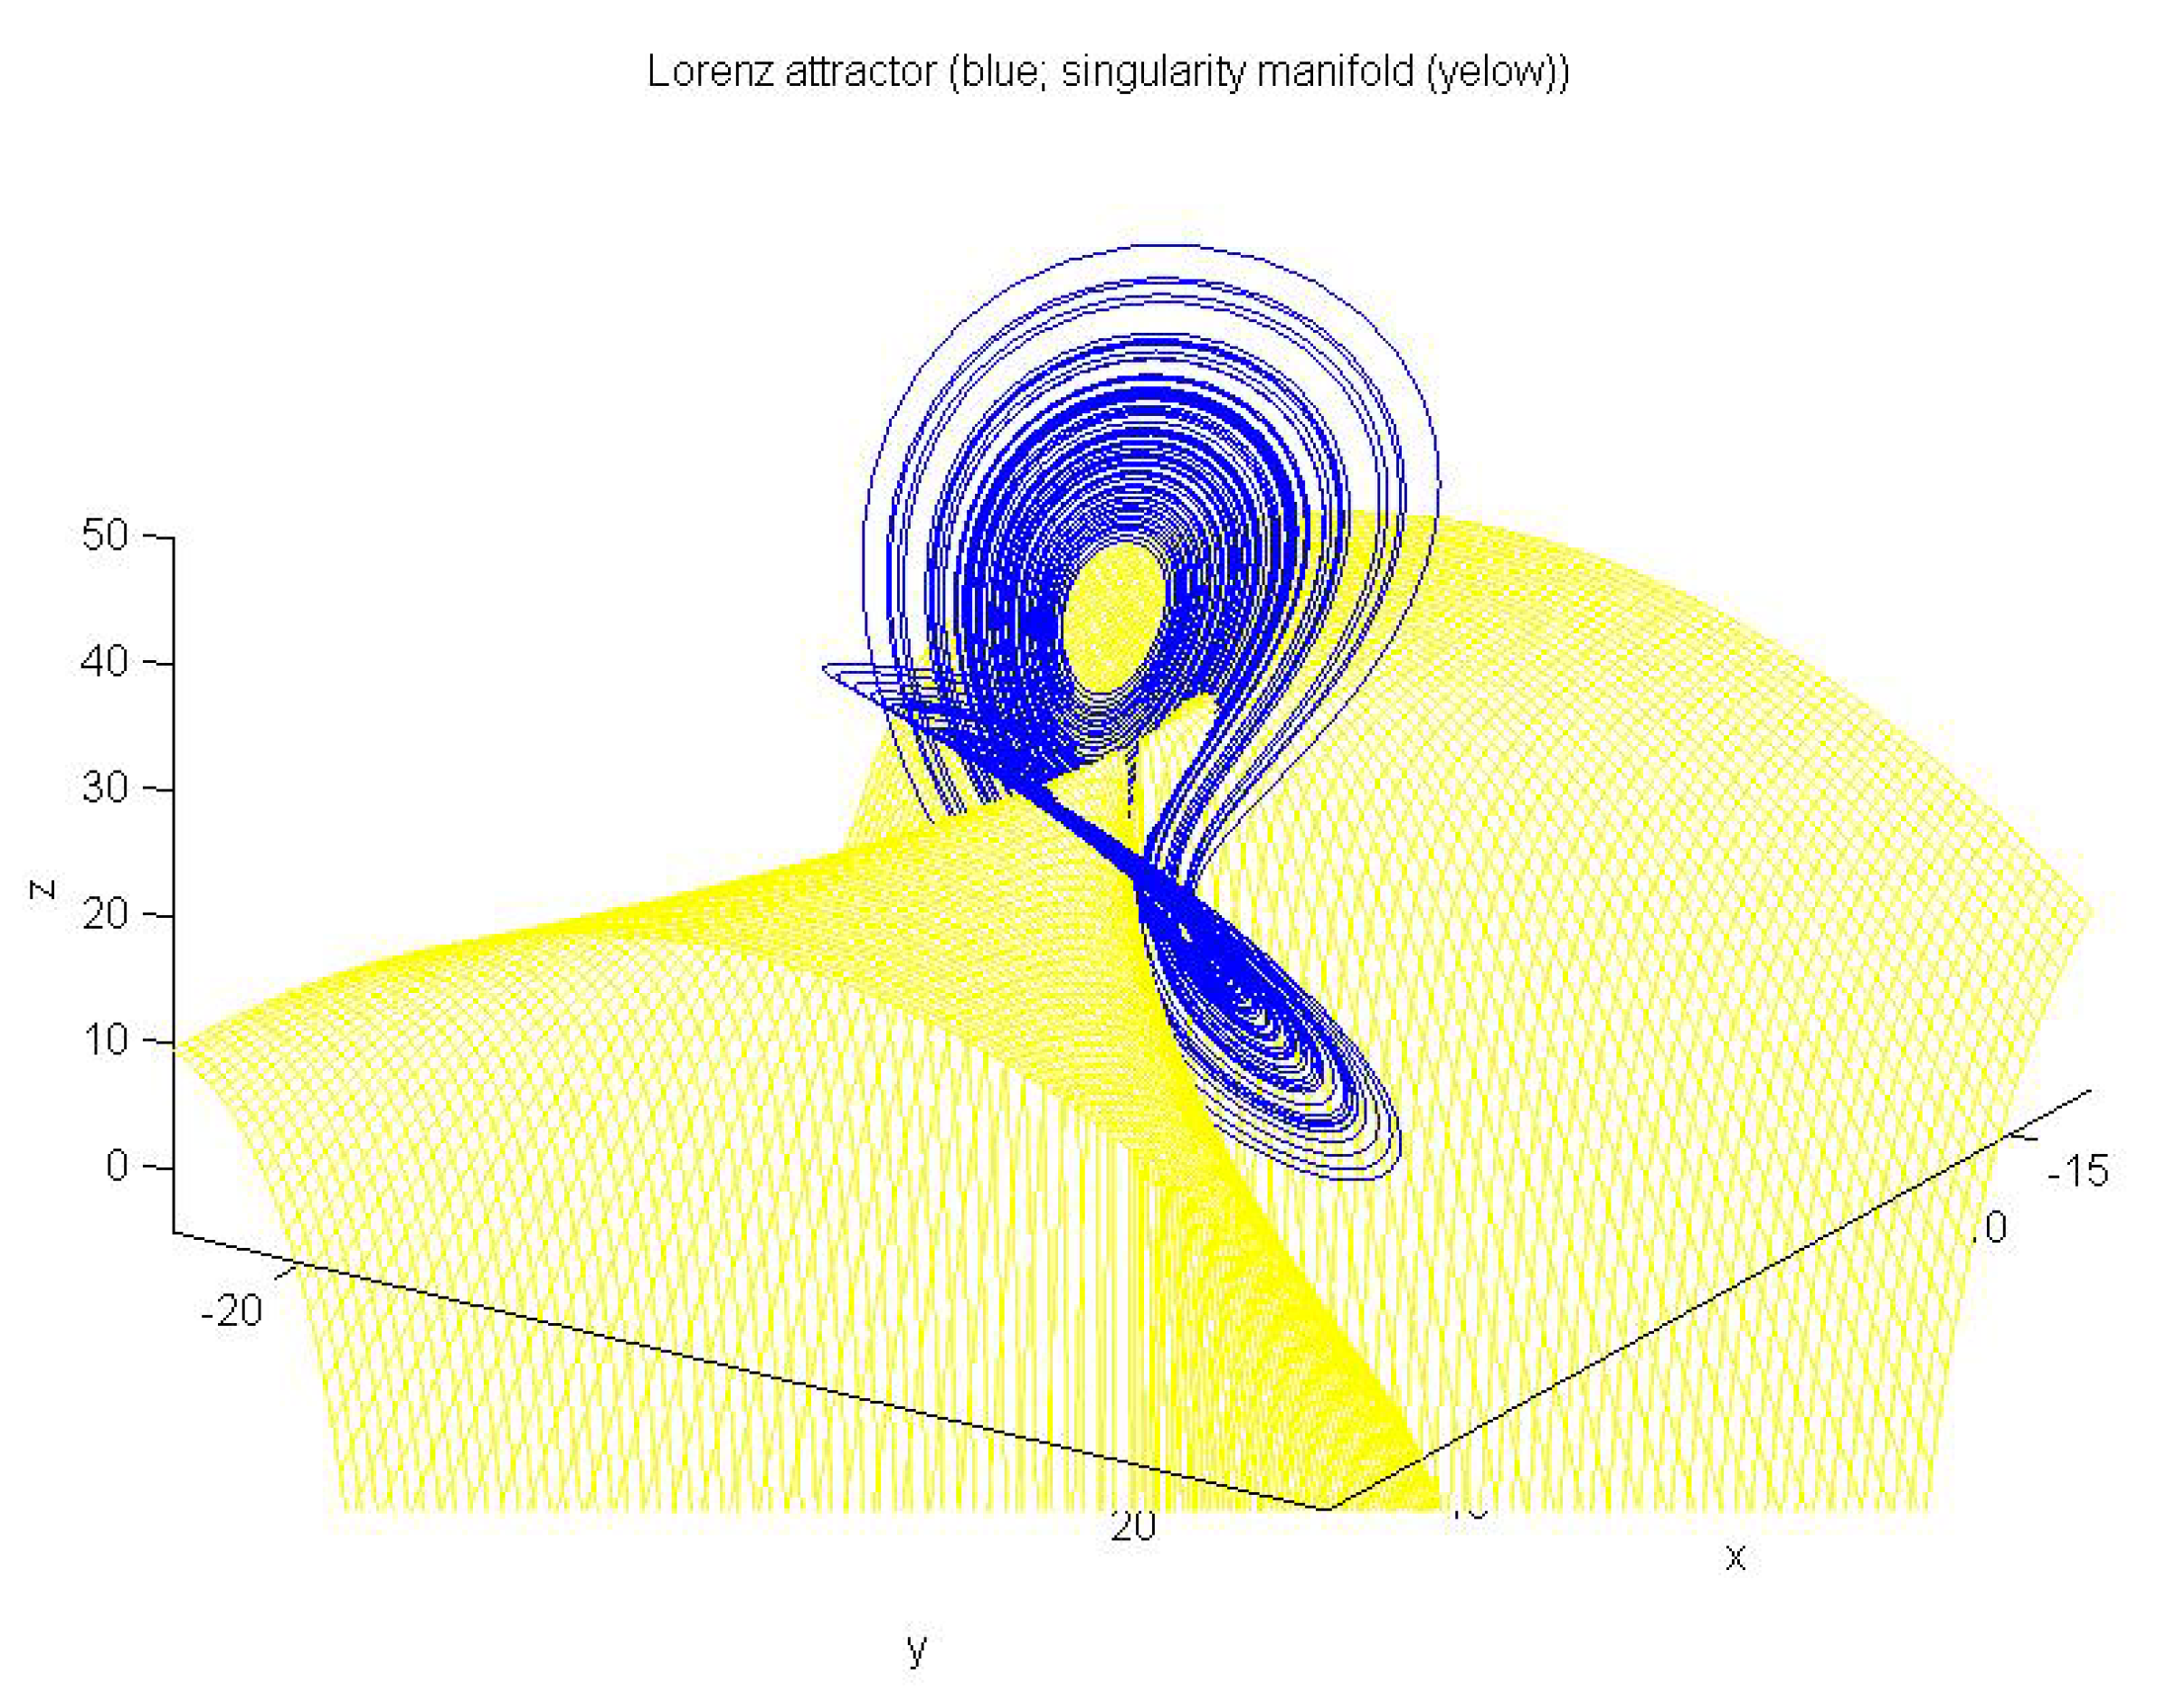
If z is selected as the output, S O ¯ is given by
S O ¯ , z = ( x , y , z ) 3 | Δ z = 0 S O ¯ , z = ( x , y , z ) 3 | z = ρ σ y x 2
By applying the same algorithm for (3), see [27], with parameters a = 0.398 , b = 2 and c = 4 , and considering x as the output, the resulted singularity manifold is
S O ¯ , x = { ( x , y , z ) 3 | Δ x = 0 } S O ¯ , x = { ( x , y , z ) 3 | x = a + c }
If z is selected as the output, S O ¯ is given by
S O ¯ , z = { ( x , y , z ) 3 | Δ z = 0 } S O ¯ , z = { ( x , y , z ) 3 | z = 0 }

4. Experiments and Results

In order to evaluate the systems recalled in Section 2, some graphical computations are given here. First, the graphical interpretation for the Lorenz system is given in Figure 4 for x as the output, in Figure 5 for y and in Figure 6 for z as the output.
The graphical interpretation for the Rössler system is given in Figure 7 for x as the output; if z is selected as the output, the results are presented in Figure 8. If y is selected as the output, the singularity manifold S O ¯ does not exist.
One can find that the singularity is very easy to observe in the case of the Rössler attractor against Lorenz. Some numerical results will confirm this visual interpretation. The index introduced here is a new interpretation in terms of measuring the quality of the attractors. Additionally, the quality of such a system is influenced by choosing the proper integration method; see [30,31].
For the Rössler system, the q.o.i. is computed without quantifying the intersection coefficient q. The definition for r 0 is
r 0 = 1 v N v
In this case, an evaluation for r 0 is given for x:
r 0 , x = 1 y z ( a 2 + 2 a + 2 ) y 2 + ( a 2 + 1 ) z 2 + 2 y z + 2 ( a + 1 ) c y + 2 a b z + b 2 + c 2
For y, a singularity manifold is not present. For z, the analytic result is
r 0 , z = 1 b x 2 + 2 a x y + ( a 2 + 1 y 2 + b 2 )
Expressions (12) and (13) were obtained only for the Rössler system because of its simplicity in terms of evaluating the singularity manifold.
The quantification of the no-intersection coefficient q is performed by choosing each of the dynamics of system (1) as the output. An observability matrix O can be constructed, and a singularity manifold S O ¯ is computed.
The quantification proposed for the intersection coefficient q takes into consideration the ideas of quantization noise [32], noise on the communication channel [33] or other types [34] of perturbation (also the fact that, in the singularity vicinity, the inversion problemwas not well conditioned). An error of 10 % around the singularity manifold was taken into consideration.
An interpretation for the probability distribution function Δ x is given in [4]. The information is useful in order to compute the following numerical results. The interval defined around the values Δ x = 0 will help to obtain the results for q. This interval is defined considering Δ x = 0 as a center a width equal to 10 % from the total interval where x takes values, noted with d where d = m a x ( x ) m i n ( x ) . Following the same idea, the meanings are the same for z in order to calculate the q.o.i.; the q values for the three outputs are given in Table 1.
The values for the q.o.i. considering each state variable as output in both the Lorenz system and the Rössler system are given in Table 2. Table 2 was computed for the parameter sets: σ = 10 , β = 8 / 3 , ρ = 28 (Lorenz system) and a = 0.398 , b = 2 , c = 4 (Rössler system).
In Table 2, the quality observability index r with a percent noise equal to 5 % gives the best measured output y, followed by x and z, but if noise was considered to 10 % , the order is changed into x, y and z. This highlighted the importance of also considering the noise when choosing the output measurement placement.
The significance of the minimum and the maximum value for the used parameters is given in Table 3. The parameters taken into consideration are the observability coefficient/index η (see [26]), q.o.i. and intersection coefficient q. Roughly speaking, “1” is for “yes” and “0” is for “no”.
A homogenization of notations is presented in Table 3.
In order to confirm the results presented, some Monte Carlo analyses were performed. The tests were conducted by changing the parameters of the systems. The statistical investigations [35] are in line with the tables presented here. The results and the approach presented were designed only for 3D dynamical systems.

5. Conclusions

Observability and singularity for the dynamical system can help to choose the proper system in applications. The most difficult procedure is to decide how these notions can be applied as a procedure in having the desired behavior. Nowadays, the computational precision is well described, and the singularity observability manifold can be predicted. As a result, this paper gives an exact index in order to describe the designed project in a proper way.
Moreover, the dynamical analysis are performed before implementing a system in cryptography, and the quality observability index will serve to decide which state variable can be used to carry out a message. If a random number generator uses chaotic behavior, a well-described singularity manifold can help to obtain a set of numbers which can be reproduced through a system reversal operation.
Therefore, this paper looks to characterize the computational implementation of dynamic systems in a way that leaves them completely defined. It is important that they are completely designed because the complexity of the operations that make up the systems generates many types of errors. These errors make systems impossible to replicate and sometimes make it impossible to synchronize or reconstruct them in applications. The q.o.i. offers a quantitative measure. This can be used to avoid the singularity manifolds in applications. This is important because it eliminates errors of any kind.

Funding

This research received no external funding.

Data Availability Statement

Not applicable.

Conflicts of Interest

Not applicable.

References

  1. Heffernan, D.M.; Jenkins, P.; Daly, M.; Hawdon, B.; O’Gorman, J. Characterization of chaos. Int. J. Theor. Phys. 1992, 31, 1345–1362. [Google Scholar] [CrossRef]
  2. Gonzalez, C.E.; Lainscsek, C.; Sejnowski, T.J.; Letellier, C. Assessing observability of chaotic systems using delay differential analysis. Chaos Interdiscip. J. Nonlinear Sci. 2020, 30, 103113. [Google Scholar] [CrossRef] [PubMed]
  3. Letellier, C.; Barbot, J.P. Optimal flatness placement of sensors and actuators for controlling chaotic systems. Chaos Interdiscip. J. Nonlinear Sci. 2021, 31, 103114. [Google Scholar]
  4. Frunzete, M.; Barbot, J.P.; Letellier, C. Influence of the singular manifold of nonobservable states in reconstructing chaotic attractors. Phys. Rev. 2012, 86, 026205. [Google Scholar]
  5. Stefanescu, V.; Stoichescu, D.; Frunzete, M.; Florea, B. Influence of computer computation precision in chaos analysis. In Scientific Bulletin-Series A-Applied Mathematics and Physics; University Politehnica of Bucharest: Bucharest, Romania, 2013; Volume 75, pp. 151–162. [Google Scholar]
  6. Shukla, P.K.; Khare, A.; Rizvi, M.A.; Stalin, S.; Kumar, S. Applied cryptography using chaos function for fast digital logic-based systems in ubiquitous computing. Entropy 2015, 17, 1387–1410. [Google Scholar]
  7. Suomalainen, J.; Kotelba, A.; Kreku, J.; Lehtonen, S. Evaluating the efficiency of physical and cryptographic security solutions for quantum immune IoT. Cryptography 2018, 2, 5. [Google Scholar] [CrossRef] [Green Version]
  8. Butt, K.K.; Li, G.; Masood, F.; Khan, S. A digital image confidentiality scheme based on pseudo-quantum chaos and lucas sequence. Entropy 2020, 22, 1276. [Google Scholar] [CrossRef]
  9. Vlad, A.; Luca, A.; Frunzete, M. Computational measurements of the transient time and of the sampling distance that enables statistical independence in the logistic map. In Proceedings of the International Conference on Computational Science and Its Applications, Yongin, Korea, 29 June–2 July 2009; Springer: Berlin/Heidelberg, Germany, 2009; pp. 703–718. [Google Scholar]
  10. Alves, P.; Duarte, L.; da Mota, L. A new characterization of chaos from a time series. Chaos Solitons Fractals 2017, 104, 323–326. [Google Scholar]
  11. Ruelle, D.; Takens, F. On the nature of turbulence. In Les Rencontres Physiciens-Mathématiciens de Strasbourg-RCP25; Université Louis Pasteur: Strasbourg, France, 1971; Volume 12, pp. 1–44. [Google Scholar]
  12. Vladeanu, C.; El Assad, S.; Carlach, J.C.; Quere, R.; Marghescu, I. Optimum PAM-TCM schemes using left-circulate function over GF(2N). In Proceedings of the International Symposium on Signals, Circuits and Systems ISSCS 2009, Iasi, Romania, 9–10 July 2009; pp. 1–4. [Google Scholar]
  13. Perruquetti, W.; Barbot, J.P. Chaos in Automatic Control; CRC Press: Boca Raton, FL, USA; Taylor & Francis Group: Abingdon, UK, 2006. [Google Scholar]
  14. Sofroniou, A.; Bishop, S. Dynamics of a parametrically excited system with two forcing terms. Mathematics 2014, 2, 172–195. [Google Scholar] [CrossRef] [Green Version]
  15. Lee, T.F.; Chang, I.P.; Kung, T.S. Blockchain-based healthcare information preservation using extended chaotic maps for HIPAA privacy/security regulations. Appl. Sci. 2021, 11, 10576. [Google Scholar] [CrossRef]
  16. Boeing, G. Visual analysis of nonlinear dynamical systems: Chaos, fractals, self-similarity and the limits of prediction. Systems 2016, 4, 37. [Google Scholar]
  17. Chanwimalueang, T.; Mandic, D.P. Cosine similarity entropy: Self-correlation-based complexity analysis of dynamical systems. Entropy 2017, 19, 652. [Google Scholar]
  18. Sambas, A.; Vaidyanathan, S.; Bonny, T.; Zhang, S.; Hidayat, Y.; Gundara, G.; Mamat, M. Mathematical model and FPGA realization of a multi-stable chaotic dynamical system with a closed butterfly-like curve of equilibrium points. Appl. Sci. 2021, 11, 788. [Google Scholar] [CrossRef]
  19. Lorenz, E.N. Deterministic Nonperiodic Flow. J. Atmos. Sci. 1963, 20, 130–141. [Google Scholar]
  20. Dinu, A.; Frunzete, M. The Lorenz chaotic system, statistical independence and sampling frequency. In Proceedings of the 2021 International Symposium on Signals, Circuits and Systems (ISSCS), Iasi, Romania, 15–16 July 2021; IEEE: Piscataway, NJ, USA, 2021; pp. 1–4. [Google Scholar]
  21. Berezowski, M.; Lawnik, M. Hidden Attractors in Discrete Dynamical Systems. Entropy 2021, 23, 616. [Google Scholar]
  22. Chen, B.; Cheng, X.; Bao, H.; Chen, M.; Xu, Q. Extreme Multistability and Its Incremental Integral Reconstruction in a Non-Autonomous Memcapacitive Oscillator. Mathematics 2022, 10, 754. [Google Scholar] [CrossRef]
  23. Bao, H.; Ding, R.; Hua, M.; Wu, H.; Chen, B. Initial-condition effects on a two-memristor-based Jerk system. Mathematics 2022, 10, 411. [Google Scholar]
  24. Demir, K.; Ergün, S. An analysis of deterministic chaos as an entropy source for random number generators. Entropy 2018, 20, 957. [Google Scholar] [CrossRef] [Green Version]
  25. Rössler, O.E. An equation for hyperchaos. Phys. Lett. 1979, 71, 155–157. [Google Scholar] [CrossRef]
  26. Letellier, C.; Aguirre, L.A. Interplay between synchronization, observability, and dynamics. Phys. Rev. E 2010, 82, 016204. [Google Scholar] [CrossRef]
  27. Frunzete, M.; Luca, A.; Vlad, A.; Barbot, J.P. Observability and singularity in the context of rössler map. In University Politehnica of Bucharest Scientific Bulletin, Series A: Applied Mathematics and Physics; University Politehnica of Bucharest: Bucharest, Romania, 2012; Volume 74, pp. 83–92. [Google Scholar]
  28. Letellier, C.; Gilmore, R. Covering dynamical systems: Twofold covers. Phys. Rev. 2000, 63, 016206. [Google Scholar]
  29. Aguirre, L.A.; Portes, L.L.; Letellier, C. Structural, dynamical and symbolic observability: From dynamical systems to networks. PLoS ONE 2018, 13, e0206180. [Google Scholar]
  30. Perez-Padron, J.; Posadas-Castillo, C.; Paz-Perez, J.; Zambrano-Serrano, E.; Platas-Garza, M. FPGA realization and Lyapunov–Krasovskii analysis for a master-slave synchronization scheme involving chaotic systems and time-delay neural networks. Math. Probl. Eng. 2021, 2021, 2604874. [Google Scholar]
  31. Vijayakumar, M.; Natiq, H.; Leutcho, G.D.; Rajagopal, K.; Jafari, S.; Hussain, I. Hidden and Self-Excited Collective Dynamics of a New Multistable Hyper-Jerk System with Unique Equilibrium. Int. J. Bifurc. Chaos 2022, 32, 2250063. [Google Scholar] [CrossRef]
  32. Mannella, R.; McClintock, P.V. Noise in nonlinear dynamical systems. Contemp. Phys. 1990, 31, 179–194. [Google Scholar] [CrossRef]
  33. Chen, B.; Wornell, G.W. Analog error-correcting codes based on chaotic dynamical systems. IEEE Trans. Commun. 1998, 46, 881–890. [Google Scholar] [CrossRef] [Green Version]
  34. Murguia, C.; Shames, I.; Farokhi, F.; Nešić, D.; Poor, H.V. On privacy of dynamical systems: An optimal probabilistic mapping approach. IEEE Trans. Inf. Forensics Secur. 2021, 16, 2608–2620. [Google Scholar] [CrossRef]
  35. Frunzete, M.; Popescu, A.A.; Barbot, J.P. Dynamical discrete-time rössler map with variable delay. In Proceedings of the International Conference on Computational Science and Its Applications, Banff, AB, Canada, 22–25 June 2015; Springer: Berlin/Heidelberg, Germany, 2015; pp. 431–446. [Google Scholar]
Figure 1. Lorenz attractor.
Mathematics 10 04229 g001
Figure 2. Rössler attractor.
Mathematics 10 04229 g002
Figure 3. Defining quality observability index.
Mathematics 10 04229 g003
Figure 4. Lorenz attractor (blue); singularity manifold S O ¯ (yellow) when x is selected as output.
Mathematics 10 04229 g004
Figure 5. Lorenz attractor (blue); singularity manifold S O ¯ (yellow) when y is selected as output.
Mathematics 10 04229 g005
Figure 6. Lorenz attractor (blue); singularity manifold S O ¯ (yelow) when z is selected as output.
Mathematics 10 04229 g006
Figure 7. Rössler attractor (blue) and singularity manifold S O ¯ (yellow) when x is selected as output.
Mathematics 10 04229 g007
Figure 8. Rössler attractor (blue) and singularity manifold S O ¯ (yellow) when z is selected as output.
Mathematics 10 04229 g008
Table 1. The value for the intersection coefficient in the context of Lorenz system.
OutputNo-Intersection Coefficient q
x0.8103
y0.3081
z0.4245
Table 2. Values for the quality observability index r
d%LorenzRössler
x y z x z
10.73310.46660.94070.33000.9972
20.72790.50250.94730.36050.9974
30.74550.57460.95050.38170.9971
40.76510.66320.95210.41510.9970
50.78620.75850.95320.44250.9968
60.80050.83980.95390.47440.9967
70.81510.89060.95450.49640.9969
80.83090.91840.95470.52520.9971
90.84470.93860.95520.54340.9972
100.85770.94600.95550.56430.9972
Table 3. Meanings of the used parameters.
ParameterValueSignificance
η 1 100 % observable
0 0 % observable
q1no intersecton
0huge intersection
r1maximum influence
0minimum influence
Publisher’s Note: MDPI stays neutral with regard to jurisdictional claims in published maps and institutional affiliations.