Article

Deterioration Model for Reinforced Concrete Bridge Girders Based on Survival Analysis

School of Mechanics and Engineering Science, Shanghai University, Shanghai 200044, China
*
Author to whom correspondence should be addressed.
Mathematics 2022, 10(23), 4436; https://doi.org/10.3390/math10234436
Submission received: 18 October 2022 / Revised: 20 November 2022 / Accepted: 21 November 2022 / Published: 24 November 2022
(This article belongs to the Special Issue Mathematical Modeling and Numerical Simulation in Engineering)

Abstract

:
The prediction of bridge service performance is essential for bridge maintenance, operation, and decision making. As a key component of the superstructure, the performance of the main girders is critical to the structural safety of the bridge. This study makes full use of the inspection records from the Bridge Management System (BMS) in Shanghai and performs pre-processing work on a large amount of data. Recent advances in survival analysis were utilized to investigate the inspection records of over 40,000 reinforced concrete bridge main girders over a 14-year period. Survival analysis methods based on the Weibull distribution were used to predict the service performance of the main girders, and, in addition, a COX proportional hazards model was used to analyze the effect of different covariates on the survival of the main girders. The results show that the deterioration rate of main girders increases with age, with an average life of 87 years for main girders in Shanghai. The grade of the road on which the bridge is located and the position of the main girder in the bridge superstructure have a significant impact on the probability of survival of the main girder. It can be concluded that more attention should be paid to the inspection and maintenance of side girders on branch roads to reduce the pressure on bridge management in the future. Furthermore, the analysis in this study found that the deterioration rate of the main girders is faster than the deterioration rate of the whole bridge and superstructure, and, therefore, more attention and necessary preventive maintenance measures should be taken in the maintenance and management of the main girders.

1. Introduction

Bridges play an indispensable role in the public road network. They can improve the regional road network, thus promoting inter-regional economic development [1]. Bridge management departments around the world have been working for a long time to develop and improve various bridge management systems (BMS), attempting to provide timely and effective bridge maintenance, repair, and rehabilitation (MR&R) through standardized and continuous technical-condition data collection and performance evaluation [2,3,4,5,6]. Bridge management systems began to be developed extensively in the early 1990s and are now becoming increasingly mature after more than 20 years of effort [7]. In general, a comprehensive BMS should contain four components, namely, a bridge information database, a performance deterioration model, a cost model, and a maintenance decision optimization model [8,9,10]. Each part has independent functions but works in conjunction with the others. The bridge information database is used to store the attribute information, inspection history, and maintenance data of the bridge. The purpose of the performance deterioration model is to predict the future state of the bridge and its components. The cost model is utilized to estimate the cost requirements for routine maintenance and repair of bridges, and the role of the decision optimization model is to determine the best MR&R strategy [11].
Among them, the information database and performance deterioration model are the foundation of the BMS, and they play a crucial role in assessing and predicting the technical condition of the bridge [12,13,14]. Only with accurate bridge performance assessment and predictions can the development of maintenance strategies and the estimation of maintenance cost requirements be carried out successfully. In addition, unlike bridge information databases and performance deterioration models that primarily have objective attributes, the cost and decision optimization models will reflect a degree of subjectivity, as maintenance costs and strategies are often related to local bridge management goals and maintenance resource input levels [15,16].
The accuracy of the performance prediction of bridge components is of considerable importance; therefore, this paper used literature research and data analysis to find a suitable method to predict the service performance of bridge components. Although there are many bridge component categories, attention will only be focused on the main girders of the bridge. For this category of bridge components, the main objectives are as follows:
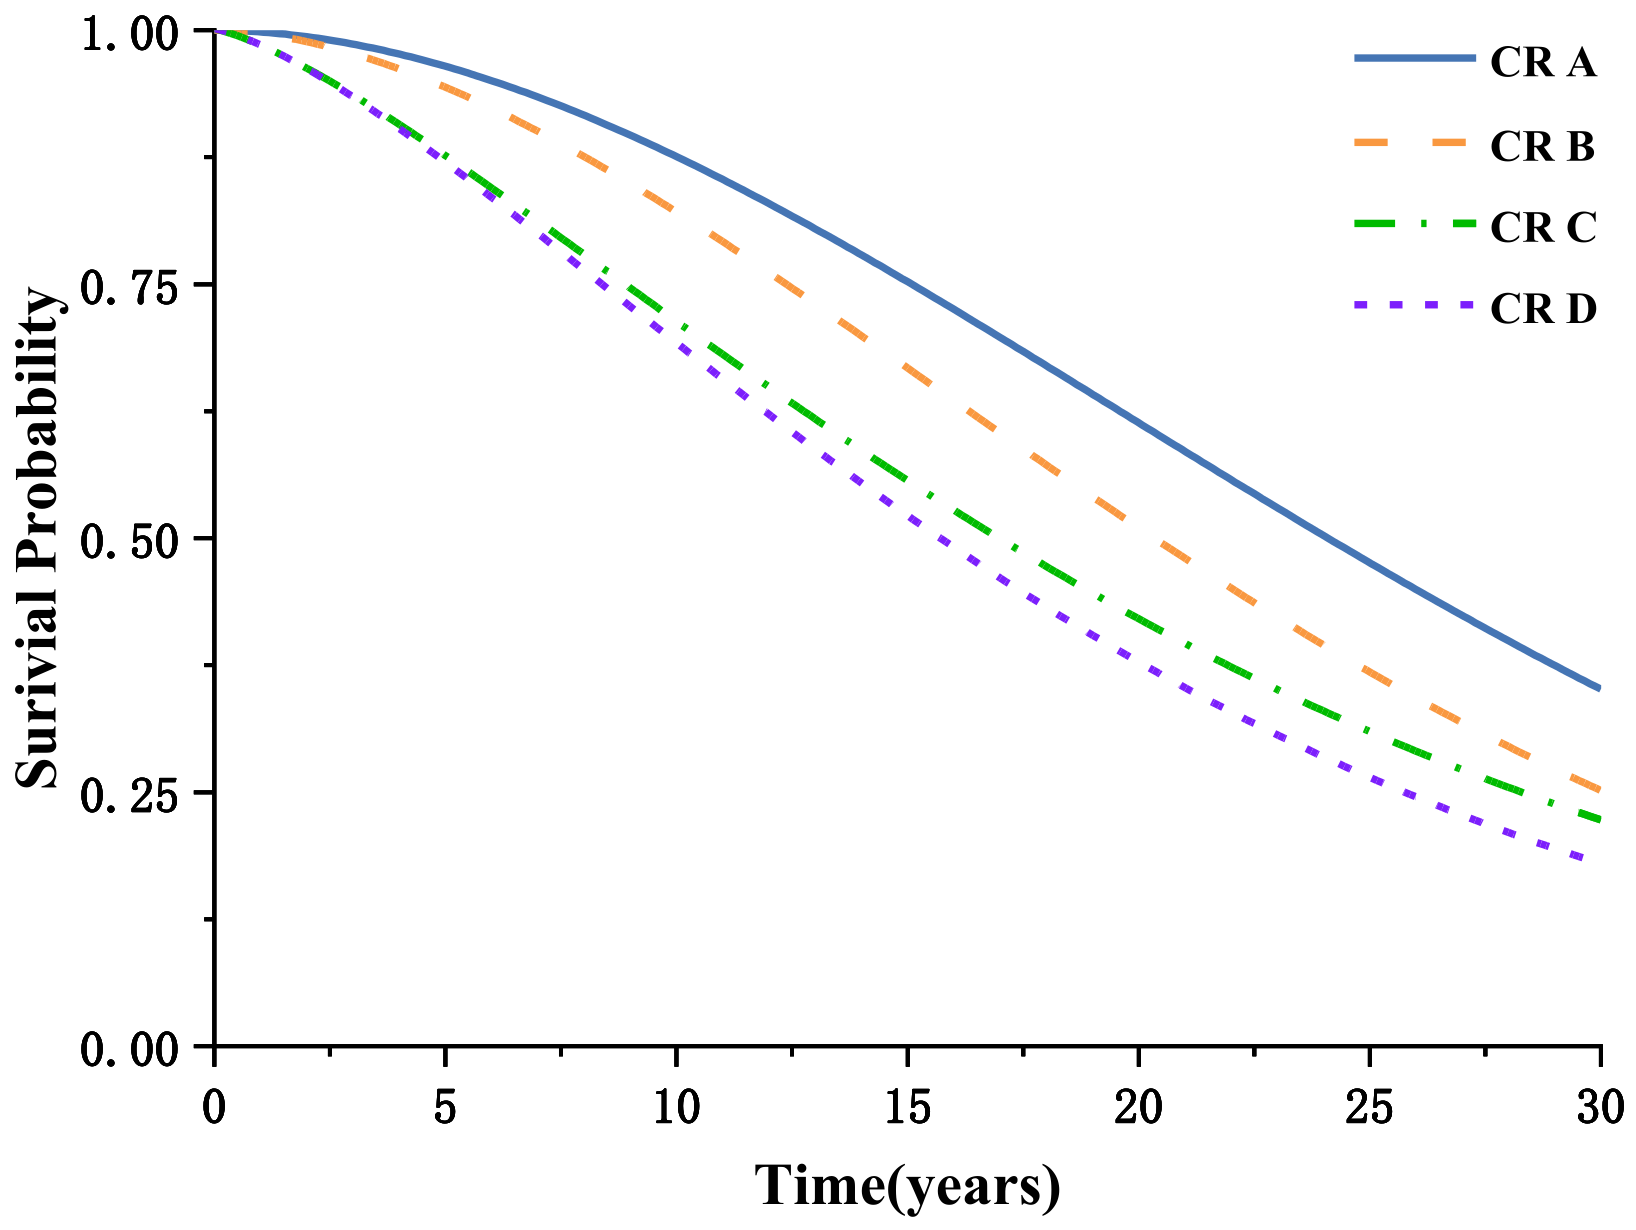
  • To analyze the deterioration of the main girder under different CRs and assess the service life of the main girder;
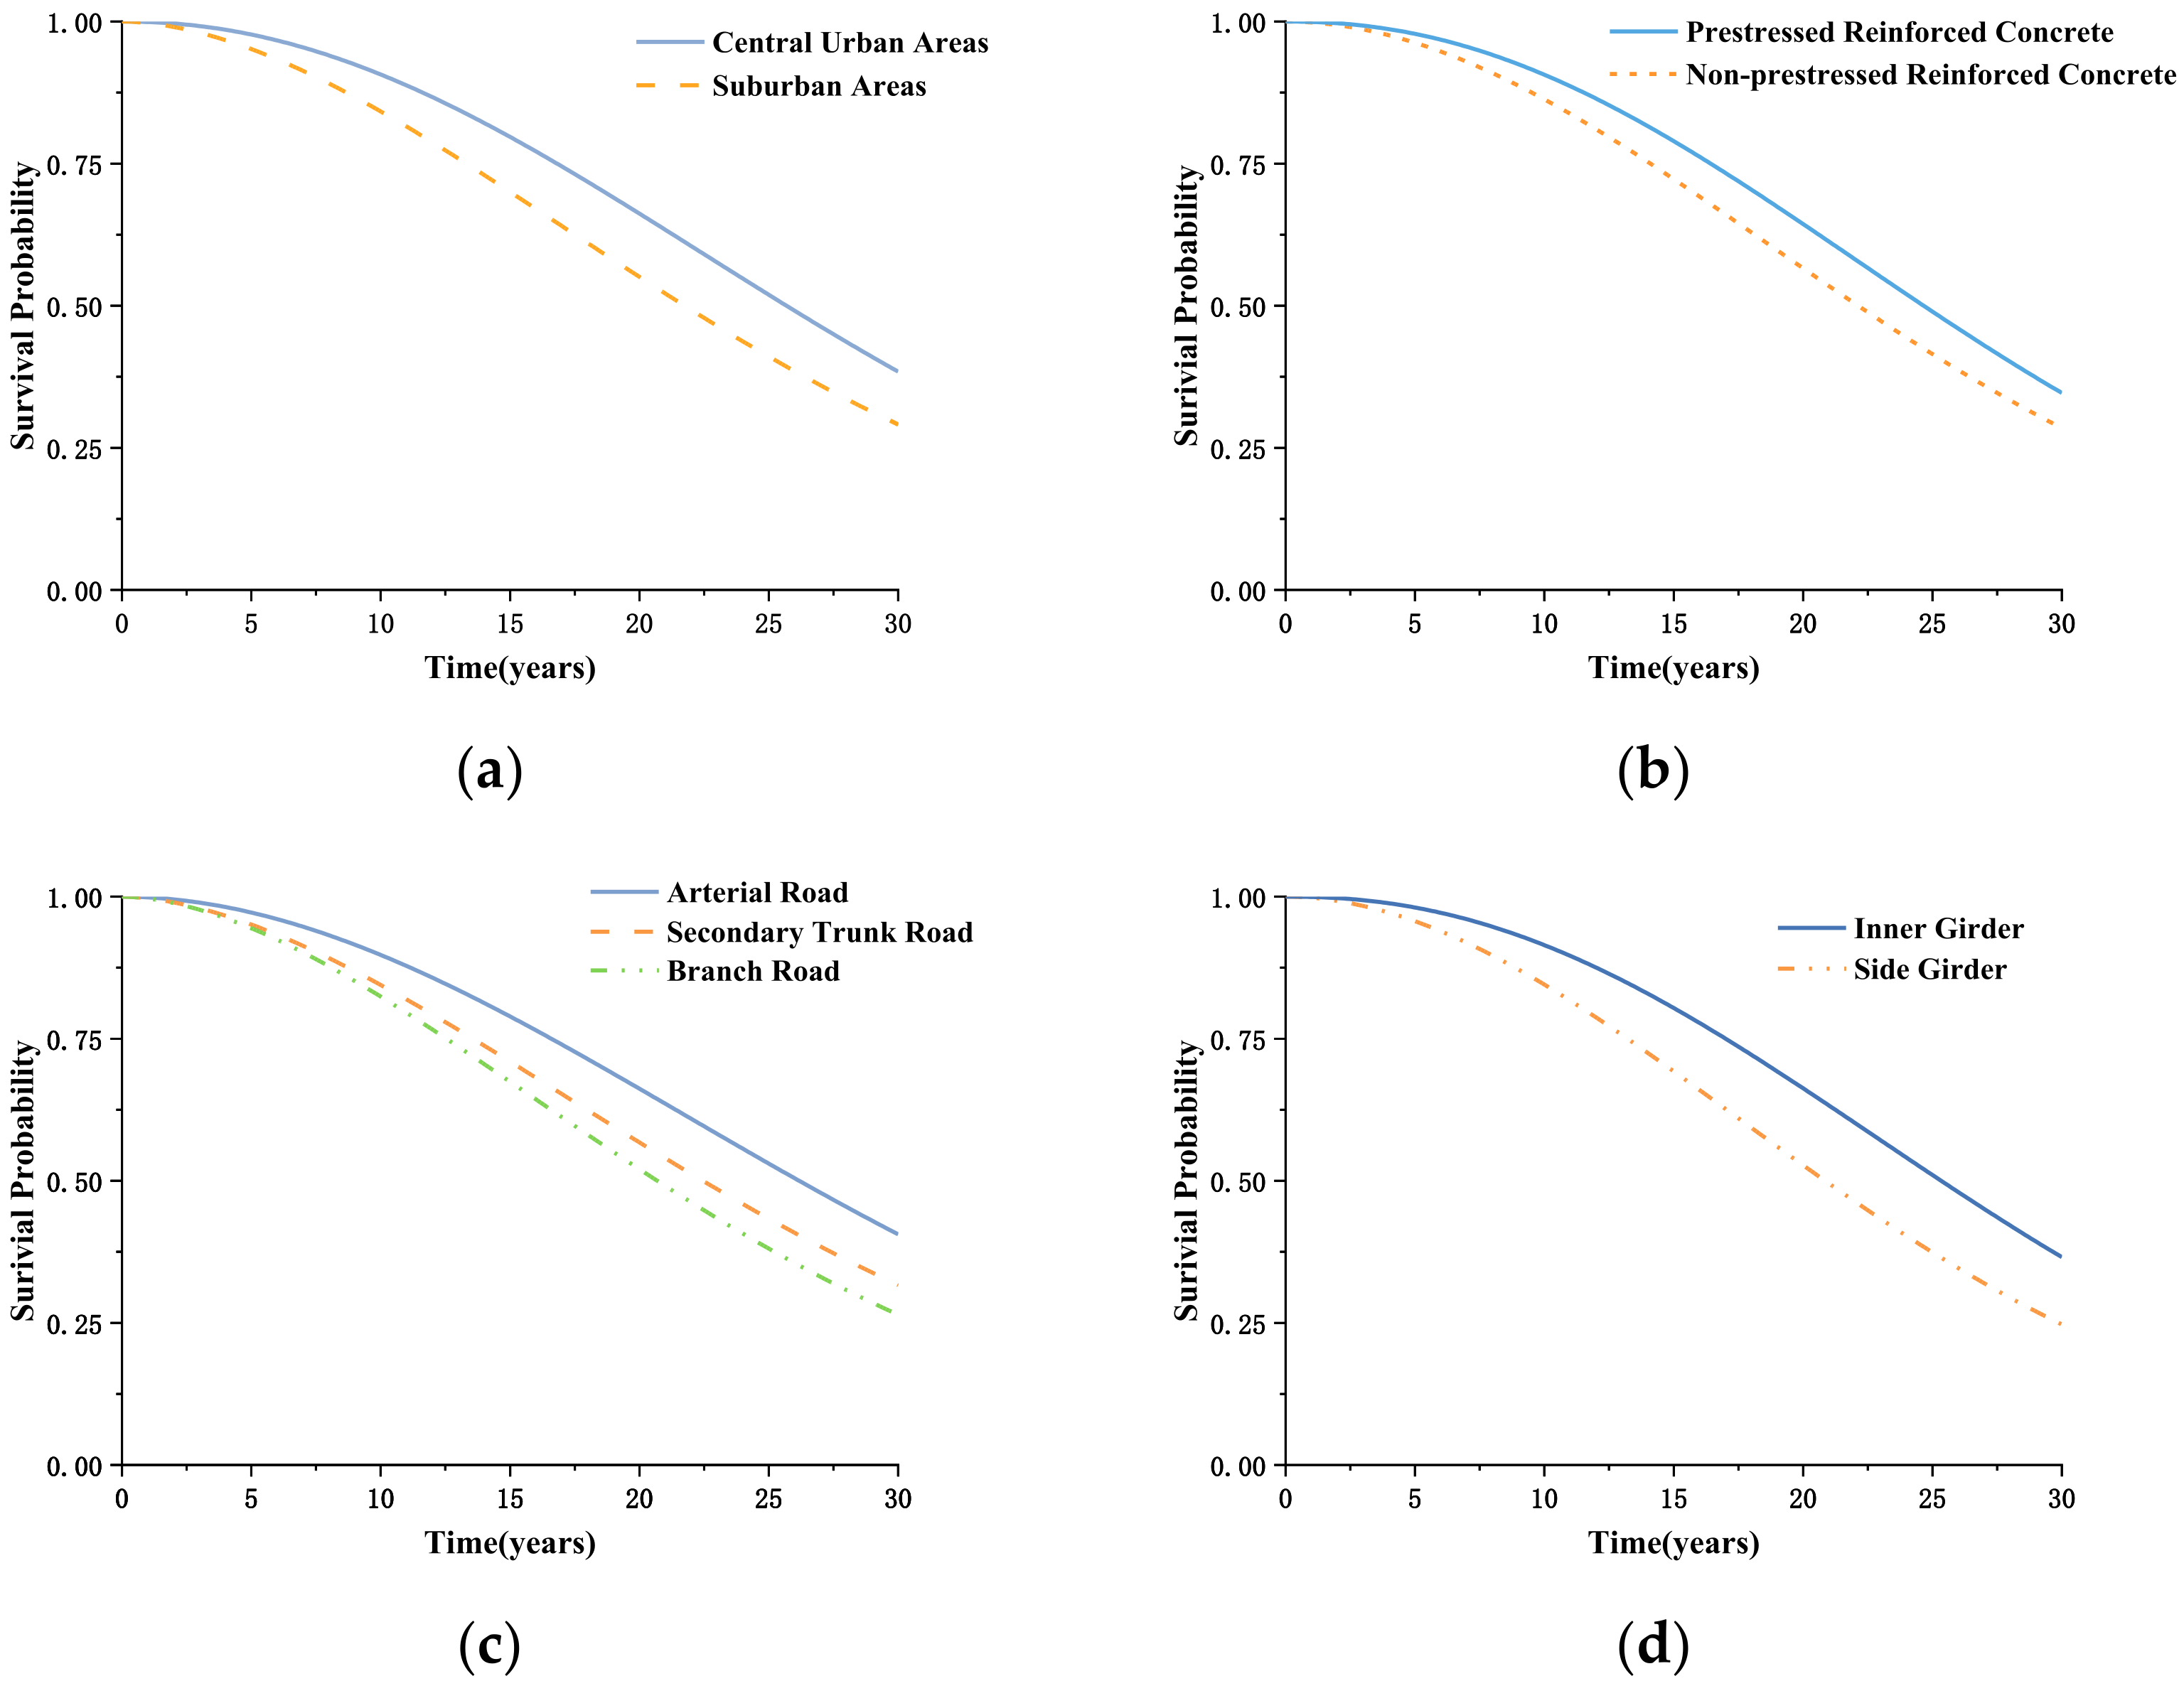
  • To seek the deterioration pattern of the performance of the main girders under different influencing factors;
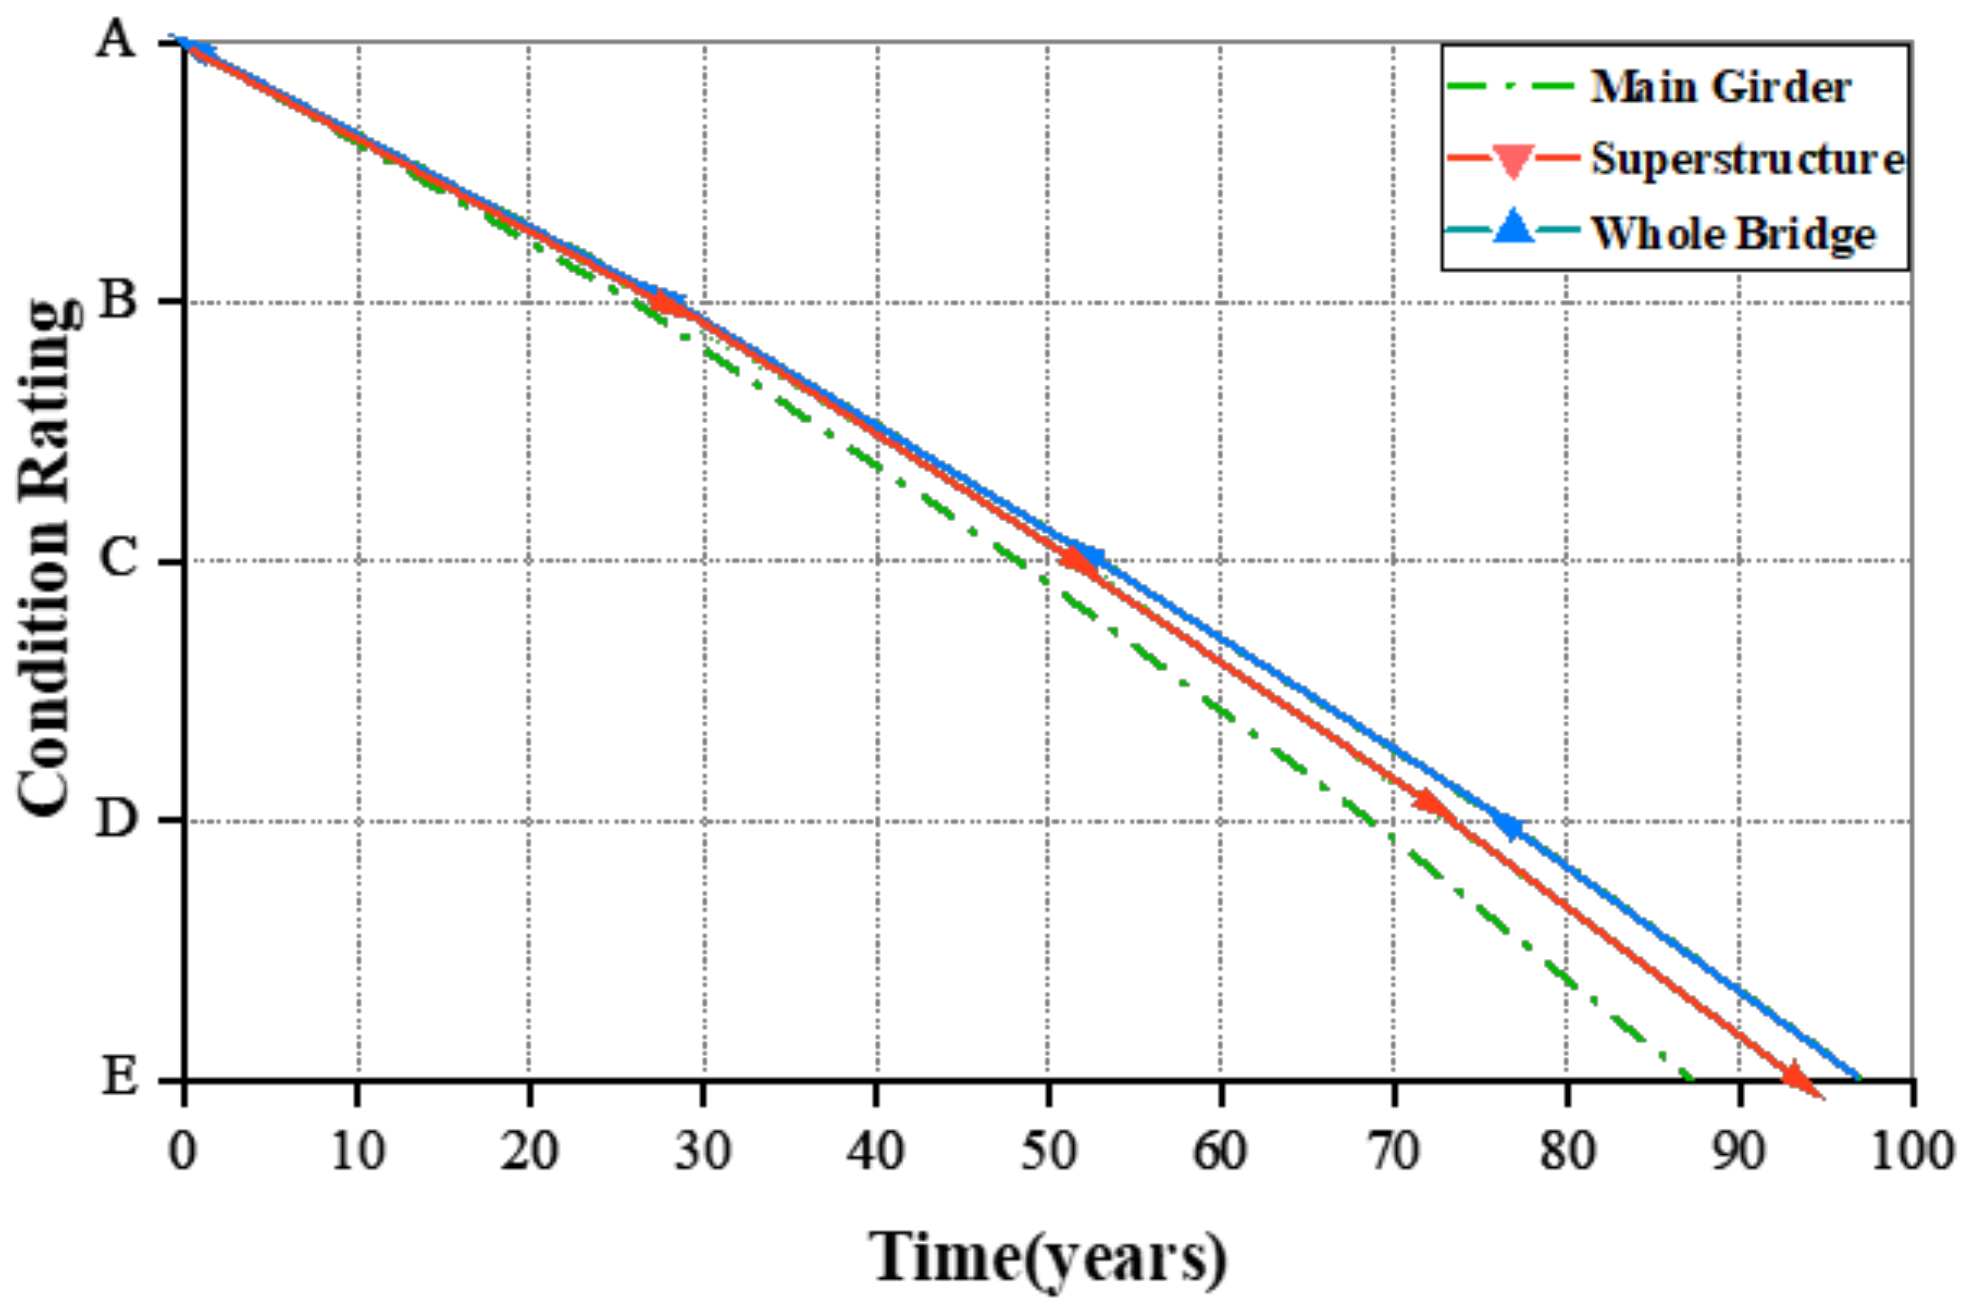
  • To compare the deterioration of the performance of the main girders with that of the superstructure and the whole bridge.
After the background and objectives of the study are presented in this section, the remainder of the paper is organized as follows: Section 2 presents the current state of the research through literature research; Section 3 provides a brief explanation of the basic concepts of survival analysis, Cox regression, and Weibull distribution; Section 4 shows the data that have been collected so far; Section 5 discusses the estimation results obtained from the semi-parametric regression and parametric analysis used in this study; and, finally, conclusions and an outlook for future work are presented. The models developed in this paper should be useful for transport organizations to improve their maintenance strategies and operational decisions.

2. Literature Review

Many countries and regions have already established bridge management systems with relatively complete functions based on the improvement of the bridge information database, such as PONTIS and BRIDGIT in the USA, NYSDOT in New York, J-BMS in Japan, KUBA in Switzerland, OBMS in Canada, C-BMS for highway bridges and Web-BMS for urban bridges in China, etc. [17,18,19,20]. Although the data composition and accuracy of the bridge information database of these systems are not exactly the same, the basic structure is similar, and they all match the functional requirements and management objectives of the local bridge management system. For bridge deterioration models, different bridge management systems may use completely different technical solutions. For example, J-BMS and Web-BMS adopt a deterministic regression method, and PONTIS, BRIDGIT, OBMS, as well as KUBA use a stochastic model based on Markov theory [17]. The choice of different models is usually related to the locally accumulated bridge performance database, and the prediction accuracy of bridge deterioration models often determines the success or failure of BMS [21].
The deterministic regression method assumes that there is a certain tendency for the bridge to deteriorate, and the deterioration curve can be fitted by regression analysis. The main advantage is that the modeling process is relatively simple, and the relevant parameters are easy to update, but the disadvantage is that it cannot reflect the stochasticity and uncertainty of the bridge deterioration process. In addition, such models require high data quality, so rigorous data pre-processing is usually necessary. In turn, errors caused by subjective judgments may occur during data preprocessing [20]. The bridge deterioration model used in the Web-BMS in Shanghai, China, is based on the bridge condition index, given by Equation (1):
B C I = B C I 0 1 exp α y β
where B C I indicates the bridge condition index, and the larger the B C I , the better the technical condition of the bridge; y represents the bridge age; α and β are the bridge life parameter and the curve shape parameter, respectively, both of which can be obtained by regression analysis.
In contrast, PONTIS, OBMS, and NYSDOT all adopt discrete time state-based Markov models to simulate bridge deterioration [17]. As a special case of Markov models, Markov chains is the commonly used stochastic model [22]. It predicts bridge performance by assigning each condition rating (CR) to the state in the Markov chain, and then calculating the probability of transition from one state to another within the scheduled time [23]. As a first-order stochastic process, Markov chains have advantages in reflecting the randomness and uncertainty of bridge performance deterioration. However, the model based on Markov chains has two assumptions—homogeneous and memoryless—that bring some limitations to their application. Homogeneity requires that the probability of transition from one CR to another remains unchanged throughout the bridge life. Memoryless means that the future state of the bridge is only related to the present state and has nothing to do with the past [24]. Therefore, it is difficult for such models to reflect the actual performance deterioration of the bridge.
To predict the service performance of the bridge more accurately, a great quantity of studies had further developed the deterioration model. Moses and Kleiner et al. [25,26] used a semi-Markov model to simulate bridge deterioration. The major difference between a semi-Markov process and a Markov process is the distribution of state durations in the process. Markov processes require state durations to be geometrically or exponentially distributed, while state durations for semi-Markov processes can be arbitrarily distributed [27]. Therefore, the semi-Markov model is closer to the actual situation than the Markov model. However, the semi-Markov model also has some limitations in estimating transition probability. For example, the semi-Markov model cannot clearly indicate the effects of various factors on bridge deterioration. In addition, linear regression is no longer applicable due to the ordinal nature of the states (CRs of the bridge) [28].
In view of the limitations of the above methods, Mishalani and Madanat [29] changed from discrete time state-based models to a stochastic duration model. The duration refers to the time it takes for a bridge or a bridge component to deteriorate from one state to an adjacent state [30]. The Weibull probability density function was used to estimate the duration of states 7 and 8 (CRs of the bridge ranged from state 0 to 9, where 0 represented the worst condition and 9 was the best). Furthermore, the effects of different factors (including traffic loads, bridge age, environmental factors, road class, structure type, and wearing surface material) on deck deterioration were also considered [29].
Stochastic duration models can be further divided into nonparametric, parametric, and semi-parametric models [31]. Nonparametric models can be used for survival analysis when no suitable parametric model can be fitted to the event under study. Stevens, using nonparametric models to observe the impact of different covariates on bridge survival probability, mainly investigated four factors: structure type, bridge function, number of spans, and road class. The results showed that structure type, bridge function, and road class have a great influence on bridge performance [8]. Although nonparametric models are simple and flexible in estimating bridge performance, the relationship model between survival time and risk factors cannot be established. Parametric models can model the relationship between survival time and risk factors but require assumptions about the form of the deterioration function [32]. In contrast, semi-parametric models can overcome these limitations. Nakat and Madanat [33] adopted a semi-parametric Cox proportional hazards model (Cox model) with its risk function as the sample risk function, which was able to simulate the performance deterioration process that cannot be simulated by conventional parametric models. However, the accuracy of the results obtained from the Cox model was generally inferior to that of the parametric model because the Cox model used partial likelihood estimation, while the parametric model used maximum likelihood estimation [34]. Therefore, despite the drawbacks of parametric models, they were still widely used in structural deterioration simulations. If the trend of the parametric distribution obeyed by the structural performance data can be determined in advance, parametric models could yield more accurate results than nonparametric and semi-parametric models [35].
Depending on the form and characteristics of the data distribution, parametric models can be further classified as follows: Weibull, loglogistic, lognormal, hypertabastic, and other models [36,37]. Nabizadeh et al. [38] investigated the performance deterioration pattern of the superstructure of bridges in Wisconsin using survival analysis methods and analyzed the effects of structure type, bridge age, maximum span length (MSL), and average daily traffic (ADT) on the superstructure based on a hypertabastic model. The results showed that ADT and MSL had a great impact on the reliability of the superstructure. Tabatabai et al. [39] described the deterioration behavior of bridge decks under different influencing factors using a reliability function with a hypertabastic distribution. The results found that deck area and ADT were important factors affecting deck deterioration. Agrawal and Kawaguchi et al. [40] used a parameter model based on the Weibull distribution to calculate the deterioration rate of bridge components through historical bridge inspection data. The results indicated that the prediction model based on Weibull distribution outperformed traditional Markov chains. Similarly, Nasrollah and Washer [41] determined the time-in-condition ratings (TICR) of bridge superstructure components based on NBI data. The Anderson–Darling test was used to evaluate five regular distributions to determine the fitting accuracy describing the TICR probability distribution. The results showed that the Weibull distribution was well suited for calculating the TICR of the superstructure components. Manafpour et al. [42] evaluated the transition probabilities and sojourn times for the deterioration of bridge decks using a semi-Markov model based on accelerated failure time Weibull fitted-parameters. The proposed method linked the deck deterioration with various explanatory factors, such as route type, structural system attributes, ADT, and environmental conditions. Several factors were found to be statistically significant with respect to the service life of bridge decks, including the type of rebar protection, continuous versus simply supported spans, the number of spans, overall bridge deck length, and bridge location.
Many studies have been conducted to predict the performance changes of bridges, deck systems, superstructures, and substructures, while few prediction models have been extended to specific bridge components [43]. This may be because component-level inspection data or rating data are more difficult to obtain. However, deterioration prediction using the overall bridge ratings has the potential to overestimate the actual condition of the bridge because the overall ratings include substructure ratings that are often difficult to accurately inspect due to environmental constraints [44,45]. In addition, the overall bridge deterioration is obtained by a weighted average of the deterioration of individual components, whereas the maintenance of bridges is generally component-specific [46,47,48]. Therefore, bridge technical condition prediction at the component level is more positive for developing targeted bridge maintenance countermeasures and optimizing maintenance capital investment. This is especially true for important bridge components with high scoring weights or components that are relatively vulnerable to damage [49].
Taking urban bridge management in Shanghai as an example, the weight values of girder bridges are shown in Table 1, according to the Technical Code of Maintenance for City Bridges (CJJ 99-2017) [46]. Girder bridges are used here to represent small and medium-sized urban bridges because they account for about 91.3% of the urban bridges in Shanghai.
As can be seen from Table 1, the substructure has the greatest weight in the overall bridge rating, but because the substructure is located underwater, inspection is often difficult to perform [44]. Especially for the large number of small and medium-sized urban bridges, the limited maintenance resources can hardly support detailed substructure inspection of all bridges every year. Therefore, the actual management tends to overestimate the technical condition of the bridge substructure, and the use of substructure inspection data to model bridge deterioration is not reliable enough [50]. The superstructure accounts for the second greatest weight in the overall bridge rating with a weighting of 40%. Since superstructures are usually exposed to air for a long time, they are easier to detect and have more reliable data than substructures. Therefore, it is more feasible to use superstructure data to evaluate the bridge deterioration status. Meanwhile, for girder bridges, the most important component of the superstructure is the main girder. According to the Chinese Technical Code of Maintenance for City Bridge (CJJ 99-2017) [46], the weight of the main girder accounts for 60% of the superstructure in the technical condition evaluation. As a result, the deterioration of the main girders can be used to reflect the deterioration of the superstructure and then the deterioration of the whole bridge. This has the advantage of avoiding the problem of overestimation of deterioration prediction brought by using the overall bridge rating on the one hand and helping to control the discrete nature of the data on the other hand, as well as expanding the data set, which can improve the reliability of the deterioration model. Additionally, the main girders are also one of the main objects of bridge maintenance, and studying the deterioration behavior of the main girders is beneficial for more detailed maintenance management in the future as well.
Due to its flexibility and simplicity in fitting different types of engineering life data, the Weibull distribution has been widely used in the analysis of the time-varying reliability and service life decay behavior of infrastructure [41,51]. Furthermore, with the different values of the shape parameter, the Weibull distribution can be associated with different probability distributions, such as the normal distribution, the exponential distribution, and the Rayleigh distribution [20]. Therefore, in this paper, a survival analysis model based on the Weibull distribution will be applied to model the main girder condition duration based on the inspection data of the main girders in the Shanghai urban bridge management system from 2007 to 2020. In addition, the Cox proportional hazards model will also be used to observe the influence of various factors on the survival time of main girders.

3. Methods

The period for which continuous inspection data exists is relatively short compared to the entire life of the bridge; thus, there is inevitably a lot of censored data in the dataset. To address this problem, this study uses survivability analysis based on the Weibull distribution and Cox model in predicting bridge performance deterioration. Their roles and calculation methods are shown below.

3.1. Survival Analysis

Survival analysis is a special form of reliability analysis that allows the modelling of time-to-event data along with their associated contributing covariates [52]. Survival analysis has been applied to the field of biomedicine for a long time. Although its application in bridge engineering is not yet so common, it has also been developed considerably in recent years, such as through the latest research using it for performance deterioration prediction of bridge decks [39,44]. The current studies related to survival analysis can be divided into three main categories: description of survival process, analysis of influencing factors, and prediction of survival outcomes [53]. The main advantage of survival analysis over other models is the ability to handle incomplete censored data. There are two main types of censoring: left-censoring and right-censoring [54]. Left-censored means that the bridge CR has exceeded the threshold, while right-censored refers to the CR not reaching the threshold [8]. The left-censored observation indicates that the life span of the bridge is less than or equal to the present age, while the opposite is true for the right-censored observation [20]. In survival analysis, the primary variable is survival time, which is a nonnegative random variable used to measure the time interval from a certain moment to the occurrence of a given event [55].
The distribution of survival times can be expressed by three functions: the probability density function, the survival function, and the hazard function or conditional failure rate function.
The probability density function f t is defined by Equation (2), where the nonnegative random variable T represents the time the bridge components maintain a certain CR level and t is time:
f ( t ) = lim Δ t 0 P t < T < t + Δ t / Δ t
As shown in Equation (3), the cumulative distribution function F t of the duration T in CR describes the probability of the bridge component CR transitioning to the next level before time T:
F ( t ) = p r o b ( T t ) = 0 t f ( x ) d x
The survival function S t can be expressed as Equation (4), which represents the probability that the bridge component CR will be maintained unchanged by the time t :
S ( t ) = p r o b ( T > t ) = 1 F t
The instantaneous risk of failure at time t can be expressed by a hazard function h t as Equation (5), which reflects the risk of deterioration of the bridge component CR:
h ( t ) = lim Δ t 0 p ( t < T < t + Δ t | T > t ) / Δ t = f ( t ) 1 F ( t ) = f ( t ) S ( t )
The probability density function, survival function, and hazard function are mathematically equivalent. If one of these functions is known, the other two can be derived. However, in specific applications, the survival function is more widely used because it can directly obtain the average survival time and survival rates [42].

3.2. Cox Regression Analysis

The Cox proportional hazards model is a common semi-parametric model, which consists of a parametric component and a nonparametric component [56]. Compared with a nonparametric model, it can model the relationship between survival time and risk factors. Moreover, it does not need to assume the shape of the hazard function, which means that the shape of the function depends entirely on the characteristics of the data alone [32]. The hazard function in the Cox model is given in Equation (6) and contains both nonparametric and parametric components:
h i ( t ) = h 0 ( t ) Ψ i x , Ψ i x = exp ( β 1 X i 1 + β 2 X i 2 + + β p X i p )
where the nonparametric component arbitrary   h 0 t   = the baseline hazard function; h i t = hazard rate for the i th case at time t . The parametric component is given by Ψ i x , where p = number of covariates,   X i p   = value of the i th case of the p th covariate, β p = value of the p th regression coefficient, and β = vector of parameters to be estimated by maximum likelihood.
Meanwhile, the hazard ratio (HR) can be calculated by Equation (7) below.
H R = e β
In this study, the Cox model is used to obtain the actual shape of the hazard function and to analyze the influence of different covariates on the deterioration of main girders. HR is then used to reflect the extent to which the different covariates influenced the deterioration of the main girder.

3.3. Weibull Distribution

The main advantage of parametric models is that the shape of the hazard function is pre-specified so that data trends can be extended to future stages, thus facilitating predictive modeling [32]. When a reasonable distribution function is chosen, the parametric model will get more accurate prediction results than the semi-parametric and nonparametric models [57]. Furthermore, with the development of research on the trend of structural performance of bridges, it is possible to determine the form of reasonable distribution functions in advance. The probability density function of the two-parameter Weibull distribution used in this study is shown in Equation (8):
f t = β η t η β 1 exp t η β
where t indicates the duration of CR, β is the shape parameter, and η is the scale parameter. They are all positive numbers.
When β > 1 , the deterioration probability becomes larger as the service time increases; when β = 1 , the deterioration probability remains stable (then the Weibull distribution becomes exponential); and when β < 1 , the deterioration probability decreases as the service time increases. The scale parameter η affects the proportion of the Weibull distribution function that takes on values within its domain of values. Changes in the scale parameter η will only compress or expand the distribution function without changing its basic shape [40].
The failure probability (Equation (9)), survival function (Equation (10)), and conditional failure rate (Equation (11)) can be obtained from the two-parameter Weibull distribution probability density function, as follows:
F t = 1 exp t η β
S t = exp t η β
h t = 1 η β β t β 1
The shape parameter β and scale parameter η for the Weibull distribution can be obtained by fitting the duration of the main girders at different CRs. In this paper, the maximum likelihood method was used to estimate two parameters of the Weibull distribution. When two parameters are obtained, the average duration (average expectation) of each CR of the girder can be estimated using Equation (12), where Γ is the Gamma function:
E T = η Γ 1 + 1 β

4. Data Preparation

4.1. Data Profile

The Shanghai urban bridge management system was officially launched in 2004 to assist in the maintenance and management of small and medium-sized urban bridges [58,59]. The system stores a large amount of bridge information, such as bridge attribute information, inspection year, maintenance history, damage records, and annual CR. The collection and evaluation of bridge damage information is conducted once a year in Shanghai. Since a bridge can be expressed in the format “whole bridge-bridge parts-components”, the score is weighted and accumulated from the component level until the whole bridge score is obtained [20]. Accordingly, the bridge CR can be detailed down to the component level. By the end of 2020, a total of 3439 bridges in Shanghai were recorded in the system. Reinforced concrete and pre-stressed reinforced concrete girder bridges account for about 85.2%, with more than 40,000 main girder ratings recorded in total. The damage data and CR records of urban bridges accumulated in the Shanghai system over the years provide the possibility to build a long-term bridge performance deterioration model and make more targeted maintenance recommendations.

4.2. Data Pre-processing

The effective management of bridges has become a social and economic problem due to the rapid deterioration of bridge components and limited capital investment from the government [60]. At present, most investment decisions are based on the quantitative analysis of bridge inspection data and the subjective judgment of decision makers [61]. However, the subjectivity of decision makers can easily affect the reliability of decision-making results, so extra assurance is needed to ensure the accuracy of bridge inspection data analysis [62]. In China, small and medium-sized urban bridges are mainly visually inspected and equipped with the necessary measuring instruments and equipment, such as cameras, crack observers, probing tools, and auxiliary equipment. The BCI is used to describe the condition status of the bridges. The BCI score is based on a percentage scale, with higher scores representing the better condition of the bridge. Based on the BCI scores, the CRs of the bridge components can be classified A to E as shown in Table 2. Generally, merely routine maintenance is needed for bridges with CR A or B, while bridges with CR from C to E usually require minor, medium, or major repairs within the next year [46].
The data set used in this study has a maximum of 14 years (from 2007 to 2020) of inspection records for the same bridge, which is short compared to the bridge design life (75–120 years) [20,38]. Therefore, the time-space conversion method is used to extend the time series of data, i.e., the performance data for different bridge ages of the same type of bridge are considered as the performance of the same bridge at different periods of time, thus converting the data from spatial distribution to temporal variation [63]. Furthermore, basic information and historical inspection records for bridges in the database are routinely missing and incorrectly reported. The data need to be properly pre-processed before they can be used in bridge deterioration modeling [40]. Effective data pre-processing can exclude the influence of external factors such as maintenance and repair on the bridge deterioration process and can also correct some deviations brought about by the subjective judgment of the inspectors, thus improving the accuracy of the prediction model and making the established prediction model conform to the actual deterioration pattern of the main girders as far as possible [64]. The steps of data pre-processing used in this study are as follows:
  • According to Table 2, convert BCI scores to CRs.
  • Locate null values in the dataset.
  • Check the CR values of the year before and after the year in which the null value is located, and if they are all the same, replace the null value with that CR value. Otherwise, consider the record invalid and deleted it from the dataset.
  • If the CR values change from D or E to A in the adjacent year, reset the age of the bridge after the change to 1. That is, consider the bridge as new after major repairs or reconstruction because bridges in D and E must undergo major repairs or reconstruction according to Shanghai’s bridge management regulations.
  • If the CR values of adjacent years do not have a monotonically decreasing trend without a maintenance record, delete the record because the fluctuation of CR value at this time may be an inspection error or even a mistake.
  • Set a reasonable range for the deterioration rate of bridge performance based on engineering experience [20]. (For example, urban bridges in China are generally designed for a life of 50–100 years [65]; hence, a bridge rating that deteriorates from grade A to grade D is typically no less than 20 years, and it is unlikely that a bridge CR will maintain an A rating for more than 40 years.).
  • Mark the censored data in the inspection record dataset.

5. Results and Discussion

5.1. Processed Dataset

The analysis in this study was based on the reinforced concrete main girder scoring records stored in the Shanghai Web-BMS database from 2007 to 2020 (main girder data incorporated into the Web-BMS from 2007). The results of data pre-processing using the method shown in Section 3.2 are presented in Table 3. The total number of valid inspection records for the main girders from 2007 to 2020 is 35,324, which meets the requirements of subsequent data analysis and modeling.
Each record in Table 3 contains five data fields: bridge ID, component ID, component type, component CR, and bridge age. The inspection data were further grouped according to the completeness of the data series, and the results are shown in Table 4, where most records are right-censored data. In view of the small number of left-censored data and the more difficult parameter estimation, only the complete data and the right-censored data were considered in this study for Weibull distribution parameter estimation.

5.2. Parameter Estimation for Weibull Distribution

The analysis of the survival time of the main girder was modelled by both SPSS and Origin software, and the resulting parameter estimates of the Weibull distribution are shown in Table 5. The shape parameters of the main girders are greater than 1 for all CRs, indicating that the deterioration probability of the main girders of the reinforced concrete bridges in Shanghai becomes larger with increasing service time. It also suggests that conventional Markov chains do not match the actual performance deterioration trend of the main girders. Furthermore, as the CR of the main girder continues to decrease, the shape parameter becomes progressively smaller and the average expectation decreases.
That is, as the service life increased, the deterioration of the main girders accelerated. The average duration of the main girders in grade A, B, C, and D was 26.0, 22.3, 20.4, and 18.6 years, respectively, which indicates that the duration of each grade decreases with the deterioration of the main girders. Overall, the average life span of the main girder of the reinforced concrete girder bridge was 87 years (from grade A to grade E).

5.3. Survival Curve and Analysis

The advantage of the parametric model is that the survival probability can be defined as a function of time, as shown in Equation (3). Survival means that the main girder is still at the current CR, while failure means that the main girder has deteriorated to a worse CR. Based on the main girder inspection records used in this study, survival analysis was carried out, and the survival curve of each main girder CR before recession was obtained. The results are shown in Figure 1. There are no girders rated as grade E (dangerous) in the dataset. It can be found that the main girders in grade A have the highest survival probability, and as the CR deteriorates, the survival probability also decreases accordingly. This indicates that with the performance deterioration of the main girders, the duration in each CR gradually deteriorates; that is, the main girders have shown a trend of accelerating deterioration.
The survival probability of the main girder in different environments and states may be different, so the influence of different covariates on the main girder will be further analyzed in this study. Considering the management characteristics of urban bridges in Shanghai, the following influencing factors were analyzed.
  • Area factor: the area in which the bridge is located (suburban or central urban areas, which may reflect different maintenance budget levels).
  • Structure factor: the structural type of the main girder (prestressed or non-prestressed reinforced concrete).
  • Road factor: the grade of the road on which the bridge is located (usually related to traffic level, higher road grade means more traffic).
  • Position factor: whether the main girder is located on the outer side of the superstructure (reflecting the degree of contact between the main girder and the atmospheric environment).
The effects of different covariates on the main girder under each CR were studied analytically and found to have a similar pattern. Therefore, this paper shows the effect of each covariate on the main girder specifically through the survival curve of CR A, as shown in Figure 2 below.
Figure 2 shows the effect of four different covariates on the probability of survival of the main girders. It can be found that the main girders of the central urban bridges have a higher survival probability compared to the suburban bridges. This may be due to traffic control policies imposed on urban bridges, which prohibit the passage of large trucks. The performance of prestressed concrete girder bridges is slightly better than that of non-prestressed bridges, probably because the prestressed main girders are usually produced in a controlled environment and have good crack resistance and stiffness. Main girders on the arterial road are generally considered to have a lower probability of survival because they are subjected to greater traffic loads. However, this study found that compared with the secondary trunk road and the branch road, the survival probability of the arterial road bridge girder is higher. This may be due to the fact that the arterial road bridges themselves have higher construction standards and, therefore, higher durability. In addition, arterial road bridges are more likely to be valued during the maintenance and repair stage, resulting in more maintenance resources. The side girders are directly exposed to the atmosphere and are more affected by natural factors, such as temperature and humidity, and coastal bridges are also more susceptible to chloride ion erosion. Therefore, the probability of survival of the side girders is significantly lower than that of the inner girders.

5.4. Cox Model Parameters

The covariates in Figure 2 were applied to the Cox proportional hazards model and the regression coefficients and hazard ratios (HR) were obtained using Stata software for modelling and analysis. The regression coefficients can describe the effect of the covariates on the survival of the main girder, while the HR can further reflect the degree of influence of the covariates. The analysis results are displayed in Table 6.
A HR above 1.0 and a regression coefficient greater than 0 indicate that the covariate is a hazard factor, while HR below 1.0 and a regression coefficient less than 0 mean that the covariate is a protective factor. A HR that equals 1.0 and a regression coefficient that equals 0 indicate that the covariate is an unrelated factor. Taking the position factor as an example, HR = 1.446 means that the girder on the outside is 1.446 times more likely to deteriorate from grade A to grade B than the girders in the middle position of the superstructure (inner girder). As can be seen from Table 6, all four factors analyzed in this study had an impact on the deterioration trend of the main girder. Of these, the main girder position and road grade caused the greatest difference in impact.

5.5. Life Prediction

The average service life of the main girder can be predicted by using the duration of each CR in Table 5. Since the girder position and the road grade had the greatest difference in impact, the average service life of the main girder under these two covariates was compared, as shown in Figure 3.
The results show that the overall average service life of the concrete girder in Shanghai was 87 years (CR level deteriorated to grade E at the end of life). The average service life of the main girders on the arterial road was 90 years and that on the branch road was 82 years. Similarly, the life of the side girders was about 80 years, while that of the inner girders was 89 years. The difference between them is nearly 10 years. This indicates that bridge management should pay special attention to the inspection and maintenance of side girders on branch roads and schedule maintenance budgets in advance.
The same method was used to predict the service life of the whole bridge, superstructure, and main girder, as shown in Figure 4 below. The predicted results show that the rate of deterioration of the superstructure is faster than that of the whole bridge. In addition, the deterioration rate of the main girder is faster than that of the superstructure. As a result, it is necessary to enhance regular or preventive maintenance of the main girder.

6. Conclusions and Future Work

This study investigated over 40,000 bridge main girder inspection records in the Shanghai Web-BMS from 2007 to 2020. The latest survival analysis theory was used to develop a model that fits the deterioration of main girder performance. A model based on a two-parameter Weibull distribution was used to fit the duration of reinforced concrete bridges under each CR. In addition, the Cox proportional hazards model was also used to analyze the effects of different covariates on the main girders.
The results of the parameter estimation show that the shape parameters of the Weibull distribution are all greater than 1, implying that the deterioration rate of the main girder increases with time. Based on the shape and scale parameters obtained from the Weibull distribution under each CR, the average service life of the main girder in Shanghai was predicted to be 87 years. Moreover, the COX model was used to analyze four covariates that all have different effects on the deterioration of the main girder: the area factor, structure factor, road factor, and position factor. Among them, the road factor and position factor had the most significant effects. In addition, the deterioration of the main girders was faster compared to the whole bridge and superstructure. In accordance with the analysis results of this study, bridge maintenance departments should pay more attention to the inspection and maintenance of branch roadside girders to reduce pressure on future bridge management.
Survival analysis based on bridge component data can provide useful insights into predicting the service life of bridges. In addition, when the amount of inspection data is large enough and the observation period is long enough, the method can be better applied to the prediction of the survival time of bridge components at the network level. At the same time, it can provide some basis for the optimization of bridge maintenance decisions and fund allocation. In this study, only the main girder data of the bridge superstructure was analyzed. There is a large amount of damage data for other components in the bridge management system database in Shanghai, which can be analyzed and studied for multiple components in the future to explore the patterns. Future research could also compare the deterioration patterns of bridge components in different countries, analyze the similarities and differences, and explore the reasons for them.

Author Contributions

Conceptualization and methodology, L.L.; experiments, data analysis, and writing—original draft preparation, Y.L.; writing—review and editing, L.L. and M.P. All authors have read and agreed to the published version of the manuscript.

Funding

This research received no external funding.

Data Availability Statement

Not applicable.

Acknowledgments

The authors would like to acknowledge the support and facilities provided by the Department of Civil Engineering, School of Mechanics and Engineering Science at Shanghai University to carry out the research.

Conflicts of Interest

The authors declare no conflict of interest.

References

  1. Mirzaei, Z.; Adey, B.T. Investigation of the use of three existing methodologies to determine optimal life-cycle activity profiles for bridges. Struct. Infrastruct. Eng. 2015, 11, 1484–1509. [Google Scholar] [CrossRef]
  2. Calvert, G.; Neves, L.; Andrews, J.; Hamer, M. Multi-defect modelling of bridge deterioration using truncated inspection records. Reliab. Eng. Syst. Saf. 2020, 200, 106962. [Google Scholar] [CrossRef]
  3. Archilla, A.R.; Destefano, P.D.; Grivas, D. Method for Estimating Transition Probability in Bridge Deterioration Models. J. Infrastruct. Syst. 1999, 4, 56–62. [Google Scholar] [CrossRef]
  4. Nurmuhametov, K.; Zinnurov, T.; Sadykov, D. Implementation of the Decision-Making Algorithm in the Bridge Management System. In Proceedings of the International Scientific Conference on Socio-Technical Construction and Civil Engineering, Kazan, Russia, 21–28 April 2021. [Google Scholar]
  5. Madanat, S.M.; Karlaftis, M.G.; Mccarthy, P.S. Probabilistic Infrastructure Deterioration Models with Panel Data. J. Infrastruct. Syst. 1997, 3, 4–9. [Google Scholar] [CrossRef]
  6. Medina, P.A.; González, J.L. Reinforced concrete long-term deterioration prediction for the implementation of a Bridge Management System. Mater. Today Proc. 2022, 58, 1265–1271. [Google Scholar] [CrossRef]
  7. Hawk, H.; Small, E.P. The BRIDGIT Bridge Management System. Struct. Eng. Int. 2008, 8, 309–314. [Google Scholar] [CrossRef]
  8. Stevens, N.A.; Lydon, M.; Marshall, A.H.; Taylor, S. Identification of Bridge Key Performance Indicators Using Survival Analysis for Future Network-Wide Structural Health Monitoring. Sensors 2020, 20, 6894. [Google Scholar] [CrossRef]
  9. Dekelbab, W.; Al-Wazeer, A.; Harris, B. History Lessons from the National Bridge Inventory. Public Roads 2008, 71, 30. [Google Scholar]
  10. Markiz, N.; Jrade, A. Integrating fuzzy-logic decision support with a bridge information management system (BrIMS) at the conceptual stage of bridge design. J. Inf. Technol. Constr. 2018, 23, 92–121. [Google Scholar]
  11. Bu, G.P.; Lee, J.H.; Guan, H.; Loo, Y.C.; Blumenstein, M. Prediction of Long-Term Bridge Performance: Integrated Deterioration Approach with Case Studies. J. Perform. Constr. Facil. 2015, 29, 04014089. [Google Scholar] [CrossRef] [Green Version]
  12. Bolukbasi, M.; Mohammadi, J.; Arditi, D. Estimating the Future Condition of Highway Bridge Components Using National Bridge Inventory Data. Pract. Period. Struct. Des. Constr. 2004, 9, 16–25. [Google Scholar] [CrossRef]
  13. Kong, J.S.; Frangopol, D.M. Life-Cycle Reliability-Based Maintenance Cost Optimization of Deteriorating Structures with Emphasis on Bridges. J. Struct. Eng. 2003, 129, 818–828. [Google Scholar] [CrossRef]
  14. Tabatabai, H.; Sobolev, K.; Ghorbanpoor, A.; Nabizadeh, A.; Lee, C.W.; Lind, M. Evaluation of Thin Polymer Overlays for Bridge Decks. In Proceedings of the Structural Faults and Repair Conference, Edinburgh, UK, 11 May 2018. [Google Scholar]
  15. Yang, D.Y.; Frangopol, D.M. Life-cycle management of deteriorating bridge networks with network-level risk bounds and system reliability analysis. Struct. Saf. 2020, 83, 101911. [Google Scholar] [CrossRef]
  16. Ibrahim, N.; Yunus, M.Z.M. Bridge monitoring and management system using GIS. IOP Conf. Ser. Mater. Sci. Eng. 2019, 527, 12076. [Google Scholar] [CrossRef]
  17. Wellalage, N.K.W.; Zhang, T.; Dwight, R. Calibrating Markov Chain–Based Deterioration Models for Predicting Future Conditions of Railway Bridge Elements. J. Bridge Eng. 2014, 20, 04014060. [Google Scholar] [CrossRef] [Green Version]
  18. Emoto, H.; Takahashi, J.; Widyawati, R.; Miyamoto, A. Performance Evaluation and Remaining Life Prediction of an Aged Bridge by J-BMS. Procedia Eng. 2014, 95, 65–74. [Google Scholar] [CrossRef] [Green Version]
  19. Li, C.Z. Development and application of Highway Bridge Management System (CBMS2000). J. Highw. Transp. Res. Dev. 2003, 20, 84–90. (In Chinese) [Google Scholar]
  20. Fang, Y.; Sun, L.J. Developing A Semi-Markov Process Model for Bridge Deterioration Prediction in Shanghai. Sustainability 2019, 11, 5524. [Google Scholar] [CrossRef] [Green Version]
  21. Huang, Y.H. Artificial neural network model of bridge deterioration. J. Perform. Constr. Facil. 2010, 24, 597–602. [Google Scholar] [CrossRef]
  22. Zayed, T.M.; Chang, L.M.; Fricker, J.D. Life-Cycle Cost Analysis using Deterministic and Stochastic Methods: Conflicting Results. J. Perform. Constr. Facil. 2002, 16, 63–74. [Google Scholar] [CrossRef]
  23. Morcous, G. Performance Prediction of Bridge Deck Systems Using Markov Chains. J. Perform. Constr. Facil. 2006, 20, 146–155. [Google Scholar] [CrossRef]
  24. Zambon, I.; Vidovic, A.; Strauss, A.; Matos, J. Condition Prediction of Existing Concrete Bridges as a Combination of Visual Inspection and Analytical Models of Deterioration. Appl. Sci. 2019, 9, 148. [Google Scholar] [CrossRef] [Green Version]
  25. Ng, S.K.; Moses, F. Bridge deterioration modelling using semi-Markov theory. In Proceedings of the Structural Safety and Reliability, Shiraishi, Shinozuka and Wen, Rotterdam, The Netherlands, 1 January 1998. [Google Scholar]
  26. Kleiner, Y. Scheduling Inspection and Renewal of Large Infrastructure Assets. J. Infrastruct. Syst. 2001, 7, 136–143. [Google Scholar] [CrossRef]
  27. Bortot, F.; Zonta, D.; Zandonini, R. A Bridge Management strategy based on future reliability and semi-markov deterioration models. In Proceedings of the 3rd International ASRA Net Colloquium, Glasgow, UK, 10–12 July 2006. [Google Scholar]
  28. Mauch, M.; Madanat, S. Semiparametric hazard rate models of reinforced concrete bridge deck deterioration. J. Infrastruct. Syst. 2001, 7, 49–57. [Google Scholar] [CrossRef]
  29. Mishalani, R.G.; Madanat, S.M. Computation of Infrastructure Transition Probabilities Using Stochastic Duration Models. J. Infrastruct. Syst. 2002, 8, 139–148. [Google Scholar] [CrossRef]
  30. Bu, G.P.; Lee, J.; Guan, H.; Blumenstein, M.; Loo, Y.C. Development of an integrated method for probabilistic bridge-deterioration modeling. J. Perform. Constr. Facil. 2014, 28, 330–340. [Google Scholar] [CrossRef] [Green Version]
  31. Cox, C.; Chu, H.; Schneider, M.F.; Munoz, A. Parametric survival analysis and taxonomy of hazard functions for the generalized gamma distribution. J. Stat. Med. 2010, 26, 4352–4374. [Google Scholar] [CrossRef]
  32. Ying, N.Y.; Kumaraswamy, M.M.; Pam, H.J.; Xie, H.M. Integrating semiparametric and parametric models in survival analysis of bridge element deterioration. J. Infrastruct. Syst. 2013, 19, 176–185. [Google Scholar] [CrossRef]
  33. Nakat, Z.S.; Madanat, S.M. Stochastic duration modeling of pavement overlay crack initiation. J. Infrastruct. Syst. 2008, 14, 185–192. [Google Scholar] [CrossRef]
  34. Madanat, S.; Park, S.; Kuhn, K. Adaptive Optimization and Systematic Probing of Infrastructure System Maintenance Policies under Model Uncertainty. J. Infrastruct. Syst. 2006, 12, 192–198. [Google Scholar] [CrossRef] [Green Version]
  35. Tabatabai, H.; Tabatabai, M.; Lee, C.W. Reliability of bridge decks in Wisconsin. J. Bridge Eng. 2011, 16, 53–62. [Google Scholar] [CrossRef]
  36. Loizos, A.; Karlaftis, M.G. Prediction of Pavement Crack Initiation from In-Service Pavements: A Duration Model Approach. Transp. Res. Rec. J. Transp. Res. Board 2005, 1940, 38–42. [Google Scholar] [CrossRef]
  37. Dehghan, A.; McManus, K.J.; Gad, E.F. Probabilistic Failure Prediction for Deteriorating Pipelines: Nonparametric Approach. J. Perform. Constr. Facil. 2008, 22, 45–53. [Google Scholar] [CrossRef]
  38. Nabizadeh, A.; Tabatabai, H.; Tabatabai, M.A. Survival Analysis of Bridge Superstructures in Wisconsin. Appl. Sci. 2018, 8, 2079. [Google Scholar] [CrossRef] [Green Version]
  39. Tabatabai, H.; Tabatabai, M. Survival Analyses for Bridge Decks in Northern United States. Civ. Environ. Eng. Fac. Artic. 2016, 7, 1–30. [Google Scholar]
  40. Agrawal, A.K.; Kawaguchi, A.; Chen, Z. Deterioration Rates of Typical Bridge Elements in New York. J. Bridge Eng. 2010, 15, 419–429. [Google Scholar] [CrossRef]
  41. Nasrollahi, M.; Washer, G. Estimating Inspection Intervals for Bridges Based on Statistical Analysis of National Bridge Inventory Data. J. Bridge Eng. 2015, 20, 04014104. [Google Scholar] [CrossRef]
  42. Manafpour, A.; Guler, L.; Radlinska, A.; Rajabipour, F. Stochastic Analysis and Time-Based Modeling of Concrete Bridge Deck Deterioration. J. Bridge Eng. 2018, 23, 04018066. [Google Scholar] [CrossRef]
  43. Hong, T.H.; Chung, S.H.; Han, S.W.; Lee, S.Y. Service Life Estimation of Concrete Bridge Decks. KSCE J. Civ. Eng. 2006, 10, 233–241. [Google Scholar] [CrossRef]
  44. Tabatabai, H.; Lee, C.W.; Tabatabai, M.A. Reliability of bridge decks in the United States. Bridge Struct. Assess. Des. Constr. 2015, 11, 75–85. [Google Scholar] [CrossRef] [Green Version]
  45. Liang, M.T.; Lan, J.J. Reliability analysis for the existing reinforced concrete pile corrosion of bridge substructure. Cem. Concr. Res. 2005, 35, 540–550. [Google Scholar] [CrossRef]
  46. Ministry of Housing and Urban-Rural Department of PRC. Technical Code of Maintenance for City Bridges (CJJ 99-2017); China Architecture Publishing & Media Co., Ltd.: Beijing, China, 2017. [Google Scholar]
  47. Wakchaure, S.S.; Jha, K.N. Determination of bridge health index using analytical hierarchy process. Constr. Manag. Econ. 2012, 30, 133–149. [Google Scholar] [CrossRef]
  48. Fereshtehnejad, E.; Hur, J.; Shafieezadeh, A.; Brokaw, B. Ohio Bridge Condition Index: Multilevel Cost-Based Performance Index for Bridge Systems. Transp. Res. Rec. J. Transp. Res. Board 2017, 2612, 152–160. [Google Scholar] [CrossRef]
  49. Solovyov, L.; Solovyov, A. Thermal Method in the Control of Fatigue Cracks in Welded Bridge Superstructures. Transp. Res. Procedia 2021, 54, 355–361. [Google Scholar] [CrossRef]
  50. Saeed, T.U.; Moomen, M.; Ahmed, A.; Murillo-Hoyos, J.; Volovski, M.; Labi, S. Performance Evaluation and Life Prediction of Highway Concrete Bridge Superstructure across Design Types. J. Perform. Constr. Facil. 2017, 31, 04017052. [Google Scholar] [CrossRef]
  51. Black, M.; Brint, A.T.; Brailsford, J.R. A semi-Markov approach for modelling asset deterioration. J. Oper. Res. Soc. 2005, 56, 1241–1249. [Google Scholar] [CrossRef]
  52. Fleischhacke, A.; Ghonima, O.; Schumacher, T. Bayesian Survival Analysis for US Concrete Highway Bridge Decks. J. Infrastruct. Syst. 2020, 26, 04020001. [Google Scholar] [CrossRef]
  53. Chen, L.P. Semiparametric estimation for cure survival model with left-truncated and right-censored data and covariate measurement error. Stat. Probab. Lett. 2019, 154, 108547. [Google Scholar] [CrossRef] [Green Version]
  54. Lee, E.T.; Go, O.T. Survival analysis in public health research. Annu. Rev. Public Health 1997, 18, 105–134. [Google Scholar] [CrossRef] [Green Version]
  55. Li, Y.; Li, L.; Ni, D.H. Comparative Univariate and Regression Survival Analysis of Lane-Changing Duration Characteristic for Heavy Vehicles and Passenger Cars. J. Transp. Eng. Part A Syst. 2022, 148, 04022109. [Google Scholar] [CrossRef]
  56. Thackham, M.; Ma, J. On maximum likelihood estimation of the semi-parametric Cox model with time-varying covariates. J. Appl. Stat. 2020, 47, 1511–1528. [Google Scholar] [CrossRef]
  57. Kohout, J. Three-parameter Weibull distribution with upper limit applicable in reliability studies and materials testing. Microelectron. Reliab. 2022, 137, 114769. [Google Scholar] [CrossRef]
  58. Li, L.; Li, F.; Chen, Z.; Sun, L.J. Use of Markov Chain Model Based on Actual Repair Status to Predict Bridge Deterioration in Shanghai, China. Transp. Res. Rec. 2016, 2550, 106–114. [Google Scholar] [CrossRef]
  59. Li, L.; Sun, L.J.; Ning, G.B. Deterioration Prediction of Urban Bridges on Network Level Using Markov-Chain Model. Math. Probl. Eng. 2014, 7, 728107. [Google Scholar] [CrossRef]
  60. Beng, S.S.; Matsumoto, T. Survival analysis on bridges for modeling bridge replacement and evaluating bridge performance. Struct. Infrastruct. Eng. 2012, 8, 251–268. [Google Scholar] [CrossRef] [Green Version]
  61. Dabous, S.A. A Decision Support Methodology for Rehabilitation Management of Concrete Bridges. Ph.D. Thesis, Concordia University, Montréal, QC, Canada, 2008. [Google Scholar]
  62. Martinez, P.; Mohamed, E.; Mohsen, O.; Mohamed, Y. Comparative Study of Data Mining Models for Prediction of Bridge Future Conditions. J. Perform. Constr. Facil. 2020, 34, 04019108. [Google Scholar] [CrossRef]
  63. Chen, Z. Research on Technology Structure of Transportation Infrastructure Management System. Ph.D. Thesis, Tongji University, Shanghai, China, July 2005. [Google Scholar]
  64. Bush, S.J.W.; Henning, T.F.P.; Raith, A.; Ingham, J.M. Development of a Bridge Deterioration Model in a Data-Constrained Environment. J. Perform. Constr. Facil. 2017, 31, 04017080. [Google Scholar] [CrossRef]
  65. Ministry of Housing and Urban-Rural Department of PRC. Code for Design of the Municipal Bridges (CJJ 11-2011); China Architecture Publishing & Media Co., Ltd.: Being, China, 2019. [Google Scholar]
Figure 1. Survival curve of the main girders in each CR.
Mathematics 10 04436 g001
Figure 2. The influence of different covariates on the survival curve. (a) area factor; (b) structure factor; (c) road factor; (d) position factor.
Mathematics 10 04436 g002
Figure 3. Effect of two factors on the life of the main girders. (a) road factor; (b) position factor.
Mathematics 10 04436 g003
Figure 4. Life prediction for whole bridge, superstructure, and main girder.
Mathematics 10 04436 g004
Table 1. Weighting values for bridge ratings in China (CJJ 99-2017).
Bridge TypeBridge PartsWeight
Girder bridgeDeck System0.15
Superstructure0.40
Substructure0.45
Table 2. Definition of bridge condition ratings in China (CJJ 99-2017).
RatingStateBCI ScoreMaintenance Recommendations
AIntact[90, 100]Routine maintenance
BGood[80, 90)Routine maintenance or minor repair
CQualified[66, 80)Minor repair
DBad[50, 66)Medium or major repair
EDangerous[0, 50)Major repair or reconstruction
Table 3. Number of inspection records of reinforced concrete main girders (2007–2020).
YearOverall Data RecordsValid Data Records
20071211841
200827312356
200926412276
201030032566
201129392582
201228892498
201331662708
201431032683
201531702730
201633422871
201732522779
201833132853
201933592764
202033322817
Total41,45135,324
Table 4. Grouping of main girder inspection records by data completeness.
CRComplete RecordsRight-CensoredLeft-Censored
A1898154589
B160267367
C131247735
D62310331
Table 5. Results of parameter estimation for the Weibull distribution.
CR η β Average ExpectationStandard Deviation
A29.2921.87826.00314.386
B25.0161.77122.26612.992
C22.2401.35820.37215.167
D20.4021.40218.59113.436
Table 6. Regression coefficient, HR, and confidence interval of HR (95%) of Cox model with different covariates.
VariableRegression CoefficientHRConfidence Interval of HR
Central Urban Area vs. Suburban−0.3180.728[0.624, 0.832]
Prestressed vs. Non-prestressed0.1511.163[1.071, 1.255]
Arterial Road vs. Branch Road−0.4450.641[0.495, 0.787]
Secondary Trunk Road vs. Branch Road−0.1240.884[0.779, 0.989]
Side Girder vs. Inner Girder0.3691.446[1.374, 1.518]
Publisher’s Note: MDPI stays neutral with regard to jurisdictional claims in published maps and institutional affiliations.

