1. Introduction
The COVID-19 pandemic came with much uncertainty that altered numerous economic projections. The uncertainty has affected many sectors of the US economy, with keen interest from policy makers. To contribute to this discourse, this study focuses on the nexus between COVID-19-induced uncertainty and manufacturing job postings in the United States. The manufacturing job market has become vulnerable during the pandemic. This is evident through the reduction in job advertisements and direct feedback from the sector demonstrated through permanent dismissal, temporary termination of employment, and a decline in hours of work and pay.
COVID-19 has caused unemployment across the world including Europe, where Italy, Spain and the United Kingdom were considered the worst affected [
1]. However, with approximately 1,069,757 deaths—16.2% of total COVID-19 deaths worldwide—the United States is the worst hit in terms of COVID-19 deaths [
2,
3]. Further, the US lost more work hours during the COVID-19 pandemic than the 28 European Countries combined [
4]. Further, global value chains were adversely affected in the US [
5]. In addition, the devastating effects of previous economic crises such as the 1930s Great Depression and 2007 Global Financial Crisis emanated from the US and spread to the rest of the world. Thus, economic crises and job market distortions in the US are of great relevance worldwide. Therefore, this study focuses on the dynamic nexus between COVID-19-related uncertainty and manufacturing job postings in the United States. Meanwhile, data for manufacturing job postings reflect labor demand for new workers. Consequently, they are a manifestation of the overall economy. Since its debut, the economic impact of the COVID-19 pandemic has attracted enormous policy and research attention. Many studies have considered the effect of the pandemic on labor market conditions worldwide. The initial strand of literature focused on the scale and magnitude of the impact of the pandemic [
6,
7]. For instance, it is estimated that 305 million full-time jobs were lost across the world in the second quarter of 2020 [
8]. It was also reported that the US economy lost approximately 22.1 million jobs in March 2020 [
9]. Albert et al. [
10] examined how the COVID-19 pandemic affected employment dynamics across states and sectors of the US. The study found that employment in mining, construction, and manufacturing fell by 12.1%, representing 2.6 million jobs, and the service sector fell by 15.1%, representing 19.8 million jobs.
Two channels are responsible for the decrease in manufacturing activities in the US during the pandemic. These channels are classified into the domestic channel through the lockdown and other restrictions imposed to curtail the spread of the virus, which invariably dampened demand and reduced supply across industries. Further, there is the international factor through the reliance of local production on foreign raw materials and other inputs. The manufacturing sector in the US largely depends on raw materials from other countries; if those countries experience severe lockdown, this will stop the flow of inputs and hinder the production process.
Moreover, the literature on COVID-19 and labor market dynamics is vast. For instance, the authors of [
11], using data from Emsi on online job postings during the pandemic in the US, found that the overall job posting for the economy decreased by 16%. Decomposing it to different sectors shows a 56% decline in oil and gas; a 40% drop in oil and gas; a 40% fall in the service sector; and the manufacturing sector had a weekly drop of 10% between March and April 2020. Similarly, the study in [
12] evaluates the impact of the COVID-19 pandemic on labor market in Canada. The resultant effect of the pandemic is evident in the increase in unemployment from 5.6% in the first quarter of 2020 to 13.7% in the second quarter. Specifically, the employment narration for medium food manufacturing as it relates to food and vegetables shows a decline for a short period. However, the decline was more severe in seafood. Further, fluctuations in employment in the agricultural food supply chain have been moderate. Overall, the GDP plummet by approximately 11.1% in the second quarter. Cho et al. [
13] utilize individual-level data and examine the impact of the COVID-19 pandemic on employment across US metropolitan areas using the difference-in-difference regression estimation. The study discovered that job losses were higher in large metropolitan areas but in non-metropolitan areas, the impact was less. These findings support the fact that most large manufacturing and business enterprises are located in large metropolitan areas, hence experiencing more job losses during the pandemic. Further, the rate of job losses spiked is attributed to firms changing their behavior to cope with the rules of mitigating the spread of the virus [
14].
However, the COVID-19 pandemic occurs in different episodes ranging from pre-lockdown, complete lockdown, discovery of vaccines, administration of vaccines and easing of lockdown and movement restrictions. Although these episodes are capable of changing the causal nexus between the pandemic and job market conditions, the extant literature on the COVID-19-labor market nexus did not consider this important feature of the relationship. It is imperative, therefore, to capture these episodes and identify exuberance in the causal nexus between the COVID-19 pandemic and job market conditions, especially in the US.
Therefore, this study evaluates the explosive behavior and Granger causality episodes in manufacturing job postings in the United States (JOBPUS) and COVID-19-induced uncertainty (COVIDEMV). This study provides answers to some fundamental questions in this regard. First, does the COVID-19-induced uncertainty and manufacturing job posting exhibit explosive behavior during the COVID-19 pandemic? Second, does the COVID-19-induced uncertainty have a causal effect on manufacturing job postings? Third, to what extent does the uncertainty associated with the pandemic prove contagious to manufacturing job postings? Forth, does the causality vary based on the episodes of the pandemic? Hence, this study contributes to the literature on COVID-19 uncertainty and labor market outcomes in the following ways: first, this study examine how the US reacts to the pandemic-induced uncertainty as it affects manufacturing job postings. Secondly, this study employs the novel COVID-19 uncertainty index conceived by [
15], which is composed of the daily number of newspaper articles bearing keywords such as pandemic, virus, lockdown, coronavirus, and epidemic. Thirdly, the estimation techniques used, unit root tests with explosive behavior and the time-varying causality enable us to identify episodes of explosive behavior and causality, as well as to discover if a peculiar causality exists between COVID-19 uncertainty and manufacturing job postings. This is important for the predictability of the job market dynamics in the United States, as it enables policy makers to make appropriate policy decisions about labor market fluctuations induced by the COVID-19 pandemic. This also has the advantage of allowing the identification of distinct periods where the COVID-19 uncertainty–manufacturing job posting causal relation is explosive. In addition, this study provides a basis for the accounting of explosivity (explosive behavior) and the instability of the causal nexus in the modelling of the job market conditions in the United States, particularly during pandemic-related crises. Many studies ([
16,
17,
18,
19,
20,
21]) have used Granger causality to evaluate the dynamic nexus between macroeconomic fundamentals, but none of them used time-varying Granger causality to examine the relationship between job postings in the United States and COVID-19-induced uncertainty considered in this study. Further, the previous studies failed to consider different episodes of causality among the variables. Meanwhile, the Granger causality varies with different sample periods and instability [
8].
Although the nexus between COVID-19 and job market conditions attracted many scholars, the issue of explosivity and time-varying causality between the pandemic and the job market conditions have not been considered in the literature. Thus, this study fills the research gap by examining the explosive behavior and Granger causality episodes in manufacturing job postings in the United States (JOBPUS) and COVID-19-induced uncertainty.
2. Materials and Methods
The methodology of this study involves the following two steps: (1) unit root tests with the explosive behavior of the series and (2) calculating time-varying Granger causality as discussed below. The main advantage of these methods over others techniques is that the techniques used is this study involve the use of lag-augmented VAR (LA-VAR), which does not require the variables to be stationary—it can provide valid estimates with non-stationary series, and can solve the problem of non-linearity and multiple structural breaks, which diminishes the discriminatory power of extant unit root tests and Granger causality tests, especially when a period of instability, such as the COVID-19 period, is considered [
22,
23,
24]. These desirable properties make the methods used in this study the most appropriate for this study. The methods can also detect exuberances emanating from difference sources including the explosive behavior-induced fluctuation of the macroeconomic variables under consideration [
25]. Due to these desirable features of the methods, several studies [
26,
27,
28,
29,
30,
31,
32,
33] have used them to evaluate the relationship and characteristics of numerous time-series variables. However, the disadvantage is that the techniques do not perform well for short series, and do not provide the graph for more than 600 observations [
23,
34,
35].
2.1. Test for Explosivity
The econometric procedure in this study started with the identification of the explosive behavior of the variables because the sample period is a period of instability, crisis, and distress due to the COVID-19 pandemic. The methods rely on the theoretical framework provided by [
34,
36], and the empirical findings of [
37]. Thus, this study used the estimation procedure in [
37] for testing the unit root with explosive behavior to identify crises in the series. The procedure was based on the recursive rolling window developed by [
38], which is more efficient, especially in the presence of bubbles over the sample period. The test can be conducted for observations ranging from r
0 to 1, with recommended r
0 =
, where
T is the total number of observations in the data (sample length). Assuming r is the interested observation, the authors of [
36] estimate the Augmented Dickey–Fuller (ADF) accordingly by backward expanding the sample sequence. Suppose the start and the end points of the sample are
and
, respectively,
will be the calculated as the ADF statistic from the sample. Following [
37], the following ADF regression equation is estimated for the test.
where
represents the time series of interest at time
t (daily manufacturing job postings, and the daily infectious disease equity market volatility index (EMVID) used to measure COVIDEMV). The
is the lag operator, p denotes the maximum number of lags of the dependent variable;
symbolize the starting and ending points considered for the estimation, respectively;
denotes the stochastic error term. The null and alternative hypothesis are as follows.
Null hypothesis (): (there is unit root)
Alternative hypothesis (): (explosive behavior)
Based on this framework, the study in [
34] calculates two statistics. The first is the right-tailed ADF statistic, which is based on the full sample (
and denoted by
, The second statistic is the right-tailed supremum t-statistic of the forward recursive window, which is symbolized by
and expressed in Equation (2) as follows.
However, the authors of [
36] submit that the forward recursive approach is efficient in identifying the first bubble but cannot identify the subsequent episodes of explosive behavior when there are several bubbles. Hence, the authors of [
36] developed the generalized supremum ADF (GSADF), which allows varying the start point to point
, with a range (0,
), and varying the end point, ranging from
to 1. The GSADF is mathematically expressed in Equation (3) as follows.
To identify episodes of explosive behavior, the authors recommended the backward expanding SADF statistic, which allows a varying starting point
, with a range (0,
), and fixed ending point of all samples on the interested observation, such that
. The backward expanding SADF statistic is defined as:
These statistics are compared with critical values and bootstrap critical values computed by [
38,
39] to evaluate the explosivity of US manufacturing job postings and the COVIDEMV time series considered in this study.
2.2. The Time-Varying Granger Causality Test
This study further employs the time-varying Granger causality test to evaluate the causal relationship between daily manufacturing job postings and daily EMVID used to measure COVIDEMV. Time-varying Granger causality involves three test procedures—forward-expanding [
21], rolling and the recursive rolling window, also known as the evolving procedure developed by the authors of [
36] and practicalized by the authors of [
39,
40]. In this study, all three procedures are estimated together, adopting the corrective bootstrap algorithm process described in the following steps.
Step 1: Estimation begins with a bivariate vector autoregressive —VAR(1) model specified in matrix form as follows:
The and represent COVIDEMV and manufacturing job postings, respectively. The coefficients are represented by and , with their estimates symbolized by and , respectively. The residuals are and while and denote the estimated residuals, respectively. The null hypothesis is that there is no causality from (manufacturing job postings) to (manufacturing job postings), and from to in the first and second step, respectively. This study focused on the causal relationship between COVIDEMV and manufacturing job postings because COVID-19 is an exogenous phenomenon (global health challenge), which is not caused by job market dynamics. Thus, the first part of the null hypothesis suffices in the current study.
Step 2: The second step involves the generation of the bootstrap sample. Let
denote the sample size of the bootstrapped data series, where
and
. Hence, the bootstrap sample is generated as follows.
The and are drawn from the estimated residuals and with replacement, while the and are used to obtain the initial values of the bootstrap series.
Step 3: In the third step, the and (bootstrap series) are used to compute the sequences of the three test statistics viz.
The forward-expanding window: ; the rolling window ; and the recursive evolving window . The forward and the rolling window algorithm are based on Wald statistics while the recursive algorithm is made up of supremum norm of a set of Wald statistics for each observation considered. Therefore, the maximum values of each of the test statistics are expressed as follows.
The forward-expanding window [
21]:
The supremum norm of the sequence of the supremum norm Wald test is symbolized by .
Step 4: This step involves the repetition of the above steps up to a total of times.
Step 5: This is the last step, which entails the computation of the critical values (90%, 95%, and 99%) for the forward-expanding and rolling-window procedures, and Wald statistics as the corresponding 90th 95th and 99th percentiles of the bootstrap statistics estimated in step 4.
The procedure is implemented in this study with the use of the tvgc command in STATA. The estimates are used to evaluate the causal nexus between COVIDEMV and manufacturing job postings in the United States.
2.3. Data
The data for the two variables (COVIDEMV and manufacturing job postings) considered in this study are daily data starting from 1 February 2020 to 28 May 2022. The period is chosen to capture the period of the novel COVID-19 pandemic. COVIDEMV is measured by the daily infectious disease equity market volatility tracker index (EMVID) computed by [
15]. The EMVID is constructed from news-based uncertainty by counting infectious disease -related keywords such as pandemic, flu, disease, and coronavirus from approximately 300 newspapers in the United States. The index computed is normalized by the total number of articles submitted to the newspapers each day.
The COVID-19 pandemic disrupted production and led to the loss of jobs in the manufacturing sector globally, and the United States was amongst the countries that experienced the most severe contraction in its economy. Thus, this study used daily job postings (advertisement) in the US manufacturing sector during the COVID-19 pandemic. The data on job postings were sourced from the real-time intelligence (RTI) from Chumura Economics & Analytics, which is updated daily. The data were obtained from a collection of online job advertisements of over 15,000 sources (companies). Job postings were analyzed and grouped into different categories including occupations, job titles, skill requirements, locations, wages, and education levels. The RTI job postings data have been considered good and comprehensive indicators of the overall labor market conditions in the United States, and are strongly correlated (approximately 0.8 correlation coefficient) with data on total employment developed by the Bureau of Labor Statistics [
41]. Although job advertisements are not a perfect substitute for employment and wages, they signal the labor market conditions in a timely manner, which was especially true during the COVID-19 pandemic, when the labor market experienced rapid changes in employment and wages.
3. Results
3.1. Statistical Properties
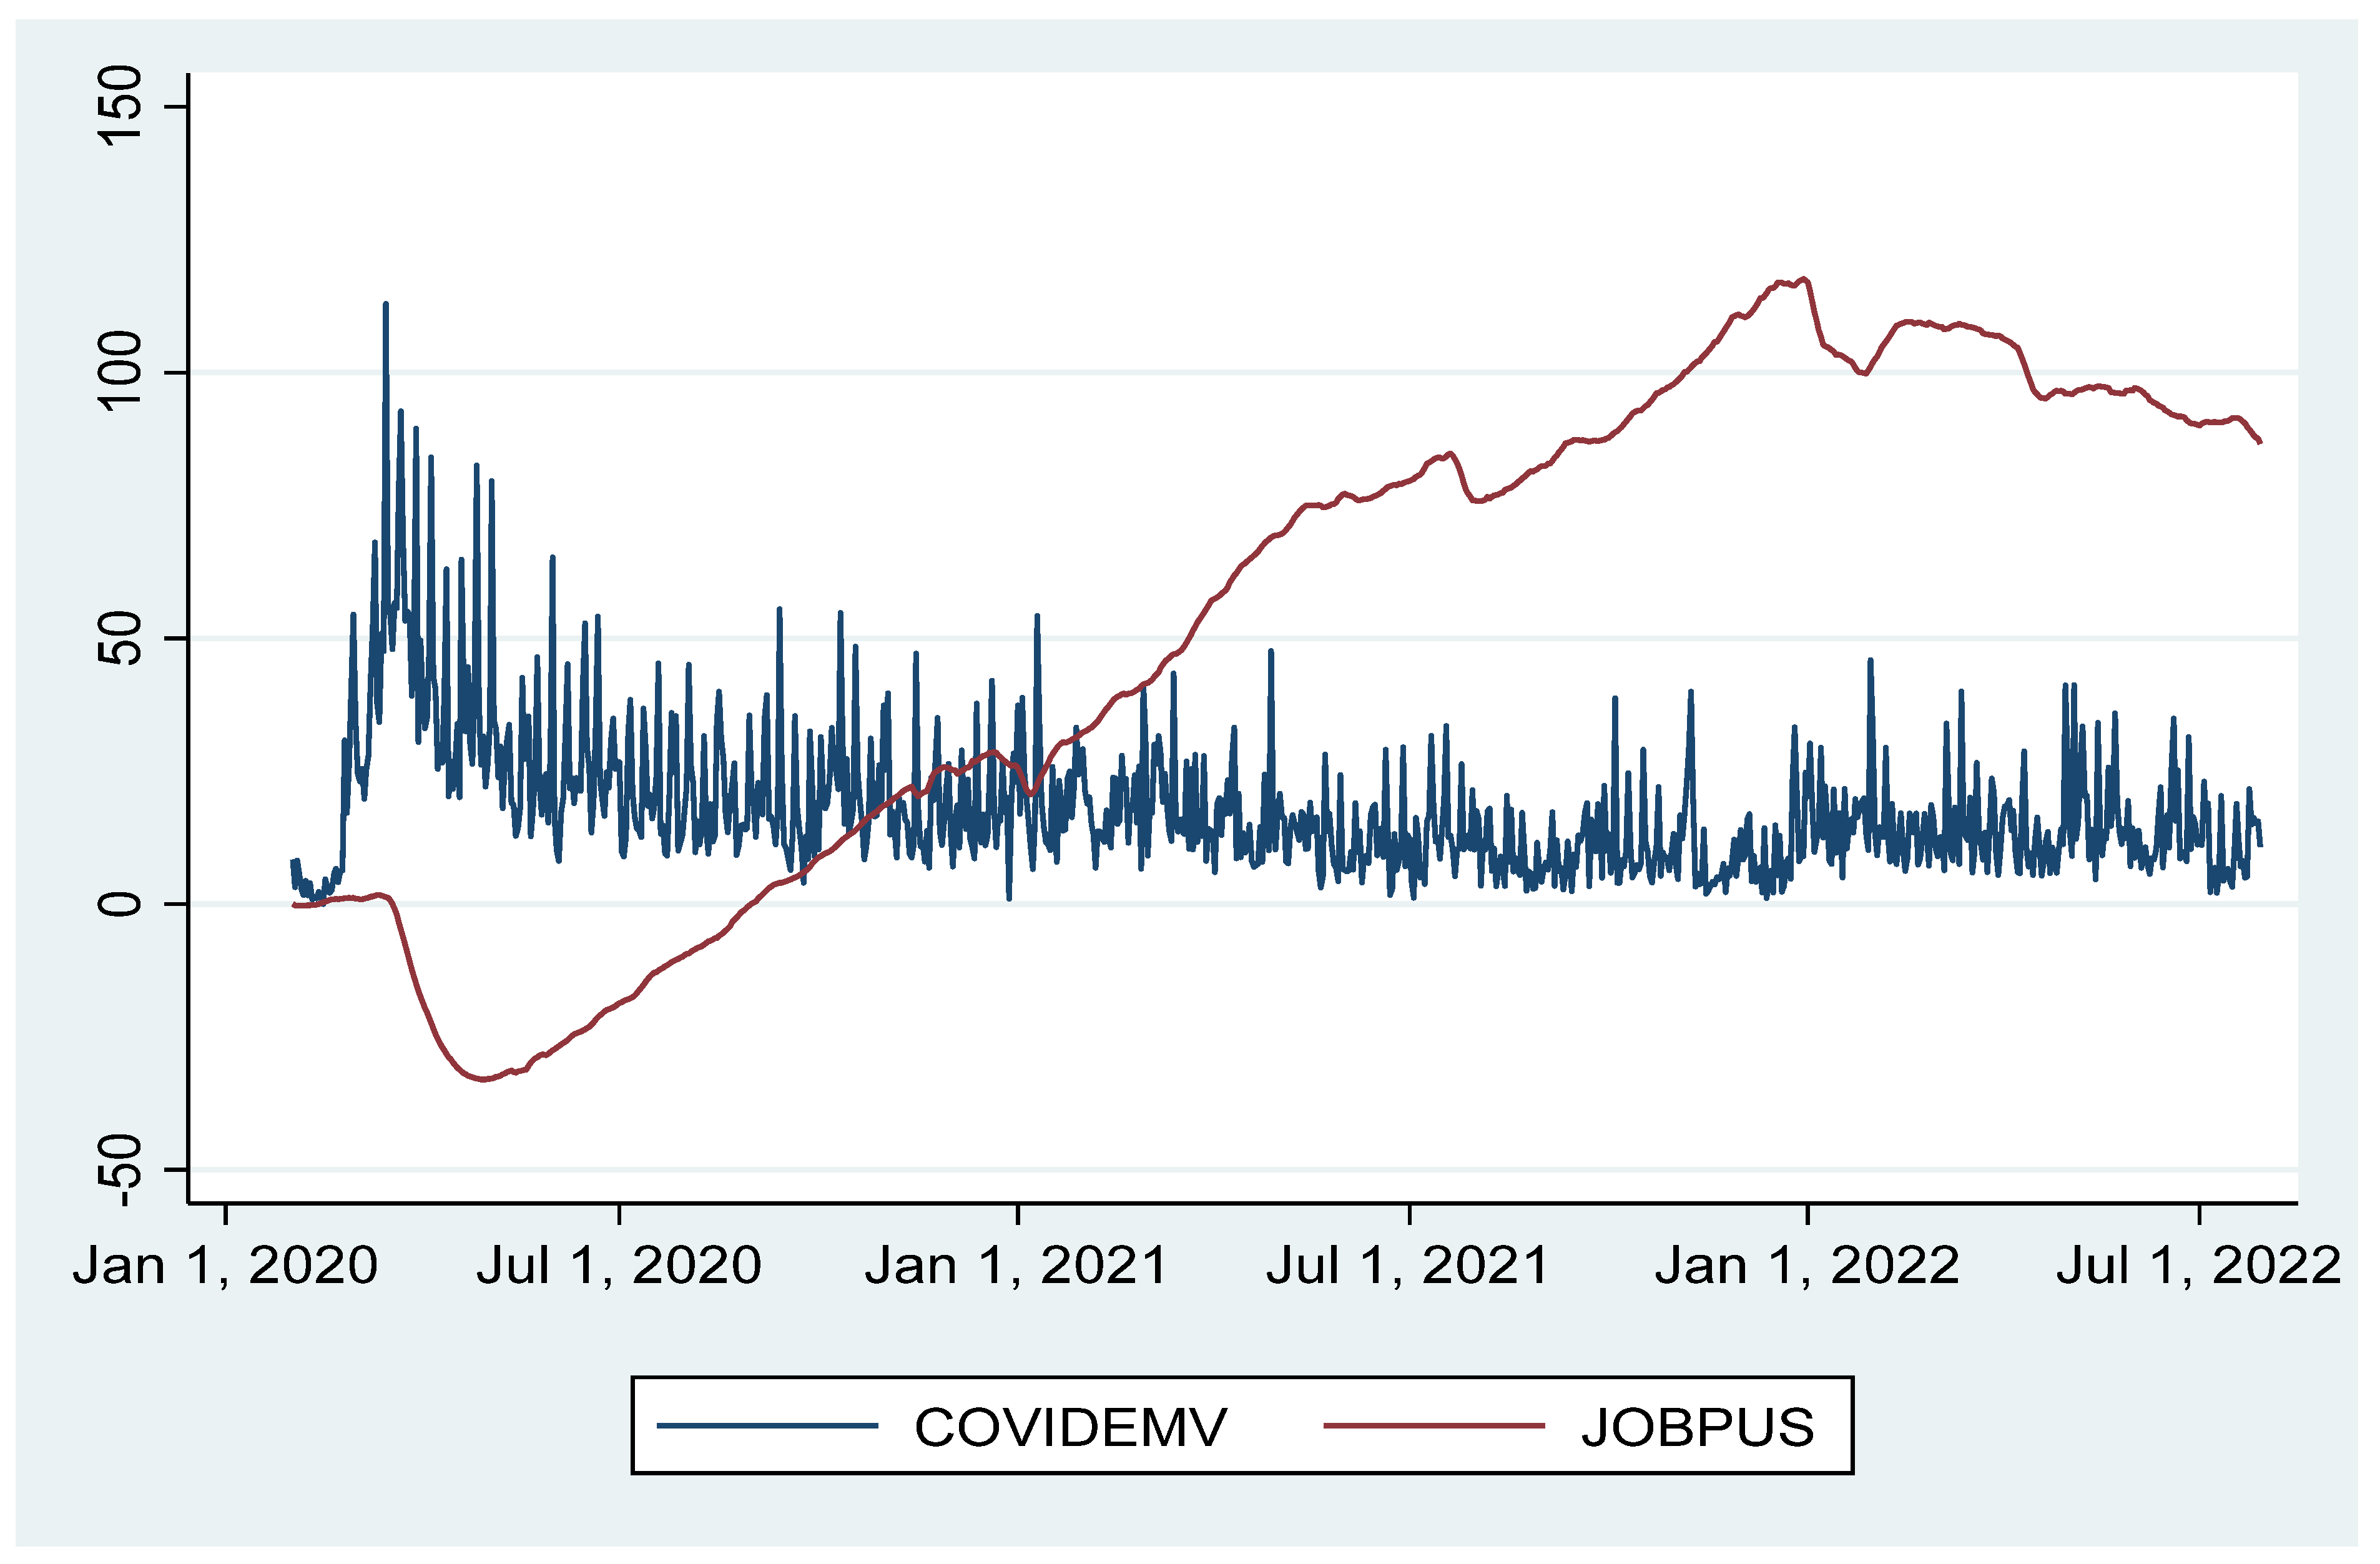
Table 1 presents the statistical properties of daily manufacturing job postings (JOBPUS) and daily EMVID used to measure COVID-19-induced uncertainty (COVIDEMV). The standard deviations of both JOBPUS (47.499) and COVIDEMV (13.117) are large (greater than 2), indicating that both experienced substantial fluctuations during the period considered. The minimum and maximum statistics and the percentile also revealed a wide range of variations in the series. The skewness indicates that JOBPUS is negatively skewed, while COVIDEMV is positively skewed. The kurtosis of JOBPUS is less than 3, while the kurtosis of COVIDEMV is greater than 3. This indicates that JOBPUS is platykurtic while COVIDEMV is leptokurtic. The null hypothesis of the Jarque-Bera normality test is rejected for both variables, indicating that the variables are not normally distributed. This is also shown by the graphical illustration of the two variables in
Figure 1. The plot demonstrates that COVIDEMV increased at the beginning of the COVID-19 pandemic and later stabilized after January 2021, when restrictions were eased, and the discovery and administration of COVID-19 vaccines began. However, JOBPUS at first decreased drastically until approximately December 2020, when it started rising rapidly. The JOBPUS also slightly declines after approximately January 2022, probably due to the discovery of the Delta and Omicron variants of the COVID-19 virus. Thus, it is crucial to model these significant dynamics in the two variables by examining their explosivity and the causal nexus—a task considered in this study.
This study first applied the SADF and the GSADF tests to the explosivity of daily manufacturing job postings, and COVIDEMV for the full sample. This current study further tested the hypothesis that the series has a unit root against the alternative hypothesis that the variables exhibit explosive behavior over the period considered using the default settings of the radf command in STATA.
Table 2 contains the results of the tests for the unit root and explosive behavior of the two variables considered in this study. The results contain the statistics alongside right-tailed critical values for the 10%, 5%, and 1% levels of significance [
38]. From
Table 2, the SADF and the GSADF statistical estimates of JOBPUS for the full sample are 1.328, and 4.6593, respectively. The SADF statistic is greater than the critical values at a 10% level of significance while the GSADF statistic exceeds the right-tailed tabulated critical values with a 99% confidence level. This provides clear evidence for the rejection of the null hypothesis. Thus, JOBPUS exhibits explosive behavior during the COVID-19 pandemic.
For COVIDEMV, the SADF and GSADF statistics are less than the right-tailed tabulated critical values for a 90% confidence level. Thus, there is not enough statistical evidence to reject the null hypothesis. It is observed that COVIDEMV does not exhibit explosive behavior during the period considered. The result of the BSADF statistic with 199 bootstrap replications in
Table 3 and that of the subsamples of last 600 and first 600 observations in
Table 2 revealed the same conclusion that JOBPUS exhibits explosive behavior while COVIDEMV does not. In other words, there is evidence of bubbles in the JOBPUS data for the sample period.
Furthermore, the changes in the explosive behavior of the variables were examined by date stamping the sequence of the SADF and BSADF statistics, as presented in
Figure 2 and
Figure 3 for JOBPUS and COVIDEMV, respectively. The plots compared the SADF and BSADF statistics with the right-tailed tabulated critical values for the 10% and 5% levels of significance. From
Figure 3, there is no single episode of explosive behavior for COVIDEMV because the SADF and BSADF statistics are below the critical values throughout the period. For JOBPUS,
Figure 2 displays several subperiods of explosive behavior (exuberance). Therefore, this study identified several episodes of bubbles (crisis) for JOBPUS across the sample period. This is indicated by the portions of the plot where the SADF and BSADF statistics exceed the critical values. The subperiods reflect important timelines in the history of COVID-19 worldwide and in the United States particularly. The timelines include when the COVID-19 deaths in the US exceeded 100,000 for the first time in 28 May 2020, as well as after the presidential election and after Halloween celebrations (November 2020), which resulted in a significant spike in COVID-19 cases and deaths in the country.
3.2. Time-Varying Granger Causality—Full Sample Analysis
The result in
Table 4 is the estimates based on the full sample obtained from the supremum norms of the sequence of the Wald test statistics of the forward-expanding and rolling window algorithms, as well as the supremum norm of the Wald statistics of the recursive evolving algorithm. The statistics are the results of the time-varying Granger causality test, which was used to evaluate the causal nexus between COVIDEMV and manufacturing job postings in the United States. The estimates of the three tests—the forward-expanding, the rolling and the recursive evolving windows—are reported in column 1, 2, and 3, respectively. The estimates are robust to heteroscedasticity and the first difference (d = 1) was used because the result of the unit root test shows that JOBPUS is integrated to an order of one. The null hypothesis for the test is that there is no evidence of Granger causality at any point in the whole sample between manufacturing job postings (JOBPUS) and COVIDEMV (COVIDEMV). Thus, the alternative hypothesis in Panel A is that COVIDEMV Granger causes (GC) JOBPUS while the reverse is presented in Panel B as the alternative hypothesis.
The maximal Wald statistics of all three algorithms show that the null hypothesis that COVIDEMV does not Granger cause job postings at any point in the entire sample is rejected at the 90% significance level for the forward-expanding window and at the 99% significance level for the rolling window and recursive evolving window, respectively. This is indicated by the robust test statistics—maximal Wald statistics—which are greater than the percentiles of the test statistics. Thus, job market conditions in the United States, represented by manufacturing job postings, Granger caused COVIDEMV at some points in the period considered in this study. In short, COVIDEMV affects manufacturing job market conditions in the United States.
This study further tested the null hypothesis that job postings (JOBPUS) does not Granger cause COVIDEMV (COVIDEMV) and presented the estimates in Panel B. The results indicate the rejection of the null hypothesis for all three test statistics. The estimates of the forward-expanding (13.673), rolling (44.985), and the recursive evolving (46.997) are greater than the percentile of test statistics at the 95th and 99th percentiles, respectively. This suggests the rejection of the null hypothesis and revealed that job postings (JOBPUS) Granger caused COVIDEMV at some points in the sample period. This means that the dynamics of COVIDEMV can be predicted by the job market. Put differently, the job market conditions contribute to the uncertainty induced by the COVID-19 pandemic over the period considered.
Therefore, the results of the time-varying Granger causality test indicate a bidirectional causality between COVIDEMV and manufacturing job postings (JOBPUS) in the United States. The results reveal a causal effect running from the job market to COVIDEMV, and vice versa. However, the greater the test statistics, the greater the effect of the variables. So, the estimates show that Panel B contains higher values of the test statistics than Panel A. This demonstrates that the effect of job postings (JOBPUS) on COVIDEMV is less than the effect of COVIDEMV on job postings (JOBPUS). The causality running from COVIDEMV to job postings (JOBPUS) is greater than the causality running from job postings (JOBPUS) to COVIDEMV.
3.3. Date Stamping
Time-varying Granger causality shows the evidence of bidirectional causality between job postings (JOBPUS) and COVIDEMV. Thus, the current study further date stamps the causality to examine how the causal relationship between the variables changes during the sample period. This is achieved by plotting the sequence of the test statistics of the forward, rolling, and recursive evolving algorithms. The sequence of the test statistics is plotted alongside the 90th and 95th percentiles of the empirical distribution to examine the statistical significance of the statistics at any point in time. Causality is said to occur when the sequence of the statistics is greater than the 90th or 95th percentiles. Concerning the causality running from job postings (JOBPUS) to COVIDEMV presented in
Figure 4, all three algorithms (forward, rolling, and recursive evolving) established clear evidence of an unstable causal relationship between the two variables. In other words, the result reveals a number of causal episodes, and periods of non-causality during the sample period. For instance, in
Figure 5, Panel A, the forward window shows 3–20 March 2021, 29 April 2021–15 May 2021, 1 June 2021, 10–14 July 2021 and 28 January 2022–30 March 2022 as the five episodes of Granger causality running from COVIDEMV to JOBUS. For the rolling window algorithm, four (4) episodes of causality are identified—25–28 January 2021; 11 February 2021–21 March 2021; 16 September 2021; and 12–13 May 2022. The recursive evolving algorithm also stamped 28–29 January 2021, 8 February 2021–4 June 2021, 16–20 September 2021 and 5 March 2022–22 July 2022 as the periods when COVIDEMV Granger caused JOBUS during the sampled period.
Moreover, the forward window in Panel A of
Figure 5 shows two episodes of causality running from job postings (JOBPUS) to COVIDEMV. The first occurs between 15 November 2020 and 21 November 2020 while the second started in January 9, and continued to the end of the sample in 29 July 2022. Similarly, the recursive evolving algorithm displayed in Panel C of
Figure 5 revealed up to five (5) episodes in which JOBUS Granger caused COVIDEMV. The first lasted for two days each (28–29 May 2020) and the second occurred between 16 November 2020 and 28 November 2020. The third episode also lasted for two days (19–20 March 2021) while the fourth causal episode started on 22 April 2021 and ended on 27 April 2021. The final episode was observed between September 26, 2021, and 6 October 2021. In the case of the recursive evolving, 28 May 2020–13 June 2020 marked the first episode of Granger causality from JOBUS to COVIDEMV while the second and the third episodes covered 15 November 2020–5 December 2020 and 19 March 2021–27 April 2021, respectively. The last episode started on 27 September 2021, to the end of the sample (29 July 2022). These show that there are many other periods within the sample when the two variables do not Granger cause each other. That is, there are periods during which the neutrality of the variables is established. Thus, the Granger causality during the COVID-19 pandemic is unstable and requires date stamping to identify the periods of causal relationship between the variables.
It is important to note that these episodes of the causal nexus between the variables coincide with critical timelines in the history of the COVID-19 pandemic worldwide and in the United States particularly. For example, 28 May 2020, which is identified as the first episode of causality between JOBUS and COVIDEMV, is the date on which the United States recorded a death toll of over 100,000 people for the first time during the COVID-19 pandemic. Further, the United States experienced a spike in COVID-19 cases and deaths in November 2020, which was when the presidential election took place and again on 15 November 2020, which marked two weeks after Halloween celebrations. By December 2020–January 2021, after the discovery of COVID-19 vaccines and when the vaccination program was started, and thus the period marked the end of the second episodes of causality between the variables. However, conspiracy about the efficacy of the AstraZeneca Vaccines and strict restrictions started on 18 March 2021, which is stamped as the third episode of the Granger causality. Finally, the discovery of the Delta and the Omicron variants of the COVID-19 could explain the resurgence of the causal nexus between the variables, which lasted to the end of the sample considered in this study. Therefore, the dates identified by the date stamping of the Granger causality between job manufacturing job postings in the United States (JOBPUS) and COVIDEMV have empirical backing in the significant timelines in the history of the COVID-19 pandemic in the United States and worldwide.
4. Discussion
This study evaluated the explosive behavior and Granger causality episodes in manufacturing job postings in the United States and COVIDEMV. This study applied the novel SADF and GSADF unit root tests with explosive behavior, and the novel time-varying Granger causality test for a sample period ranging from 1 January 2020 to 29 July 2022—during the COVID-19 pandemic. This study also examined the presence of explosivity and causality between the variables. Further, this study used date stamping to identify the subperiods of the explosive behavior and causality. The findings revealed that manufacturing job postings in the United States exhibit explosive behavior, with several episodes of exuberance (bubbles) across the sample period. On the other hand, COVIDEMV does not exhibit explosivity during the period.
However, the results of the causality provide evidence of bidirectional causality between job postings and COVIDEMV. The findings further revealed several episodes of causality running from each variable to the other. These findings support the submission of [
44] who provided evidence of significant temporal variations in the causal nexus between the United States industrial production, income and money supply. Similarly, the study in [
25] identified temporal instability in the oil and gas market by detecting common periods of explosivity and bilateral causality between oil prices and gas prices during the COVID-19 pandemic. Similarly, the findings of this study are in tandem with the submission of [
27,
28], the authors of which argued that the adverse effect of COVID-19-induced uncertainty on the overall economy, and the tourism and hospitality sector in the US, varies by subsample periods, and the causal nexus exhibits temporal instability. Thus, explosivity (explosive behavior) and the instability of time-series variables are important features that must be captured in examining the causal relationship between macroeconomic variables [
39,
44].
The findings of this study are plausible because the episodes of the exuberance (explosivity) and causality coincide with significant episodes in the history of the COVID-19 pandemic worldwide and in the United States particularly. This occurs during periods such as May 2020, which marks when United States recorded a COVID-19-related death toll of over 100,000 people for the first time during the COVID-19 pandemic. Further episodes reflect when the United States experienced a spike in COVID-19 cases and deaths in November 2020 due to the presidential election and after Halloween celebrations, with substantially increases in COVID-19 cases across the United States.
In addition, after the discovery of the COVID-19 vaccines and after the vaccination program was started, as well as after the conspiracy about the efficacy of the vaccines spread and strict restrictions are periods that are also equally reflected in our findings. Finally, the discovery of the Delta and the Omicron variants of the COVID-19 dictates the explosion of the causal nexus between the variables which lasted to the end of the sample. Therefore, the dates identified by the date stamping of the Granger causality between job manufacturing job postings in the United States (JOBPUS) and COVIDEMV provided interesting empirical insights concerning the job market conditions in the United States during the COVID-19 pandemic.
5. Conclusions
This study applied novel unit root tests with explosive behavior and the novel time-varying Granger causality test for a sample period ranging from 1 January 2020 to 29 July 2022. Further, this study used date stamping to identify subperiods of the explosive behavior and causality. This study revealed that manufacturing job postings in the United States exhibit explosive behavior, with several episodes of exuberance (bubbles) across the sample period while COVID-19-induced uncertainty does not exhibit explosivity during the period. However, the results of the causality provide evidence of bidirectional causality, with several episodes between the variables.
Therefore, the time-series characteristics of the manufacturing job market conditions and its causal nexus with COVIDEMV largely depend on the intensity of the distress, crisis and instability caused by the pandemics. Hence, explosivity (explosive behavior) and the instability of the causal nexus should be accounted for when modelling the job market conditions in the United States, particularly during pandemic-related crises.
However, the limitation of this study is the use of only the US job market for this study. Further studies can consider a panel of countries or conduct a comparative analyses of the nexus between COVID-19-induced uncertainty and labor market conditions across the world.


 ,
, 


