
The Effect of Music Listening on EEG Functional Connectivity of Brain: A Short-Duration and Long-Duration Study


Abstract
:1. Introduction
2. Materials and Methods
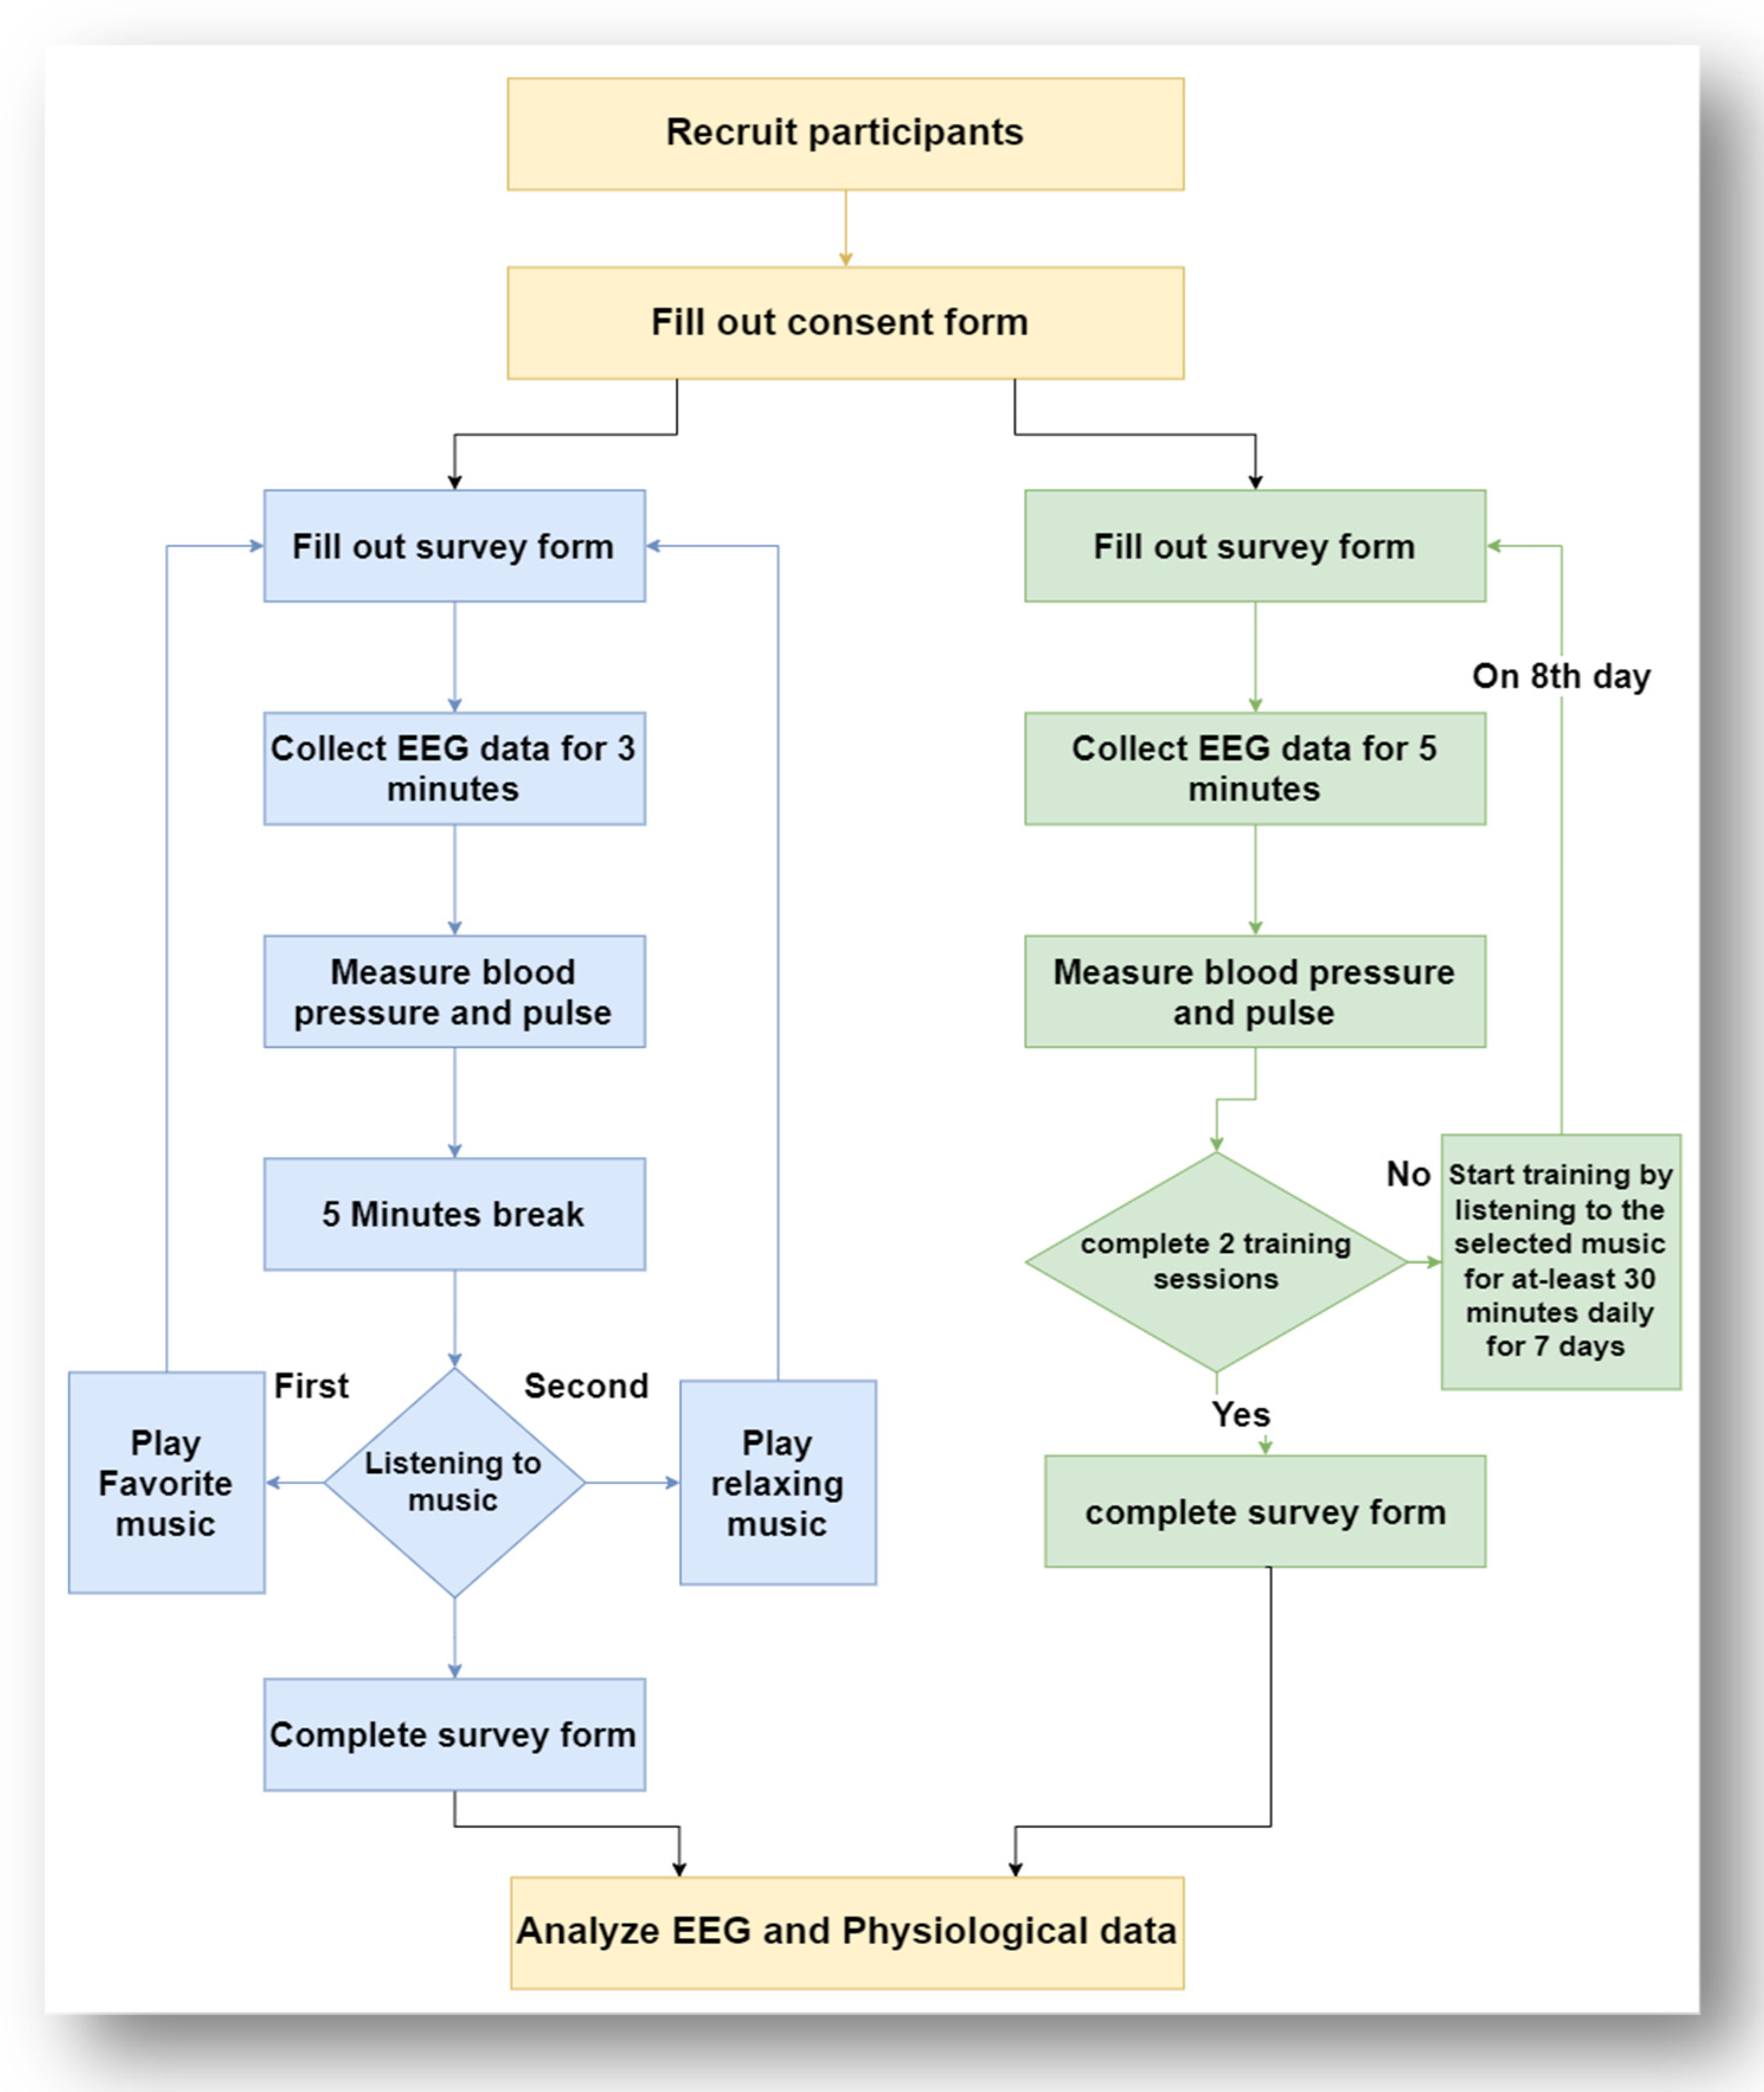
2.1. Experiment Design
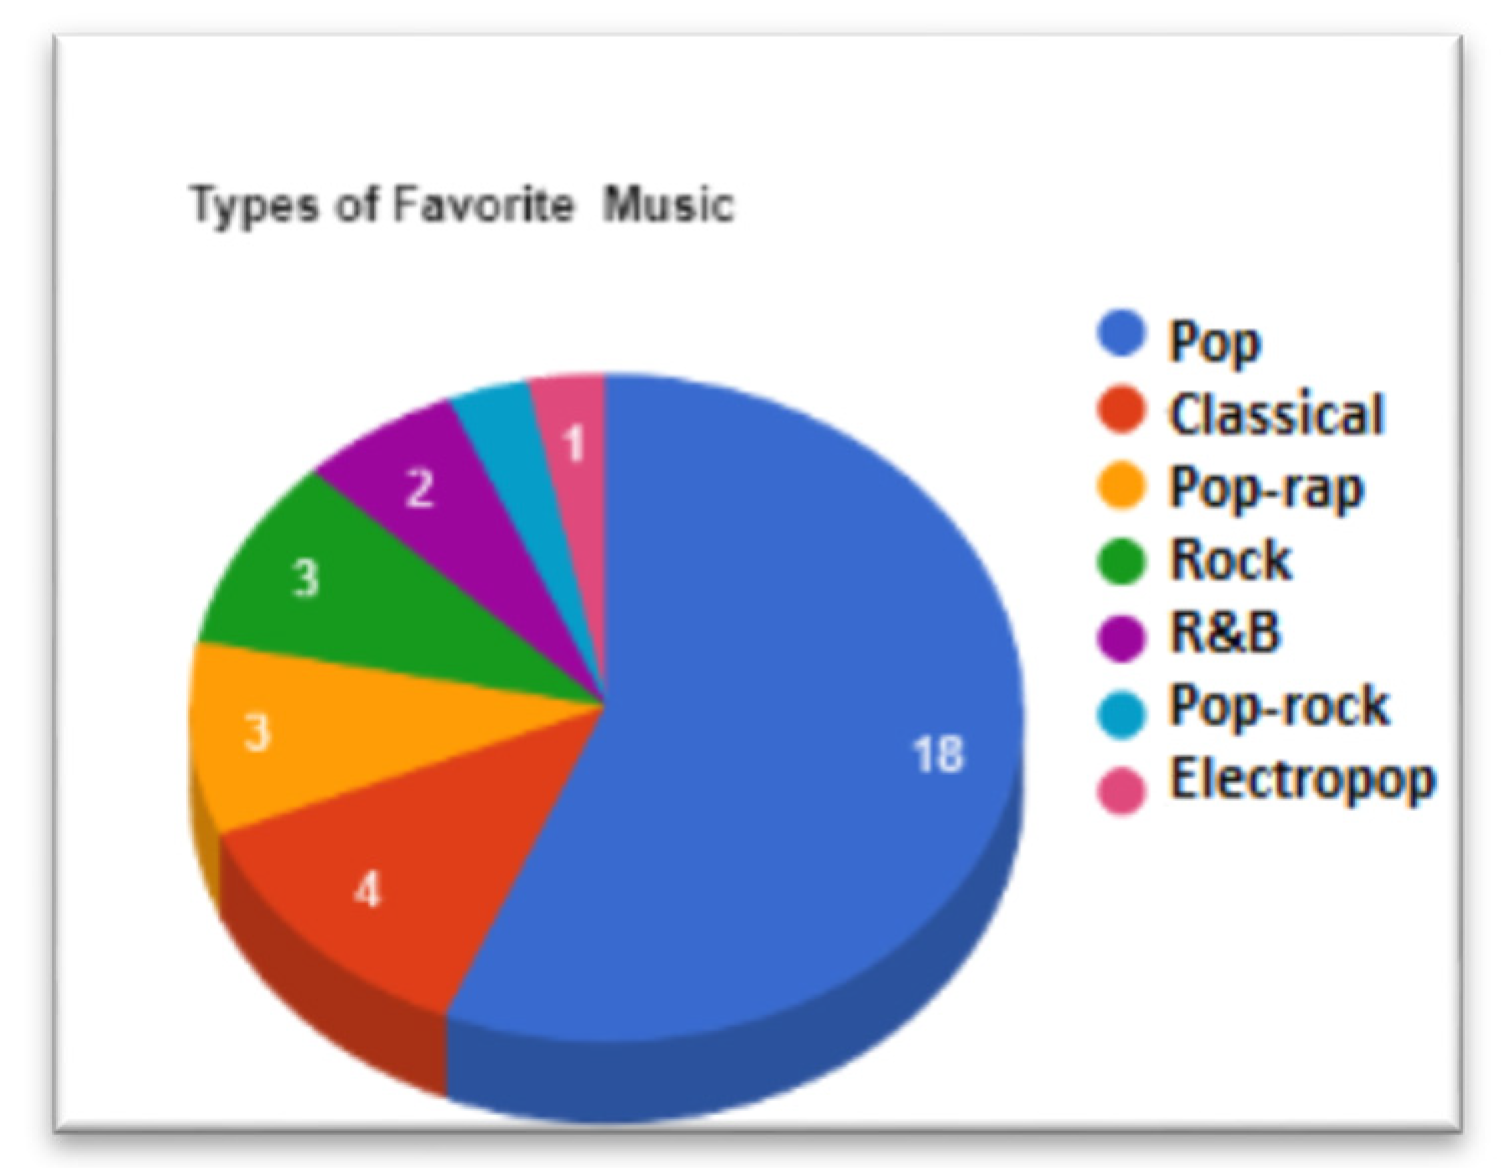
2.2. Music Stimuli
2.3. Participants
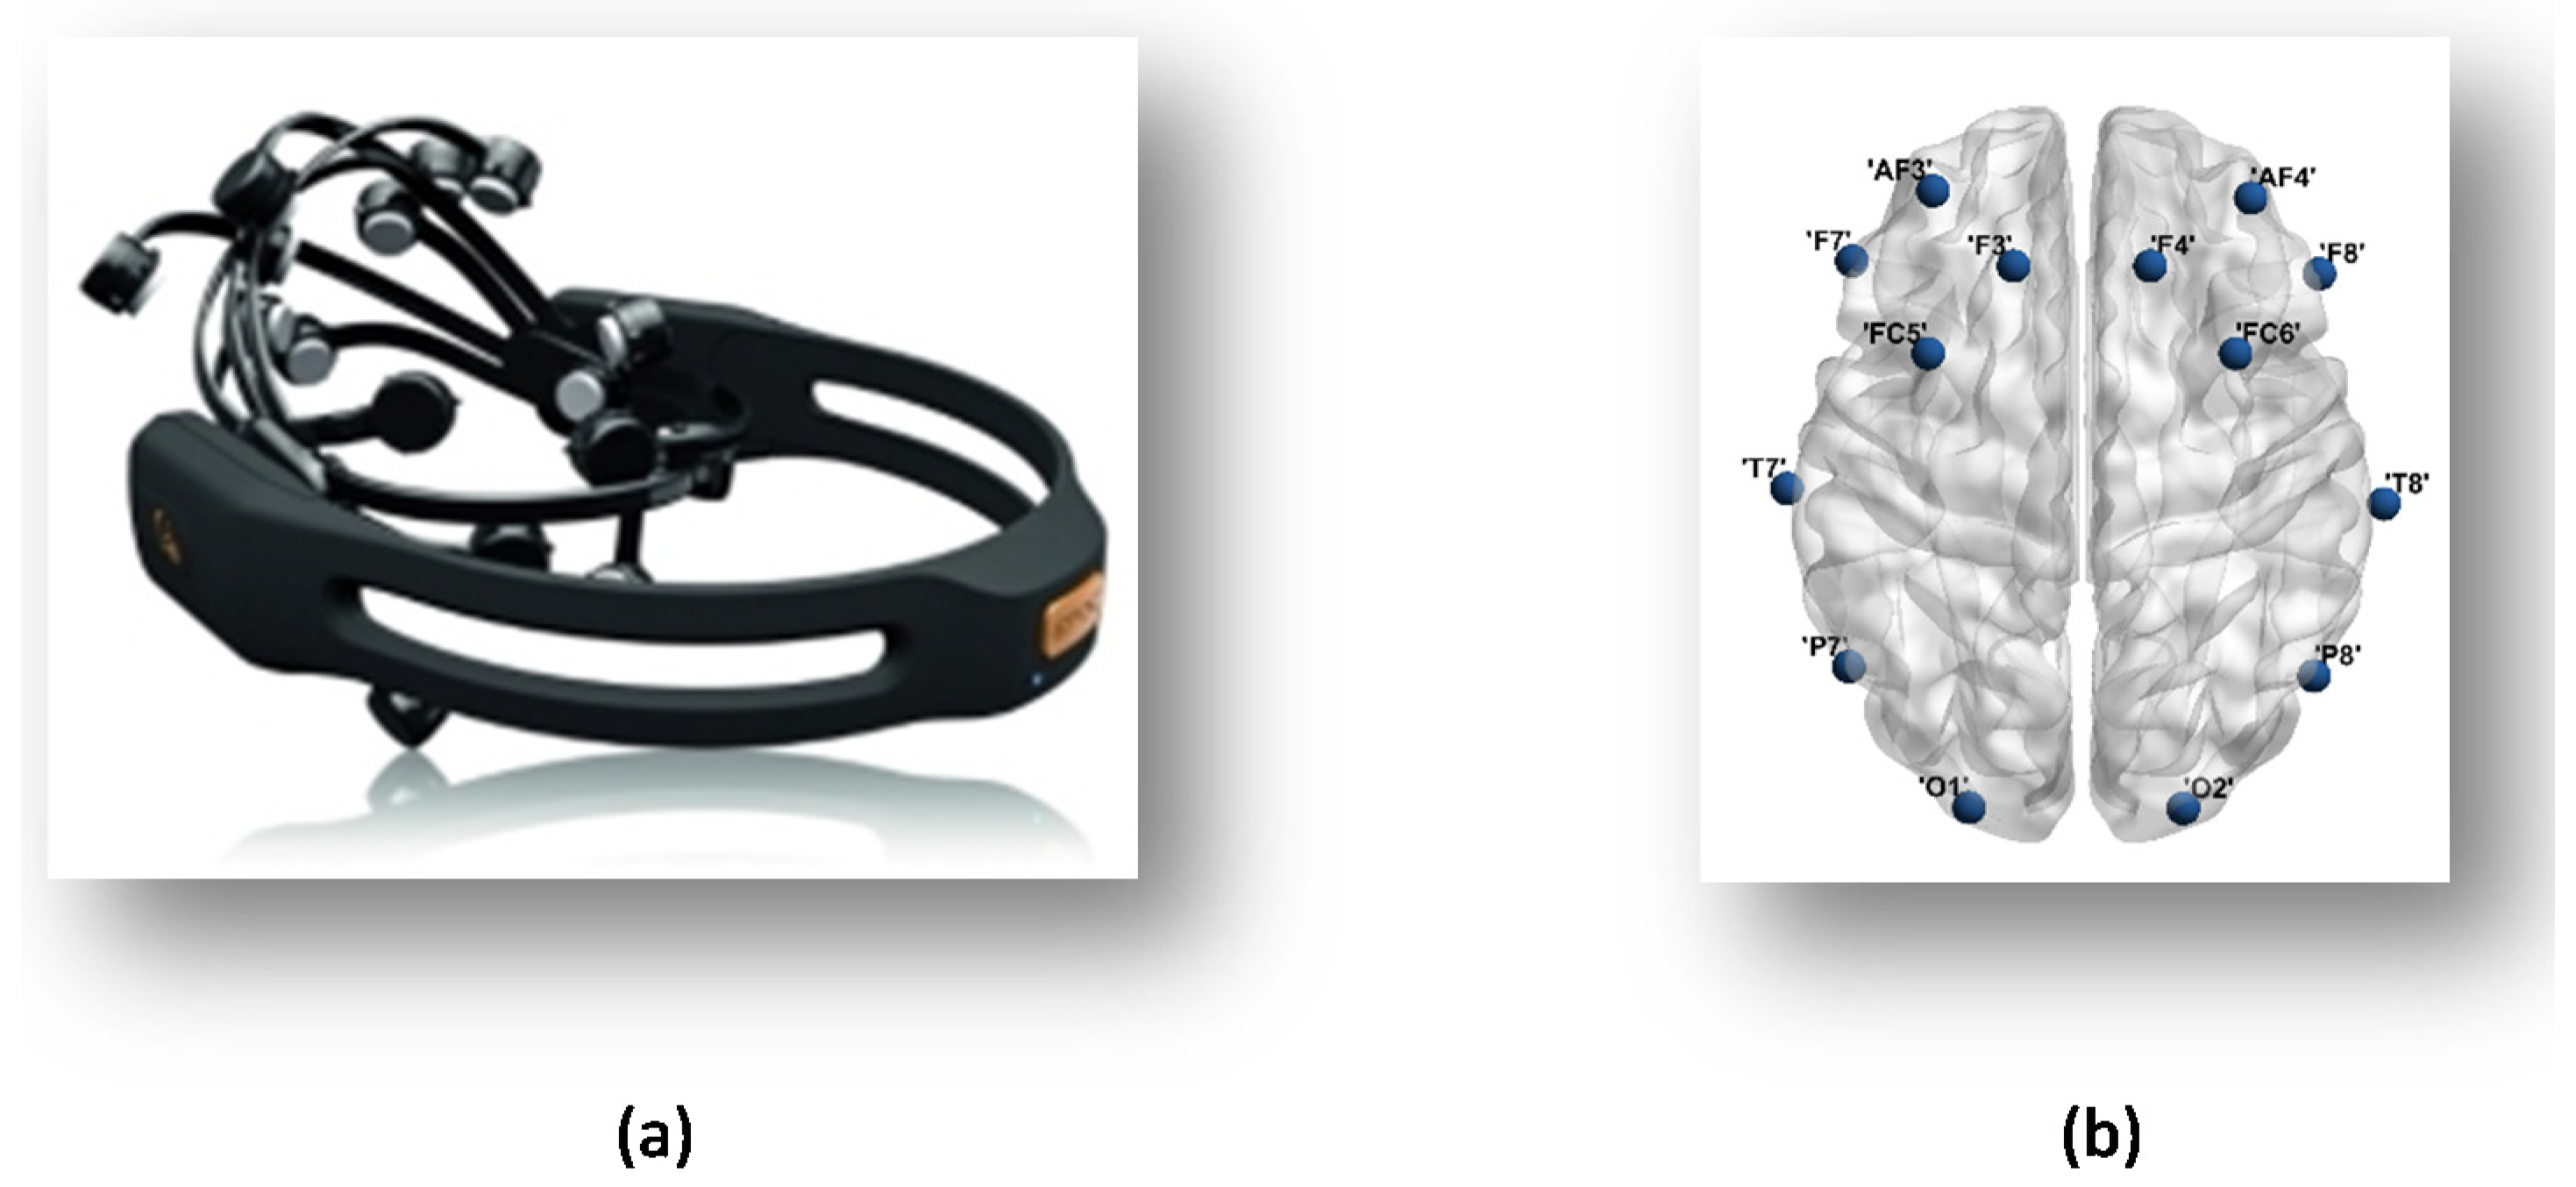
2.4. EEG Recordings
2.5. Preprocessing
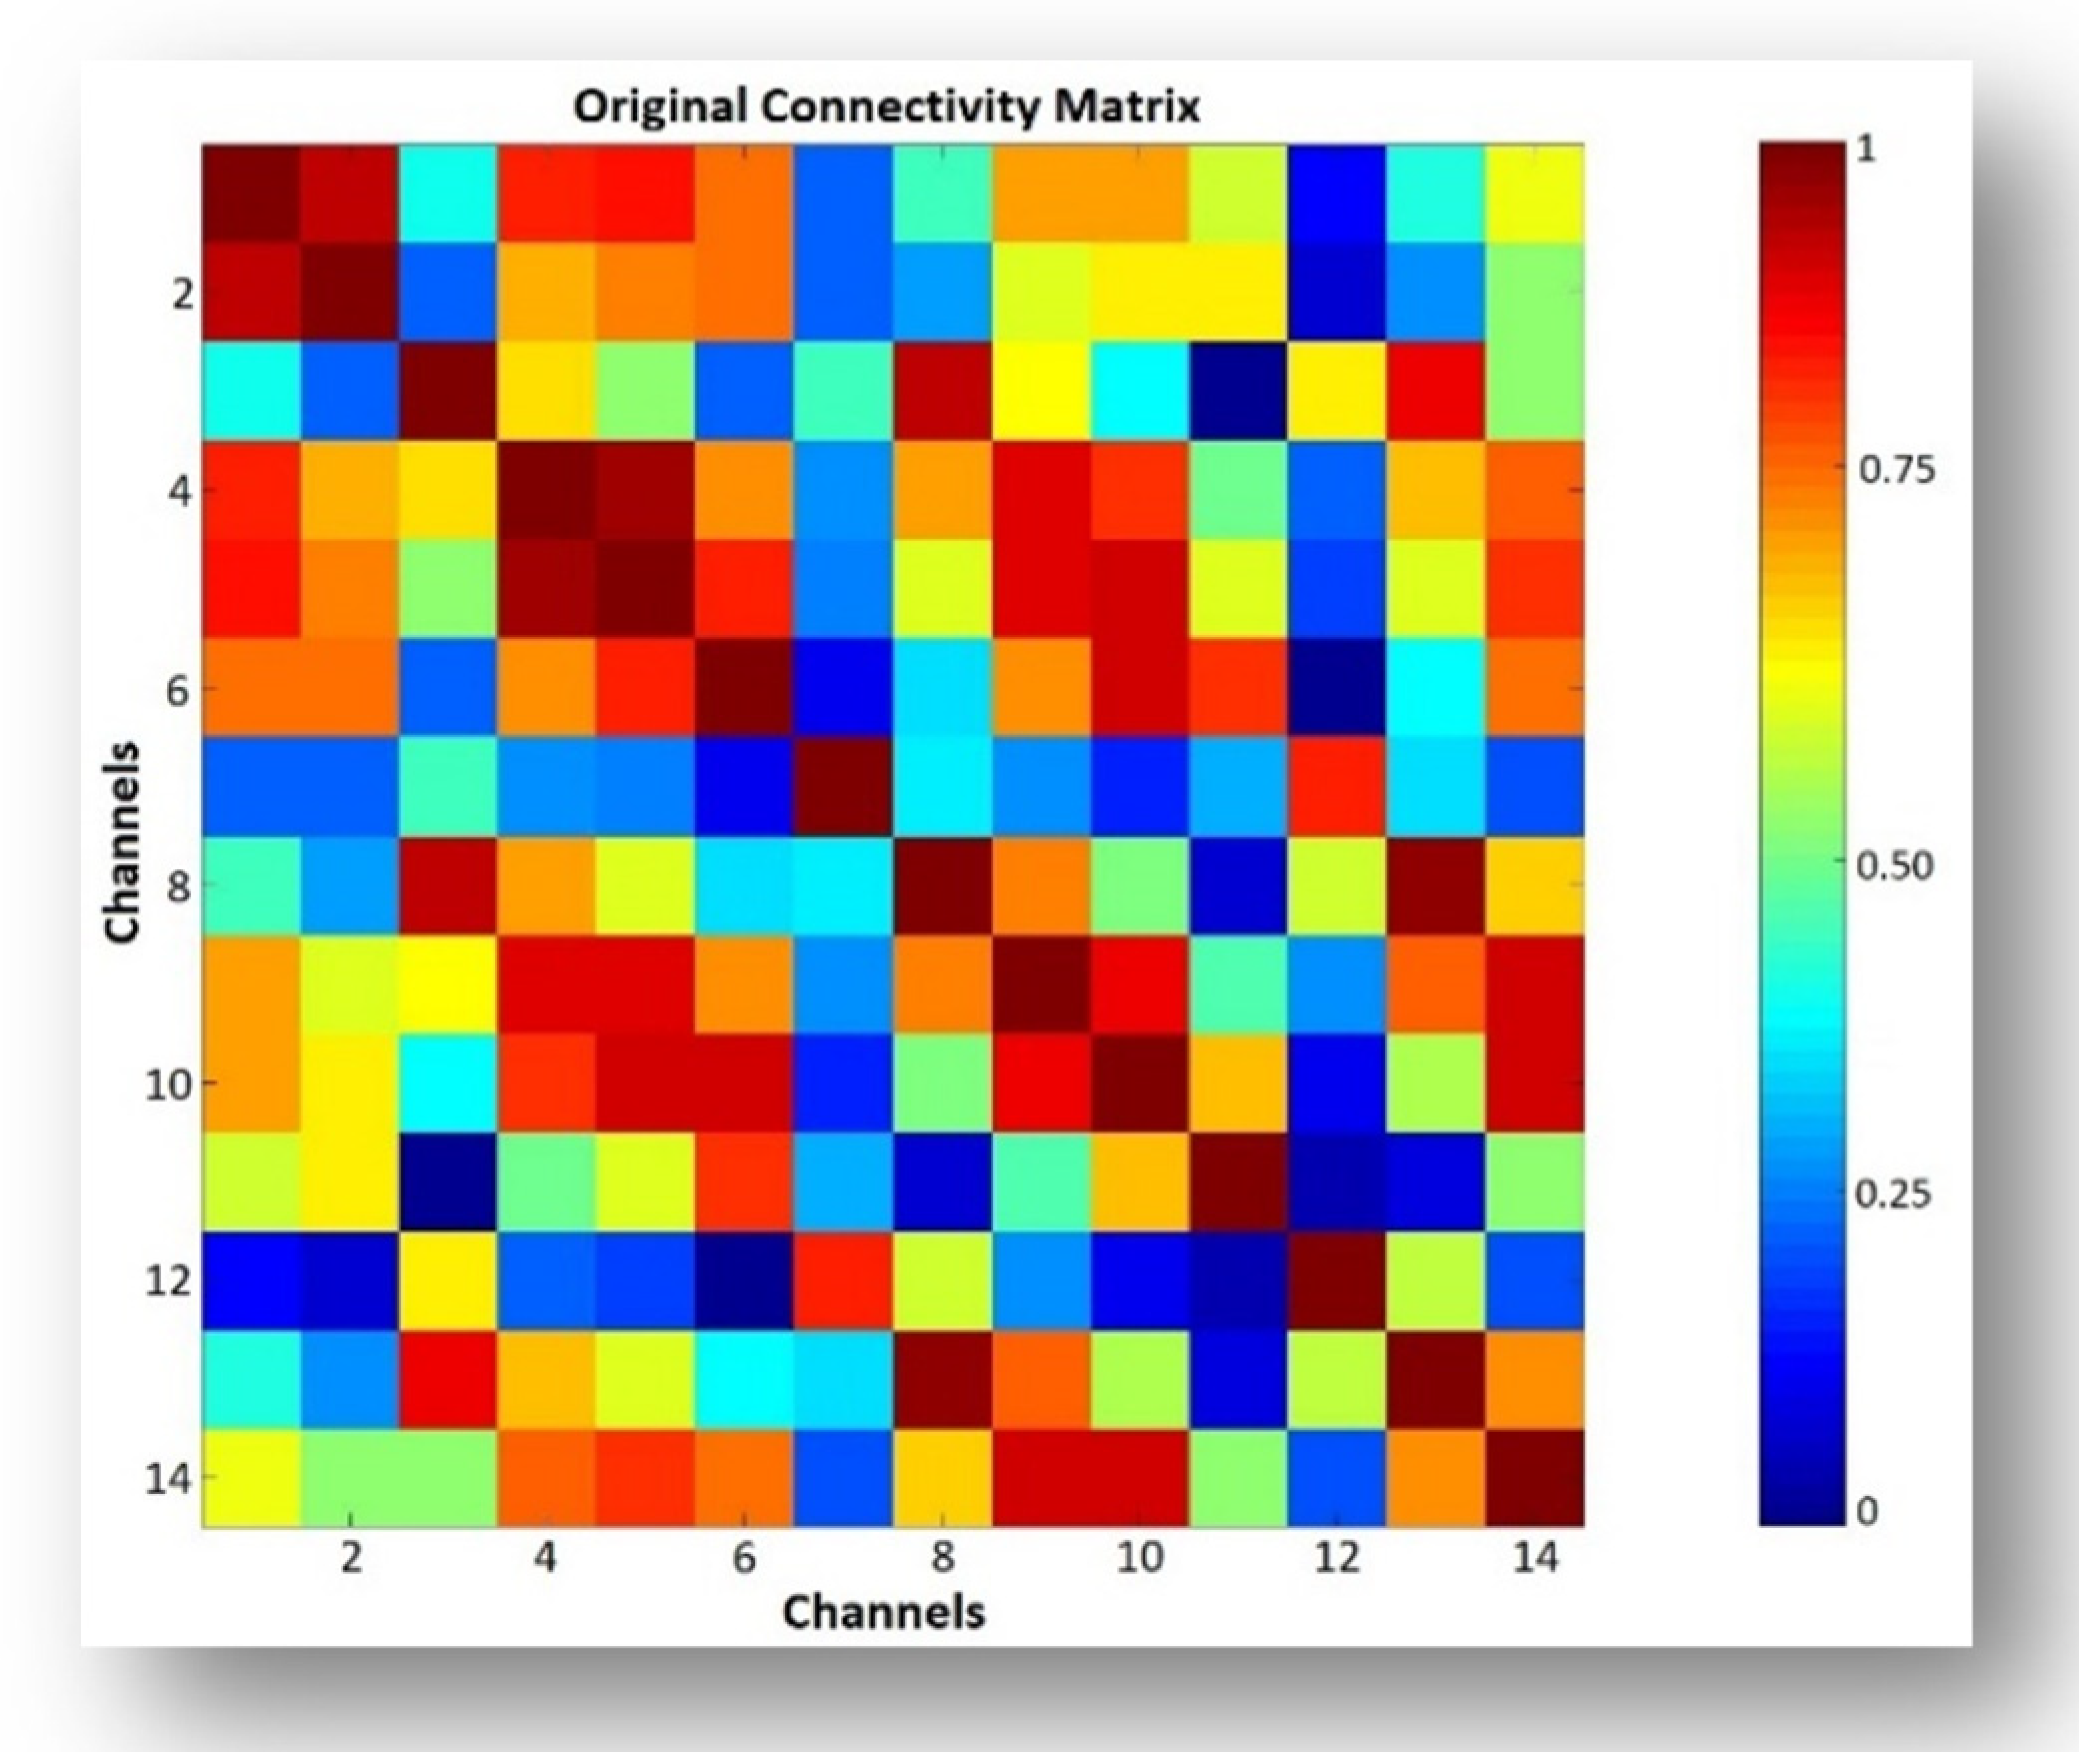
2.6. Functional Connectivity Analysis
3. Results and Discussion
3.1. Study of Short Duration
3.2. Study of Long Duration
4. Conclusions
5. Future Work
Author Contributions
Funding
Institutional Review Board Statement
Informed Consent Statement
Data Availability Statement
Conflicts of Interest
References
- Sharma, S.; Rewadkar, S.; Pawar, H.; Deokar, V.; Lomte, V.M. Survey on binaural beats and background music for increased focus and relaxation. In Proceedings of the 2017 International Conference on Emerging Trends & Innovation in ICT (ICEI), Pune, India, 3–5 February 2017. [Google Scholar]
- Liu, W.; Zhang, C.; Wang, X.; Xu, J.; Chang, Y.; Ristaniemi, T.; Cong, F. Functional connectivity of major depression disorder using ongoing EEG during music perception. Clin. Neurophysiol. 2020, 131, 2413–2422. [Google Scholar] [CrossRef] [PubMed]
- de Witte, M.; Pinho, A.D.S.; Stams, G.J.; Moonen, X.; Bos, A.E.; van Hooren, S. Music therapy for stress reduction: A systematic review and meta-analysis. Health Psychol. Rev. 2020, 14, 1–26. [Google Scholar] [CrossRef] [PubMed]
- Phneah, S.W.; Nisar, H. EEG-based alpha neurofeedback training for mood enhancement. Australas. Phys. Eng. Sci. Med. 2017, 40, 325–336. [Google Scholar] [CrossRef] [PubMed]
- Lin, H.; Hsieh, H.Y. The effect of music on spatial ability. In Proceedings of the International Conference on Internationalization, Design and Global Development, Orlando, FL, USA, 9–14 July 2011; Springer: Berlin/Heidelberg, Germany, 2011. [Google Scholar]
- Kumaran, D.S. Using EEG-validated music emotion recognition techniques to classify multi-genre popular music for therapeutic purposes. In Proceedings of the 14th Annual International Student Science Fair, Aurora, IL, USA, 27 June–1 July 2018. [Google Scholar]
- Baumgartner, T.; Esslen, M.; Jäncke, L. From emotion perception to emotion experience: Emotions evoked by pictures and classical music. Int. J. Psychophysiol. 2006, 60, 34–43. [Google Scholar] [CrossRef] [PubMed]
- Mohammadpour, M.; Nezhadi, M.M.A.; Hashemi, S.M.R.; Amiri, Z. Music emotion recognition based on Wigner-Ville distribution feature extraction. In Proceedings of the 2017 IEEE 4th International Conference on Knowledge-Based Engineering and Innovation (KBEI), Tehran, Iran, 22 December 2017. [Google Scholar]
- Kiran, F. Exploring Effects of Background Music in a Serious Game on Attention by Means of EEG Signals in Children. Ph.D. Thesis, Louisiana State University and Agricultural and Mechanical College, Baton Rouge, LA, USA, 2020. [Google Scholar]
- Schmidt, L.A.; Trainor, L.J. Frontal brain electrical activity (EEG) distinguishes valence and intensity of musical emotions. Cogn. Emot. 2001, 15, 487–500. [Google Scholar] [CrossRef]
- Lercher, P.; Kofler, W. Behavioral and health responses associated with road traffic noise exposure along alpine through-traffic routes. Sci. Total Environ. 1996, 189, 85–89. [Google Scholar] [CrossRef]
- Tsai, P.-L.; Chen, M.-C.; Huang, Y.-T.; Lin, K.-C.; Chen, K.-L.; Hsu, Y.-W. Listening to Classical Music Ameliorates Unilateral Neglect After Stroke. Am. J. Occup. Ther. 2013, 67, 328–335. [Google Scholar] [CrossRef] [Green Version]
- Glanz, K.; Schwartz, M.D. Stress, coping, and health behavior. In Health Behavior and Health Education: Theory, Research, and Practice; American Psychological Association: Washington, DC, USA, 2008; pp. 211–236. [Google Scholar]
- Hosseini, S.H.; Maleki, I.; Farnia, S.; Kazemi-Malekmahmoudi, S. Comparing the effectiveness of music therapy and alpha-theta neuro-feedback training on anxiety and depression among patients with chronic irritable bowel syndrome. Chronic Dis. J. 2018, 6, 143–151. [Google Scholar]
- Weise, L.; Jakob, E.; Töpfer, N.F.; Wilz, G. Study protocol: Individualized music for people with dementia-improvement of quality of life and social participation for people with dementia in institutional care. BMC Geriatr. 2018, 18, 313. [Google Scholar] [CrossRef] [Green Version]
- Wang, J.-R.; Hsieh, S. Neurofeedback training improves attention and working memory performance. Clin. Neurophysiol. 2013, 124, 2406–2420. [Google Scholar] [CrossRef]
- de Voogd, L.D.; Klumpers, F.; Fernández, G.; Hermans, E.J. Intrinsic functional connectivity between amygdala and hippocampus during rest predicts enhanced memory under stress. Psychoneuroendocrinology 2017, 75, 192–202. [Google Scholar] [CrossRef] [PubMed]
- Shirer, W.R.; Ryali, S.; Rykhlevskaia, E.; Menon, V.; Greicius, M.D. Decoding Subject-Driven Cognitive States with Whole-Brain Connectivity Patterns. Cereb. Cortex 2011, 22, 158–165. [Google Scholar] [CrossRef] [PubMed]
- He, H.; Yang, M.; Duan, M.; Chen, X.; Lai, Y.; Xia, Y.; Shao, J.; Biswal, B.B.; Luo, C.; Yao, D. Music Intervention Leads to Increased Insular Connectivity and Improved Clinical Symptoms in Schizophrenia. Front. Neurosci. 2018, 11, 744. [Google Scholar] [CrossRef] [PubMed]
- Alluri, V.; Toiviainen, P.; Burunat, I.; Kliuchko, M.; Vuust, P.; Brattico, E. Connectivity patterns during music listening: Evidence for action-based processing in musicians. Hum. Brain Mapp. 2017, 38, 2955–2970. [Google Scholar] [CrossRef] [Green Version]
- Wu, J.; Zhang, J.; Ding, X.; Li, R.; Zhou, C. The effects of music on brain functional networks: A network analysis. Neuroscience 2013, 250, 49–59. [Google Scholar] [CrossRef]
- Hutchison, R.M.; Womelsdorf, T.; Allen, E.A.; Bandettini, P.A.; Calhoun, V.D.; Corbetta, M.; Della Penna, S.; Duyn, J.H.; Glover, G.H.; Gonzalez-Castillo, J.; et al. Dynamic functional connectivity: Promise, issues, and interpretations. NeuroImage 2013, 80, 360–378. [Google Scholar] [CrossRef] [Green Version]
- Ioannides, A.A. Dynamic functional connectivity. Curr. Opin. Neurobiol. 2007, 17, 161–170. [Google Scholar] [CrossRef]
- Farahani, F.V.; Karwowski, W.; Lighthall, N.R. Application of graph theory for identifying connectivity patterns in human brain networks: A systematic review. Front. Neurosci. 2019, 13, 585. [Google Scholar] [CrossRef]
- Nawaz, R.; Nisar, H.; Voon, Y.V. The effect of music on human brain; Frequency domain and time series analysis using electroencephalogram. IEEE Access 2018, 6, 45191–45205. [Google Scholar] [CrossRef]
- Cheah, K.H.; Nisar, H.; Yap, V.V.; Lee, C.Y. Convolutional neural networks for classification of music-listening EEG: Comparing 1D convolutional kernels with 2D kernels and cerebral laterality of musical influence. Neural Comput. Appl. 2020, 32, 8867–8891. [Google Scholar] [CrossRef]
- Wilkins, R.W.; Hodges, D.A.; Laurienti, P.J.; Steen, M.; Burdette, J.H. Network science and the effects of music preference on functional brain connectivity: From Beethoven to Eminem. Sci. Rep. 2014, 4, 1–8. [Google Scholar] [CrossRef] [PubMed] [Green Version]
- Lim, J.-H.; Kim, H.; Jeon, C.; Cho, S. The effects on mental fatigue and the cognitive function of mechanical massage and binaural beats (brain massage) provided by massage chairs. Complement. Ther. Clin. Pract. 2018, 32, 32–38. [Google Scholar] [CrossRef] [PubMed]
- Beauchene, C.; Abaid, N.; Moran, R.; Diana, A.R.; Leonessa, A. The effect of binaural beats on verbal working memory and cortical connectivity. J. Neural Eng. 2017, 14, 026014. [Google Scholar] [CrossRef] [PubMed] [Green Version]
- Aydın, S.; Güdücü, Ç.; Kutluk, F.; Öniz, A.; Özgören, M. The impact of musical experience on neural sound encoding performance. Neurosci. Lett. 2019, 694, 124–128. [Google Scholar] [CrossRef] [PubMed]
- Radüntz, T. Signal quality evaluation of emerging EEG devices. Front. Physiol. 2018, 9, 98. [Google Scholar] [CrossRef] [Green Version]
- Barham, M.P.; Clark, G.M.; Hayden, M.J.; Enticott, P.G.; Conduit, R.; Lum, J.A. Acquiring research-grade ERPs on a shoestring budget: A comparison of a modified Emotiv and commercial SynAmps EEG system. Psychophysiology 2017, 54, 1393–1404. [Google Scholar] [CrossRef]
- Bhardwaj, S.; Jadhav, P.; Adapa, B.; Acharyya, A.; Naik, G.R. Online and automated reliable system design to remove blink and muscle artefact in EEG. In Proceedings of the 2015 37th Annual International Conference of the IEEE Engineering in Medicine and Biology Society (EMBC), Milan, Italy, 25–29 August 2015. [Google Scholar]
- Jadhav, P.N.; Shanamugan, D.; Chourasia, A.; Ghole, A.R.; Acharyya, A.A.; Naik, G. Automated detection and correction of eye blink and muscular artefacts in EEG signal for analysis of Autism Spectrum Disorder. In Proceedings of the 2014 36th Annual International Conference of the IEEE Engineering in Medicine and Biology Society, Chicago, IL, USA, 26–30 August 2014. [Google Scholar]
- Mognon, A.; Jovicich, J.; Bruzzone, L.; Buiatti, M. ADJUST: An automatic EEG artifact detector based on the joint use of spatial and temporal features. Psychophysiology 2011, 48, 229–240. [Google Scholar] [CrossRef]
- Ridley, A.J.; Schwartz, M.A.; Burridge, K.; Firtel, R.A.; Ginsberg, M.H.; Borisy, G.; Parsons, J.T.; Horwitz, A.R. Cell Migration: Integrating Signals from Front to Back. Science 2003, 302, 1704–1709. [Google Scholar] [CrossRef] [Green Version]
- Gallicchio, G.; Cooke, A.; Ring, C. Lower left temporal-frontal connectivity characterizes expert and accurate performance: High-alpha T7-Fz connectivity as a marker of conscious processing during movement. Sport Exerc. Perform. Psychol. 2016, 5, 14. [Google Scholar] [CrossRef] [Green Version]
- Heinz, A.J.; Johnson, J.S. Load-dependent increases in delay-period alpha-band power track the gating of task-irrelevant inputs to working memory. Front. Hum. Neurosci. 2017, 11, 250. [Google Scholar] [CrossRef] [Green Version]
- Homan, R.W.; Herman, J.; Purdy, P. Cerebral location of international 10–20 system electrode placement. Electroencephalogr. Clin. Neurophysiol. 1987, 66, 376–382. [Google Scholar] [CrossRef]
- Frequencies, F.T.O.B.W. Gamma, Beta, Alpha, Theta, Delta. Available online: https://mentalhealthdaily.com/2014/04/15/5-types-of-brain-waves-frequencies-gamma-beta-alpha-theta-delta/ (accessed on 18 April 2017).
- Duncan, J. Attention, Intelligence, and the Frontal Lobes; MIT Press: Cambridge, MA, USA, 1995. [Google Scholar]
- Alaros, E.; Handayani, D.O.D.; Yaacob, H.; Lubis, M. EEG Neurofeedback Training Among Adult with Attention Deficit: A Review Article. IOP Conf. Ser. Mater. Sci. Eng. 2021, 1077, 012061. [Google Scholar] [CrossRef]
- Mikicin, M.; Kowalczyk, M. Audio-visual and autogenic relaxation alter amplitude of alpha EEG band, causing improvements in mental work performance in athletes. Appl. Psychophysiol. Biofeedback 2015, 40, 219–227. [Google Scholar] [CrossRef] [PubMed]
- Sugata, H.; Yagi, K.; Yazawa, S.; Nagase, Y.; Tsuruta, K.; Ikeda, T.; Nojima, I.; Hara, M.; Matsushita, K.; Kawakami, K.; et al. Role of beta-band resting-state functional connectivity as a predictor of motor learning ability. NeuroImage 2020, 210, 116562. [Google Scholar] [CrossRef] [PubMed]
- Kim, D.-K.; Rhee, J.-H.; Kang, S.W. Reorganization of the brain and heart rhythm during autogenic meditation. Front. Integr. Neurosci. 2014, 7, 109. [Google Scholar] [CrossRef] [Green Version]
- Knyazev, G.G. EEG delta oscillations as a correlate of basic homeostatic and motivational processes. Neurosci. Biobehav. Rev. 2012, 36, 677–695. [Google Scholar] [CrossRef]


| Baseline | Favorite Music | Relaxing Music | |
|---|---|---|---|
| Delta (0%) |  |  | 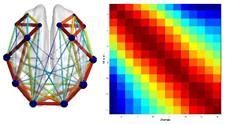 |
| Theta (8%) |  |  |  |
| Alpha (25%) |  |  |  |
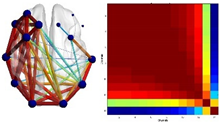
| Beta (11%) |  | 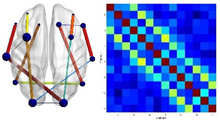 | 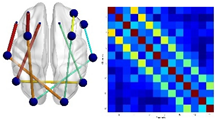 |
| Average (25%) |  |  |  |
| Study of Short Duration | ||||||||||
|---|---|---|---|---|---|---|---|---|---|---|
| Network Analysis | Delta | Theta | Alpha | Beta | Average | |||||
| No. of Edges | Density | No. of Edges | Density | No. of Edges | Density | No. of Edges | Density | No. of Edges | Density | |
| Baseline | 52 | 0.5714 | 39 | 0.4286 | 8 | 0.0879 | 13 | 0.1428 | 14 | 0.1538 |
| Favorite | 52 | 0.5714 | 37 | 0.4066 | 16 | 0.1758 | 14 | 0.1538 | 20 | 0.2197 |
| Relaxing | 52 | 0.5714 | 42 | 0.4615 | 11 | 0.1208 | 12 | 0.1318 | 21 | 0.2307 |
| Study of Short Duration | ||||||||||
|---|---|---|---|---|---|---|---|---|---|---|
| Edge Strength | Delta | Theta | Alpha | Beta | Average | |||||
| t-Test | ANOVA | t-Test | ANOVA | t-Test | ANOVA | t-Test | ANOVA | t-Test | ANOVA | |
| Baseline and Favorite | 2.2 × 10⁻⁶ | 0.21504 | 3.74 × 10⁻⁷ | 3.26 × 10⁻⁵ | 0.00055 | 0.00408 | 9.64 × 10⁻⁸ | 2.40 × 10⁻⁵ | 0.0919 | 0.2516 |
| Favorite and Relaxing | 0.00079 | 0.61398 | 0.00011 | 0.20950 | 0.00033 | 0.70615 | 0.00767 | 0.01778 | 0.2173 | 1.4685 |
| Baseline and Relaxing | 0.00043 | 0.43321 | 0.11064 | 1.71 × 10⁻⁵ | 0.25478 | 0.002245 | 0.00054 | 0.03554 | 0.0620 | 1.4296 |
| Statistical Analysis | Baseline vs. Favorite | Baseline vs. Relaxing | Favorite vs. Relaxing | ||||
|---|---|---|---|---|---|---|---|
| t-Test | ANOVA | t-Test | ANOVA | t-Test | ANOVA | ||
| Delta | Frontal | 3.55 × 10⁻⁶ | 0.3064 | 0.0001 | 0.7830 | 0.0019 | 0.4411 |
| Temporal | 0.0277 | 0.0561 | 0.2359 | 0.2022 | 0.0549 | 0.5805 | |
| Parietal | 0.0602 | 0.3742 | 0.0675 | 0.3011 | 0.0614 | 0.8172 | |
| Occipital | 0.2821 | 0.8949 | 0.3499 | 0.9261 | 0.4101 | 0.8211 | |
| Theta | Frontal | 3.37 × 10⁻⁵ | 0.0010 | 0.0015 | 0.3318 | 0.1687 | 0.0002 |
| Temporal | 0.0916 | 0.0504 | 0.0727 | 0.1006 | 0.0155 | 0.0302 | |
| Parietal | 0.0610 | 0.1065 | 0.2047 | 0.0897 | 0.1299 | 0.2553 | |
| Occipital | 0.0634 | 0.1236 | 0.1430 | 0.1165 | 0.0066 | 0.4240 | |
| Alpha | Frontal | 0.0125 | 0.0815 | 0.0061 | 0.9894 | 0.4912 | 0.0274 |
| Temporal | 0.2520 | 0.4694 | 0.3942 | 0.8494 | 0.4512 | 0.7478 | |
| Parietal | 0.1150 | 0.1047 | 0.1399 | 0.5469 | 0.0591 | 0.1464 | |
| Occipital | 0.1275 | 0.2214 | 0.0864 | 0.7753 | 0.2431 | 0.1700 | |
| Beta | Frontal | 0.0002 | 0.0021 | 0.0316 | 0.1582 | 0.0106 | 0.0609 |
| Temporal | 0.1083 | 0.0914 | 0.1408 | 0.0568 | 0.0903 | 0.4413 | |
| Parietal | 0.0279 | 0.0159 | 0.0440 | 0.3672 | 0.1991 | 0.1033 | |
| Occipital | 0.0047 | 0.0984 | 0.4492 | 0.1663 | 0.1800 | 0.8487 | |
| Delta (0%) | Control Group Baseline | Control Group Week 1 | Control Group Week 2 |
 |  |  | |
| Music Listening Group Baseline | Music Listening Group Week 1 | Music Listening Group Week 2 | |
 |  |  | |
| Theta (8%) | Control Group Baseline | Control Group Week 1 | Control Group Week 2 |
 |  |  | |
| Music Listening Group Baseline | Music Listening Group Week 1 | Music Listening Group Week 2 | |
 |  |  | |
| Alpha (25%) | Control Group Baseline | Control Group Week 1 | Control Group Week 2 |
 |  |  | |
| Music Listening Group Baseline | Music Listening Group Week 1 | Music Listening Group Week 2 | |
 |  |  | |
| Beta (11%) | Control Group Baseline | Control Group Week 1 | Control Group Week 2 |
 |  |  | |
| Music Listening Group Baseline | Music Listening Group Week 1 | Music Listening Group Week 2 | |
 |  |  | |
| Average (25%) | Control Group Baseline | Control Group Week 1 | Control Group Week 2 |
 |  |  | |
| Music Listening Group Baseline | Music Listening Group Week 1 | Music Listening Group Week 2 | |
 |  |  |
| Study of Long Duration | |||||
|---|---|---|---|---|---|
| Network Analysis | Control Group | Music Listening Group | |||
| No. of Edges | Density | No. of Edges | Density | ||
| Delta | Baseline | 45 | 0.4945 | 45 | 0.4945 |
| Week 1 | 45 | 0.4945 | 45 | 0.4945 | |
| Week 2 | 52 | 0.5714 | 45 | 0.4945 | |
| Theta | Baseline | 33 | 0.3626 | 28 | 0.3076 |
| Week 1 | 7 | 0.0769 | 33 | 0.3626 | |
| Week 2 | 18 | 0.1978 | 30 | 0.3296 | |
| Alpha | Baseline | 18 | 0.1978 | 15 | 0.1648 |
| Week 1 | 5 | 0.0549 | 5 | 0.0549 | |
| Week 2 | 16 | 0.1758 | 19 | 0.2087 | |
| Beta | Baseline | 35 | 0.3846 | 32 | 0.3516 |
| Week 1 | 20 | 0.2197 | 26 | 0.2857 | |
| Week 2 | 6 | 0.0659 | 25 | 0.2747 | |
| Average | Baseline | 10 | 0.1098 | 5 | 0.0549 |
| Week 1 | 8 | 0.0879 | 14 | 0.1538 | |
| Week 2 | 14 | 0.1538 | 18 | 0.1978 | |
| Study of Long Duration | |||||
|---|---|---|---|---|---|
| Network Analysis | Control Group | Music Listening Group | |||
| t-Test | ANOVA | t-Test | ANOVA | ||
| Delta | Baseline and Week 1 | 0.2697 | 0.5357 | 0.0005 | 0.0676 |
| Baseline and Week 2 | 0.0584 | 0.1045 | 0.0885 | 0.6606 | |
| Week 1 and Week 2 | 0.0202 | 0.0173 | 1.25 × 10⁻⁷ | 0.0577 | |
| Theta | Baseline and Week 1 | 8.58 × 10⁻⁶ | 0.0821 | 3.76 × 10⁻⁶ | 0.0557 |
| Baseline and Week 2 | 0.0018 | 0.0448 | 2.65 × 10⁻⁵ | 0.0437 | |
| Week 1 and Week 2 | 0.3737 | 0.8637 | 0.1212 | 0.863 | |
| Alpha | Baseline and Week 1 | 0.3520 | 0.7204 | 0.2931 | 0.5228 |
| Baseline and Week 2 | 0.0187 | 0.0285 | 0.0039 | 0.0009 | |
| Week 1 and Week 2 | 0.0113 | 0.0237 | 0.0094 | 0.0253 | |
| Beta | Baseline and Week 1 | 0.2039 | 0.8536 | 0.0003 | 0.0299 |
| Baseline and Week 2 | 0.1400 | 0.2229 | 2.17 × 10⁻⁵ | 0.0693 | |
| Week 1 and Week 2 | 0.3288 | 0.6968 | 0.2390 | 0.8408 | |
| Average | Baseline and Week 1 | 0.2545 | 0.0688 | 0.0091 | 0.0260 |
| Baseline and Week 2 | 0.1210 | 0.1755 | 5.12 × 10⁻⁵ | 0.0015 | |
| Week 1 and Week 2 | 0.0392 | 0.0624 | 0.1676 | 0.1776 | |
| t-Tests (Edge Strength) Alpha | Control Group | Music Listening Group | |||||
|---|---|---|---|---|---|---|---|
| Baseline vs. Week 1 | Baseline vs. Week 2 | Week 1 vs. Week 2 | Baseline vs. Week 1 | Baseline vs. Week 2 | Week 1 vs. Week 2 | ||
| Delta | Frontal | 0.3592 | 0.1983 | 0.1182 | 1.82 × 10⁻⁹ | 0.1488 | 3.107 × 10⁻⁸ |
| Temporal | 0.1544 | 0.2511 | 0.3392 | 0.0026 | 0.0199 | 0.0010 | |
| Parietal | 0.2800 | 0.3049 | 0.0037 | 0.0413 | 0.0505 | 0.0382 | |
| Occipital | 0.4063 | 0.2287 | 0.2735 | 0.0664 | 0.1208 | 0.0026 | |
| Theta | Frontal | 0.0012 | 0.0832 | 0.3626 | 0.0023 | 0.0086 | 0.3466 |
| Temporal | 0.0953 | 0.0144 | 0.3321 | 0.0290 | 0.0209 | 0.3180 | |
| Parietal | 0.0205 | 0.0684 | 0.1967 | 0.0221 | 0.0122 | 0.0476 | |
| Occipital | 0.0602 | 0.1710 | 0.4956 | 0.0931 | 0.0851 | 0.0220 | |
| Alpha | Frontal | 0.2801 | 0.0897 | 0.0231 | 0.4189 | 0.0264 | 0.0038 |
| Temporal | 0.2424 | 0.0608 | 0.1249 | 0.4707 | 0.2075 | 0.0683 | |
| Parietal | 0.1290 | 0.1148 | 0.1059 | 0.0236 | 0.1272 | 0.0919 | |
| Occipital | 0.4824 | 0.3150 | 0.2336 | 0.2577 | 0.4022 | 0.1196 | |
| Beta | Frontal | 0.2251 | 0.1576 | 0.3470 | 0.0005 | 9.309 × 10⁻⁵ | 0.2271 |
| Temporal | 0.4793 | 0.1788 | 0.1428 | 0.0004 | 0.0205 | 0.0973 | |
| Parietal | 0.4877 | 0.4596 | 0.3291 | 0.3616 | 0.4034 | 0.3150 | |
| Occipital | 0.2043 | 0.4631 | 0.3252 | 0.0653 | 0.0611 | 0.0301 | |
| ANOVA (Edge Strength) Alpha | Control Group | Music Listening Group | |||||
|---|---|---|---|---|---|---|---|
| Baseline vs. Week 1 | Baseline vs. Week 2 | Week 1 vs. Week 2 | Baseline vs. Week 1 | Baseline vs. Week 2 | Week 1 vs. Week 2 | ||
| Delta | Frontal | 0.6876 | 0.3641 | 0.1592 | 1.05 × 10⁻¹³ | 0.7182 | 9.85 × 10⁻¹² |
| Temporal | 0.8465 | 0.4265 | 0.6366 | 0.0001 | 0.0087 | 0.0002 | |
| Parietal | 0.4879 | 0.5416 | 0.0007 | 0.0527 | 0.9216 | 0.0475 | |
| Occipital | 0.7568 | 0.5215 | 0.4590 | 0.3407 | 0.5709 | 0.5470 | |
| Theta | Frontal | 0.4007 | 0.3746 | 0.8466 | 0.2915 | 0.2837 | 0.9529 |
| Temporal | 0.1497 | 0.0471 | 0.7591 | 0.3483 | 0.2578 | 0.9042 | |
| Parietal | 0.1270 | 0.0516 | 0.3317 | 0.0033 | 0.0024 | 0.0112 | |
| Occipital | 0.0667 | 0.1427 | 0.9885 | 0.1595 | 0.1293 | 0.5397 | |
| Alpha | Frontal | 0.5959 | 0.1746 | 0.0852 | 0.7954 | 0.0146 | 0.0332 |
| Temporal | 0.3479 | 0.1276 | 0.0891 | 0.9083 | 0.2254 | 0.1755 | |
| Parietal | 0.1690 | 0.0645 | 0.0894 | 0.5946 | 0.1263 | 0.0683 | |
| Occipital | 0.9530 | 0.6843 | 0.2577 | 0.3243 | 0.7596 | 0.1850 | |
| Beta | Frontal | 0.4057 | 0.2461 | 0.7175 | 0.0353 | 0.0981 | 0.8057 |
| Temporal | 0.9369 | 0.2717 | 0.1539 | 0.1645 | 0.0914 | 0.5886 | |
| Parietal | 0.9643 | 0.8756 | 0.8600 | 0.6064 | 0.7014 | 0.7400 | |
| Occipital | 0.2742 | 0.9240 | 0.4922 | 0.0792 | 0.0616 | 0.3194 | |
| Subjects | Activated | Strongest | |
|---|---|---|---|
| BASELINE | 1 | F3, P7, O1, O2, P8, T8, FC6, F4 AF4 | P8, O2, FC6, AF4 |
| 2 | AF3, F3, FC5, T7, P7, O1, O2, P8, T8, FC6, F4, AF4 | O1, O2, AF3, FC5 | |
| 3 | Nil | Nil | |
| 4 | F3, FC5 | F3, FC5, T7 | |
| 5 | AF3, F3, FC5, T7, P7, O1, O2, P8, T8, FC6, F4, F8, AF4 | F3, F4, AF3, P7 | |
| WEEK 1 | 1 | F7, F3, FC5, P7, O1, O2, P8, T8, FC6, F4, F8, AF4 | FC6, F8, F7, FC5 |
| 2 | AF3, F7, F3, FC5, T7, T8, F4, F8, AF4 | F4, AF4, F8 | |
| 3 | AF3, F7, F3, FC5, T7, P7, O1, O2, P8, T8, FC6, F4, F8, AF4 | F3, F4, AF4 | |
| 4 | AF3, F7, F3, FC5, T7, FC6, F4, F8, AF4 | F7, FC5, F4, AF4 | |
| 5 | F7, FC5, T7, FC6, F4, F8, AF4 | F7, FC5, FC6, F8 | |
| WEEK 2 | 1 | AF3, F7, F3, FC5, T7, P8, T8, FC6, F4, F8, AF4 | FC6, F8, F4, AF4 |
| 2 | F7, F3, FC5, FC6, F8 | F7, FC5, FC6, F8 | |
| 3 | F7, F3, FC5, T7, P7, O1, O2, P8, T8, FC6, F4, F8, AF4 | F7, FC5, FC6, F8 | |
| 4 | AF3, F7, F3, FC5, T7, P7, O1, O2, P8, T8, FC6, F4, F8, AF4 | F7, FC5, FC6, F8 | |
| 5 | AF3, F7, F3, FC5, T7, P8, T8, FC6, F4, F8, AF4 | FC6, F8, F4, AF4 | |
Publisher’s Note: MDPI stays neutral with regard to jurisdictional claims in published maps and institutional affiliations. |
© 2022 by the authors. Licensee MDPI, Basel, Switzerland. This article is an open access article distributed under the terms and conditions of the Creative Commons Attribution (CC BY) license (https://creativecommons.org/licenses/by/4.0/).
Share and Cite
Mahmood, D.; Nisar, H.; Yap, V.V.; Tsai, C.-Y. The Effect of Music Listening on EEG Functional Connectivity of Brain: A Short-Duration and Long-Duration Study. Mathematics 2022, 10, 349. https://doi.org/10.3390/math10030349
Mahmood D, Nisar H, Yap VV, Tsai C-Y. The Effect of Music Listening on EEG Functional Connectivity of Brain: A Short-Duration and Long-Duration Study. Mathematics. 2022; 10(3):349. https://doi.org/10.3390/math10030349
Chicago/Turabian StyleMahmood, Danyal, Humaira Nisar, Vooi Voon Yap, and Chi-Yi Tsai. 2022. "The Effect of Music Listening on EEG Functional Connectivity of Brain: A Short-Duration and Long-Duration Study" Mathematics 10, no. 3: 349. https://doi.org/10.3390/math10030349
APA StyleMahmood, D., Nisar, H., Yap, V. V., & Tsai, C.-Y. (2022). The Effect of Music Listening on EEG Functional Connectivity of Brain: A Short-Duration and Long-Duration Study. Mathematics, 10(3), 349. https://doi.org/10.3390/math10030349