Article

Thermal Damage Constitutive Model and Brittleness Index Based on Energy Dissipation for Deep Rock

1
School of Transportation and Civil Engineering, Nantong University, Nantong 226000, China
2
State Key Laboratory of Coal Resources and Safe Mining, China University of Mining and Technology, Xuzhou 221116, China
*
Author to whom correspondence should be addressed.
Mathematics 2022, 10(3), 410; https://doi.org/10.3390/math10030410
Submission received: 7 January 2022 / Revised: 24 January 2022 / Accepted: 26 January 2022 / Published: 27 January 2022
(This article belongs to the Section Engineering Mathematics)

Abstract

:
In deep underground engineering, rock usually encounters a high temperature problem. The stress–strain relationship of rock under high temperatures is the basis of engineering excavation. Based on the Lemaitre’s equivalent strain hypothesis and energy dissipation theory, the thermal damage constitutive model of rock is established. The results show that the peak stress, ultimate elastic energy and dissipated energy at the peak all decrease with the increase of temperature in a logistic function, which indicates that the increase of temperature aggravates the deterioration of rock’s mechanical properties. Compared with rock’s constitutive model that is established on strength criterion, the thermal damage constitutive model based on energy dissipation better reflects the phenomenon of stress drop after the peak and well describes the whole stress-strain curve of rock failure, which verifies the rationality of the model. The damage model further improves the theoretical system of the rock damage constitutive model and makes up for the defect in that the traditional damage model cannot reasonably explain the nature of rock failure. The brittleness index, defined based on the energy drop coefficient, shows a logistic function with the increase of temperature, which has good physical meaning. Analyzing the phenomenon of the rock stress drop from the perspective of energy is of great significance for deeply understanding the brittle fracture mechanism of rock.

1. Introduction

The thermal damage evolution of rock is closely related to many scientific problems of underground engineering, such as deep mining, storage of nuclear waste, effective exploitation of deep geothermal energy, underground coal gasification and so on [1,2]. With the increase of mining depth, the mechanical properties, constitutive model and deformation failure mechanism of deep rocks are essentially different from those at shallow depths [3,4]. Studying the thermal damage evolution process of rock is important to ensure engineering stability control and safety prediction. Therefore, establishing an appropriate thermal damage constitutive model is of great significance for the design and safety evaluation of deep underground rock engineering.
In geological analysis, the introduction of damage variables can establish a variety of rock damage constitutive models. Damage variables are the premise of accurate and scientific establishment of constitutive models. The essence of rock fracture is the flow and transformation of energy in rock. The storage, dissipation and release of energy are closely related to the fracture damage state of rock [5,6,7,8]. Wen et al. [9] redefined the damage variable from the perspective of energy dissipation, analyzed the damage evolution on the basis of triaxial test, obtained the damage constitutive model reflecting the law of energy change, and discussed its application. Gao et al. [10] studied the energy evolution characteristics based on the uniaxial loading and unloading tests of five different types of rocks, and believed that the evolution characteristics of the strain energy rate can be easily identified through the crack propagation threshold. Wang et al. [11] established the elastic-plastic damage constitutive model and stress energy stiffness damage multi criteria model of hard rock based on damage mechanics, rock mechanics and energy conservation theory. The energy release and stress dissipation modes in the process of rock failure are revealed from the perspective of energy, which is helpful for clarifying the mechanism of rock failure. Miao et al. [12] explored the evolution characteristics of dissipated energy, friction energy and crushing energy of Beishan granite under cyclic load, considered that the fracture energy can reasonably describe the damage evolution process of granite under cyclic load, and put forward the rock damage variable based on crushing energy. Acoustic emission monitoring can well capture the stress wave caused by rock damage, and the damage evolution process of rock with temperature can be established according to the accumulated energy. Assuming that the acoustic emission signal energy is directly proportional to the rock damage, the rock damage degree can be characterized according to the acoustic emission energy. Zhang et al. [13] conducted thermal damage tests on samples of different lithology (three kinds of granite and three kinds of sandstone) to capture the acoustic emission information of rocks during heating (from room temperature to 500 °C) and cooling. The microstructure of rock before and after high temperature is revealed by the thin section analysis method, and the thermal damage evolution model of rock is established according to acoustic emission energy and elastic modulus. Based on the linear energy dissipation law and energy dissipation coefficient, Gong et al. [14] introduced a theoretical method to describe the damage of intact rock under uniaxial compression. Based on the linear energy storage law, the peak dissipated strain energy in the expression of rock damage under uniaxial compression can be calculated accurately. The research results provide a new means for analyzing rock damage from the perspective of energy. These new damage models are proposed by analyzing energy evolution characteristics of the stress–strain hysteretic curve during loading, which provides a theoretical basis for predicting the initial damage of rock during the pulsating process. Some of damage models established by researchers are summarized in Table 1.
Although many scholars have studied the damage constitutive model from the energy point of view, few have considered the temperature effect. In particular, the mechanism of thermal damage is not clear. The thermal damage of rock is a complex thermal mechanical coupling problem. Analyzing the rock failure mechanism from the perspective of energy dissipation can contribute to better understanding the complex process of rock failure. Therefore, the deformation law and mechanical properties of rock are firstly analyzed in this paper, and, then, taking the damage variable as the internal variable, a new thermal damage constitutive model of rock is established by using the energy principle, effective stress principle and damage theory. The model provides a new method to establish the rock thermal damage constitutive model from the perspective of energy, and explains that the traditional damage constitutive model cannot well explain the mechanism of rock damage, which has a certain reference significance for rock underground engineering.

2. Thermal Damage Constitutive Model

2.1. Energy Theory

In a closed system without heat exchange, when rock deformation occurs under the action of external force, the energy generated by an external force for a unit volume is expressed as:
U = U e + U d
where U stands for the input mechanical energy, U e represents the releasable elastic strain energy of rock element, which is the main source of rock energy catastrophe, and U d represents the dissipated energy of rock element, which is mainly used for the dislocation displacement of primary cracks and the initiation of secondary cracks. In this paper, the surface energy, plastic energy and radiation energy are called dissipative energy.
The energy curve and stress-strain curve of typical rock is as show in Figure 1.
The input energy and strain energy of rock element can be expressed as:
U = σ i d ε i = σ 1 d ε 1 + σ 2 d ε 2 + σ 3 d ε 3
U e = 1 2 σ i ε i e = 1 2 σ 1 ε 1 e + 1 2 σ 2 ε 2 e + 1 2 σ 3 ε 3 e
ε i e = 1 E i [ σ i u i ( σ j + σ k ) ]
where σ i , σ j , σ k ( i = 1 , 2 , 3 ) are the principal stresses; ε i and ε i e are the principal strain and elastic strain; E i and μ i are the unloading elastic modulus and the Poisson coefficient in the direction of corresponding principal stress.
In the conventional triaxial stress state, it is assumed that the rock damage is isotropic and the Poisson’s ratio is not affected by the damage, i.e., E 1 = E 2 = E 3 = E , μ 1 = μ 2 = μ 3 = μ , By substituting Equation (4) into Equation (3), the releasable elastic strain energy stored in rock in principal stress space can be obtained as follows:
U e = 1 2 E [ σ 1 2 + 2 ( 1 μ ) σ 3 2 4 μ σ 1 σ 3 ]
The dissipation energy of rock element under the normal triaxial stress state can be obtained by combining Equations (1)–(3):
U d = σ i d ε i 1 2 E [ σ 1 2 + 2 ( 1 μ ) σ 3 2 4 μ σ 1 σ 3 ]

2.2. Damage Variable

In order to describe the damage evolution of rock, it is necessary to calculate the damage variables. According to the basic theory of damage mechanics, the energy dissipation of rock from the initial crack initiation, expansion, and penetration to overall failure under external loading can be considered as the process of damage variable D increasing from 0 to critical value. The damage evolution of rock is accompanied by irreversible energy dissipation. In a closed system without heat exchange, the process of energy dissipation can better reflect evolutionary damage, and as such rock energy dissipation can be defined as a damage variable, and the relationship between the damage variable and energy dissipation is defined as [20]:
D M = U d U = σ i d ε i 1 2 E [ σ 1 2 + 2 ( 1 μ ) σ 3 2 4 μ σ 1 σ 3 ] σ i d ε i
According to the Lemaitre’s strain-equivalent principle [21], the strain caused by the nominal stress ( σ i j ) acting on the damaged material is equivalent to the strain caused by σ i j * in non-damaged materials. Then, the constitutive relation of the damaged material can be obtained by substituting σ i j in the non-damaged material with σ i j * as:
σ i j * = σ i j ( 1 D M )
The constitutive equation of rock damage is obtained as follows:
σ i j = ( 1 D M ) C i j k l e ε k l
where C i j k l e is the elastic stiffness matrix.
Under the action of triaxial compression test, the residual stress affects the rock bearing capacity. The correction factor of the damage variable related to residual strength is introduced as [22]:
q = σ r σ p
where σ r is the residual strength, and σ p is the peak strength.
The modified damage constitutive model is obtained by modifying Equation (8):
σ i j = ( 1 q D M ) C i j k l e ε k l
In order to consider the effect of temperature, the change of elastic modulus is used to define thermal damage ( D T ), as:
D T = 1 E T E
then
( C i j k l e ) T = ( 1 D T ) C i j k l e
By substituting Equation (12) into Equation (10), the thermal damage constitutive model of rock is obtained, as follows:
σ i j = ( 1 q D M ) ( 1 D T ) C i j k l e ε k l = ( 1 D ) C i j k l e ε k l
where
D = D T + q D M q D T D M
The total damage variable (D) reflects the coupling effect of temperature and load.

2.3. Energy Conversion

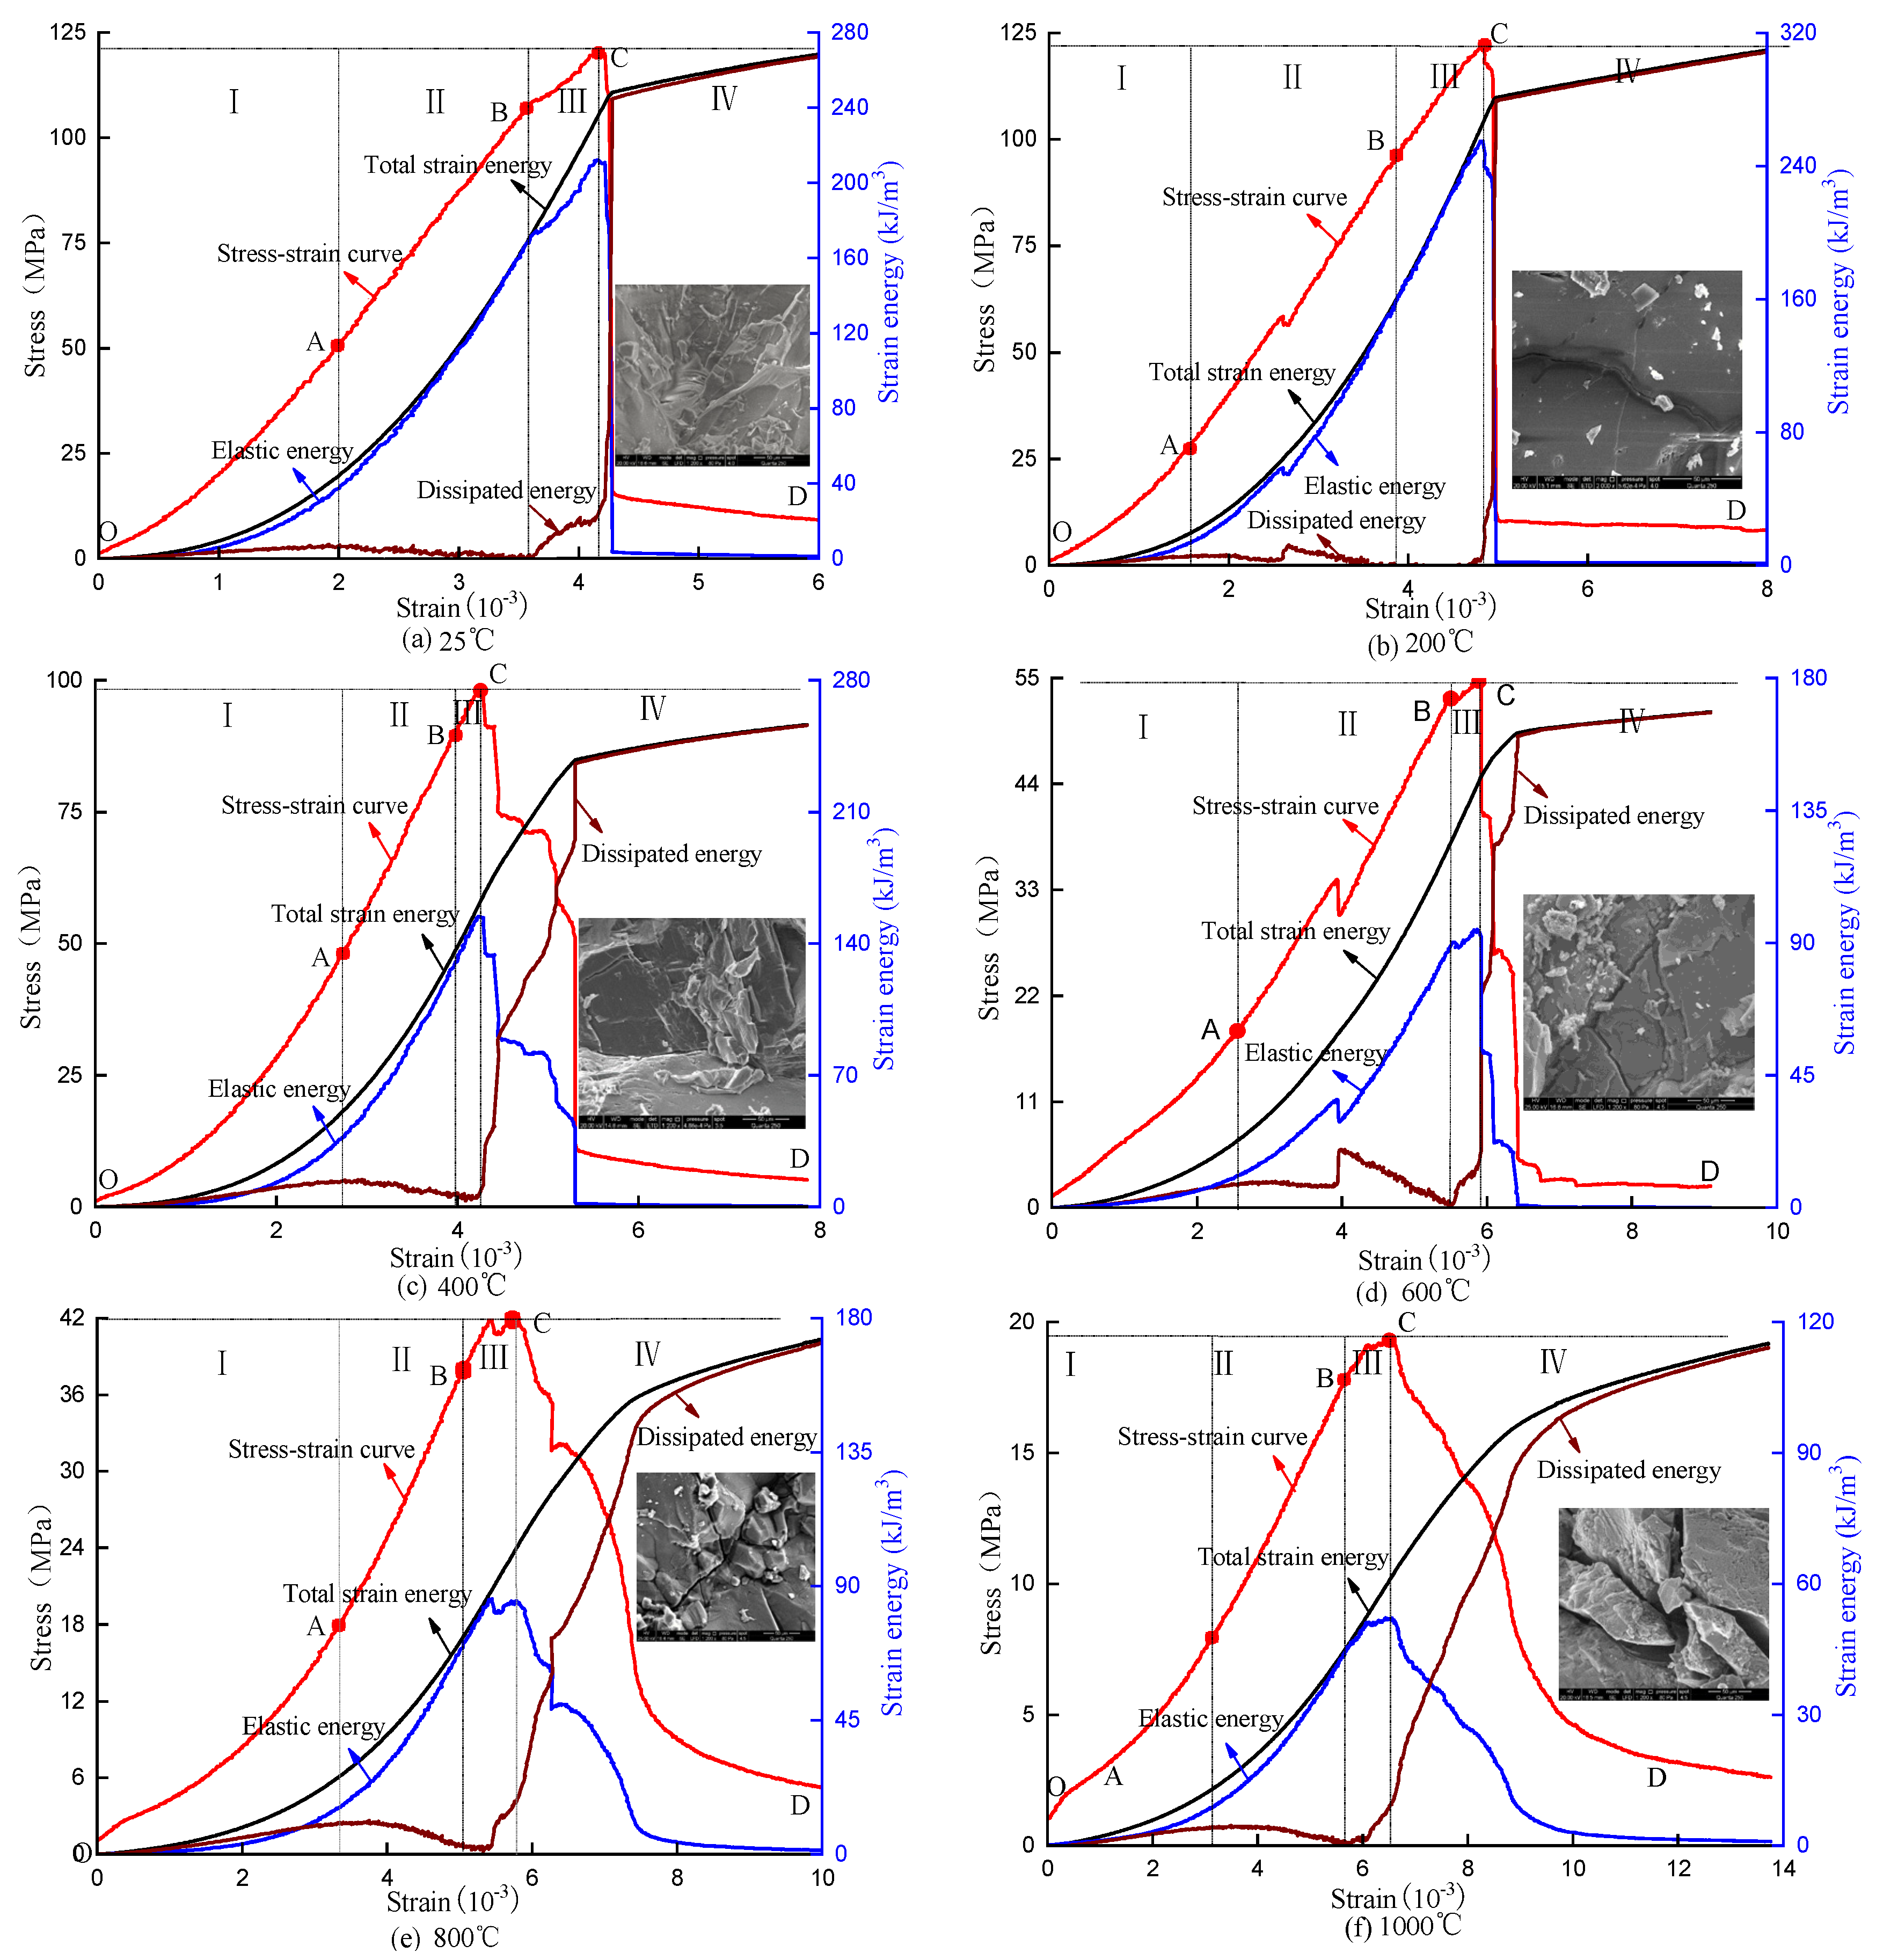
According to the test data [23] and Equations (2), (5) and (6), the real-time values of various energy at any point in rock deformation at different temperatures are calculated, as shown in Figure 2.
It should be noted that in order to apply the indoor test results to practical engineering and realize the transition and transformation between rock and rock mass, the index of energy density is often used to eliminate the influence of the size effect. Energy density is defined as the ratio of energy to surface area or volume.
Figure 2 shows that the evolution of elastic strain energy is similar to the corresponding stress–strain curve at different temperatures, both in terms of the total strain energy and the dissipated energy increase in the S-shaped curve with the increase of strain. According to the energy evolution law and stress–strain curve, the failure process of rock under uniaxial compression can be divided into four stages.
(1) Initial compaction stage (OA section). Under the action of load, the input energy of rock increases gradually, and the primary cracks and defects in the rock close continuously. Due to the small friction slip between the internal cracks, a part of the input energy is dissipated and released. At this stage, the elastic strain energy released by the rock element increases slowly. The curve is concave and point A is the threshold point of microcrack closure. (2) Elastic deformation stage (AB segment). With the increase of stress, the primary fissures in the rock are completely closed. In this stage, the elastic energy increases sharply and the stress–strain curve tends to be linear. (3) Crack growth stage (BC section). With the increase of external force, the rock enters into the yield stage (after point B). Although the total energy absorbed is still stored in the form of elastic strain energy, the internal damage and dissipated energy increase continuously, especially near the peak value, and the internal damage increases sharply. (4) Rapid failure stage (CD segment) after peak strength. With the increase of the load, the rock continues to absorb energy, but the elastic strain energy is released rapidly, and the corresponding dissipated energy increases sharply. The released elastic strain energy is transformed into the surface energy required for rock internal damage and crack propagation. At this stage, the elastic energy is released instantaneously, which promotes the rapid propagation and penetration of cracks in the rock, resulting in rock instability.
In the process of rock deformation and failure, the elastic strain energy has experienced a period of time from initial continuous accumulation to peak release, and there is a maximum energy storage at the peak stress, which is called ultimate elastic energy. The dissipative energy begins to appear near the yield point, and then the growth rate increases gradually and reaches the maximum at the peak stress.
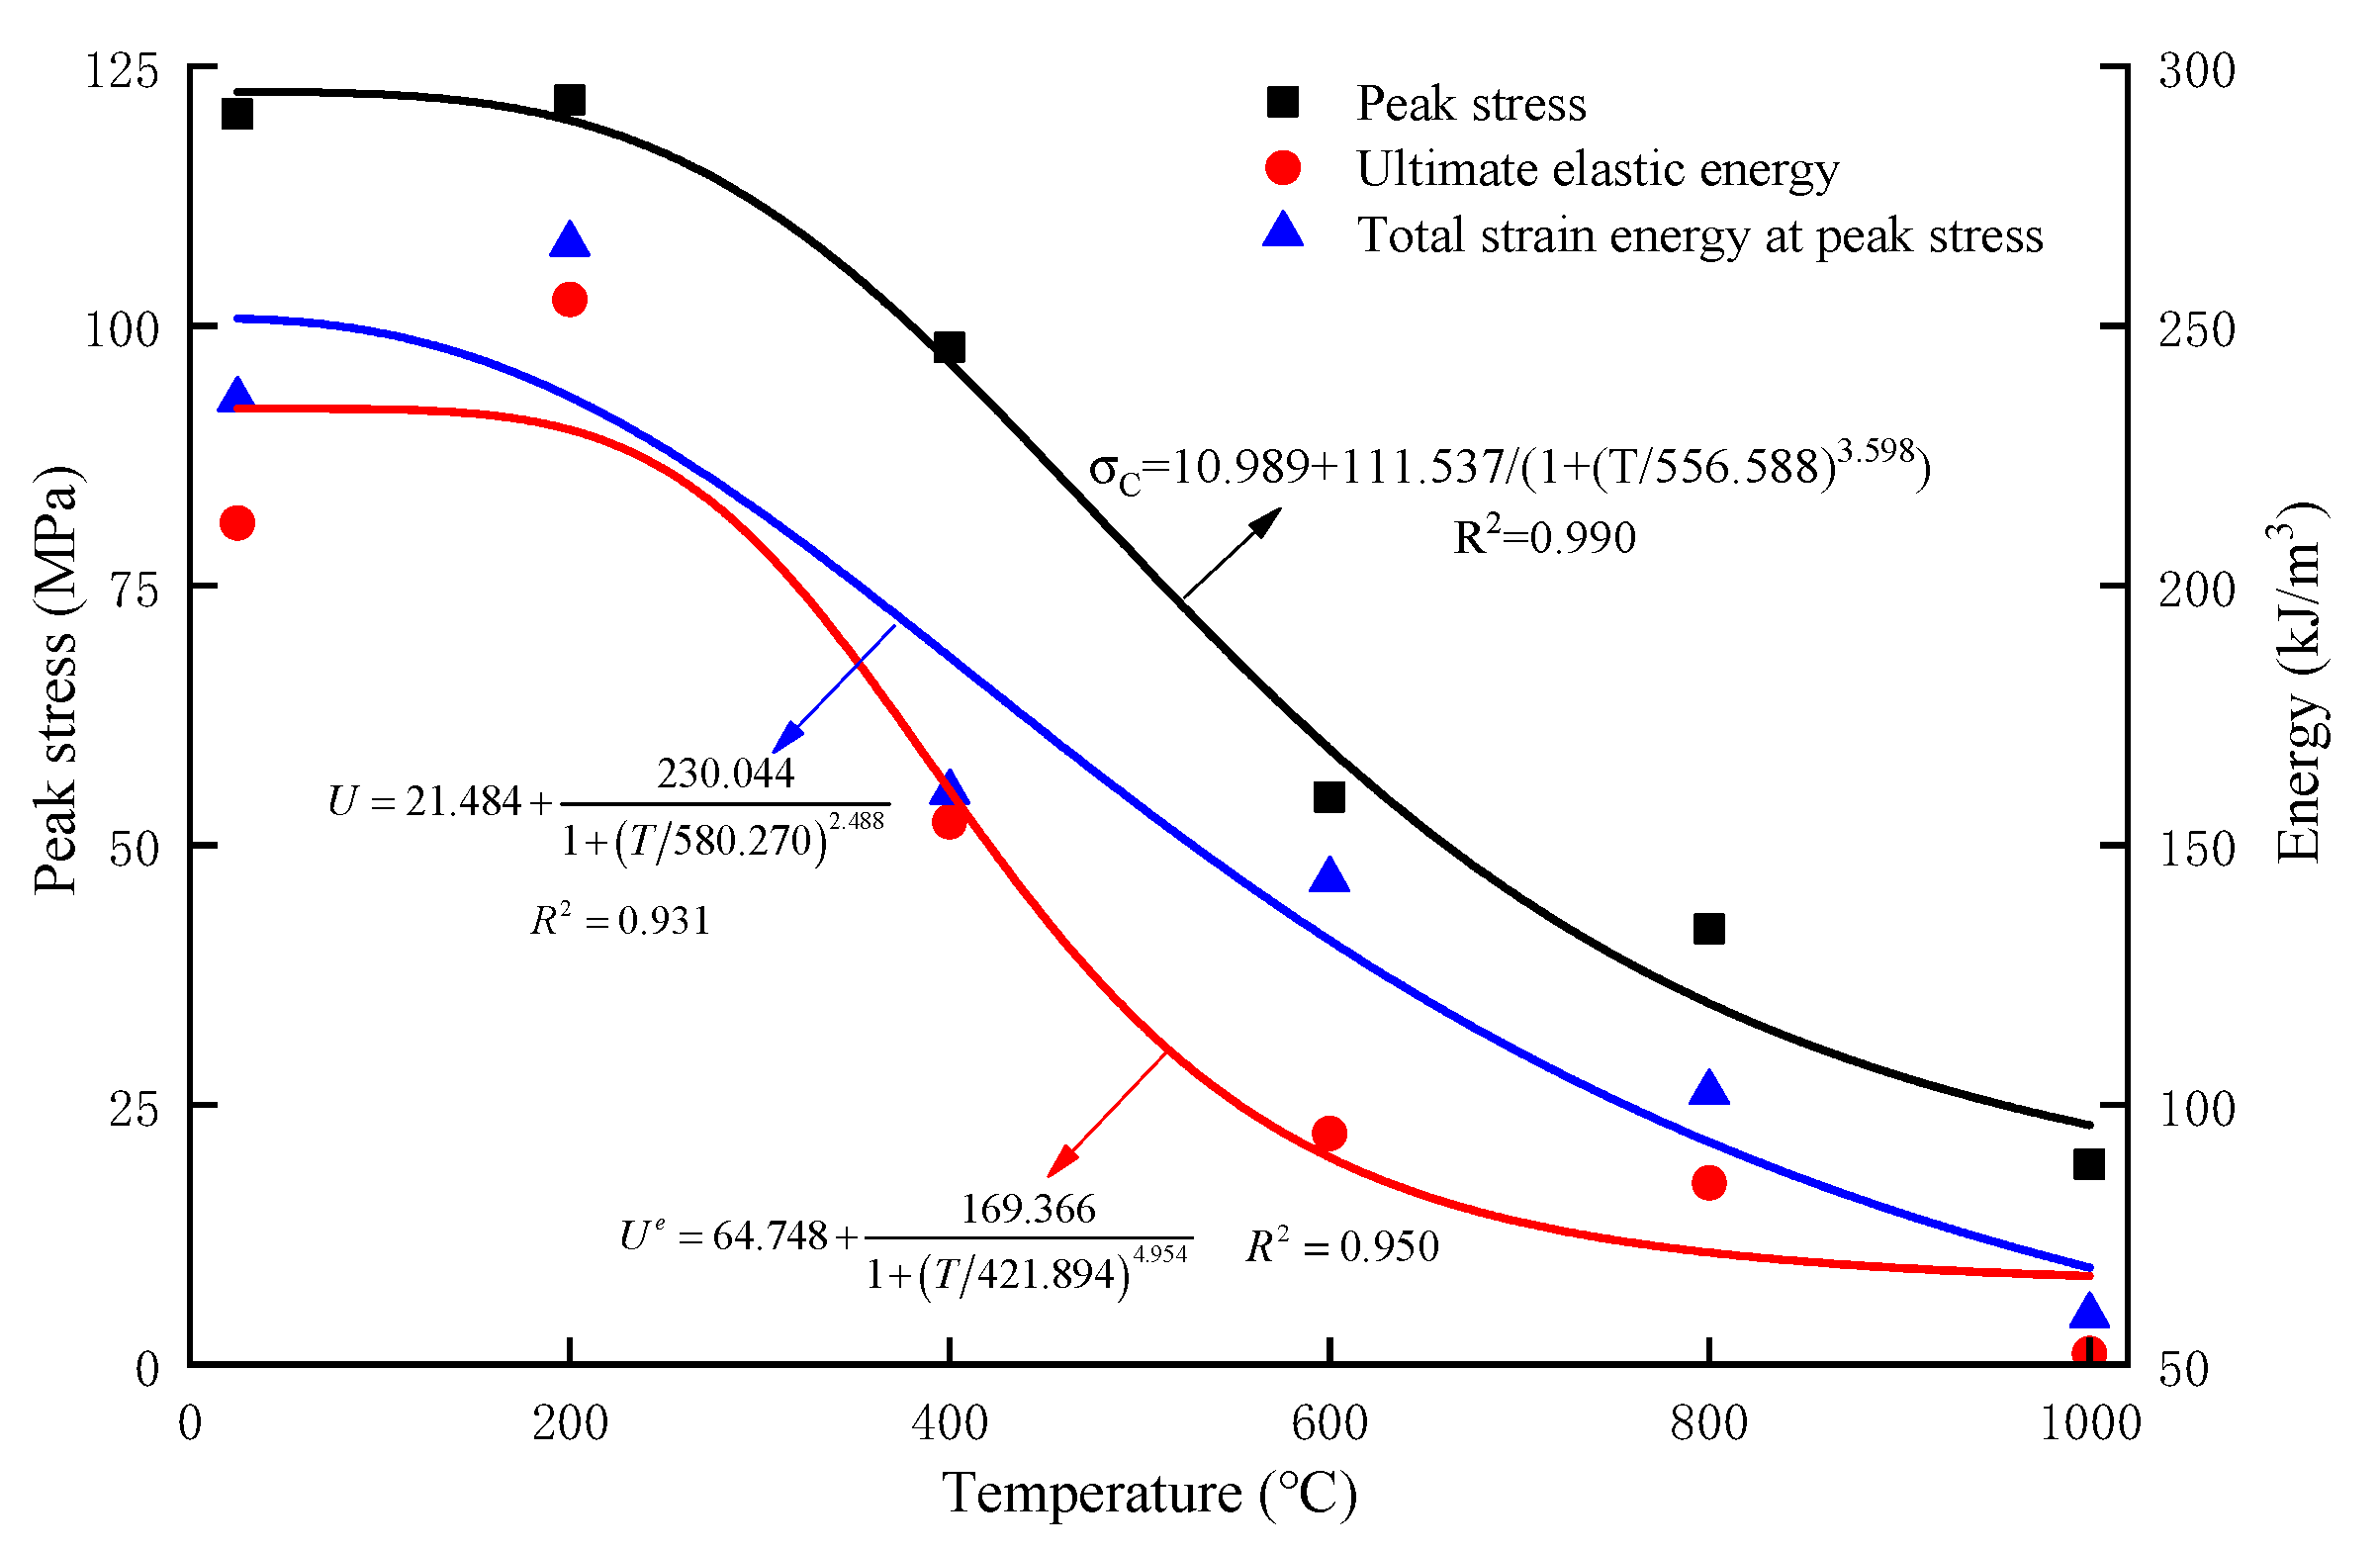
The curves of peak stress, total strain energy at peak stress, and the ultimate elastic energy with temperature at different temperatures are plotted, as shown in Figure 3.
Under uniaxial compression, the peak stress is 120.37 MPa at 25 °C and 121.77 MPa at 200 °C, which is 0.823% higher than that at 25 °C. After that, it decreases with the increase of temperature, which is 97.94 MPa at 400 °C, 54.62 MPa at 600 °C, 41.77 MPa at 800 °C and 19.30 MPa at 1000 °C. Compared with 25 °C, the decrease rates are 18.63%, 54.62%, 65.18% and 83.97%, respectively. The peak stress of rock decreases in a logistic function with the increase of temperature. The fitting function between the peak stress and temperature is as follows:
σ C = 10.989 + 111.537 1 + ( T / 556.588 ) 3.598   correlation   coefficient :   R 2 = 0.990
The total strain energy at peak stress and ultimate elastic energy o are 235.86 kJ / m 3 and 212.08 kJ / m 3 at 25 °C, 265.79 kJ / m 3 and 255.07 kJ / m 3 at 200 °C, compared with 25 °C, which increased by 12.69% and 12.25%, respectively. With the increase of temperature, it decreased to 160.23 kJ / m 3 and 154.48 kJ / m 3 at 400 °C, 143.40 kJ / m 3 and 94.53 kJ / m 3 at 600 °C, 102.44 kJ / m 3 and 84.98   kJ / m 3 at 800 °C and 59.57   kJ / m 3 and 52.12 kJ / m 3 at 1000 °C; compared with 25 °C, the decrease rates were 32.07% and 27.16%, 39.20% and 55.43%, 56.57% and 59.93%, 74.74% and 75.42%, respectively. The total strain energy at peak stress and ultimate elastic energy of rock are consistent with the variation law of peak stress with temperature, and they all decay in the logistic function with the increase of temperature. The fitting curves of the total strain energy at peak stress and ultimate elastic energy with temperature are as follows:
U = 21.484 + 230.044 1 + ( T / 580.270 ) 2.488   correlation   coefficient :   R 2 = 0.931
U e = 64.748 + 169.366 1 + ( T / 421.894 ) 4.954   correlation   coefficient :   R 2 = 0.950

2.4. Damage Evolutionary

Since the damage evolution curves of rock at different temperatures have similar forms, the damage evolution curve at the temperature of 25 °C is listed in this paper (as shown in Figure 4). At the same time, the damage analysis is carried out combined with the stress–strain curve.
According to the stress-strain curve, the damage evolution curve can be divided into four stages: (1) Initial damage reduction stage I. Due to the natural defects and non-uniformity of the internal structure of rock, there are some original micro cracks, micro holes and weak joint surfaces in the natural state of rock. Under the compression condition, these internal defects will be compacted, and the damage variable decreases with the strain. At the end of compaction stage at point A, the damage variable becomes 0. (2) Zero damage stage II. The damage variable in this stage is zero, which corresponds to the linear elastic stage in the stress-strain curve. The deformation of rock is mainly caused by the mutual compaction of mineral lattices. At this time, the original cracks and pores of rock are compressed, and there is almost no damage event in the sample. (3) Damage stability stage III. When the load reaches the yield strength of point B, the cracks in the rock begin to propagate, and the damage variable increases steadily with the axial strain, but there is no large damage or failure in the rock, and the damage value is small. When the load reaches the peak stress of point C, the long cracks and large pores in the rock sample continue to form and propagate. At this time, the damage variable suddenly increases, which can be used as the precursor information identification point of rock failure. (4) Damage accelerated to the saturation stage IV. When the loading continues, the main crack begins to penetrate, the energy is released rapidly, and the damage variable continues to increase until it reaches the saturation value of 1.

2.5. Model Validation

The constitutive model of the whole process of the deformation and failure of granite under high temperature based on energy theory is verified by experimental data. In order to highlight the contrast effect, the statistical damage constitutive model of rock based on strength theory [23] is used for comparison. Figure 5 shows the difference between the two theoretical models and the experimental curves.
The accumulation and dissipation of energy are accompanied by the whole process of rock deformation and failure. Energy dissipation can reflect the whole process of rock from micro defect to deterioration during loading. It can be seen from Figure 6 that the model can not only simulate the rock stress–strain relationship in various stages before reaching peak stress, but can also better reflect the phenomena of stress rapid decline after peak strength, which is closer to the actual situation, indicating that the thermal damage constitutive model of rock based on energy dissipation is in good agreement with the experimental curve, which verified the rationality of model. The established model reflects that the state of instability driven by energy is the essence of rock failure, which is closer to the nature of rock deformation and failure behavior.

3. Rock Brittleness Index

3.1. Energy Drop Coefficient Based on Stress-Strain Curve

As a key index of reservoir evaluation, brittleness is closely related to wellbore stability and the fracturing effect in oil and gas production engineering [24]. In deep coal mining engineering, rock brittleness is not only an important factor in engineering disasters, such as rock burst, but also affects the selection of road header pick [25,26]. Furthermore, rock brittleness is the key internal factor of rock burst risk in tunnel engineering, which determines the efficiency of the TBM tunneling and drilling rig [27,28]. Therefore, reasonable and accurate evaluation of rock brittleness is of great significance to the safe construction of deep underground engineering and the effective exploitation of resources.
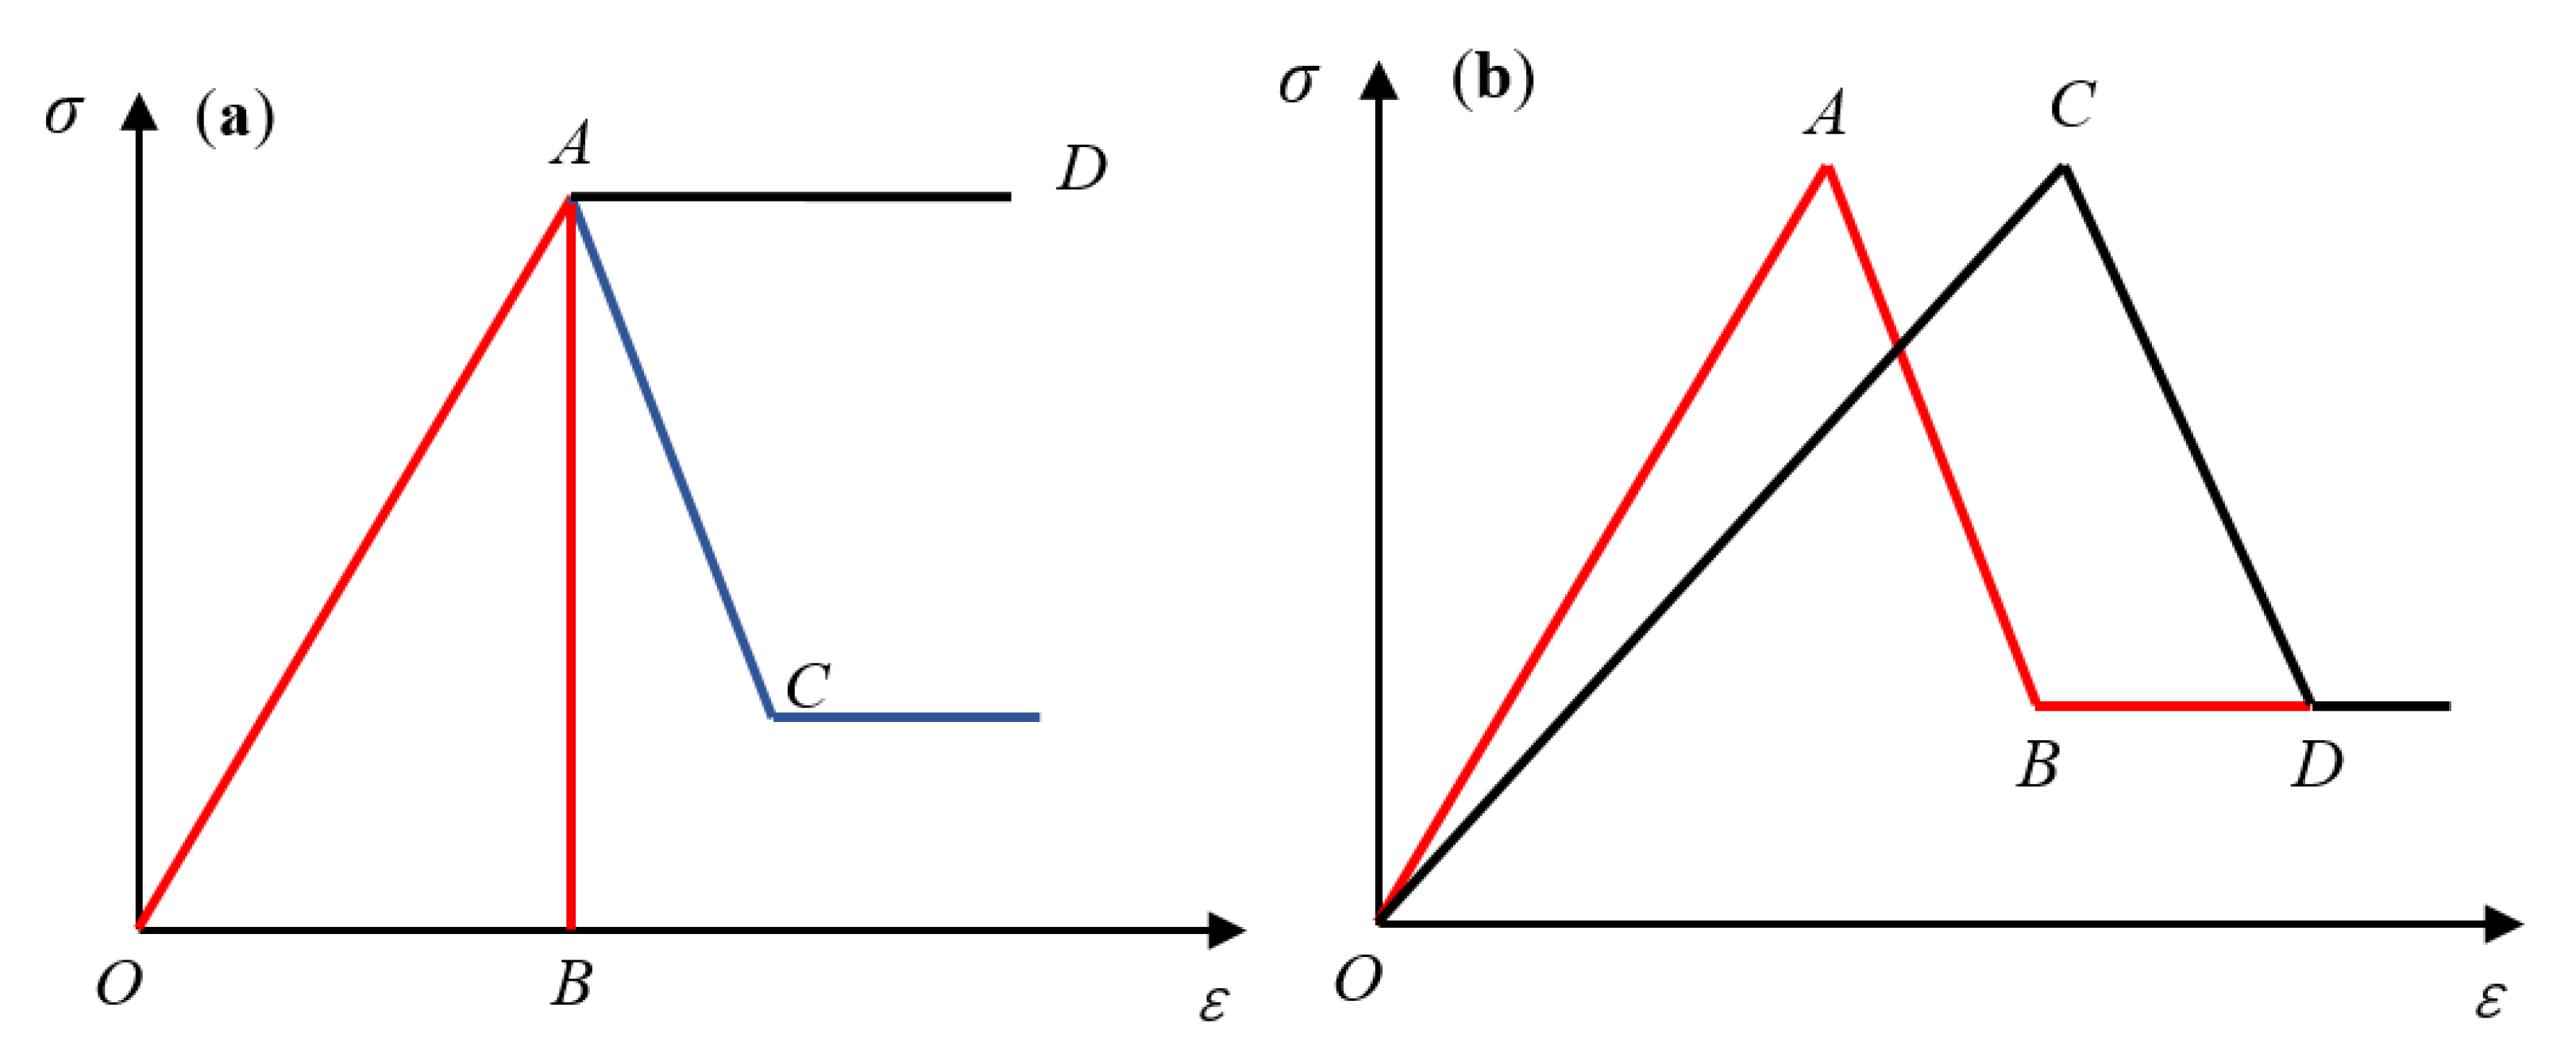
In order to establish a scientific and reasonable evaluation index of rock brittleness, the brittleness characteristics before and after peak stress should be comprehensively considered. For example, as shown in Figure 6a, the slopes of the stress–strain curves of three rocks represented by OAB, OAC and OAD are the same value before the peak stress, and the peak stress is also the same value. However, after the peak stress, the stress decline rate of curve OAB tends to infinity, indicating that the rock is in an extremely brittle state; the stress drop rate of curve OAD is equal to 0, indicating that the rock enters an ideal plastic state after reaching peak stress; while the drop rate of curve OAC is between 0 and infinity, indicating that the rock is in an elastic-plastic state. If rock brittleness is considered only from the perspective of the stress–strain curve before peak stress, the brittleness of the three rocks is the same, which obviously cannot reflect the actual situation. As shown in Figure 6b, for the two rocks represented by the stress–strain curves of OAB and OCD, the amplitude and rate of stress drop after the peak stress are the same, but from the stress–strain state before the peak stress, the rock represented by the curve OAB has a small strain to reach the peak stress, so its brittleness is greater than that represented by the OCD curve. If only the influence of stress–strain state after peak stress on rock brittleness is considered, the brittleness of the two rocks appears to be the same, which is obviously inconsistent with the actual situation.
The above analysis shows that in order to accurately evaluate rock brittleness, the influence of stress–strain state before and after peak stress on rock brittleness should be comprehensively considered.
In recent years, it has been found that the essence of rock deformation and failure is the dynamic instability caused by the accumulation of energy before peak stress and the rapid release of energy after peak stress [29,30]. Therefore, compared with other brittle indexes, the brittle index established from the viewpoint of energy can better reflect the nature of the rock brittle fracture process.
Therefore, based on the full stress–strain curve of rock failure, the energy drop coefficient H r is proposed by considering the energy evolution process of the two stages before and after the peak stress. It can be expressed as [31]:
H r = H p r e p e a k + H p o s t p e a k = U A U A e + Δ U | Δ U e | = U A U A e + U B U A | U B e U A e | = 0 ε A σ 1 d ε 1 2 μ σ 3 ε A σ A 2 4 μ σ A σ 3 2 E A + ε A ε B σ 1 d ε 1 2 μ σ 3 ( ε B ε A ) | σ B 2 4 μ σ B σ 3 2 E B σ A 2 4 μ σ A σ 3 2 E A |
where U A and U B are the total strain energy at peak stress and residual stress respectively; U A e and U B e are the elastic energy at peak stress and residual stress; σ A is peak stress, σ B is residual stress; ε A is peak strain, ε B is residual strain; E A and E B are the unloading modulus of elasticity at peak stress and residual stress respectively. H r is the ratio of the total input energy to the releasable elastic energy at peak stress. It considers not only the energy characteristics of the post-peak stage, but also the pre-peak stage.
The mechanical parameters of rock under uniaxial compression at different temperatures and the energy drop coefficient calculated according to Equation (18) are shown in Table 2.
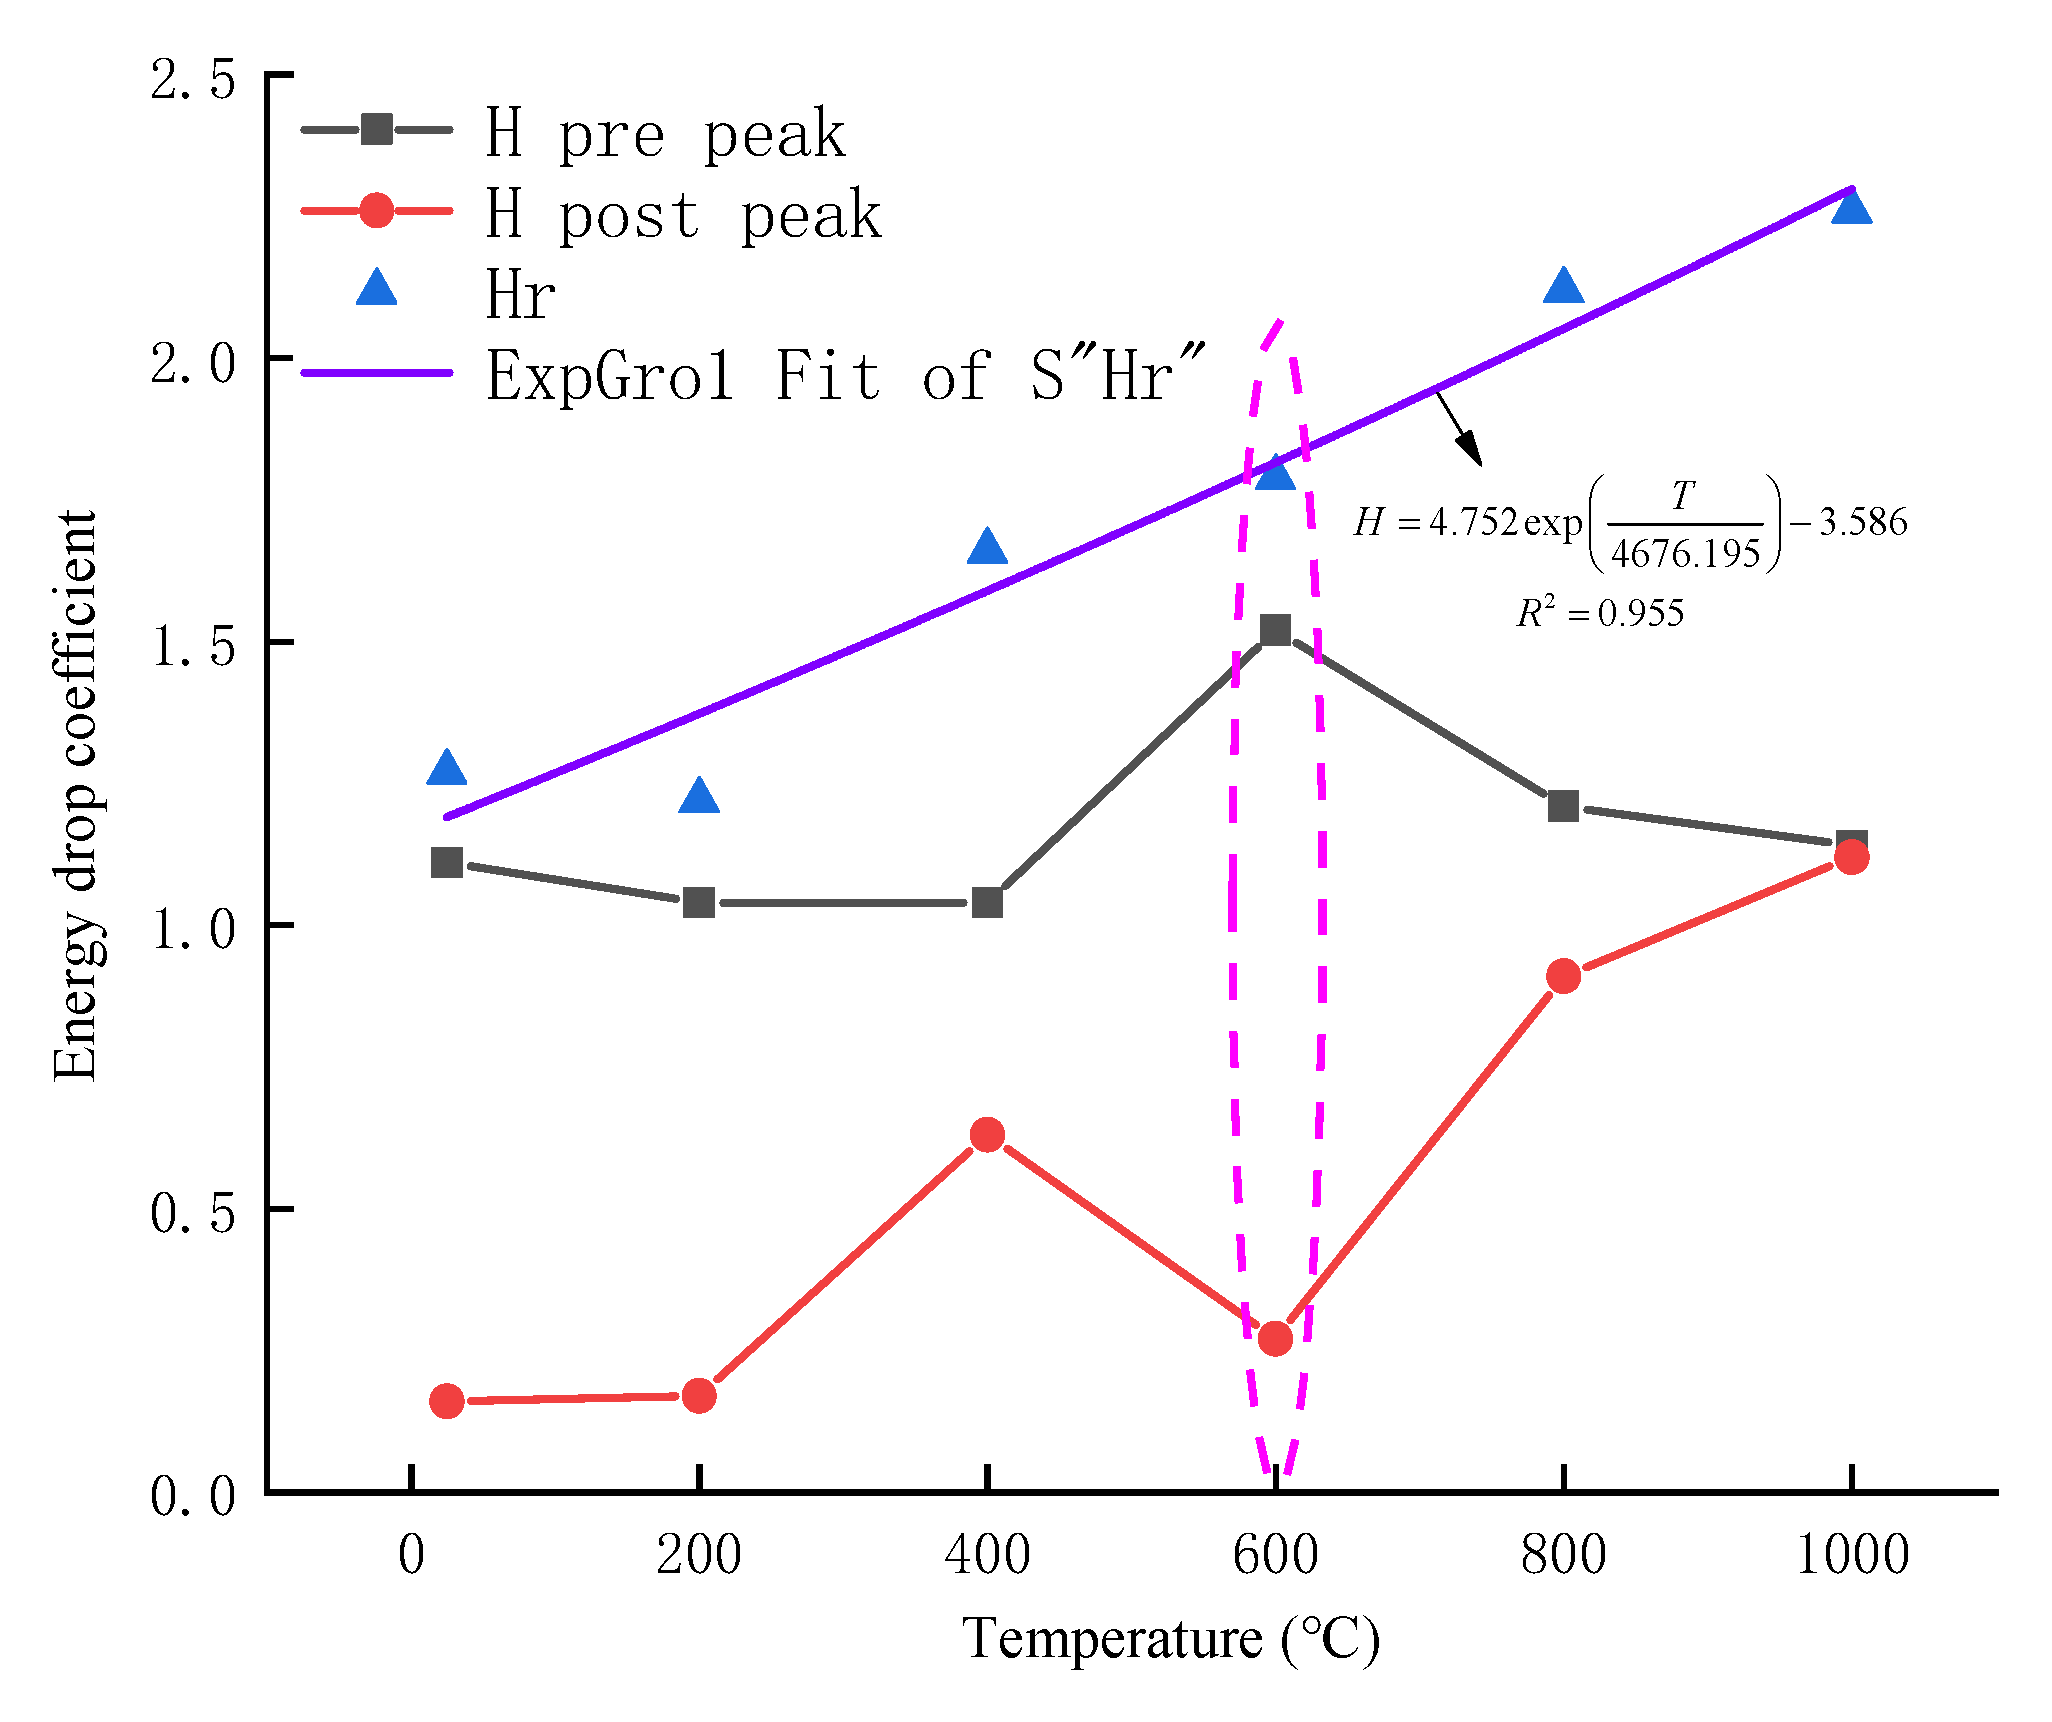
The changing trend of the energy drop coefficient with the increase of temperature can be visually shown in Figure 7. Before 400 °C, the pre-peak energy drop coefficient (H pre peak) decreases slightly with the rise of temperature, increases suddenly at 600 °C, and then decreases again. The maximum energy drop of rock at 600 °C indicates that the rock has the strongest plasticity at this temperature. The post-peak energy drop coefficient (H post peak) increases with the increase of temperature, but suddenly decreases at 600 °C, indicating that the energy drop at 600 °C is weakened and the brittleness is enhanced. Obviously, the two conclusions are contradictory. It also shows that considering the energy of rock before or after the peak alone cannot fully reflect the brittle characteristics of rock. The total energy drop coefficient (Hr), which is composed of the pre-peak and post-peak energy drop coefficients, increases exponentially with the increase of temperature, and the fitting function is:
H = 4.752 exp ( T 4676.195 ) 3.586 ,   correlation   coefficient :   R 2 = 0.955
The energy drop coefficient increases exponentially with temperature, which indicates that rock brittleness is weakening and the plasticity is increasing. According to the scanning electron microscope (SEM) pictures of the rock sample at different temperatures (25–1000 °C) in Figure 2 (each picture has a magnification of 1200 times), it can be seen that at 25 °C there are some micropores on the surface of the rock sample, but the crystal structure is relatively complete. At 200 °C, the microporous holes and microcracks developed, and the crystal structure did not change significantly. Intergranular cracks can be observed at 400 °C, the crack width is very small, and the fracture morphology is joint step shape. At 600 °C, transgranular cracks are developed, the crack width is widened obviously, and the fracture morphology is triangular micro pits. When the temperature is 800 °C, the SEM image of the sample is obviously brighter than before. The transgranular crack formed splits the crystal and connects with the intergranular crack, and part of the crystal has been destroyed. When the temperature rises to 1000 °C, the width and length of the intergranular and transgranular crack increase significantly, the connectivity is obviously enhanced, and the melting phenomenon is obvious on the crystal surface. Some crystal surfaces flake and are partially detached, and the crystal structure is seriously damaged, which reflects the characteristics of the rock changing from brittleness to plasticity with the increase of temperature. The analysis shows that the total energy drop coefficient proposed in this paper is consistent with the results observed in the laboratory test.

3.2. Brittleness Index Based on Energy Drop Coefficient

It can be seen from the above analysis that the accurate definition of rock brittleness should comprehensively analyze the mechanical properties before and after peak stress of the whole stress–strain curve. More specifically, the brittleness index should be able to characterize the ability of rock to resist plastic failure.
The greater the energy drop coefficient is, the weaker the brittleness of rock sample is. The rock brittleness index which can comprehensively reflect the energy evolution characteristics before and after peak stress is defined as:
B = 1 H r = σ A 2 4 μ σ A σ 3 2 E A 0 ε A σ 1 d ε 1 2 μ σ 3 ε A + | σ B 2 4 μ σ B σ 3 2 E B σ A 2 4 μ σ A σ 3 2 E A | ε A ε B σ 1 d ε 1 2 μ σ 3 ( ε B ε A )
In order to intuitively judge the change of the rock brittleness index under different temperatures, the brittleness index can be standardized, so that the data with a large range of changes can be assigned to the same level, which is expressed as follows:
B i = B i B min B max B min
where B i is the brittleness index after data normalization; B min is the minimum value of brittleness index; and B max is the maximum value of brittleness index.

3.3. Proctor Coefficient Based on Rock Compressive Strength

The rock firmness coefficient was put forward by M.M.Лрoтoдъякoнoв of Russia in 1926, which is often called a Proctor coefficient [32]. It is still widely used in mining and exploration excavation. The firmness of rock is different from the strength of rock. The strength value must be related to a certain deformation mode (uniaxial compression, tension and shear), and the firmness reflects the ability of rock to resist failure under the combined action of several deformation modes. Because the rock is often broken by pure pressing or pure rotation in drilling and excavation construction, this index reflecting the difficulty of rock breaking under the combined action is closer to the actual production situation.
The rock firmness coefficient represents the relative value of rock resistance to crushing. Because the compressive capacity of rock is the strongest, 1/10 of the uniaxial compressive strength limit of rock is taken as the Proctor coefficient of rock [33], which is expressed as:
f = σ c 10
where σ c is the uniaxial compressive strength of rock.
Proctor coefficient is a dimensionless value, which indicates how many times the firmness of a rock is stronger than that of dense clay, because the compressive strength of dense clay is 10 MPa. The calculation formula of rock firmness coefficient is simple and clear, and the value can be used to predict the ability of rock to resist crushing and its stability after drilling.

3.4. Brittleness Index and Proctor Coefficient with Temperature

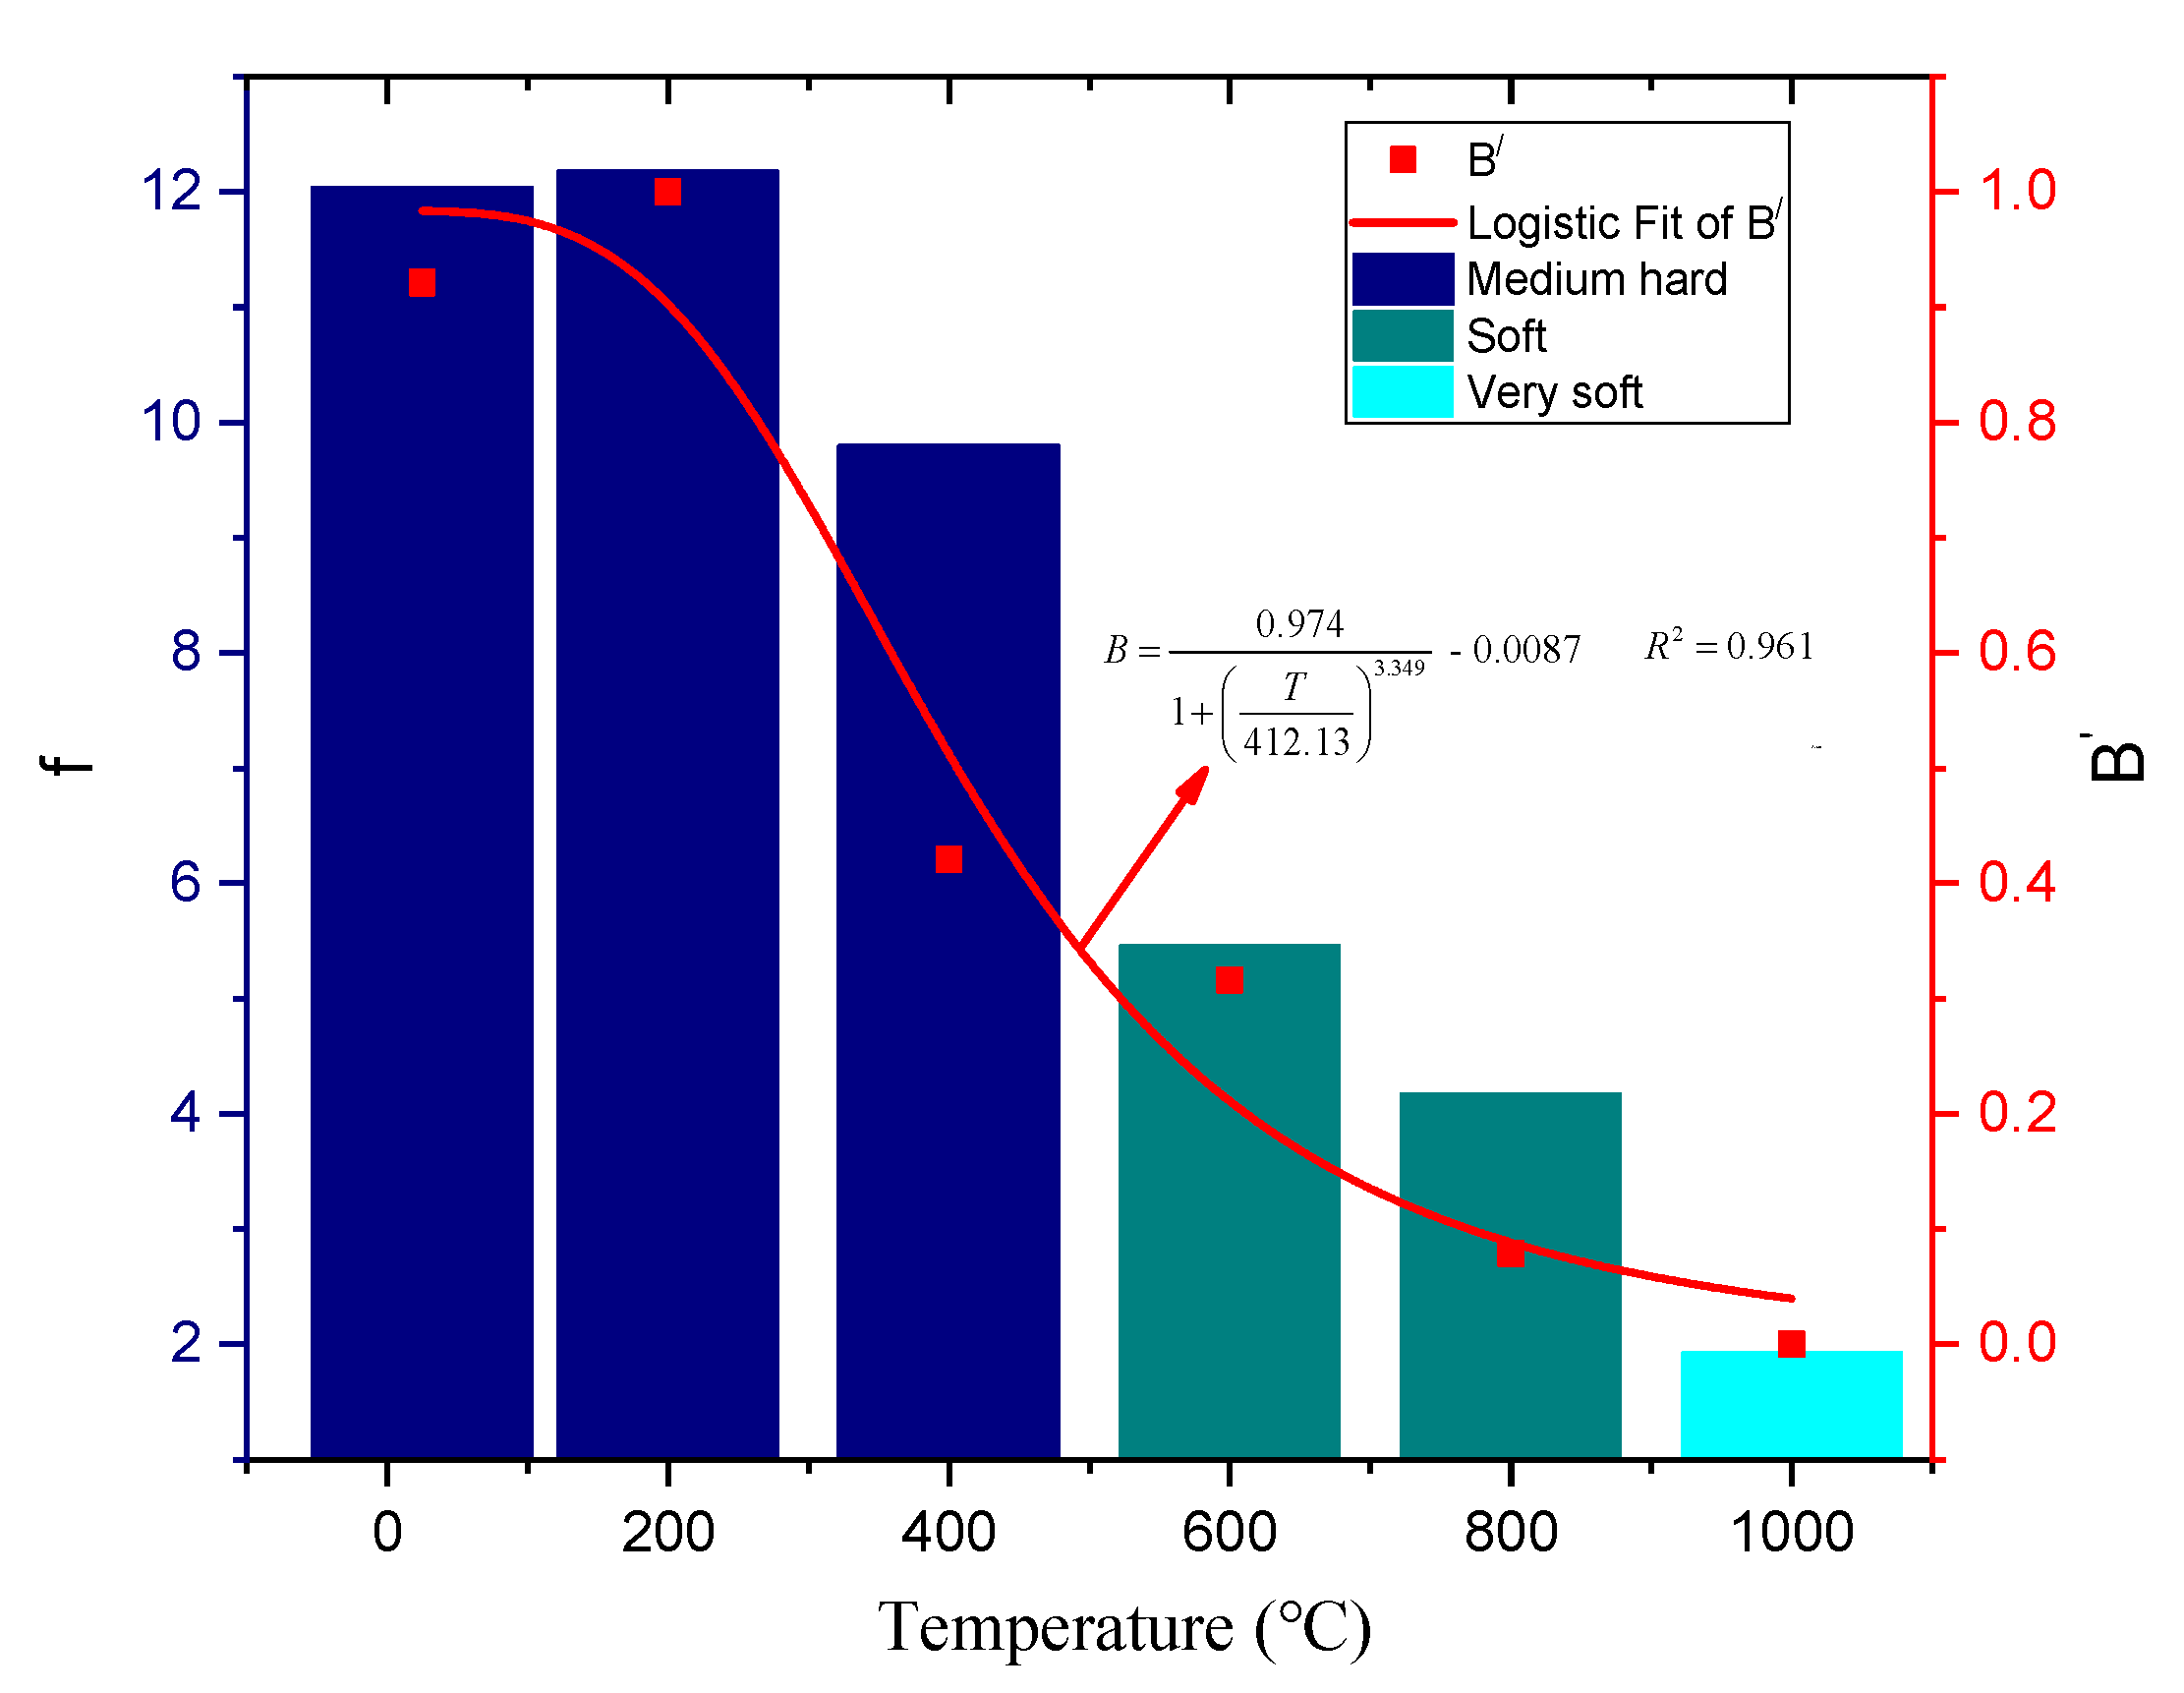
According to the Equations (20)–(22), the brittleness index and Proctor coefficient of rock at different temperatures are obtained, as shown in Table 3.
According to the Proctor coefficient, the rock is divided into five grades according to its hardness, as shown in Table 4.
The variation trend of the rock Proctor coefficient and normalized brittleness index with temperature is shown in Figure 8.
The fitting function between normalized brittleness index and temperature is as follows:
B = 0.974 1 + ( T 412.13 ) 3.349     0.0087   correlation   coefficient :   R 2 = 0.961
The brittleness index and hardness of rock samples are consistent with the variation of temperature, and both decrease with the increase of temperature. With the increase of temperature, the brittleness index decreases in a logistic function, and the brittleness weakens and the rock becomes soft.
Whether there is plastic deformation, plastic yield and the range and degree of plastic deformation before the peak value are the main reasons for the brittle failure of rocks, and the internal mechanism of this reason is the difference of rock mineral composition and structure [34]. Different mineral compositions have different particle sizes, strength parameters (strength, elastic modulus, Poisson’s ratio, coefficient of thermal expansion, etc.) and properties (brittleness). The size of the original micro defect before the initiation of the micro crack is determined by the size of the mineral composition and particle size. The strength properties and brittleness characteristics of mineral components determine the specific surface energy and shear fracture energy required for crack initiation in the grain and the tensile fracture and shear fracture through the grain. The different structure of mineral grains determines whether the microcrack occurs in a way that is transgranular, intergranular or cleavage. These factors determine whether the rock has brittle failure and the strength of brittle failure. The granite used in this paper is mainly composed of quartz, feldspar, mica and other minerals. The quartz particles have high strength and high brittleness, and are prone to brittle fracture. The mica strength is relatively low, which means that it can easily become the starting position of microcracks. According to the granite diffraction information [35], quartz occurs during a reversible reaction from α to β   at 573 °C. According to differential thermal analysis (DTA) curve, feldspar presents an endothermic valley at 700–900 °C, indicating that the structure has changed from crystalline to amorphous. At 997 °C, the lattice of mica minerals is destroyed and hydroxyl groups escape to form albite. Under the combined action of thermal stress and phase transformation, the internal cracks of rock samples are continuously cracking, expanding, fusing, penetrating and even destroying. The change of these mineral compositions is the fundamental mechanism of rock from brittle failure to plastic failure.
Through experimental comparison and theoretical analysis, it is verified that the rock brittleness index established in this paper based on the pre-peak and post-peak energy drop coefficient can effectively evaluate the rock brittleness with temperature change, and the evaluation results are in good agreement with the actual situation. The brittleness index proposed in this paper not only considers the influence of the pre-peak stress–strain, but also considers the influence of the peak stress drop. It can comprehensively reflect the energy evolution characteristics of rock in the loading process, and has good physical meaning. According to the fitting function of the rock brittleness index and temperature established in this paper, rock brittleness at different temperatures can be predicted, which provides a reference for practical engineering.

4. Discussion and Conclusions

In order to reflect the nature of rock failure, taking the damage variable as the internal variable, a new thermal damage constitutive model of rock is established by using the energy principle, effective stress principle and damage theory. The results are as follows.
(1)
The peak stress, the ultimate elastic energy and the dissipated energy at the peak value of rock decrease with the increase of temperature in a logistic function, which indicates that the mechanical properties of rock deteriorate with the increase of temperature.
(2)
The thermal damage constitutive model established on energy dissipation can reflect stress drop phenomenon at post-peak, describe the full stress–strain curve of rock failure well, verify the rationality of the model, and reflect that the nature failure of rock is the state instability driven by energy, which provides a reference for the establishment of the rock thermal damage constitutive model.
(3)
The brittleness index based on the energy drop coefficient decays as a logistic function with the increase of temperature, and the brittleness evaluation results are in good agreement with the actual situation.
It is worth noting that although the brittleness index proposed in this paper can fully reflect the energy evolution characteristics of pre-peak and post-peak stages, it also has good physical meaning. However, the influence of lithologic composition and structural characteristics on rock brittleness is ignored in this study. In order to obtain more accurate and comprehensive brittleness index, various factors affecting rock brittleness should be considered in future studies.

Author Contributions

Conceptualization, X.X.; methodology, X.X. and C.Y.; validation, C.Y. and L.X.; formal analysis, X.X.; investigation, X.X. and C.Y.; resources, C.Y. and L.X.; data curation, X.X. and C.Y.; writing—original draft preparation, X.X., C.Y. and L.X.; writing—review and editing, X.X. and C.Y. All authors have read and agreed to the published version of the manuscript.

Funding

This research was funded by the Open Research Fund of the State Key Laboratory of Coal Resources and Safe Mining, CUMT, No.SKLCRSM20KF007 and Innovation Training Program for Chinese College Students, No. 202110304040.

Institutional Review Board Statement

Not applicable.

Informed Consent Statement

Not applicable.

Data Availability Statement

Not applicable.

Conflicts of Interest

The authors declare no conflict of interest.

References

  1. Liu, L.; Ji, H.; Elsworth, D.; Zhi, S.; Lv, X.; Wang, T. Dual-damage constitutive model to define thermal damage in rock. Int. J. Rock Mech. Min. Sci. 2020, 126, 104185. [Google Scholar] [CrossRef]
  2. Xu, X.; Gao, F.; Zhang, Z. Thermo-mechanical coupling damage constitutive model of rock based on the Hoek–Brown strength criterion. Int. J. Damage Mech. 2018, 27, 1213–1230. [Google Scholar] [CrossRef]
  3. Wang, Z.L.; Shi, H.; Wang, J.G. Mechanical Behavior and Damage Constitutive Model of Granite Under Coupling of Temperature and Dynamic Loading. Rock Mech. Rock Eng. 2018, 51, 3045–3059. [Google Scholar] [CrossRef]
  4. Kirmaci, A.; Erkayaoglu, M. Thermographic analysis of failure for different rock types under uniaxial loading. Geomech. Eng. 2020, 23, 503–512. [Google Scholar]
  5. Li, E.; Gao, L.; Jiang, X.; Duan, J.; Pu, S.; Wang, J. Analysis of dynamic compression property and energy dissipation of salt rock under three-dimensional pressure. Environ. Earth Sci. 2019, 78, 388. [Google Scholar] [CrossRef]
  6. Zhou, T.B.; Qin, Y.P.; Ma, Q.F.; Liu, J. A constitutive model for rock based on energy dissipation and transformation principles. Arab. J. Geosci. 2019, 12, 492. [Google Scholar] [CrossRef]
  7. Gong, F.; Yan, J.; Luo, S.; Li, X. Investigation on the Linear Energy Storage and Dissipation Laws of Rock Materials Under Uniaxial Compression. Rock Mech. Rock Eng. 2019, 52, 4237–4255. [Google Scholar] [CrossRef]
  8. Li, Y.; Zhao, Y.; Tang, J.; Zhang, L.; Zhou, Y.; Zhu, X.; Jia, D.; Chen, M. Rock damage evolution model of pulsating fracturing based on energy evolution theory. Energy Sci. Eng. 2019, 8, 1050–1067. [Google Scholar] [CrossRef]
  9. Wen, T.; Tang, H.; Ma, J.; Liu, Y. Energy Analysis of the Deformation and Failure Process of Sandstone and Damage Constitutive Model. KSCE J. Civ. Eng. 2018, 23, 513–524. [Google Scholar] [CrossRef]
  10. Gao, L.; Gao, F.; Zhang, Z.; Xing, Y. Research on the energy evolution characteristics and the failure intensity of rocks. Int. J. Min. Sci. Technol. 2020, 30, 705–713. [Google Scholar] [CrossRef]
  11. Wang, C.; He, B.; Hou, X.; Li, J.; Liu, L. Stress–Energy Mechanism for Rock Failure Evolution Based on Damage Mechanics in Hard Rock. Rock Mech. Rock Eng. 2020, 53, 1021–1037. [Google Scholar] [CrossRef]
  12. Miao, S.J.; Liu, Z.J.; Zhao, X.G.; Huang, Z.J. Characteristics of energy dissipation and damage of Beishan granite under cyclic loading and unloading. Chin. J. Rock Mech. Eng. 2021, 40, 928–938. [Google Scholar]
  13. Zhang, Y.; Zhao, G.-F.; Li, Q. Acoustic emission uncovers thermal damage evolution of rock. Int. J. Rock Mech. Min. Sci. 2020, 132, 104388. [Google Scholar] [CrossRef]
  14. Gong, F.Q.; Zhang, P.L.; Luo, S.; Li, J.; Huang, D. Theoretical damage characterization and damage evolution process of intact rocks based on linear energy dissipation law under uniaxial compression. Int. J. Rock. Mech. Min. 2021, 146, 104858. [Google Scholar] [CrossRef]
  15. Xie, H.P.; Ju, Y.; Li, L.Y.; Peng, R.D. Energy mechanism of deformation and failure of rock masses. Chin. J. Rock Mech. Eng. 2008, 27, 1729–1740. [Google Scholar]
  16. Yang, S.Q.; Peng, X.; Ranjith, P.G. Damage model of coal under creep and triaxial compression. Int. J. Rock Mech. Min. 2015, 80, 337–345. [Google Scholar] [CrossRef]
  17. Liu, X.; Ning, J.; Tan, Y.; Gu, Q. Damage constitutive model based on energy dissipation for intact rock subjected to cyclic loading. Int. J. Rock Mech. Min. Sci. 2016, 85, 27–32. [Google Scholar] [CrossRef]
  18. Xu, Y.; Li, C.J.; Zheng, Q.Q.; Ni, X.; Wang, Q.Q. Analysis of energy evolution and damage characteristics of mudstone under cyclic loading and unloading. Chin. J. Rock Mech. Eng. 2019, 38, 2084–2091. [Google Scholar]
  19. Gao, W.; Chen, X.; Hu, C.; Zhou, C.; Cui, S. New damage evolution model of rock material. Appl. Math. Model. 2020, 86, 207–224. [Google Scholar] [CrossRef]
  20. Jin, F.N.; Jiang, M.R.; Gao, X.L. Defining damage variable based on energy dissipation. Chin. J. Rock Mech. Eng. 2004, 23, 1976–1980. [Google Scholar]
  21. Lemaitre, J. How to use damage mechanics. Nucl. Eng. Des. 1984, 80, 233–245. [Google Scholar] [CrossRef]
  22. Cao, R.L.; He, S.H.; Wei, J.; Wang, F. Study of modified statistical damage softening constitutive model for rock considering residual strength. Rock. Soil. Mech. 2013, 34, 1652–1660. [Google Scholar]
  23. Xu, X.; Karakus, M. A coupled thermo-mechanical damage model for granite. Int. J. Rock Mech. Min. Sci. 2018, 103, 195–204. [Google Scholar] [CrossRef]
  24. Wang, H.T.; He, M.M.; Pang, F.; Chen, Y.; Zhang, Z. Energy dissipation-based method for brittleness evolution and yield strength determination of rock. J. Petrol. Sci. Eng. 2021, 200, 108376. [Google Scholar] [CrossRef]
  25. Singh, S. Brittleness and the mechanical winning of coal. Min. Sci. Technol. 1986, 3, 173–180. [Google Scholar] [CrossRef]
  26. Xia, Y.J.; Li, L.C.; Tang, C.A.; Ma, S. Rock brittleness evaluation based on stress dropping rate after peak stress and energy ratio. Chin. J. Rock Mech. Eng. 2016, 35, 1141–1154. [Google Scholar]
  27. Yarali, O.; Kahraman, S. The drillability assessment of rocks using the different brittleness values. Tunn. Undergr. Space Technol. 2011, 26, 406–414. [Google Scholar] [CrossRef]
  28. Chen, G.Q.; Wu, J.C.; Jiang, W.Z.; Li, S.; Qiao, Z.; Yang, W.B. An evaluation method of rock brittleness based on the whole process of elastic energy evolution. Chin. J. Rock Mech. Eng. 2020, 39, 901–911. [Google Scholar]
  29. Zhang, J.; Ai, C.; Li, Y.W.; Zeng, J.; Qiu, D.Z. Brittleness evaluation index based on energy variation in the whole process of rock failure. Chin. J. Rock Mech. Eng. 2017, 36, 31–45. [Google Scholar]
  30. Zhang, Y.; Feng, X.-T.; Yang, C.; Han, Q.; Wang, Z.; Kong, R. Evaluation Method of Rock Brittleness under True Triaxial Stress States Based on Pre-peak Deformation Characteristic and Post-peak Energy Evolution. Rock Mech. Rock Eng. 2021, 54, 1277–1291. [Google Scholar] [CrossRef]
  31. Song, H.Q.; Zuo, J.P.; Chen, Y.; Li, L.; Hong, Z. Revised energy drop coefficient based on energy characteristics in whole process of rock failure. Rock. Soil. Mech. 2019, 40, 91–98. [Google Scholar]
  32. Баpaнoв, E.Г.; Xu, X.H. Application of Proctor’s firmness coefficient of rock. Min. Eng. 1985, 1, 17–18. [Google Scholar]
  33. Xu, L.F.; Wang, T. Stability classification of roadways based on testing of rock mechanical properties. Coal Technol. 2017, 36, 90–93. [Google Scholar]
  34. Zhou, H.; Meng, F.Z.; Liu, H.T.; Zhang, C.Q.; Lu, J.J.; Xu, R.C. Experimental study on characteristics and mechanism of brittle failure of granite. Chin. J. Rock Mech. Eng. 2014, 33, 1822–1827. [Google Scholar]
  35. Xu, X.L.; Gao, F.; Zhang, Z.Z. Influence of confining pressure on deformation and strength properties of granite after high temperatures. Chin. J. Geotech. Eng. 2014, 36, 2246–2252. [Google Scholar]
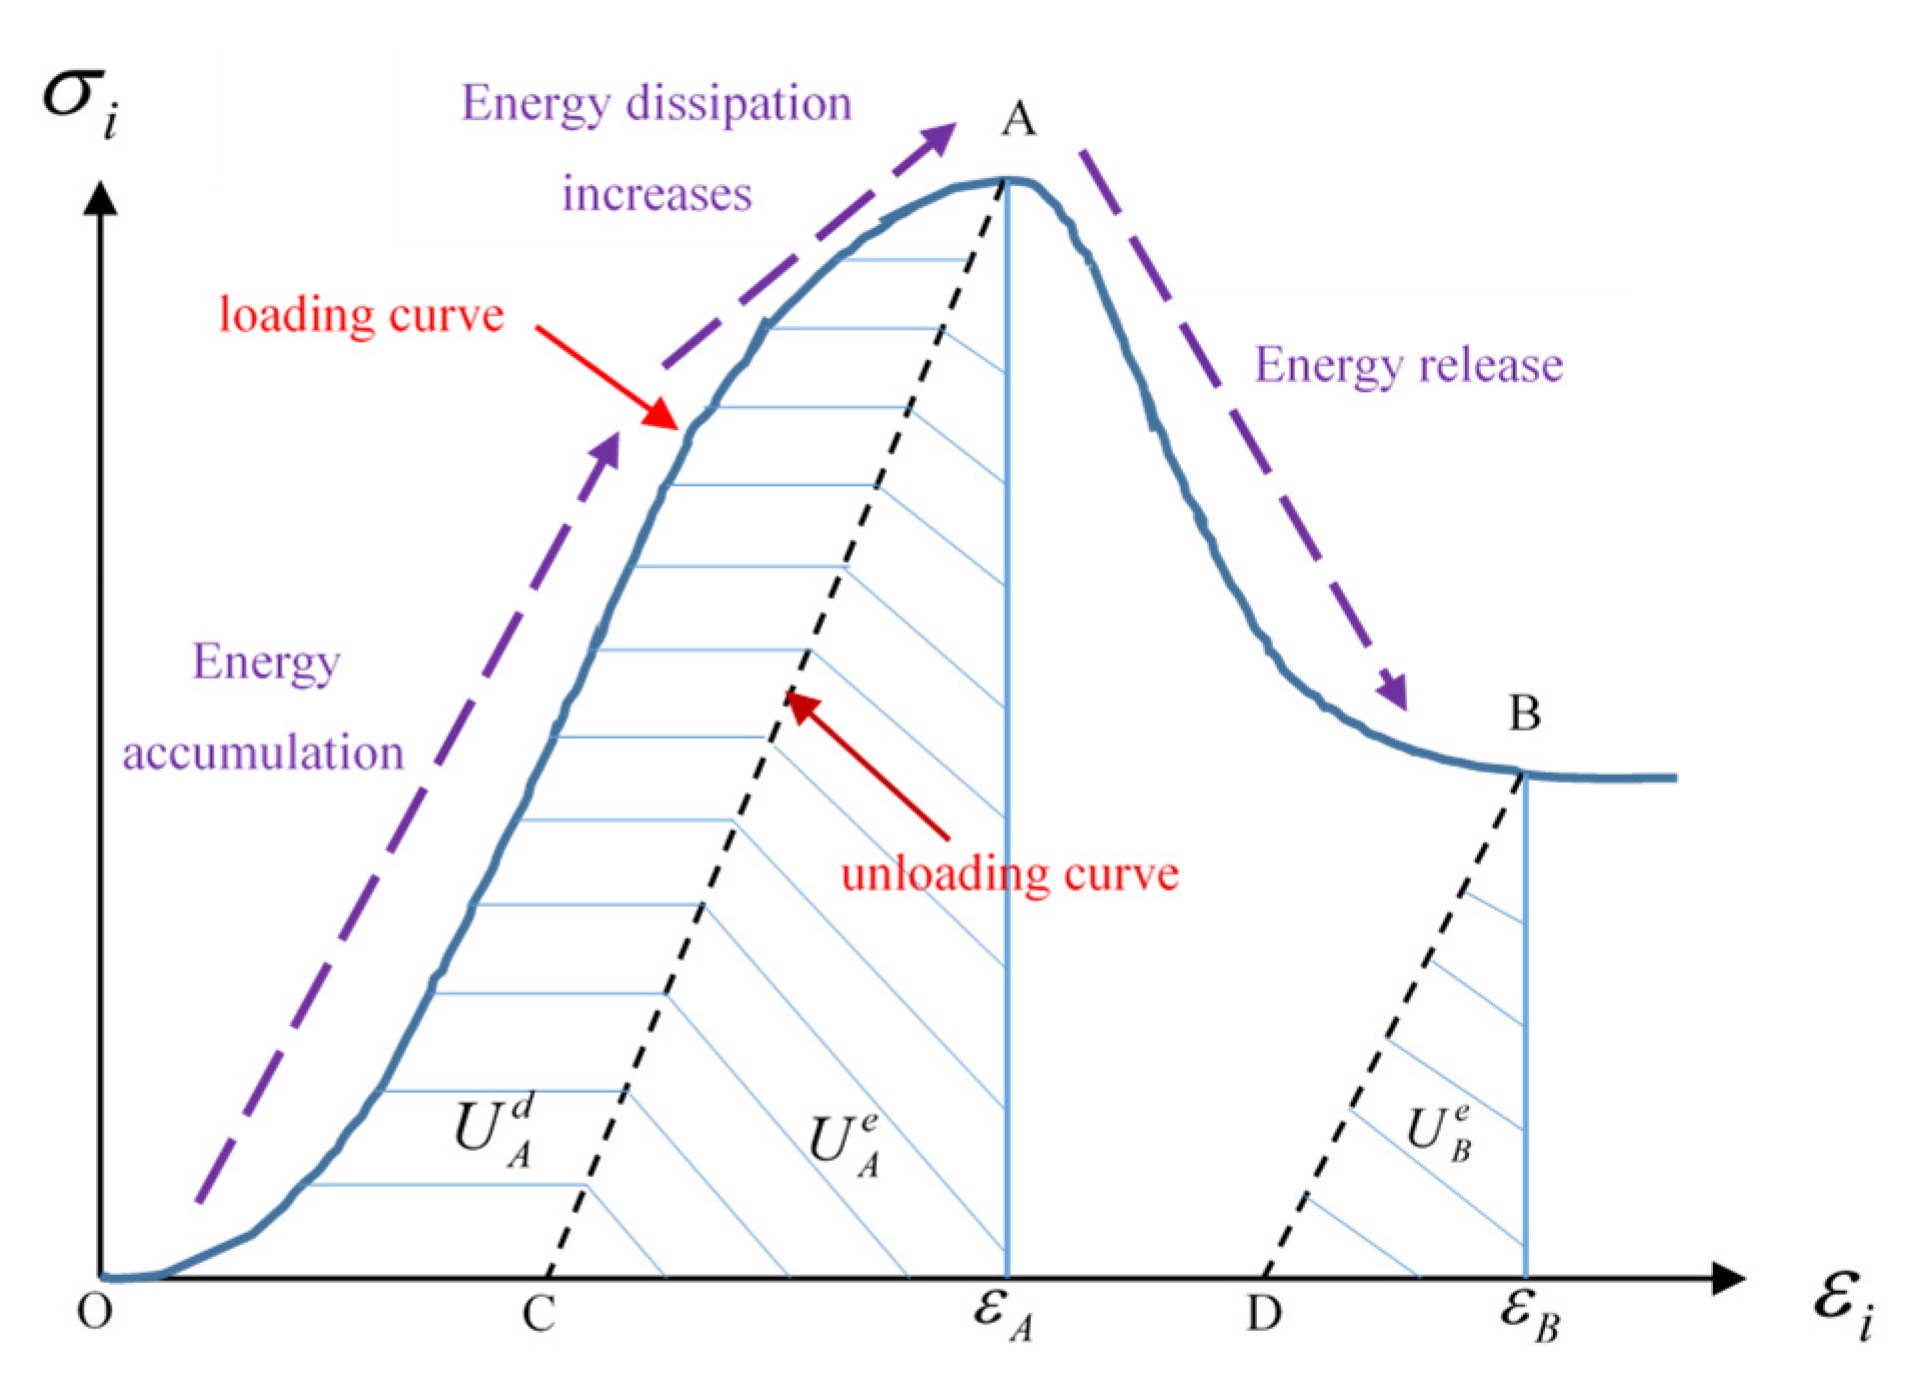
Figure 1. Complete stress-strain curve of brittle rock failure.
Mathematics 10 00410 g001
Figure 2. Stress strain and energy curves of rock under uniaxial compression at various temperatures.
Mathematics 10 00410 g002
Figure 3. Variation of peak stress, ultimate elastic energy and total strain energy at peak value with temperature.
Mathematics 10 00410 g003
Figure 4. Rock damage evolution curve and stress-strain curve at 25 °C.
Mathematics 10 00410 g004
Figure 5. Comparison between experimental and theoretical curves at various temperatures.
Mathematics 10 00410 g005
Figure 6. Simplified stress-strain curves of several typical rocks (a) The stress-strain curves before the peak stress are the same but different after the peak stress (b)The stress-strain curves before the peak stress are different but the same after the peak stress.
Mathematics 10 00410 g006
Figure 7. Energy drop coefficient with temperature.
Mathematics 10 00410 g007
Figure 8. Proctor coefficient and normalized brittleness index of rock with temperature.
Mathematics 10 00410 g008
Table 1. Various damage models for rock.
Damage ModelCalibration TestResearchers
D = 1 exp [ B | Y Y 0 | 1 n ]
Y is the damage energy release rate; Y 0 is the initial damage energy release rate; B, n are parameters.
uniaxial cyclic compression tests on sandstone Xie et al., 2008 [15]
D = 1 exp { α [ ( s i j e i j U 0 d U 0 ) 2 ] β }
α , β are parameters; Ud is the dissipated energy; U 0 d is the dissipated energy corresponding to the initial damage.
triaxial compression tests on coal in the Xingan mineYang et al.,
2015 [16]
D = U d U
U d is dissipated energy; U is constitutive energy.
uniaxial loading tests on sandy mudstonesLiu et al., 2016 [17]
D = i = 1 N t U d i / U d t
U d i is the dissipated energy produced by the i-th cycle of specimen; U d t is the total dissipated energy; N t is the cumulative number of cycles under each level of load (i = 1, 2, 3).
cyclic loading and unloading tests on mudstone in Hunan province of ChinaXu et al., 2019 [18]
D c = 1 1 C c + λ c [ ( σ 1 σ 3 ) σ c 3 σ 1 2 + σ 2 2 + σ 3 2 2 μ ( σ 1 σ 2 + σ 2 σ 3 + σ 1 σ 3 ) ]
D t = 1 1 C t + λ t [ σ 3 σ t 3 σ 1 2 + σ 2 2 + σ 3 2 2 μ ( σ 1 σ 2 + σ 2 σ 3 + σ 1 σ 3 ) ]
Dc, Dt are rock damage in triaxial compression and tension tests respectively, Cc, λ c , Ct and λ t are parameters.
test and simulation of failure process on granite Gao et al., 2020 [19]
Table 2. Mechanical parameters and energy drop coefficient of rock at different temperatures.
T
/°C
ε A
/ 10 3
σ A
/ MPa
ε B
/ 10 3
σ B
/ MPa
E
/GPa
U A /
( k J / m 3 )
U A e /
( k J / m 3 )
U B /
( k J / m 3 )
U B e /
( k J / m 3 )
H
Pre
Peak
H
Post
Peak
Hr
254.16120.376.039.2431.31235.86212.08268.712.731.110.161.27
2004.83121.778.008.3628.56265.79255.07309.692.451.040.171.22
4004.2397.947.865.0827.54160.23154.48256.450.941.040.631.66
6005.8654.629.094.8210.78143.4094.53168.481.471.520.271.79
8005.7741.7711.064.198.74102.4484.98177.942.011.210.912.12
10006.4419.3013.702.923.2259.5752.12115.082.651.141.122.26
Table 3. Brittleness index and Proctor coefficient of rock at different temperatures.
T/°C H r B B f
251.270.79 0.9212.04
2001.220.821.0012.18
4001.660.600.429.79
6001.790.560.325.46
8002.120.470.084.18
10002.260.440.001.93
Table 4. Rock hardness classification.
Hardness of RockVery HardHardMedium HardSoftVery Soft
Proctor coefficient
f
>2016–208–162–8<2
Publisher’s Note: MDPI stays neutral with regard to jurisdictional claims in published maps and institutional affiliations.