1. Introduction
In recent years, technological progress and digital transformation, which began with Big Data and Artificial Intelligence (AI), have transformed society. In a parallel way, the current COVID-19 pandemic has had a devastating effect on the world population at all socioeconomic levels and has significantly impacted healthcare and biomedical research. This has led institutions to explore possible synergies between the fields of computational statistics and healthcare with a view to analyze the large quantity of data in medical records. The information in these databases could be effectively used to support decision-making and thus improve the quality of patient care [
1].
In this sense, computational statistics, a field currently in exponential growth, has developed new statistical analysis tools and algorithms in an effort to deal with new needs in all knowledge areas, but particularly in biomedicine [
2]. However, innovative technological methods that work with large data repositories have created new problems, such as those related to dimensionality and missing data [
3,
4]. More specifically, this study highlights the need to explore more effective ways of improving data searches in clinical profiles.
Missing data are a common problem in most research fields since they introduce an element of ambiguity in data analyses. This ambiguity may occur for different reasons such as sample mishandling, measurement errors, dropped outliers, or simply a lack of analysis. It is well known that in healthcare, missing data [
5] can significantly reduce the size of the sample if the analysis only considers complete cases. When missing data are ignored, this can result in biased parameter estimations.
For this reason, multiple imputation by chained equations (MICE) has emerged as the leading strategy to replace missing epidemiological data because of its simplicity and capacity to maintain unbiased effect estimates and valid inferences. According to the literature on the topic, non-parametric tree-based imputation methods outperform parametric methods in terms of bias and coverage when there are interactions or other nonlinear effects between variables. However, these studies do not provide a fair comparison, since they do not follow the generally accepted recommendation that any effect on the final analysis model (including interactions) should be included in the parametric imputation model. In fact, simulation has been used to show that the incorporation of interactions in the parametric imputation model leads to a much better performance.
This analysis used two different MICE techniques. The first technique was the sample method that performs a simple random sample, based on the observed values, and returns them as imputations under the assumption that the data are missing at random (MAR). The second technique is predictive mean matching (PMM), which reduces the bias in a dataset by drawing real values sampled from the data and building a small subset of observations where the outcome variable matches the outcome of the observations with missing values.
In this sense, data applications in the context of functional data analysis (FDA) are of particular importance since they provide a new access route for similar situations in multicenter studies [
6,
7].
This study addresses the problem of dimensionality by contrasting results obtained with different dimensionality reduction techniques. These include the principal components analysis (PCA) [
8] and the random forest (RF) [
9] by the Gini index and information value by weight of evidence (WOE) (RF&IV), [
10,
11]. It also used parallel analysis with simulated data and data resampling (PA-RES) for optimal factor-variable selection and the reduction of the analysis space in order to generate new profile groups with similar characteristics [
12].
2. Materials and Methods
In order to deal with dimensionality and missing data and thus obtain optimal patient profile grouping, clinical practice guidelines currently place great emphasis on improving existing healthcare models. The objective is to coherently classify patients, based on an accurate diagnosis and effective clinical and healthcare management. Evidently, the evolution of comorbidities in these patients is an important healthcare challenge that depends on a wide range of factors, such as strict adherence to prescribed treatments, healthy lifestyle habits, and the ability to recognize the signs and symptoms of COPD exacerbation with a view their prevention and/or treatment by means of a self-management plan.
In this context, we selected 32 epidemiological, clinical, and outcome variables to optimize dimensional reduction and obtain a coherent classification of patients. At the same time, our study also focused on the search for clinical profiles with a set of characteristics linked to the development of a chronic disease. This points the way to a new access route for dealing with similar situations in multicenter studies.
To best achieve our objectives, multivariate imputation was used to solve the problem of missing data. The MICE method [
13] was thus implemented along with other techniques, such as the sample method and predictive mean matching [
14], which perform well with the clinical data and reduce the bias in the feature selection process.
In this sense, missing values are the first obstacle to modeling when there is 5–20% or more data loss. This problem can be solved with the use of imputation techniques. In fact, the choice of technique greatly influences the predictive capacity of the model. In most statistical analysis methods, listwise deletion is the default method used to impute missing data. Nevertheless, it does not always perform well since it tends to lead to information loss, and sometimes these data are necessary since they make other less relevant factor variables meaningful for the analysis.
Some software packages work better with continuous variables and others with categorical ones. It is thus a question of selecting the method best suited to the research data and objectives. In this case, the package chosen was Multiple Imputation by Chained Equations (MICE) because it is one of the most widely used in R and also because it creates multiple imputations. The use of multiple imputations helps to reduce bias and has the advantage of increasing efficiency in comparison to a single imputation (e.g., the mean) that deals with uncertainty in missing data.
In addition, one of the most important characteristics of MICE is that it assumes that missing data are missing at random (MAR). This means that the probability of a missing value only depends on observed values and can be predicted by using them. For these particular data, we assume that the missing data are missing at random (MAR) because the missing value is related to some of the observed data of these measured variables, which was not completed due to lack of clinical follow-up. In addition, the observed and missing data are visualized to see if they present any type of specific behavior. The missing value shows a general pattern with scattered missing data randomly throughout the data matrix, and that may be conditioned by the observations of other variables of the data set different from the main one, so they can be estimated from these observations. Therefore, we assume that the missing data are MAR.
Furthermore, one of the advantages of MICE is that it imputes data on a variable-by-variable basis by specifying one imputation model per variable. It is also able to handle different types of variables and can manage the imputation of variables defined on a subset of the data.
However, depending on the type of variable, there are also other methods that can be used for the imputation of missing data [
15]. These include Amelia [
16], missForest [
17,
18], Hmisc [
19], and mi [
20]. Despite the advantages of the previously described methods, MICE was still regarded as the best choice for our study because it is a very versatile and adaptable technique for all types of clinical variables. It imputes data on a variable-by-variable basis and then combines the results to reduce the uncertainty in the missing values.
It goes without saying that handling missing values is a crucial step in data preprocessing with machine learning. It is a fact that most of the algorithms used for data in the feature selection process and the classification or estimation process only analyze complete datasets. For this reason, in many cases, the strategy used for missing values [
21] only consists of analyzing instances with complete data or of replacing missing values with a mean, mode, median, or a constant value. Generally speaking, discarding missing samples or replacing missing values often causes biases in subsequent analyses of the data sets. For this reason, the decision was taken to apply multivariate imputation using MICE.
Similarly, different multivariate techniques were applied by means of principal components analysis (PCA) to reduce dimensionality. RF&IV defined the selection of variable importance with random forest methods [
22,
23] by the Gini index and information value by weight of evidence (WOE). The objective was to contrast and, when possible, further reduce the dimensional space of the data-variables. Also applied was parallel analysis with simulated data and data resampling (PA-RES) based on the random correlation matrix. These techniques help to reduce the selection of variable importance by simplifying the analysis space and only saving and considering relevant and accurate information. Our aim was to thus provide a better clinical solution that is a true reflection of the actual population, and at the same time, generate patient profile groups with identical affinities. Our study shows that this method was able to effectively deal with the reduction of dimensional space.
After these analytical phases, the objective was to improve the performance capacity of the high dimensional clinical database by optimally extracting the results and specifically focusing on the problem of dimensionality reduction. It was also a question of dealing with the problem of missing values in order to properly classify patients based on shared characteristics.
In this sense, the calculations were performed with the statistical software R [
24]. All hypothesis contrasts had a p-value of 0.05. The procedure was carried out in various steps. Firstly, MICE was used to impute the missing values. Secondly, different techniques were applied to reduce the dimensional space of the set of data-variables. Of the different methods tested (i.e., PCA, RF&IV, and PA-RES), PCA was found to yield the best results. The final step was the description of the preliminary classification of the profile groups. Their shared characteristics highlight the clinical results obtained by means of optimal dimensional reduction.
The source of information for this study was the original database of the AUDIPOC Study [
25]. The descriptive–exploratory analysis (
Table 1) of the 5178 patients admitted for exacerbation of chronic obstructive pulmonary disease (eCOPD) showed that (i) 87% were men and 13% women (with a mean age 73 years); (ii) 83% were smokers; and (iii) only 68% had spirometry performed on admission or discharge. All of the patients presented diverse characteristics and clinical pathologies, depending on the severity and progression of the primary disease. More specifically, 35% of the patients had an average hospital stay of 10 days; 11% required ventilation support; and 28% were readmitted for exacerbation of COPD. Of these patients, almost all of them (27%) were readmitted after 90 days with a 5% rate of positive exitus.
3. Results
The statistical software R [
24] (version 4.1.0) is used to perform the analysis because it is able to compensate aspects of the imputation of missing values [
26] in certain variables of the dataset. This is achieved with various methods in the MICE package [
27] (sample and predictive mean matching), with a view to completing and improving the final results. Similarly, R provides the platform for the application of the different multivariate analysis techniques using PCA, RF&IV, and PA-RES in order to reduce and optimize the dimensional space of the dataset.
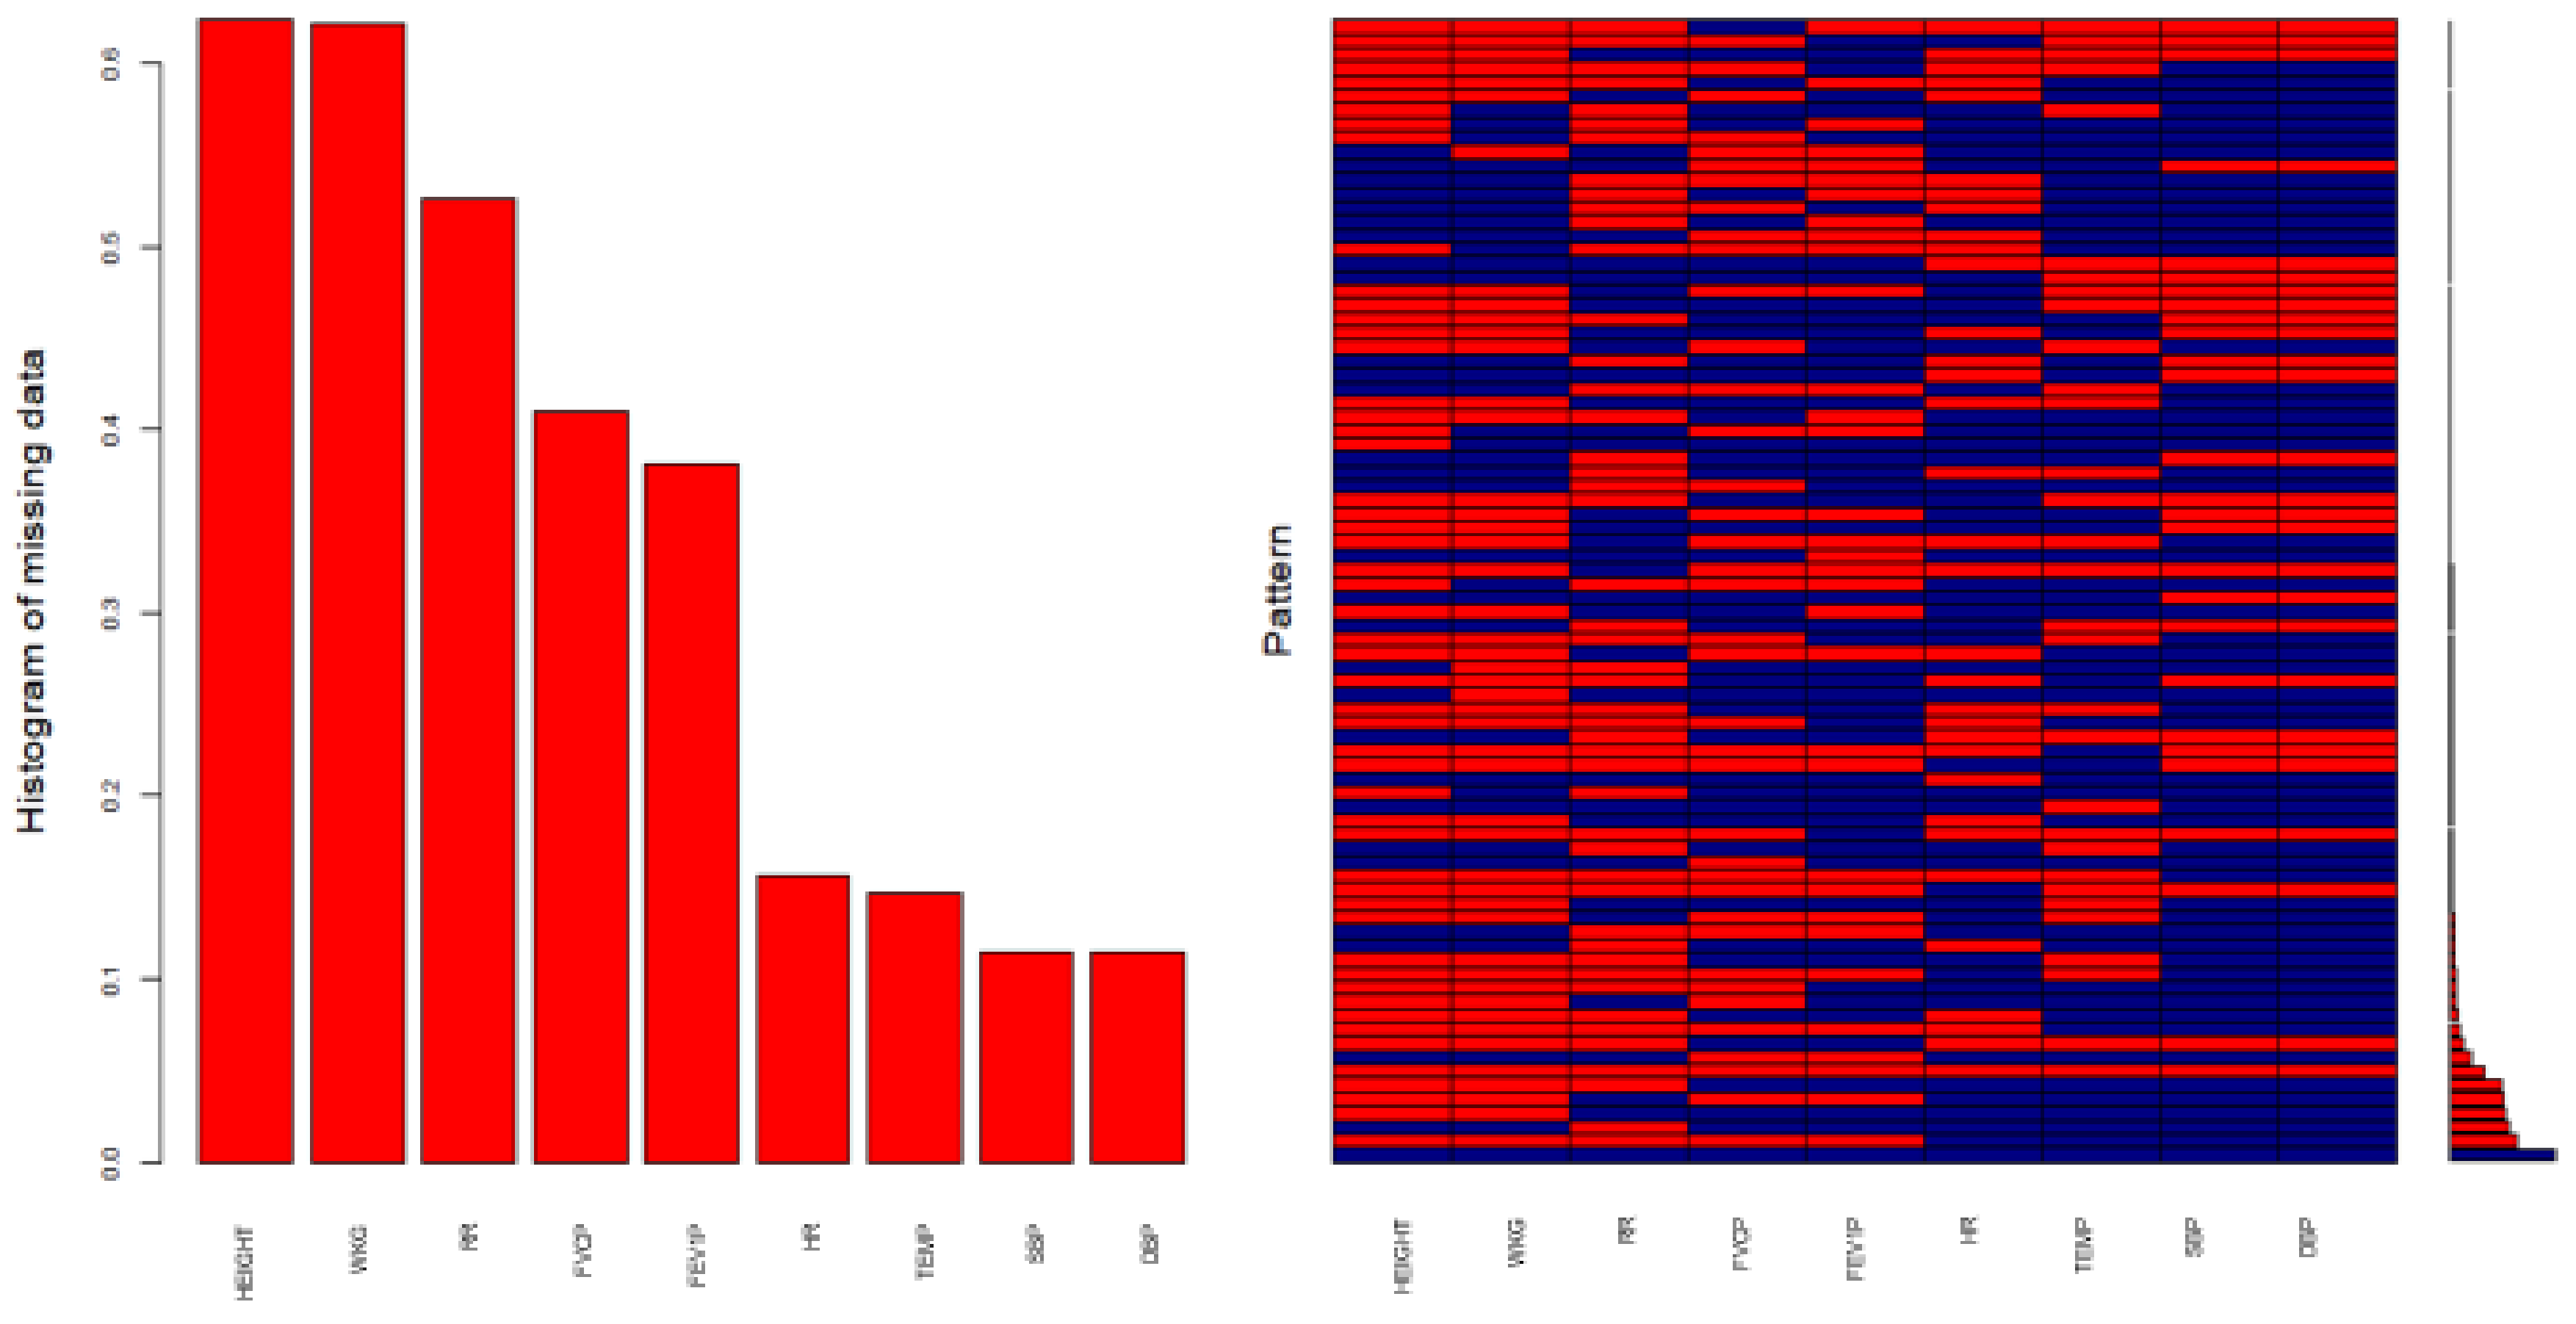
Figure 1 shows the status of the missing values in the database after an imputation process is performed on certain variables of this dataset, using the MICE package [
28] to complete the information and optimize the final results.
Variables sorted by number of missings:
| Variable | Count |
| HEIGHT | 0.6237930 |
| WKG | 0.6210892 |
| RR | 0.5264581 |
| FVCP | 0.4103901 |
| FEV1P | 0.3810351 |
| HR | 0.1568173 |
| TEMP | 0.1465817 |
| SBP | 0.1145230 |
| DBP | 0.1145230 |
The outputs confirm that the same original results are obtained with both procedures and that existing information is not affected. The satisfactory solution of the problem is followed by new exploratory analyses. The imputation ultimately obtained a more complete, accurate and real dataset for the application of multivariate techniques. Proof of this is the graphical display in
Figure 2, where, in each variable, the percentage is zero in the pattern of missing data. This is reflected in the coincidence in the scatterplot, where information is free of missing values and identical to the original. This signifies that it is possible to extrapolate these results to the general population.
Based on the results of the imputation procedures (
Figure 1), the success of the pre-post application results is assured with 100% of the completed data (
Figure 2) related to the epidemiological–clinical variables (
Table 1). Slightly altered average results pertain to height, 1.64 m; weight in kilograms (WKG), 74.85 kg; and body mass index (BMI), 27.88 kg/m
2.
Systolic blood pressure (SBP), 136.4 mmHg, is above the normal range of 90–120 mmHg, which indicated a possible risk of CVD. However, diastolic blood pressure (DBP), 75.04 mmHg, is within the normal range (60–80 mmHg), as is temperature (TEMP), 36.78 °C. Respiratory rate (RR), 24.26 resp./min, is outside the normal range with 12–18 breaths per minute, though heart rate (HR), 94.44 beats/min, is within the normal range (60–100 beats per minute).
In regard to spirometry, FEV1 spirometry in % of theoretical (FEV1P), 45.02%, showed severe alteration since the forced expiratory volume in the first second in normal conditions is around 80%; FVC spirometry in % of theoretical (FVCP), 64.88%, reflected severe symptoms since the forced vital capacity % is considered normal when it is greater than 70% though the percentage varies with age. The previous FEV1/FVC ratio or high spirometry (FEVFVC), 72.67%, indicates the presence of an undefined alteration in terms of obstruction when the reference range is between 70–85%.
Similarly, the percentage detected in each of the pathologies associated with the development of the main disease are the following: congestive heart failure (CHF), 22%; cardiovascular comorbidity (CCVSDM), 43%; diabetes mellitus (DM), 26%; vascular disease (VD), 31%; cerebrovascular disease (CVD), 11%; peripheral vascular disease (PVD), 15%; myocardial infarction (MI), 13%; nephropathy (NEPH), 9%; solid tumor (ST), 13%; and malleolar edema (ME), 26%. In addition, the single presence of COPD is 32%, since the vast majority of patients (68%) are also suffering from other pathologies, which, depending on the progression and severity of the main disease, often coexisted with COPD.
The following sections describe the three procedures applied as well as the results obtained with each. This evaluation highlighted which is the best technique and its advantages for this type of analysis [
29].
3.1. Principal Components Analysis
The choice of the principal components analysis (PCA) [
30] is motivated by the fact that the inertia of the first dimensions is an indicator of the possible existence of strong relationships between variables, as well as of the number of dimensions to be studied.
In addition, the PCA method is designed to work with numerical variables, so we convert the binary or dichotomous categorical variables to numeric. There is the analogous procedure for categorical variables, which is multiple correspondence analysis (MCA), which we will use in the extension of these analyzes to obtain better results.
Moreover, the first two dimensions express 19.24% (
Table 2) of the total inertia of the dataset. This means that the cloud total variability of the individuals (or variables) is explained by the 1:2 plane.
Obviously, this is a very low percentage, and the first plane represents only a small portion of the data variability. Nevertheless, this value is larger than the reference value (7.19%), which is equivalent to the 0.95 quartile of the distribution of inertia percentages obtained by simulating 501 data tables of equivalent size, based on a normal distribution. For this reason, the variability explained by this plane is significant. For even better results, dimensions greater than or equal to the third can also be interpreted for the sake of completeness.
Consequently, the results of the analysis show that the estimation of the number of axes worth interpreting meant restricting the description to the first 12, which are the most informative. In fact, they present an amount of inertia (62.94%) that is greater than those obtained by the 0.95 quartile of random distributions (40.78%). Since these axes are the only ones carrying real information, the relevant description is thus located in them, primarily in the first two, which are the ones that most contributed to the total inertia (
Figure 3).
3.2. Parallel Analysis
Similarly, a second verification of existing data is performed by applying parallel analysis (
Figure 4) with simulated and resampled data [
31] (PA-RES). The function (fa.parallel) is used to optimally confirm the number of final components.
This analysis is an alternative technique that compares the data display with that of a random data matrix (or random correlation matrix) that is of the same size as the original. The function plots the eigenvalues for a principal component and factor solution and does the same for random matrices of the same size as the original data matrix. Furthermore, for raw data, the random matrices have two functionalities: (i) a matrix of univariate normal data and (ii) random samples (randomized across rows) of the original data [
32].
In short, in view of the results obtained, this analysis also suggests that 12 components should be studied, which confirms the same number of components as the PCA analysis.
3.3. Analysis with Random Forest and Information Value
To further optimize the number of components, a third verification (
Table 3) is performed with random forest, [
33] by Gini index and information value by weight of evidence (WOE) [
34,
35] to ascertain whether it is possible to effectively reduce dimensional space by calculating the importance of variables, based on the data-variables explored.
Based on the outputs, the conclusion coincided with that of the PCA analysis. Variables could be reduced to 11 or 12, as reflected in RF (Gini Index). This method for the selection of the importance of final variables is the most widely used and least restrictive because it is a random process. Each time it is executed, it can show different output variables. In contrast, another more demanding reduction (only five variables) is that carried out with IV (WOE). This method significantly restricts final selection because it involves a measure that determines the predictive power of a certain characteristic. Nevertheless, it should not be applied in cases such as ours, in which the results would suffer from the loss of relevant information contained in the main variables of the dataset and where there is prior knowledge that these data are vital to clinical patient profiles.
In this sense, the best solution is provided by the PCA analysis with 12 principal components.
Figure 5 shows a detailed visualization of the results described by the 1:2 plane on the two most relevant axes. As previously mentioned, these are the axes that can provide the most significant data in the specification of patient profile groups and which can be extended to other more specific classification methods for pattern grouping.
Given these results, Dimension 1 shows individuals characterized by a strongly positive coordinate on the axis (to the right of the graph) versus a negative one (to the left of the graph):
Group 1 shows high values for the following variables ordered from strongest to weakest: CCVSDM, EXACER_90DAYS, ReADM_EXACER, ADM, VD, CHF, PVD, MI, DEATH_90DAYS, and CVD; and low values for these other variables: SEX, FVCP, DBP, TEMP, HR, and SMOKING_HABIT.
Group 2 has high values for the following variables: VD, CCVSDM, PVD, MI, CHF, CVD, AGE, DM, NEPH and FEVFVC; in contrast, low values for these others: EXACER_90DAYS, ReADM_EXACER, ADM, SPIROMETRY_PA, EXITUS, SMOKING_HABIT, HR, DBP, DEATH_90DAYS, and SBP.
Group 3 shows high values for the following variables listed by strength: DBP, SMOKING_HABIT, FVCP, SEX, SPIROMETRY_PA, HR, EXITUS, SBP, and TEMP. It shows low values for these others listed by weakness: EXACER_90DAYS, ReADM_EXACER, ADM, CCVSDM, VD, CHF, PVD, AGE, ME, and DM.
Group 4 shows high values for the following variables: EXACER_90DAYS, ReADM_EXACER, ADM, HR, VS, SPIROMETRY_PA, DEATH_90DAYS, EXITUS, ST, and DUR_ADM; and low values in these others: CCVSDM, VD, CHF, PVD, MI, CVD, FEV1P, NEPH, FEVFVC, and DM.
On the other hand, Dimension 2 contrasts individuals with a strongly positive coordinate on the axis (top of the graph) against a negative one (bottom of the graph). The results show that there is a high correlation between two variables (EXACER_90DAYS and ReADM_EXACER), which could summarize this axis (correlation 0, 0).
Of all the methods considered, the PCA [
36] is found to be the most suitable for our study. It is used to generate four profile groups with the same affinity and characteristics. These results highlighted the need to further analyze the context of the information so that an optimal route could be selected. In many cases, there are relevant data that should not be discarded because they are necessary to complete a certain parameter, given its direct relation to the main research objective.
4. Discussion
The results of this research indicate that the best dimensionality reduction is obtained with 12 main components of the 32 in the initial set. The first dimension is found to be the most relevant. Various patient-profile groups are generated with similar characteristics, each of which has closely associated variables.
This association hypothesis ensures the correct application of the PCA method, since one of the requirements is that the correlation matrix between variables must be quite high, otherwise its application would not make sense. In this sense, before proceeding to the imputation, given that the correlation structure can be quite sensitive to the different imputation techniques, it must be studied according to the type of variables in the dataset so as not to lose the relational quality of the original, which is necessary for the application of the PCA.
For this case, we know that the MICE method uses the chained equations in this process of random imputation of each variable, and these are conditioned to the imputed variables, applying a mechanism of dependent chains in the probability distribution. Therefore, we assume that this dependency is preserved in the correlation structure of the imputation algorithm used, when missing values are modified, maintaining the relational quality of the original dataset.
This study also confirms that the reduction of the plane significantly helps to broadly detect (with no need of further classification) the visualization of the first signs of different clinical patterns with similar characteristics. It also indicates that the development of other pathologies (i.e., chronic diseases) over a period of time negatively influenced clinical parameters. This is reflected in the irregular increase of vital signs and frequent hospital admissions caused by such episodes. Other factors included the severity of the disease itself, the advanced age of the patients, unhealthy lifestyle habits, as well as the harm caused by exacerbations of the disease. The general clinical picture of COPD patients is poor because the disease leads to a progressive deterioration of health. Precisely for this reason, previous knowledge of this information can help to improve the quality of healthcare for these patients.
Likewise, this type of computational analysis requires learning sophisticated techniques in order to reduce the complexity of multicenter studies, which are characterized by a multitude of parameter variables of potential use in the analytical process. The number of variables can make the analysis extraordinarily complex. Still another issue is the problem of missing data, which often occurs in high percentages, and which thus requires considerable analytical–exploratory attention and specialized techniques to improve the information stored in large multicenter clinical databases or cloud-based repositories of medical records.
In addition, there are various ways to improve healthcare data extracted from medical records, the poor quality of which often limits their use. As previously mentioned, missing data [
37] is an important problem since, for various reasons, private and local medical facilities often choose not to or fail to report critical statistics to centralized healthcare systems and agencies. This makes it extremely difficult to take preventive measures that would greatly improve the daily collection of data [
38].
For future analyses, we want to mention other competitor procedures that can help to obtain better results in the mentioned methods. There are other nonlinear methods developed to reduce the dimensionality of the data to a smaller space, which could be studied for this study, such as these algorithms: t-SNE (t-distributed Stochastic Neighbor Embedding); Sammon mapping; Isomap; LLE (Locally Linear Embedding); CCA (Canonical Correlation Analysis); MVU (Maximum Variance Unfolding); LE (Laplacian Eigenmaps).
5. Conclusions
This research explored how computational methods can be used to reduce dimensionality, [
39,
40] in multicenter databases. In such repositories, dimensionality reduction is a vital necessity because of the huge number of clinical variables, which makes it necessary to select the ones that are most relevant to the research objective in order to better focus on the results. At the same time, this study highlights the existence of various methods of solving the problem of missing data in the medical databases and shows how they can be implemented to obtain higher-quality information from healthcare data sources.
Author Contributions
Methodology, N.B.-A., M.Á.M.-A. and A.M.-G.; Software, M.Á.M.-A. and A.M.-G.; Formal analysis, M.Á.M.-A. and A.M.-G.; Investigation, N.B.-A., M.Á.M.-A. and A.M.-G.; Data curation, N.B.-A.; Writing—original draft, N.B.-A. and M.Á.M.-A.; Writing—review & editing, A.M.-G. Supervision, A.M.-G. All authors have read and agreed to the published version of the manuscript.
Funding
This research received no external funding.
Institutional Review Board Statement
Not applicable in this research. However, the study was conducted in accordance with the Helsinki Declaration and the Good Clinical Practice guidelines. In addition, the project was approved by the corresponding Ethics Committee formed by the participating hospital management in 2009.
Informed Consent Statement
Not applicable in this research. However, the informed consent was obtained from all subjects involved in the study during the data collection period of the project.
Data Availability Statement
Research data are not shared. The data are not publicly available due to these clinical data may compromise confidentiality and might reveal the identity or location of participants. Additionally, public availability of data would be in violation of the Spanish Organic Law 15/1999 of protection of personal data (consolidated text 5 March 2011) and the European Law (EU) 2016/679 from European Parliament and European Council of 27 of April 2016 about Data Protection (RGPD), without the corresponding anonymization procedure. Therefore, the data presented in this study are only available on request from the corresponding author, and if the publication is accepted, after a masking process of all sensible data from this final clinical dataset, the data could be made available to the journal for publication or could be published in an official repository.
Acknowledgments
The authors thank all the people who participated directly or indirectly in the contribution of this analytical-exploratory work.
Conflicts of Interest
The authors declare no conflict of interest.
Glossary
| Definition of variables |
| AGE | Age (years) |
| SEX (Male/Female) | Sex (Male/Female) |
| SMOKING_HABIT | Smoking habit |
| DUR_ADM | Duration of admission to the hospital (days) |
| HEIGHT | Height (meters) |
| WKG | Weight in Kilograms |
| BMI | Body Mass Index |
| SBP | Systolic Blood Pressure (mmHg) |
| DBP | Diastolic Blood Pressure (mmHg) |
| TEMP | Temperature (°C) |
| RR | Respiratory Rate (resp./min) |
| HR | Heart Rate (beats/min) |
| FEV1 | Forced Expiratory Volume in the first second |
| FEV1P | FEV1 spirometry in % of theoretical |
| FVC | Forced Vital Capacity |
| FVCP | FVC spirometry in % of theoretical |
| FEVFVC | FEV1/FVC ratio with spirometry performed on admission or discharge |
| SPIROMETRY_PA | Spirometry performed on admission or discharge |
| ADM | Admissions for any reason after 90 days |
| VS | Ventilatory support at any time of admission |
| EXACER_90DAYS | Exacerbation of COPD after 90 days |
| ReADM_EXACER | Readmission for exacerbation of COPD |
| DEATH_90DAYS | Death after 90 days |
| EXITUS | Exitus throughout the admission period |
| CHF | Congestive Heart Failure |
| CCVSDM | Cardiovascular Comorbidity |
| DM | Diabetes Mellitus |
| VD | Vascular Disease |
| CVD | Cerebrovascular Disease |
| PVD | Peripheral Vascular Disease |
| MI | Myocardial Infarction |
| NEPH | Nephropathy |
| ST | Solid Tumor |
| ME | Malleolar Edema |
| Acronyms |
| AI | Artificial Intelligence |
| COPD | Chronic Obstructive Pulmonary Disease |
| eCOPD | Exacerbation of Chronic Obstructive Pulmonary Disease |
| EMB | Expectation-Maximization with Bootstrapping |
| FDA | Functional Data Analysis |
| IV | Information Value |
| MAR | Missing at Random |
| MICE | Multiple Imputation by Chained Equations |
| mi | Multiple Imputation with Diagnostics |
| MVN | Multivariate Normal distribution |
| PA-RES | Parallel analysis with simulated data and data resampling |
| PCA | Principal Component Analysis |
| PMM | Predictive Mean Matching |
| RF | Random Forest |
| RF&IV | Random Forest by the Gini Index & Information Value by Weight of Evidence |
| WOE | Weight of Evidence |
References
- Lopez-Campos, J.L.; Almagro, P.; Gómez, J.T.; Chiner, E.; Palacios, L.; Hernández, C.; Navarro, M.D.; Molina, J.; Rigau, D.; Soler-Cataluña, J.J.; et al. Actualización de la Guía Española de la EPOC (GesEPOC): Comorbilidades, automanejo y cuidados paliativos. Arch. Bronconeumol. 2021. [Google Scholar] [CrossRef]
- Blázquez-Sánchez, N.; Rivas-Ruiz, F.; Bueno-Fernández, S.; Arias-Santiago, S.; Fernández-Morano, M.T.; deTroya-Martín, M. Validation of a Questionnaire Designed to Study Knowledge, Attitudes, and Habits Related to Sun Exposure Among Young Adults: The CHACES Questionnaire. Actas Dermo-Sifiliográficas 2020, 111, 579–589. [Google Scholar] [CrossRef] [PubMed]
- Santana, E. Machine Learning con R. Ejemplos de Machine Learning. Ejemplos de Machine Learning y Data Mining con R—Imputar con Regresion Lineal. 2015. Available online: https://apuntes-r.blogspot.com/2015/05/imputar-con-regresion-lineal.html (accessed on 1 July 2015).
- Van Buuren, S.; Groothuis-Oudshoorn, K. Mice: Multivariate Imputation by Chained Equations in R. J. Stat. Softw. 2011, 45, 1–67. [Google Scholar] [CrossRef] [Green Version]
- Blazek, K.; van Zwieten, A.; Saglimbene, V.; Teixeira-Pinto, A. A practical guide to multiple imputation of missing data in nephrology. Kidney Int. 2021, 99, 68–74. [Google Scholar] [CrossRef] [PubMed]
- Cheney, W. Analysis for Applied Mathematics; Springer Science+Business Media: New York, NY, USA, 2001. [Google Scholar]
- Ferraty, F.; Vieu, P. Nonparametric Functional Data Analysis: Theory and Practice; Springer: Berlin/Heidelberg, Germany, 2006. [Google Scholar]
- Gil Martínez, C. Análisis de Componentes Principales (PCA). 2018. Available online: https://rpubs.com/Cristina_Gil/PCA (accessed on 1 February 2021).
- Wang, X.; Zhai, M.; Ren, Z.; Ren, H.; Li, M.; Quan, D.; Chen, L.; Qiu, L. Exploratory study on classification of diabetes mellitus through a combined Random Forest Classifier. BMC Med. Inform. Decis. Mak. 2021, 21, 105. [Google Scholar] [CrossRef] [PubMed]
- Bhalla, D. Weight Of Evidence (WOE) and Information Value (IV) Explained. 2015. Available online: https://www.listendata.com/2015/03/weight-of-evidence-woe-and-information.html (accessed on 1 September 2021).
- Larsen, K. Data Exploration with Weight of Evidence and Information Value in R. 2015. Available online: https://multithreaded.stitchfix.com/blog/2015/08/13/weight-of-evidence/ (accessed on 1 September 2021).
- Choubey, D.K.; Kumar, M.; Shukla, V.; Tripathi, S.; Dhandhania, V.K. Comparative Analysis of Classification Methods with PCA and LDA for Diabetes. Curr. Diabetes Rev. 2020, 16, 833–850. [Google Scholar] [CrossRef] [PubMed]
- Karthe. Tutorial on 5 Powerful R Packages used for Imputing Missing Value. 2016. Available online: https://www.analyticsvidhya.com/blog/2016/03/tutorial-powerful-packages-imputing-missing-values/ (accessed on 1 July 2021).
- Miri, H.H.; Hassanzadeh, J.; Khaniki, S.H.; Akrami, R.; Sirjani, E.B. Accuracy of Five Multiple Imputation Methods in Estimating Prevalence of Type 2 Diabetes based on STEPS Surveys. (MICE-PMM). J. Epidemiol. Glob. Health 2020, 10, 36–41. [Google Scholar] [CrossRef]
- Ispirova, G.; Eftimov, T.; Seljak, B.K. Evaluating missing value imputation methods for food composition databases. Food Chem. Toxicol. Int. J. Publ. Br. Ind. Biol. Res. Assoc. 2020, 141, 111368. [Google Scholar] [CrossRef]
- Zhang, Z. Multiple Imputation for time series data with Amelia package. Ann. Transl. Med. 2016, 4, 56. [Google Scholar]
- Alsaber, A.R.; Pan, J.; Al-Hurban, A. Handling Complex Missing Data Using Random Forest Approach for an Air Quality Monitoring Dataset: A Case Study of Kuwait Environmental Data (2012 to 2018). Int. J. Environ. Res. Public Health 2021, 18, 1333. [Google Scholar] [CrossRef]
- Hong, S.; Lynn, H.S. Accuracy of random-forest-based imputation of missing data in the presence of non-normality, non-linearity, and interaction. BMC Med. Res. Methodol. 2020, 20, 199. [Google Scholar] [CrossRef]
- Delisle Nyström, C.; Barnes, J.D.; Tremblay, M.S. An exploratory analysis of missing data from the Royal Bank of Canada (RBC) Learn to Play—Canadian Assessment of Physical Literacy (CAPL) project. BMC Public Health 2018, 18 (Suppl. S2), 1046. [Google Scholar] [CrossRef]
- Luo, Q.; Egger, S.; Yu, X.Q.; Smith, D.P.; O’Connell, D.L. Validity of using multiple imputation for “unknown” stage at diagnosis in population-based cancer registry data. PLoS ONE 2017, 12, e0180033. [Google Scholar]
- Mera-Gaona, M.; Neumann, U.; Vargas-Canas, R.; López, D.M. Evaluating the impact of multivariate imputation by MICE in feature selection. PLoS ONE 2021, 16, e0254720. [Google Scholar] [CrossRef]
- Hanko, M.; Grendár, M.; Snopko, P.; Opšenák, R.; Šutovský, J.; Benčo, M.; Soršák, J.; Zeleňák, K.; Kolarovszki, B. Random Forest-Based Prediction of Outcome and Mortality in Patients with Traumatic Brain Injury Undergoing Primary Decompressive Craniectomy. World Neurosurg. 2021, 148, e450–e458. [Google Scholar] [CrossRef]
- Yang, L.; Wu, H.; Jin, X.; Zheng, P.; Hu, S.; Xu, X.; Yu, W.; Yan, J. Study of cardiovascular disease prediction model based on random forest in eastern China. Sci. Rep. 2020, 10, 5245. [Google Scholar] [CrossRef] [Green Version]
- R Core Team. R: A Language and Environment for Statistical Computing; R Foundation for Statistical Computing: Vienna, Austria, 2021; Available online: https://www.R-project.org/ (accessed on 1 June 2021).
- Pozo-Rodríguez, F.; Álvarez, C.J.; Castro-Acosta, A.; Moreno, C.M.; Capelastegui, A.; Esteban, C.; Carcereny, C.H.; López-Campos, J.L.; Alonso, J.L.I.; Quílez, A.L. Clinical audit of patients admitted to hospital in Spain due to exacerbation of COPD (AUDIPOC study): Method and organisation. Arch. Bronconeumol. 2010, 46, 349–357. [Google Scholar] [CrossRef]
- Faquih, T.; van Smeden, M.; Luo, J.; Le Cessie, S.; Kastenmüller, G.; Krumsiek, J.; Noordam, R.; van Heemst, D.; Rosendaal, F.R.; van Hylckama Vlieg, A.; et al. A Workflow for Missing Values Imputation of Untargeted Metabolomics Data. Metabolites 2020, 10, 486. [Google Scholar] [CrossRef]
- Slade, E.; Naylor, M.G. A fair comparison of tree-based and parametric methods in multiple imputation by chained equations (MICE). Stat. Med. 2020, 39, 1156–1166. [Google Scholar] [CrossRef]
- Luo, Y.; Szolovits, P.; Dighe, A.S.; Baron, J.M. 3D-MICE: Integration of cross-sectional and longitudinal imputation for multi-analyte longitudinal clinical data. J. Am. Med. Inform. Assoc. 2018, 25, 645–653. [Google Scholar] [CrossRef]
- El Boujnouni, H.; Rahouti, M.; El Boujnouni, M. Identification of SARS-CoV-2 origin: Using Ngrams, principal component analysis and Random Forest algorithm. Inform. Med. Unlocked 2021, 24, 100577. [Google Scholar] [CrossRef] [PubMed]
- Pinheiro, L.I.C.C.; Pereira, M.L.D.; Fernandez, M.P.; de Abreu, W.J.C.P.; Pinheiro, P.G.C.D. Application of Data Mining Algorithms for Dementia in People with HIV/AIDS. Comput. Math. Methods Med. 2021, 2021, 4602465. [Google Scholar] [CrossRef] [PubMed]
- Ayers, B.; Sandholm, T.; Gosev, I.; Prasad, S.; Kilic, A. Using machine learning to improve survival prediction after heart transplantation. J. Card. Surg. 2021, 36, 4113–4120. [Google Scholar] [CrossRef]
- Revelle, W. Fa.parallel: Scree Plots of Data or Correlation Matrix Compared to Random “Parallel” Matrices. 2008. Available online: https://www.rdocumentation.org/packages/psych/versions/1.0-58/topics/fa.parallel (accessed on 1 October 2021).
- Bouzid, Z.; Faramand, Z.; Gregg, R.E.; Frisch, S.O.; Martin-Gill, C.; Saba, S.; Callaway, C.; Sejdić, E.; Al-Zaiti, S. In Search of an Optimal Subset of ECG Features to Augment the Diagnosis of Acute Coronary Syndrome at the Emergency Department. J. Am. Heart Assoc. 2021, 10, e017871. [Google Scholar] [CrossRef] [PubMed]
- Parsai, T.; Kumar, A. Weight-of-evidence (WOE) process for assessing human health risk of mixture of metal oxide nanoparticles and corresponding ions in aquatic matrices. Chemosphere 2021, 263, 128289. [Google Scholar] [CrossRef]
- Wurst, K.E.; Sumner, K.M.; Stanislaus, D.; Powell, M.; Cunnington, M. A model for human and animal data integration: Weight of evidence (WOE) strategy. Birth Defects Res. 2020, 112, 1505–1512. [Google Scholar] [CrossRef] [PubMed]
- Tăuţan, A.M.; Rossi, A.C.; de Francisco, R.; Ionescu, B. Dimensionality reduction for EEG-based sleep stage detection: Comparison of autoencoders, principal component analysis and factor analysis. Biomed. Tech./Biomed. Eng. 2020, 66, 125–136. [Google Scholar] [CrossRef] [PubMed]
- Chia, K.; Fischer, I.; Thomason, P.; Graham, H.K.; Sangeux, M. A Decision Support System to Facilitate Identification of Musculoskeletal Impairments and Propose Recommendations Using Gait Analysis in Children With Cerebral Palsy. Front. Bioeng. Biotechnol. 2020, 8, 529415. [Google Scholar] [CrossRef]
- Feng, S.; Hategeka, C.; Grépin, K.A. Addressing missing values in routine health information system data: An evaluation of imputation methods using data from the Democratic Republic of the Congo during the COVID-19 pandemic. Popul. Health Metr. 2021, 19, 44. [Google Scholar] [CrossRef]
- Pasha, A.; Latha, P.H. Bio-inspired dimensionality reduction for Parkinson’s disease (PD) classification. Health Inf. Sci. Syst. 2020, 8, 13. [Google Scholar] [CrossRef]
- Salvador, R.; Verdolini, N.; Garcia-Ruiz, B.; Jiménez, E.; Sarró, S.; Vilella, E.; Vieta, E.; Canales-Rodríguez, E.J.; Pomarol-Clotet, E.; Voineskos, A.N. Multivariate Brain Functional Connectivity Through Regularized Estimators. Front. Neurosci. 2020, 14, 569540. [Google Scholar] [CrossRef]
| Publisher’s Note: MDPI stays neutral with regard to jurisdictional claims in published maps and institutional affiliations. |
© 2022 by the authors. Licensee MDPI, Basel, Switzerland. This article is an open access article distributed under the terms and conditions of the Creative Commons Attribution (CC BY) license (https://creativecommons.org/licenses/by/4.0/).


