Article

A Comparative Study of Strain Rate Constitutive and Machine Learning Models for Flow Behavior of AZ31-0.5 Ca Mg Alloy during Hot Deformation

1
Department of Mechanical Engineering, Incheon National University, Incheon 22012, Korea
2
School of Advanced Materials Science & Engineering, Sungkyunkwan University, Suwon 16419, Korea
3
School of Mechanical Engineering, Dongguan University of Technology, Dongguan 523808, China
4
Research Institute for Engineering and Technology, Incheon National University, Incheon 22012, Korea
5
College of Computing and Informatics, Sungkyunkwan University, Suwon 16419, Korea
*
Authors to whom correspondence should be addressed.
Mathematics 2022, 10(5), 766; https://doi.org/10.3390/math10050766
Submission received: 20 January 2022 / Revised: 15 February 2022 / Accepted: 25 February 2022 / Published: 27 February 2022

Abstract

:
In this study, isothermal compression tests of highly ductile AZ31-0.5Ca Mg alloys were conducted at different strain rates (0.001–0.1 s−1) and temperatures (423–523 K) along with extruded direction. The flow stress characteristics were evaluated at elevated temperatures. In addition, a strain-dependent constitutive model based on the Arrhenius equation and machine learning (ML) were constructed to evaluate the stress–strain flow behavior. To build the ML model, experimental data containing temperature, strain, and strain rate were used to train various ML algorithms. The results show that under lower temperatures and higher strain rates, the curves exhibited strain hardening, which is due to the higher activation energy, while when increasing the temperature at a fixed strain rate, the strain hardening decreased and curves were divided into two regimes. In the first regime, a slight increase in strain hardening occurred, while in the second regime, dynamic recrystallization and dynamic recovery controlled the deformation mechanism. Our ML results demonstrate that the ML model outperformed the strain-dependent constitutive model.

1. Introduction

Magnesium (Mg) and its alloys are lightweight materials that have the potential to decrease CO2 emissions by improving the fuel efficiency of automobiles [1,2,3]. It is salient to note that the room temperature formability of Mg alloys is restricted due to the limited slip activity and preferential operation of twinning activity instead, which leads to premature failure [4]. Under higher temperatures, the <a> basal and <c + a> non-basal slip activities control the deformation. Subsequently, hot deformation is one of the practical approaches to process products made of Mg alloys. A deep understanding of the effect of the strain rate and temperature on the flow behavior is essential for a more accurate design of complex shaped components and products.
Among different series of Mg alloys, AZ31 Mg alloys have been extensively characterized during high temperature loading. For example, Chen et al. [5] studied the twinning-induced dynamic recrystallization (DRX) behavior of a pre-compressed AZ31 Mg alloy and proposed that the contraction twinning is favorable for dynamic recrystallization. Wong et al. [6] achieved greater microstructure homogeneity at high temperatures and low strain rates, and also proposed that the fraction of DRXed grains increased with an increase in strain. Ding et al. [7] also studied the hot deformation behavior of AZ31 Mg alloys, and based on processing maps and microstructure evolution, they proposed that the optimum parameters for hot workability are 300–400 °C and 0.005–0.05 s−1. Shang et al. [8] also studied hot deformation behavior of AZ31 Mg alloys and reported that processing can be possible at temperatures from 300 to 350 °C at a strain rate of 0.01 to 1 s−1. In another study, Sheikhani et al. [9] proposed that the hot formability of AZ31-RE Mg alloys is superior to that of AZ31 Mg alloys. Malik et al. [10] also proposed that the hot formability is far better in extruded ZK61 Mg alloys compared to die-casted Mg alloys. Based on the brief aforementioned information, it is clear that thermo-mechanically processed Mg alloys are better processed at elevated temperatures compared to die-casted Mg alloys. Recently, it was reported that the addition of Ca in AZ31 Mg alloys leads to high ductility [3]. Given their potential in aerospace and industrial applications, the lightweight AZ31-Ca Mg alloy was selected for high temperature compressive loading.
To this end, different models have been proposed for the evaluation of flow stress behavior under high temperature loading, and are well described in a precise review article [11]. The extensively employed model is a strain-dependent constitutive model based on the Arrhenius equation and its modified forms [12]. Some authors have used a neural network model to evaluate the flow stress behavior and proposed that this model is more accurate compared to the strain-dependent constitutive model [13]. A strain-dependent constitutive model and a back-propagation neural network (BPNN) model of flow stress were implemented on the Mg-5.9Zn-1.6Zr-1.6Nd-0.9Y alloy. The thermo-mechanical tests were conducted in the temperature range of 523–723 K at strain rates between 10−3 s−1 and 1 s−1. The accuracy of the two models was evaluated based on the mean squared error and the correlation coefficient, respectively. The results revealed that the BPNN showed a more accurate predictability of the flow behavior compared to the strain-dependent constitutive model.
In recent years, machine learning (ML) algorithms have been extensively utilized and are on the cusp of revolutionizing the material science industry based on their ability to predict specific properties of materials. They can not only avoid long fabrication and testing cycles but can also remarkably expedite the discovery of special materials that can be used in different industries. An ML model is trained on a dataset containing some basic information about the materials and a specific targeted property. This trained model can be exploited to predict the final property of some unique input dataset. The ML technique has already been utilized to predict the texture of polycrystalline material [14], the composition for designing ultra-high-strength steel [15], and the transformation temperature of shape memory alloys [16]. In addition, Umer et al. utilized the ML approach to predict the age hardening behavior of Al-Cu-Mg alloys [17]. The training dataset used consists of the composition, physical and chemical properties, and age hardening conditions to predict the final hardness of the alloy. The results showed that the gradient-boosted trees (GBT) algorithm successfully predicted the hardness values, which was further verified by the literature. Mohamadreza et al. implemented an ML model to predict the crystallographic orientations of Mg alloys using mechanical properties as an input dataset [18]. It was reported that the ML model accurately predicted the orientation information in terms of pole figure for different processing conditions. Hence, it can be suggested that ML techniques can correlate the dependencies of material features and the final property under consideration, and can also be used to avoid the time-consuming fabrication and testing cycles.
Machine learning techniques were used to determine the stress–strain flow behavior in 42CrMo steel during hot compression tests [19]. For this purpose, a training dataset containing compression temperature, strain rate, and strain was obtained from experiments and used to build the predictive model. An accurate model with an average absolute relative error of 4.5% was reached in this study. A similar procedure was reported by Yu et al. [20] to predict the mechanical properties of Ti-6Al-4V alloys. Considering the importance of Mg-based materials in several applications, and the need to understand the stress–strain flow behavior of these materials, one can suggest the employment of machine learning techniques to build predictive models that can determine the behavior of these materials. Here, in this study, high-temperature compression testing under different strain rates along with rolling direction (RD) were conducted on AZ31-0.5Ca Mg alloys, and the flow behavior of stress–strain curves was obtained. A comparison of the strain-dependent constitutive model based on the Arrhenius equation and the machine learning model is discussed regarding the flow behavior. It is proposed that the machine learning model can successfully predict the flow behavior of Mg alloys.

2. Experimental Procedure

2.1. Materials and Tests

The AZ31-0.5Ca alloy used in the present study was received from POSCO Co. (Pohang, Korea). Tensile tests were conducted at room temperature on a dog-bone shaped sample with 25 mm length, 6 mm width, and 1 mm thickness. The hot isothermal compression experiments were conducted at 423 K, 473 K, and 523 K at strain rates of 0.001 s−1, 0.01 s−1, and 0.1 s−1 on samples with 12 mm height and 8 mm diameter. Three sets of experiments were performed for a single test condition. The samples were heated prior to the deformation at 2 K s−1 and held for 5 min to maintain uniform temperature before deformation.

2.2. Sample Preparation

Scanning electron microscopy (SEM) and electron back scattered microscopy (EBSD) in a scanning electron microscope with a field emission gun (Hitachi S-4300 FESEM, Tokyo, Japan) were employed for microstructural and textural characterization. Samples cut from the transverse-rolling direction were polished using a cross-sectional polisher (Hitachi IM4000) and the EBSD scanning was performed with the step size of 0.5 µm. The received EBSD data were analyzed by TSL OIM 6.1.3. software (EDAX, Mahwah, NJ, USA). Furthermore, the distribution of important elements was identified by the electron probe microanalyzer (EPMA) technique.

3. Results and Discussion

3.1. Initial Microstructure and Tensile Properties

Figure 1a displays the inverse pole figure (IPF) map, (0001) pole figure (PF), and IPF triangular legend map of the AZ31-0.5 Ca Mg alloy. It can be seen that the alloy has a fine-grained microstructure distributed uniformly with an average grain size of 7 µm. The (0001) PF revealed the existence of weak basal texture having an intensity of 5.25 mrd, where some of the grains have c-axes tilted away from ND towards TD and RD and are well matched with the color inhomogeneity of the IPF map. To reveal the existence of any intermetallic particles distributed in the alloy, SEM at low and high magnification was carried out (Figure 1b). The maps confirmed that the secondary particles are distributed in the matrix and also on the grain boundaries. To further investigate the elemental presence in AZ31-0.5Ca, EPMA was employed to identify the distribution of elements in the microstructure and second-phase particles. The results confirmed that the particles are mainly composed of Mg, Al, and Ca, which can be attributed to the segregation of Al with Ca to form second-phase particles (Figure 1b). The stress–strain analysis displayed excellent room temperature ductility of ~38%, as evident from Figure 1c. This ductility is linked to the weak basal texture and grain size; the former can facilitate the ease in basal glide and the latter is responsible for <c + a> non-basal slip activity.

3.2. True Stress–Strain Curves

The true stress–strain curves of AZ31-0.5Ca alloys after isothermal compression tests at temperatures of 150, 200, and 250 °C under strain rates of 0.1, 0.01, and 0.001 s−1 are presented in Figure 2. As is evident from Figure 2, a general trend can be noticed under all temperature and strain rate combinations, where the flow stress increases sharply at the initial stage of deformation and then increases gradually with respect to strain while reaching a maximum value. Finally, the flow stress decreases in a steady manner. The initial sudden increase in the flow stress can be attributed to the work hardening, where high strain levels result in higher work hardening in the alloy during deformation, reaching maximum values of flow stress. The decrease in peak stress is associated with the critical limit for the initiation of dynamic recrystallization, where the softening mechanisms dominate the work hardening and result in a reduction in flow stress. These curves are well matched with the reported literature [10].

3.3. Strain Rate Constitutive Model

Sellars and Mctegart demonstrated the empirical relationship between deformation temperature, strain rate, and strain with the following relationship [21]:
ε ˙ = A   [ sin h ( α σ ) n exp   ( Q RT ) ]
where ε ˙ , σ, Q, R, T and A, and α are strain rate (s−1), flow stress (MPa), activation energy (kJ mol−1), gas constant (8.134 J mol−1 K−1), absolute temperature (K), and material constants, respectively. The equation can be represented as a power law for small values of flow stress range (σα < 0.8) as follows:
ε ˙ = A σ n exp   ( Q RT )
where A and n are a material constant and stress exponent, respectively, and can be evaluated from the slope of the graph between ln ε ˙ and lnσ at a constant temperature. Conversely, at higher flow stress (σα > 0.8), the equation can be represented by an exponential function as follows:
ε ˙ = A   exp ( σ β ) exp ( Q RT )
β is the material constant and can be calculated using the following equation:
α = β n
The activation energy (Q) can be evaluated from Equation (1).
ln ε ˙ = lnA + n   ln [ sin h ( α σ ) ] ( Q RT )
The above equation can be further differentiated with respect to 1/T as follows:
Q = R { ln ε ˙ ln ( sinh ( α σ ) ) } T   { ln ( sinh ( α σ ) ) ( 1 T ) } ε ˙ = R   ×   n   ×   b
The stress exponent (n) represents the mechanism of hot deformation during loading and can be calculated from the slope between ln ( sinh ( α σ ) ) and ln ε ˙ at a constant temperature; b can be estimated by the slope of ln ( sinh ( α σ ) ) and 1/T. The Zener–Hollomon parameter (Z) explains the softening behavior based on the critical strain for dynamic recrystallization (DRX) and can be expressed as:
Z = ε ˙ exp Q RT = A   [ sin h ( α σ ) n ]
Taking the natural logarithm of both sides of Equation (7), it can be modified as:
lnZ =   ln A + ln   n [ sin h ( α σ ) ]
The intercept of the plot between lnZ and ln ( sinh ( α σ ) ) represents lnA. To evaluate the various identities, such as activation energy, it is important to select a particular flow stress that explains the specific deformation behavior, which can be either yield stress, strain-dependent flow stress, or peak stress. In the present work, peak stress is considered to evaluate the important parameters.
Figure 3 presents the various plots to evaluate the material constants using the above procedure. Figure 3a shows the plot between ln ε ˙ and lnσ at various temperatures, where the average slope, which reflects ‘n’, was found to be 15, and β was calculated to be 0.09 using Figure 3b. Furthermore, α was calculated to be 0.006 using Equation (4). The value of ln ε ˙ / ln ( sinh ( α σ ) can be evaluated by the slope between ln ( sinh ( α σ ) ) and ln ε ˙ , and ln ( sinh ( α σ ) ) / ( 1 T ) can be calculated from the slope of ln ( sinh ( α σ ) ) and 1/T curves, as presented in Figure 3c,d, respectively.
The value of activation energy (Q) was calculated to be 168.25 kJ mol−1. It can be noticed that the activation energy is higher than the self-diffusion energy of pure Mg (135 kJ/mol), indicating the existence of back stresses, which can be attributed to the fine-grained microstructure and presence of second-phase particles (Mg,Al)2Ca, as discussed previously. The second-phase particles distributed in the matrix and the high fraction of grain boundaries due to the small grain size act as obstacles to dislocation motion and impart a pinning force on lattice self-diffusion. Finally, the values of lnZ at different temperatures and strain rates can be calculated using Equation (8), and Figure 4 presents the relationship between ln [ sin h ( α σ P ) ] and lnZ, indicating a linear fit for the alloy under study. The linear curve shows that higher Z values were obtained at higher strain rates, suggesting that the deformation was severe at high strain rates. In contrast, low values of Z were calculated at low strain rates and are well matched with the stress–strain curves. Therefore, low strain rates are preferable for smooth hot processing of Mg alloys.
By using the aforementioned equations and after a thorough analysis, we carried out a comparison of predicted and experimental flow stresses through the strain-dependent model, as shown in Figure 5a–c. The solid curves represent experimental values, while the dotted box lines are predictive curves by the constitutive model. It can be seen that there is a slight deviation in the peak stresses at temperatures of 473 K and 573 K at a strain rate of 0.001 s−1, at temperatures of 423 K and 473 K at a strain rate of 0.01 s−1, and at 423 K at a strain rate of 0.1 s−1. All other predictive curves are well matched with the experimental curves.
It can be also seen that there are some sigmoidal shaped curves, and deviations also still exist in the predictive curves, which are different than experimental curves. This suggests that the model is not adequately reliable for the prediction of stress analysis. Therefore, we must turn to the machine learning model as a strong substituting alternative and compare it with the constitutive model constructed thus far.

3.4. Machine Learning Model

The selection of important parameters is imperative to design an accurate ML model as it develops a relationship between the input dataset and the target property. The prediction of the ML model substantially depends on the accuracy and consistency of the dataset in question. In this study, the ML dataset includes the temperature, strain rate, and total strain as input parameters and the flow stress as the target property. This dataset was extracted from the compression experiment performed at different temperatures and strain rates, as shown in Figure 2. Since these experiments were mainly performed on the same material (AZ31-0.5Ca), features related to the material composition were included in the learning process. The collected dataset was divided into two, namely, a training dataset and a testing dataset. The training dataset includes the flow stress at temperatures of 423 K, 473 K, and 523 K; the strain rates of 0.001, 0.01, and 0.1 s−1; and the strains of 0.05, 0.15, 0.25, 0.35, 0.45, 0.55, and 0.65. It also includes the flow stress at temperatures of 423 K, 473 K, and 523 K; the strain rates of 0.001, 0.01, and 0.1 s−1; and the strains of 0.1, 0.2, 0.3, 0.4, 0.5, and 0.6, which were used for testing purposes. The training dataset was used to train various ML algorithms to develop the interdependent relationship between the input features and the target property, and the testing dataset was finally used to verify the results of each ML algorithm after training. To broaden the possibility of reaching an accurate model that can be applicable for a wide range of experimental conditions (temperature, strain, and strain rate), various types of ML algorithms are usually tested for the same dataset. In general, ML algorithms are classified according to their learning style, where learning can be supervised, unsupervised, or semi-supervised, and most prediction work in materials discovery and design are based on supervised ML algorithms. Besides the learning style, ML algorithms are grouped according to their function (the way they work). Here, various groups are considered, such as regression-, regularization-, instance-, decision-, and ensemble-based algorithms. In this work, six algorithms belonging to different groups were employed, and they are the most common algorithms used in materials science-related research. The six ML algorithms used in this study are gradient-boosted trees (GBT), deep learning (DL), random forest (RF), decision tree (DT), general linear model (GLM), and support vector machine (SVM).
To check the performance of the built model, the accuracy of each model was evaluated and compared using two metrics. The first metric is the mean squared error (MSE), which provides the variance between the predicted value ( y i ) and the actual experimental value ( y ^ i ) by the following relationship:
MSE = 1 n i = 1 n ( y i y ^ i ) 2
The second is the correlation coefficient (R2), a powerful metric to judge the performance of models individually, with no need for other models, and this makes it more reliable compared to other metrics in the case of a regression model in which the output itself (experimental) has a considerable margin of error. The R2 is given as follows:
R 2 = 1 i = 1 n ( y i y ^ i ) i = 1 n ( y i y ¯ i )
where y ¯ i is the average value of y i . Generally, it can be stated that the model with the minimum MSE and R2 values close to 1 will be the most accurate. Concerning accuracy and overestimating models, the constructed model must have a certain degree of complexity that allows it to be general and applicable, but not too specific (overfitting) and not too general (underfitting). This particular problem of specificity, better known as overfitting, is the inevitable temptation of ML model construction, because it can give fairly accurate results in respect to the training set, and one must find a way to balance the model’s performance to reduce the error in training and testing simultaneously to a minimum. When the model’s performance starts deviating wildly in comparing the accuracy metric of the training and testing sets, overfitting occurs, and the model becomes virtually incapable of giving meaningful predictions to a hold-out testing set, or a new prediction set that is to be looked into. Overfitting in general can be a problem of an overabundance of features, an overextended training epoch, or a gross over-parameterization of algorithm parameters in the training dataset.
Figure 6 presents the validation process performed on the trained models of the six different algorithms used in the present study. To compare the prediction accuracy between various ML models, the MSE and R2 were inserted in the graph of each algorithm. It is sufficiently evident that the GBT, DL, and RF successfully predicted the flow stress values with less MSE and high R2 values. Among all the algorithms, DL was the most accurate, with an MSE of 3.1 and R2 of 0.995, whereas the SVM was less accurate compared to the models built using the other algorithms. Interestingly, the performance of the present DL-based model to generate the flow stress curves was better than that of the strain-dependent constitutive model.
This was additionally confirmed by comparing the experimental flow stress curves at various temperatures and strain rates (423, 437, and 523 K and, 0.001, 0.01, 0.1 s−1) with those predicted by the DL-based model (Figure 7). As can be seen from the figure, the DL-based model satisfactorily predicted the flow behavior under different temperature conditions. According to the validation results presented in Figure 6 and Figure 7, the DL-based model was further used to predict the flow stress behavior under a new set of temperatures different from those used initially to train the model—in other words, temperatures never seen before by the model.
Figure 7 shows the flow stress curves of the AZ31-0.5Ca alloy as predicted by the DL-based model at the new set of temperatures, including 373, 573, and 673 K. Here, the same strain rates were employed for the prediction, and if needed, a new set could be employed in the prediction process. Here, we can mix and match temperatures and strain rates and use the combinations to generate flow stress curves of the AZ31-0.5Ca alloy through the DL-model built in the present work. In addition, this procedure can be extended to include all types of Mg alloys by considering the composition of Mg alloys [22] in the feature space beside temperatures, strains, and strain rates. To achieve this, the experimental flow stress curves for various Mg alloys must be obtained, and a dataset that includes this new composition will be needed to train the machine learning model.

4. Conclusions

In this study, the strain-dependent constitutive model and the ML model were employed to predict the flow behavior of AZ31-0.5Ca alloys during hot deformation at various temperatures and strain rates. The key findings of this study can be summarized as follows:
  • The microstructural characterization by the EBSD revealed that the AZ31-0.5Ca alloy has an average grain size of 7 µm. SEM and EPMA confirmed a discernible amount of white precipitates composed of Mg, Al, and Ca dispersed in the Mg matrix.
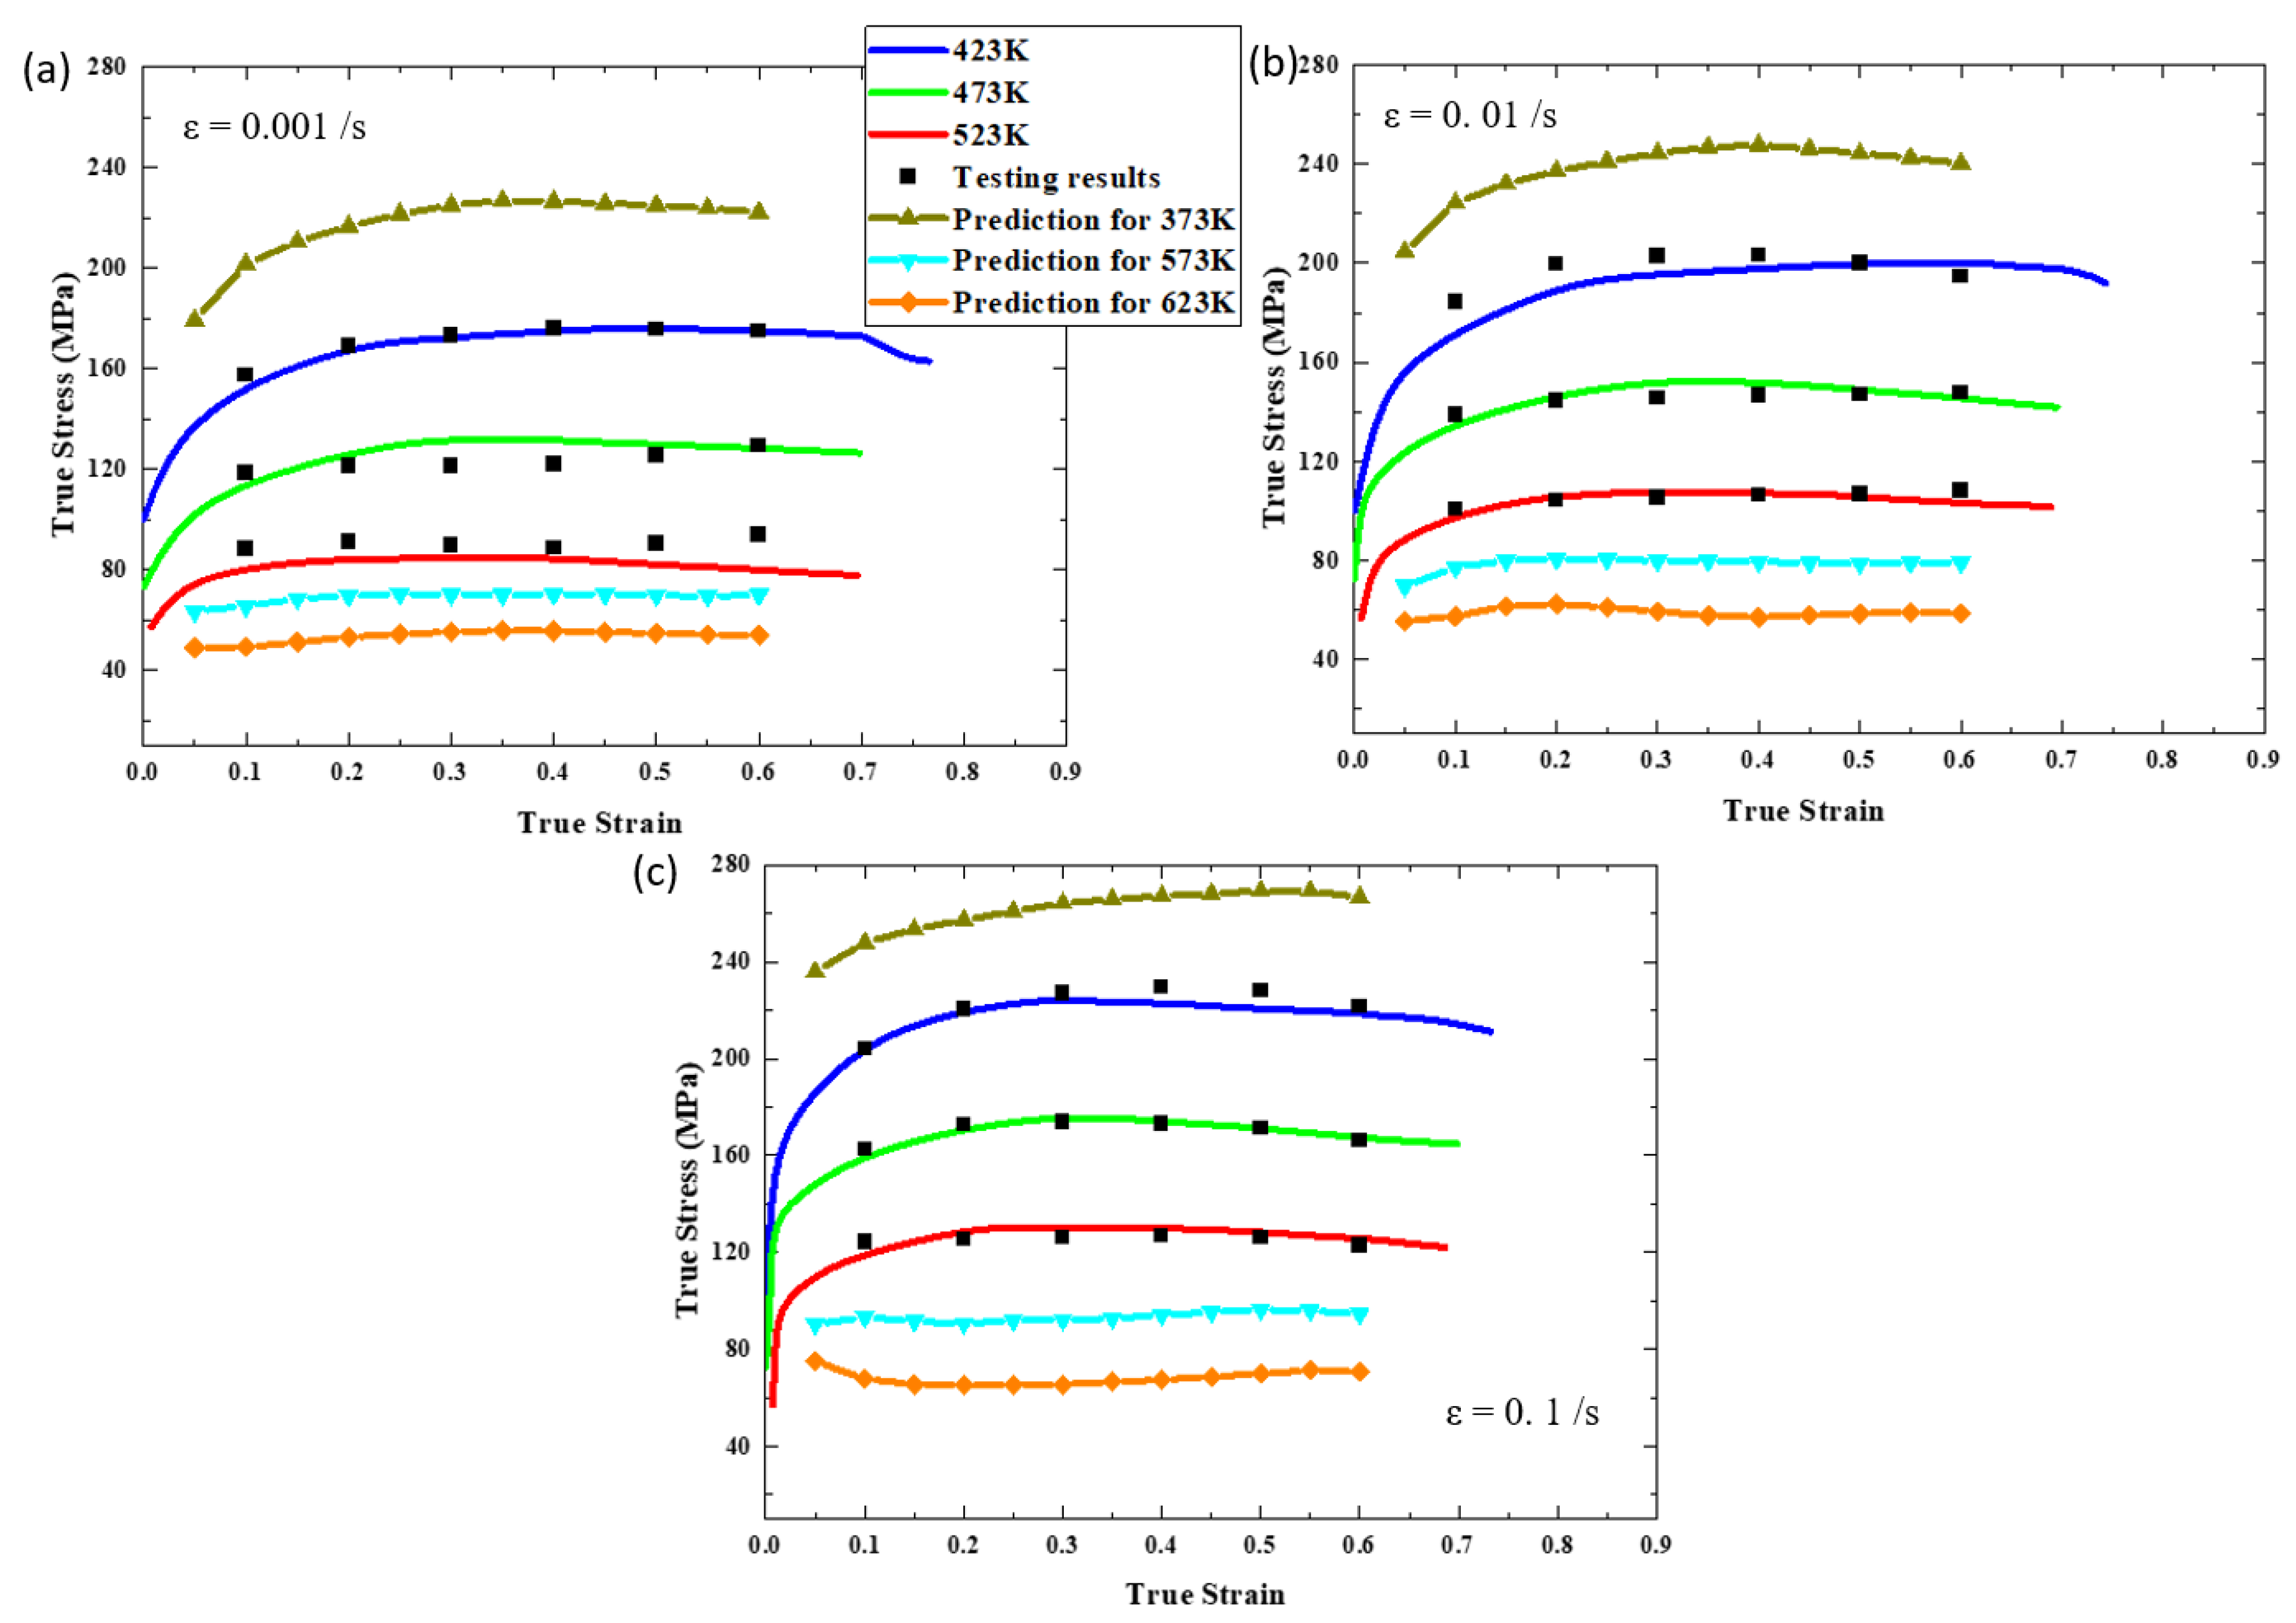
  • The experimental curves initially show strain hardening, which increases with the increase in the strain rate at a fixed temperature and decreases with increases in the temperature. Later stages of the deformation dynamic recrystallization and dynamic recovery lead to the softening mechanism.
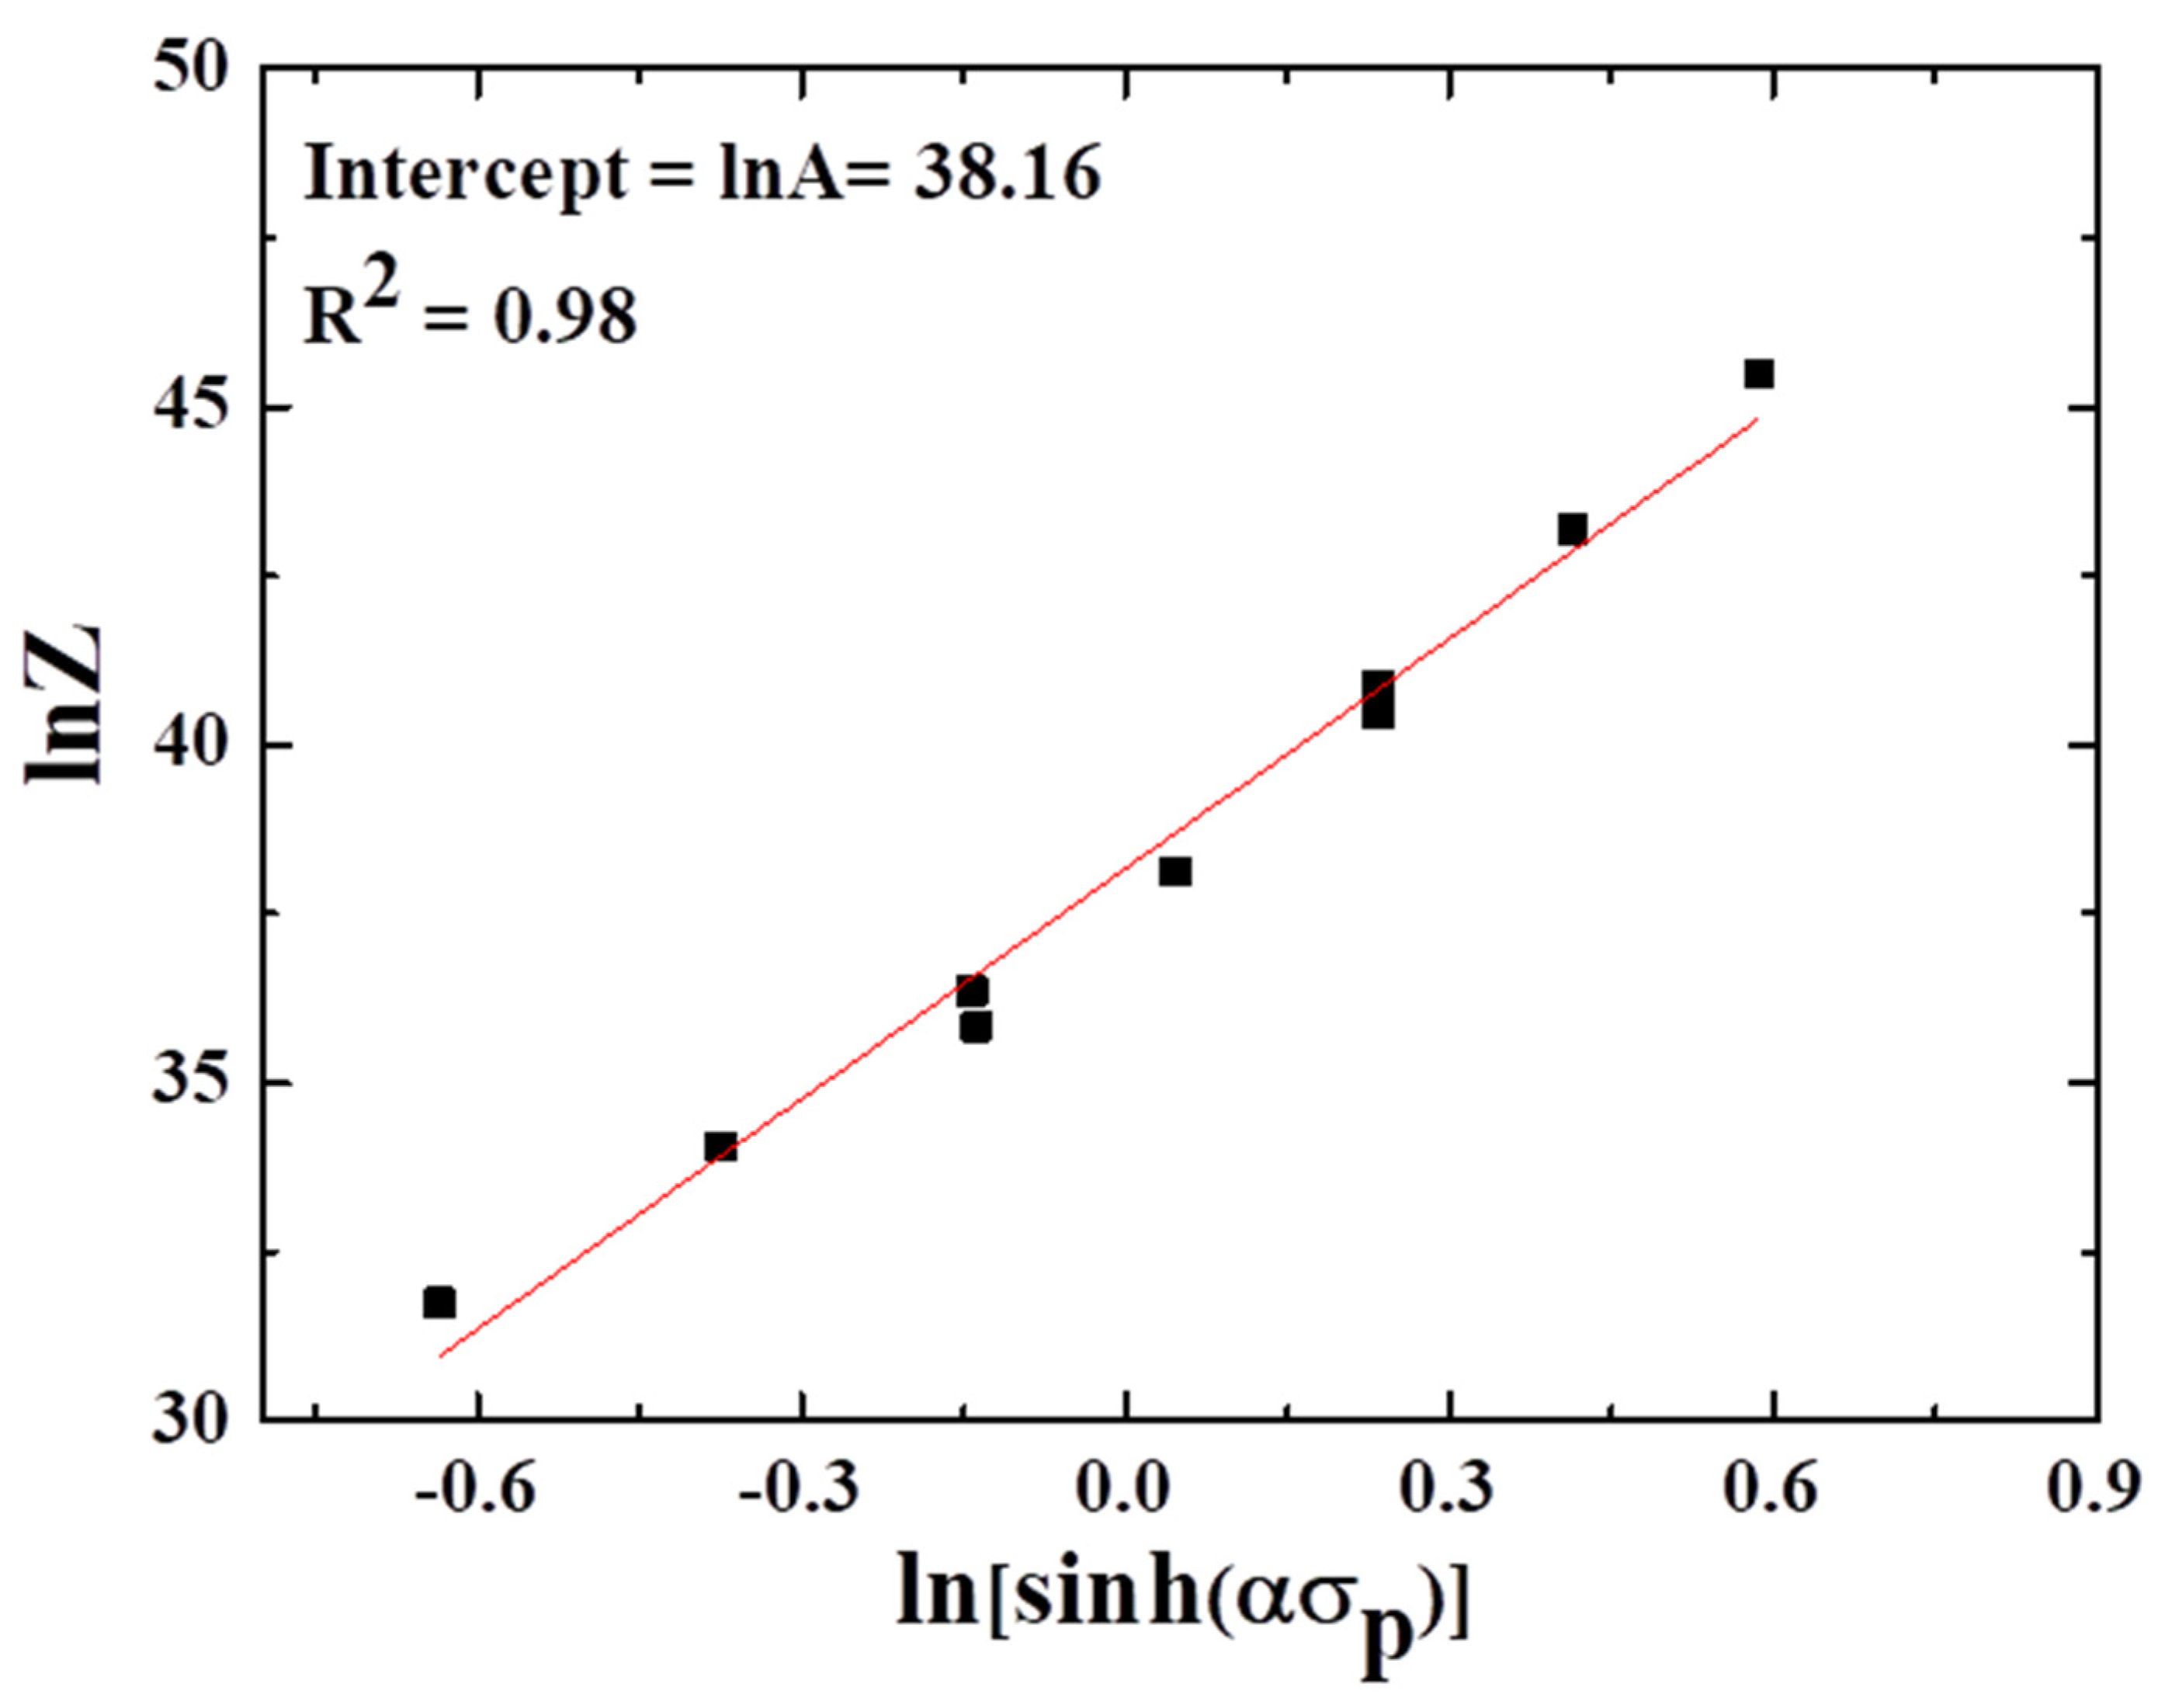
  • Constitutive analysis based on the Arrhenius equation exhibited high Q-values, and the fitting of the predicted flow stresses shows some deviation compared to experimental data.
  • The DL model shows high accuracy, and the predicted flow stresses were well matched with the experimental curves. Based on the data, it is evident that the ML approach can be exploited to predict the high temperature deformation behavior of Mg alloys.

Author Contributions

Conceptualization, K.H. and T.-S.J.; methodology, T.A. and K.H.; software, T.A. and R.J.; vali-dation, K.H. and T.-S.J.; formal analysis, U.M.C.; investigation, U.M.C.; resources, K.H.; data curation, U.M.C. and R.J.; writing—original draft preparation, U.M.C., A.M. and K.H.; writ-ing—review and editing, R.J., T.A. and T.-S.J.; visualization, A.M.; supervision, K.H.; project administration, K.H.; funding acquisition, K.H. All authors have read and agreed to the published version of the manuscript.

Funding

This research was funded by the National Research Foundation (NRF) of South Korea (grant number 2020R1A2C1004720). The APC was funded by the National Research Foundation (NRF) of South Korea (grant number 2020R1A2C1004720).

Institutional Review Board Statement

Not applicable.

Informed Consent Statement

Not applicable.

Data Availability Statement

The data including ML codes, datasets, and miscellaneous codes are available directly from the authors upon reasonable request.

Acknowledgments

This research was supported by the National Research Foundation (NRF) of South Korea (2020R1A2C1004720).

Conflicts of Interest

The authors declare no conflict of interest.

References

  1. Chaudry, U.M.; Hamad, K.; Kim, J.-G. On the ductility of magnesium based materials: A mini review. J. Alloys Compd. 2019, 792, 652–664. [Google Scholar] [CrossRef]
  2. Bian, M.; Huang, X.; Chino, Y. Substantial improvement in cold formability of concentrated Mg-Al-Zn-Ca alloy sheets by high temperature final rolling. Acta. Mater. 2021, 220, 117328. [Google Scholar] [CrossRef]
  3. Chaudry, U.M.; Kim, T.H.; Park, S.D.; Kim, Y.S.; Hamad, K.; Kim, J.-G. Effect of calcium on the superplastic behavior of AZ31 magnesium alloy. Mater. Sci. Eng. A 2019, 739, 289–294. [Google Scholar] [CrossRef]
  4. Wang, Q.; Jiang, B.; Chen, D.; Jin, Z.; Zhao, L.; Yang, Q.; Huang, G.; Pan, F. Strategies for enhancing the room-temperature stretch formability of magnesium alloy sheets: A review. J. Mater. Sci. 2021, 56, 12965–12998. [Google Scholar] [CrossRef]
  5. Chen, Y.; Jin, L.; Dong, J.; Zhang, Z.; Wang, F. Twinning effects on the hot deformation behavior of AZ31 Mg alloy. Mater. Charact. 2016, 118, 363–369. [Google Scholar] [CrossRef]
  6. Wong, T.W.; Hadadzadeh, A.; Wells, M.A. High temperature deformation behavior of extruded AZ31B magnesium alloy. J. Mater. Process. Technol. 2018, 251, 360–368. [Google Scholar] [CrossRef]
  7. Ding, X.; Zhao, F.; Shuang, Y.; Ma, L.; Chu, Z.; Zhao, C. Characterization of hot deformation behavior of as-extruded AZ31 alloy through kinetic analysis and processing maps. J. Mater. Process. Technol. 2020, 276, 116325. [Google Scholar] [CrossRef]
  8. Shang, X.; Zhou, J.; Wang, X.; Luo, Y. Optimizing and identifying the process parameters of AZ31 magnesium alloy in hot compression on the base of processing maps. J. Alloys Compd. 2015, 629, 155–161. [Google Scholar] [CrossRef]
  9. Sheikhani, A.; Roumina, R.; Mahmudi, R. Hot deformation behavior of an extruded AZ31 alloy doped with rare-earth elements. J. Alloys Compd. 2021, 852, 156961. [Google Scholar] [CrossRef]
  10. Malik, A.; Wang, Y.; Huanwu, C.; Nazeer, F.; Ahmed, B.; Khan, M.A.; Mingjun, W. Constitutive analysis, twinning, recrystallization, and crack in fine-grained ZK61 Mg alloy during high strain rate compression over a wide range of temperatures. Mater. Sci. Eng. A 2020, 771, 138649. [Google Scholar] [CrossRef]
  11. Lin, Y.C.; Chen, X.-M. A critical review of experimental results and constitutive descriptions for metals and alloys in hot working. Mater. Des. 2011, 32, 1733–1759. [Google Scholar] [CrossRef]
  12. Luan, J.; Sun, C.; Li, X.; Zhang, Q. Constitutive model for AZ31 magnesium alloy based on isothermal compression test. Mater. Sci. Technol. 2014, 30, 211–219. [Google Scholar] [CrossRef]
  13. Yan, L.; An, D.; Shi, G.; Bian, M.; Khanra, A.K.; Wang, H.J. A Comparative study of constitutive and neural network models for flow behavior of Mg-5.9 Zn-1.6 Zr-1.6 Nd-0.9 Y alloy and processing maps. Mater. Eng. Perform. 2017, 26, 2368–2376. [Google Scholar] [CrossRef]
  14. Yuan, M.; Paradiso, S.; Meredig, B.; Niezgoda, S.R. Machine learning–based reduce order crystal plasticity modeling for ICME applications. Integr. Mater. Manuf. Innov. 2018, 7, 214–230. [Google Scholar] [CrossRef]
  15. Shen, C.; Wang, C.; Wei, X.; Li, Y.; van der Zwaag, S.; Xu, W. Physical metallurgy-guided machine learning and artificial intelligent design of ultrahigh-strength stainless steel. Acta. Mater. 2019, 179, 201–214. [Google Scholar] [CrossRef]
  16. Xue, D.; Xue, D.; Yuan, R.; Zhou, Y.; Balachandran, P.V.; Ding, X.; Sun, J.; Lookman, T. An informatics approach to transformation temperatures of NiTi-based shape memory alloys. Acta. Mater. 2017, 125, 532–541. [Google Scholar] [CrossRef] [Green Version]
  17. Chaudry, U.M.; Hamad, K.; Abuhmed, T. Machine learning-aided design of aluminum alloys with high performance. Mater. Today Commun. 2021, 26, 101897. [Google Scholar] [CrossRef]
  18. Shariati, M.; Weber, W.E.; Bohlen, J.; Kurz, G.; Letzig, D.; Höche, D. Enabling intelligent Mg-sheet processing utilizing efficient machine-learning algorithm. Mater. Sci. Eng. 2020, 794, 139846. [Google Scholar] [CrossRef]
  19. Lin, Y.C.; Zhang, J.; Zhong, J. Application of neural networks to predict elevated temperature flow behavior of a low alloy steel. Comput. Mater. Sci. 2008, 43, 752–758. [Google Scholar] [CrossRef]
  20. Yu, W.; Li, M.Q.; Luo, J.; Su, S.; Li, C. Prediction of the mechanical properties of the post-forged Ti-6Al-4V alloy using fuzzy neural network. Mater. Des. 2010, 31, 3282–3288. [Google Scholar] [CrossRef]
  21. Sellars, C.M.; McTegart, W. On the mechanism of hot deformation. Acta Metall. Mater. 1966, 14, 1136–1138. [Google Scholar] [CrossRef]
  22. Jaafreh, R.; Chaudary, U.M.; Hamad, K.; Abuhmed, T. Age-hardening behavior guided by the multi-objective evolutionary algorithm and machine learning. J. Alloys Compd. 2022, 893, 162104. [Google Scholar] [CrossRef]
Figure 1. Initial microstructure of AZ31-0.5Ca Mg alloys including (a) inverse pole figure (IPF) map, pole figure (PF) map, and grain size profile. (b) Scanning electron microscope (SEM) and electron probe microanalyzer (EPMA) maps. (c) Room-temperature tensile curve of AZ31-0.5Ca Mg alloy.
Mathematics 10 00766 g001
Figure 2. Compressive curves of AZ31-0.5Ca at 423 K, 473 K, and 523 K under the strain rates of 0.001, 0.01, and 0.1 s−1.
Mathematics 10 00766 g002
Figure 3. Linear regression analysis of (a) ln peak stress vs. ln strain rate for value of “n”; (b) peak stress vs. ln strain rate for value of “β”; (c) ln ( sinh ( α σ ) vs. ln strain rate; (d) ln ( sinh ( α σ ) ) and 1/T.
Mathematics 10 00766 g003
Figure 4. The temperature and strain rate dependence of plastic deformation analyzed by the Zener–Hollomon parameter under the given conditions used in the present work.
Mathematics 10 00766 g004
Figure 5. Comparative analysis of predicted and experimental flow stresses by using a strain-dependent constitutive model under strain rates of (a) 0.001 s−1, (b) 0.01 s−1, (c) 0.1 s−1.
Mathematics 10 00766 g005
Figure 6. Experimental and predicted flow stress of the models built using the various machine learning algorithms employed in the present work: gradient boosted tree (GBT), deep learning (DL), random forest (RF), decision tree (DT), general linear model (GLM), and support vector machine (SVM).
Mathematics 10 00766 g006
Figure 7. The predictive and experimental flow curves by the DL model at various temperatures and at the (a) strain rate of 0.001 s−1, (b) strain rate of 0.01 s−1, and (c) strain rate of 0.1 s−1. The prediction results obtained using the DL-based model were chosen to be presented due to the higher accuracy of this model compared to the others.
Mathematics 10 00766 g007
Publisher’s Note: MDPI stays neutral with regard to jurisdictional claims in published maps and institutional affiliations.

