Abstract
Trained professionals in science, technology, engineering, and mathematics (STEM) are needed for a robust, science-based economy that incorporates various technologies’ design, construction, and commercialization to address societal problems. However, keeping students interested in STEM subjects and achieving optimal performance is a challenging task. Math self-efficacy has shown to be one of the most important factors affecting students’ interest in STEM majors and assessing this factor has been a great challenge for education researchers around the world due to the lack of calibrated and culturally adapted instruments. Observing this need, this seminal study conducted psychometric validation tests and cultural adaptations to the Mathematic Self-Efficacy Survey (MSES) aiming to measure this instrument in Spanish-speaking students in different STEM areas in Mexico. Data collected from 877 students were tested for validity using sequential exploratory factor analyses, and contextual modifications were performed and analyzed aiming to achieve cultural equivalency. Suggestions for continuing the adaptation and validation process of the MSES to Spanish language and STEM students’ context are presented with the results of the exploratory factor analyses.
1. Introduction
It is difficult to imagine that a country can develop economically without sufficient human capital skilled in science, technology, engineering, and mathematics (STEM) to design and create technological solutions for modern problems [1,2]. In the particular case of Latin American countries such as Mexico, great interest has been shown in preparing highly trained personnel in STEM areas to promote national development. Currently, this is one of the priorities of the federal government of Mexico, which has programs to promote the education and training of personnel to develop and implement new technologies [3]. To meet this need, educators must design curricular and pedagogical plans that attract more young people to study and prepare for STEM careers, and universities must be prepared to keep these students interested and motivated in completing degree requirements in these areas.
Although the relevance of better strategies for recruiting and reducing student dropouts in STEM careers is transparent, educational research on these topics is very diverse. Most studies do not address how to attract more students to these degrees [4]. Despite the problems defining how to improve STEM education, it is well understood that these degrees based on science and mathematics solve problems through the design and use of technology [5]. Thus, students who have developed good mathematical skills and can use this knowledge to solve problems are more common in STEM majors [6,7]. Due to the importance of mathematical skills among students studying STEM degrees today, finding programs with educational design strategies encouraging middle and high school students to engage in mathematics skills activities is more common [8]. It has been shown that students who take more math courses in high school are more frequently attracted to STEM degrees [9,10,11]. In addition to math courses, having experience in courses that teach advanced math topics in high school has been linked to a higher probability of pursuing a STEM degree [12]. Considering this, this research proposes generating a better understanding of students’ mathematics practices in their preparatory training aiming to motivate young people to use mathematics to solve problems using science and technology [13].
1.1. Purpose
Current literature has shown that students’ mathematical self-efficacy is one of the most relevant factors in selecting a degree related to science and technology [14,15,16,17]. This highlights the relevance of studies that help to understand students’ levels of mathematical self-efficacy and its correlation to the choice of STEM degrees and its possible influence on the indexes of terminal efficiency in these careers. Having a greater understanding of mathematical self-efficacy could help develop strategies so that teachers can advise their students during their studies, especially regarding how to overcome struggles while learning complicated mathematics topics.
Bandura’s theory [18] defines self-efficacy as “the perception of people about their capacities to organize themselves and carry out the actions necessary to achieve a certain level of performance” (p. 391). Literature suggests that students with low mathematical self-efficacy usually report having less interest in engaging in mathematical activities, which can lead them to avoid courses and majors that involve mathematical calculations because they generate anxiety and stress [19]. On the other hand, it has been shown that having a high mathematical self-efficacy correlates with better student performance in mathematics classes. Furthermore, high mathematical self-efficacy positively influences the desire to continue learning and practice mathematics despite facing difficulties during students’ math preparation [18,20].
Despite the relevance of mathematical self-efficacy to students’ interest and motivation to complete professional STEM studies, most research analyzing student self-efficacy in mathematics at different educational levels use unreliable or poorly adapted instruments to students’ context [14,21,22,23]. This may be generating an issue in the current understanding of the effects that mathematical self-efficacy could have on the behavior and motivation of students since the mathematical self-efficacy measurements of these studies’ analyses and conclusions can be biased [24]. This is a common issue especially in studies that collect information from populations that speak a different language than English; there are several studies around the globe in the literature of mathematical self-efficacy that use instruments without examining for their psychometric suitability when making changes to the instrument to adapt it to a new context and language [14,25,26].
The Mathematic Self-Efficacy Survey (MSES) developed by Betz and Hackett [27] is one of the most widely used instruments investigating the effects of mathematical self-efficacy. This instrument has been used to measure the levels of mathematical self-efficacy in different contexts such as high school students [28], older students [29], science and technology students [30], first-year university students [31], and pre-service teachers [32] among others. Although this instrument has been used frequently in the last 30 years of research on mathematical self-efficacy, few researchers have undertaken a process of adaptation and validation before using it in their studies. This lack of psychometric processes promotes potential errors in measuring mathematical self-efficacy, which may weaken the validity of the results in question; this weakness of results can be dangerous when this instrument is translated into other languages for other cultures as they can be a source of score interpretation bias [33,34]. Such technical consequences have been considered under international test adaptation practices where organizations such as the International Test Commission advise addressing this potential source of error when adapting tools from a culture or language to one different from the original edition of an instrument [35].
This study is relevant because no known validations or adaptations of the MSES focus on measuring mathematical self-efficacy levels in university students in the Spanish language. Additionally, this research highlights the paramount importance of conducting a thorough psychometric analysis and context adaptation of this commonly used instrument [36,37,38] since it was created four decades ago and some items could be outdated and misleading for students nowadays. Thus, this research expands the current literature on mathematical self-efficacy, recognizing the importance of collecting data through reliable instruments adapted for cultural and contextual differences among students from other countries [34]. In the end, adapting this instrument to the Spanish language and Mexican context will facilitate research on mathematical self-efficacy in this population, and help teachers and administrators in STEM areas make better decisions for their students about teaching and learning mathematics.
From this perspective, this work presents the beginning of a translation, adaptation, and validation process for the Mathematic Self-Efficacy Survey to determine if it is apt to measure the feelings of mathematical self-efficacy among engineering students in Mexico. Although this validation process aims to offer greater certainty about the measurements of the Mathematic Self-Efficacy Survey in Spanish and present a thorough analysis of the instrument’s validity properties, it is important to highlight that the goal of this research is to present the first of many steps needed to fulfill the validation process. Hence, subsequent validation tests should follow the results presented in this research to continue refining the final version of the adapted instrument. This validation process will add to current literature on mathematical self-efficacy since no reports about exploratory factor analyses have been reported on the MSES validity since 1990 [39,40]. An instrument that has undergone an appropriate cultural adaptation process will generate a more inclusive environment, helping more researchers from different countries and contexts to feel included in the global mathematics research agenda for teaching. This is relevant because few studies on mathematical self-efficacy in the Spanish language and Latin American culture exist [25,26], even though research on STEM education has increased considerably in the last few years [41].
1.2. Framework
This study references the theoretical framework established by Albert Bandura’s Social Cognitive Theory [18], which describes the processes of self-regulation and self-reflection that can modify people’s behavior and actions. Self-efficacy plays a vital role in Bandura’s theory. It is the most determining factor for selecting activities, effort, persistence, and emotional reactions when people experience difficulties performing a specific task. Thus, a person’s self-efficacy in a particular activity can influence their performance [18].
The Social Cognitive Career Theory developed by Lent, Brown, and Hackett [16] was used as a lens to interpret the ideas proposed by Bandura in the Social Cognitive Theory [18]. According to the Social Cognitive Career Theory, students’ self-efficacy in a particular topic is critical in developing interest in a specific career [16]. This interest in selecting a professional career develops as students engage in activities related to such a selected career, generating high self-efficacy each time they complete each program’s activity successfully and learn more about the subject [42,43]. By developing supports such as a clear interest and high self-efficacy in a specific topic, the student can develop the confidence necessary to face the possible challenges and problems that arise during the activities and courses required to achieve their university degree [44]. Ultimately, self-efficacy provides students with better tools to continue pursuing their professional degree if they encounter challenges that make them consider dropping out of their studies [44].
1.3. Self-Efficacy in Mathematics
It has been established that high mathematical self-efficacy can help students develop and maintain better confidence in their abilities to perform activities related to mathematical calculations [15,17,30,45]. This can positively affect STEM majors’ chances of completing their professional studies, as these majors have many courses that use math in their most common activities and problems. On the other hand, if a student has a negative experience, such as failing a math class or experiencing difficulties understanding advanced math topics, it is likely for a student to consider that their math skills are not good enough to successfully complete all the math classes needed to earn a STEM degree and consequently drop out from STEM courses [46,47,48]. Students who report low math self-efficacy typically show little interest in classes that involve math, which is reflected by a lack of effort in their math classes from the start and a reluctance to accept help and advice on math topics [16].
If we could develop a better understanding of the different reactions that STEM students may have based on their level of mathematical self-efficacy, then college-level mathematics teachers could be prepared to advise their students in a better way [49]. Additionally, a work environment could be created to teach mathematics and strengthen students’ confidence in solving mathematical problems. This is important since students with similar math skills can perform very differently in class depending on their levels of math self-efficacy. Thus, it is more likely that a student with high math self-efficacy will be interested in working overtime on their math activities as well as not giving up in case of experiencing difficulties solving math-related problems [16].
Maintaining the motivation to understand advanced mathematical topics despite their inherent difficulties can help reduce the high dropout rates in STEM degrees [50,51,52]. Many students decide to abandon their studies after having bad experiences learning mathematics or when failing a mathematics course [53,54]. Similarly, bad experiences can be relevant for novice students to STEM degrees, as their inexperience in their first math classes at a college level can affect their perception of their math skills throughout their whole studies [46,55].
An effort should be made to provide high school and college math teachers with tools to serve their students better and to understand their needs in learning math. Collecting more information on the psychological aspects that affect students’ mathematics learning would facilitate developing strategies to motivate them to get involved in activities that could help them improve their math skills. Promoting interest in learning and applying mathematics could result in more students with experience in these subjects [41], which ultimately could improve their level of confidence to use their skills to solve STEM problems using mathematics [49].
1.4. Assessing Mathematics Self-Efficacy
Current literature has several studies on mathematical self-efficacy and its effects on students of different ages and contexts. These studies are primarily quantitative and use different instruments to measure mathematical self-efficacy. Some research work developed their own mathematical self-efficacy measurement instruments, including instruments designed for primary and secondary school children [56,57,58]. Other tools measure the mathematical self-efficacy of university students in calculus classes [59], while other instruments measure this factor in students of different races and socioeconomic levels to compare their confidence in performing daily living activities using mathematics [60,61]. Most of these instruments tailored to the needs of each research project were designed based on Bandura’s guide for constructing self-efficacy scales [62]. These works developed their items based on the guide designed by Bandura, and only some carried out basic structural evaluation such as estimating reliability properties via Cronbach’s alpha analysis.
Despite finding different instruments used to measure mathematical self-efficacy, the vast majority of studies evaluating the effects of this self-efficacy factor used some adapted versions of the MSES [27]. MSES adapted versions have been used to examine the effects of mathematical self-efficacy in different contexts and with students of different ages and specialties. There are studies in the nursing area where the MSES items have been adapted to evaluate the mathematical self-efficacy of students between 20 and 45 years of age [36]. Furthermore, other studies attempt to evaluate the mathematical self-efficacy of nursing students in courses that use basic math calculations [38]. These studies in the nursing discipline are relevant since they decided to use an adaptation of the MSES even though there is an instrument specially designed to measure the mathematical self-efficacy of nursing students called the NSE-Math [63]. Other studies use adaptations of the MSES to measure mathematical self-efficacy in high school students, seeking to analyze the effects of this factor among gifted students [37] and senior students [28,64]. Studies can also be found on the influence of mathematical self-efficacy on pre-service teachers in teaching and mathematical activities [32]. Other studies focus on university-level students in general [65], while some look at how mathematical self-efficacy affects the experiences of adults in activities of daily living [29]. In general, all of these studies selected MSES over other options due to its stability in various settings. The issue with these studies is that very few of them conducted additional validity evaluations on the MSES versions used to collect data from the specific population of each study trusting that their translated and adapted versions could have been supported by previous validity evaluations carried out on the MSES. For this reason, this study sought to examine the structure of the MSES to evaluate its validity properties with current data of college students since validity evaluations have not been carried out through structural evaluations (e.g., via exploratory factor analysis) in recent decades. The relevance of this research is that using the MSES to collect data without evaluating this tool psychometrically can result in biased results due to contextual, cultural, or generational changes in the populations that have occurred in the four decades this instrument has existed.
As for studies conducted in the Spanish language, few focus on the effects of mathematical self-efficacy among university students. Thus, this study aimed to adapt an instrument to measure mathematical self-efficacy contextually for Mexican students. Most studies in the Spanish language measuring this factor use a literal translation of instruments designed in English [25,26]. In addition to the language barrier, these studies encounter difficulties interpreting the cultural context of some questions by students because the context in which the questions were designed was very different from that usually experienced by students in other parts of the world.
2. Materials and Methods
2.1. Participants
A total of 1431 participants’ responses were collected in two different data collection points. This data was analyzed as two independent samples, the first sample (n = 877) was used for the first exploratory factor analysis, and the second sample (n = 554) was used for the replicability exploratory factor analysis.
2.1.1. First Sample
The first sample was made up of 877 engineering students (508 men and 369 women) from three public universities in Mexico that are part of the largest technological university system in the country. The age of the participants ranged between 17 and 40 (mean = 18.78, SD = 1.75). Their engineering programs included biochemistry, civil, electrical, industrial, mechanical, electronic, mechatronics, chemistry, and computing systems. Most of the participants were in the first year of their degree (82.3%) and agreed to answer an online survey during the spring semester of 2020. The size of this sample permits structural validation analysis since it exceeds the minimum criterion ratio suggested in psychometrics of at least ten participants for each question analyzed [66].
2.1.2. Second Sample
A second sample independent from the first sample was used to replicate exploratory factor analysis results. The second sample consisted of 554 engineering students (348 men and 206 women) who answered the same survey a few months later during the fall semester of 2020. The age of participants in this sample ranged from 17 to 31 (mean = 18.39, de = 1.25) and these students were enrolled in the same three universities as the first sample; therefore, the participants of the second sample had similar characteristics to the first.
2.2. Instrument
The instrument adapted to the context of engineering students in Mexico was the “Mathematics Self-Efficacy Survey” (MSES) [27]. It was selected because several previous studies with different contexts obtained good results when measuring students’ mathematical self-efficacy perceptions in high school (Nielsen & Moore, 2003) and university [65,67].
The original version of the MSES is written in the English language and consists of 52 items presented on a Likert scale form and asks participants to range answers from 1 (“no confidence at all”) to 10 (“complete confidence”). The MSES measures three dimensions of mathematical self-efficacy: (1) everyday math activities (18 items), (2) math-related college courses (16 items), and (3) math problem-solving (18 items). Although the original instrument proposed a three-dimensional structure, there exists evidence that suggests that the MSES could present a different structure (e.g., four factors [39]). This study describes a validity examination of the MSES through factor analysis [39] considering the possibility that the MSES could measure four factors instead of just three, as indicated by the theory established by the original Betz and Hackett instrument. These four factors emerged when separating the 16 items related to self-efficacy in the mathematics courses from those not related to mathematics, and this separation was not considered in the original instrument.
Although Kranzler and Pajares’s [39] study is almost 25 years old since its publication, no more studies have been found that perform structural examination via any factor analysis strategy on the MSES data collected. The lack of evidence regarding MSES validity examination can become an issue as data collected via MSES items can be outdated or promote cultural misunderstandings when working with people coming from countries who speak a different language than English. Thus, this study was conducted to examine the MSES structure using factor analysis techniques as an initial strategy to evaluate validity properties for this tool. This goal sought in a currently contextual sample can help to make cultural adjustments for better cultural equivalence of the MSES and facilitate better data collection for math self-efficacy future research with populations from Mexican engineering students.
2.3. Translation
The MSES was translated from English to Spanish and the necessary adaptations were made to adjust it to the context of Mexican university students. The translation process was carried out following the recommendations of recognized international organizations concerning evaluation and measurement when this step includes verifying the cultural relevance of the items’ wording when translated into another language [35].
The MSES translation was performed by five professors whose experience involves teaching college-level math classes and conducting research in both English and Spanish languages. Their experience as teachers and researchers in both contexts and languages facilitated reaching an appropriate interpretation of the items read in the English-format that contributed to maintaining the essential meaning of each item when translated to Spanish-language [33,68]. At the end of all the teachers’ translations of the MSES, researchers held a focus group with these teachers to discuss the best way to translate each question [69]. Afterward, the five translations set of MSES items were reviewed and compared. Lastly, a consensual agreement was reached so that the questions in Spanish would retain the meaning they had in their original language to prevent cultural misunderstandings generated by differences in the philosophy of each language [68].
2.4. Verified Translation
Once the MSES translation was completed, the understanding of the instrument in Spanish was evaluated by presenting the translated items to different mathematics teachers and engineering students from one of the universities where the two samples were collected to get their opinions on the questions’ clarity. As literature recommends [70], this process helped validate the relevance of the items evaluated by experts who assisted in establishing the content and face validity of the items [71].
Similarly, following suggestions to better analyze the clarity of each item, three focus groups were conducted; the first group comprised five mathematics teachers and the remaining two groups with five engineering students each. The focus groups discussed how the participants interpreted the MSES items translated into Spanish. Each student focus group had participants from the same math course, one group with first-semester students and the other with second-semester students. Each participant received a copy of the instruments in Spanish-Language one day before being interviewed as a group. Participants were instructed to read each question carefully and to write down comments related to the clarity of each item as a preparation for the group discussions held the next day [70]. Each one-hour focus group was moderated by one of the professors who translated the instrument. In the end, minor adjustments were made to a few items’ wording after collecting students’ and teachers’ feedback to attain cultural equivalency in translating and adapting the items to the desired language and context [33]. One example of the modifications made to the items according to the focus group’s feedback was the items related to tax calculations since this taxation process is different in Mexico where the price tag already includes the sale tax (16%) and no further calculations are needed. Students suggested that these taxation-related items were modified by similar items asking them to calculate discounts if the items they were buying were on sale with 16% off. Examples of items for this Mexican edition are “Trabajar con una calculadora científica.”, “Determinar la cantidad de propina correspondiente a tu parte de una cuenta de restaurante dividida entre ocho personas.”, and “El promedio de tres números es 30. El cuarto número es por lo menos 10. ¿Cuál es el promedio mínimo de los cuatro números?; questions numbered 1, 16, and 37 from the original instrument.
2.5. Exploratory Factor Analyses
The first descriptive analysis of the information was conducted to evaluate multivariate normality properties. These analyses determined the suitability of the proposed statistical analyses (e.g., exploratory factor analyses) according to the nature and quality of the data. Subsequently, this sample was subjected to a series of exploratory factor analyses (EFA) until arriving at an interpretable structural solution. The EFA is a data-driven test that establishes the existence of factors comprised of those items sharing statistical relationships. This test inductively determines if the possible correlations between items are demonstrated to establish the factors formed among the items [72]. The EFA modeling establishes whether each grouped item behaves like an element of a linear function of a clustering factor; if an item presents a loading factor of 0.30 or higher after obtaining EFA results, such an item is deemed as part of that factor [73]. Thus, given that psychological factors are latent (unobservable features) and cannot be established directly through other types of correlations, EFA is a valuable technique to validate the membership of each item in the factors [72]. Moreover, when conducting research projects in the social sciences, EFA strategies are executed to develop and test new instruments designed for measuring psychological variables and to validate the appropriateness of using data collected with these instruments [74].
2.6. Replicability
Continuing with the data validation process obtained through the adaptation of the instrument, additional analyses were conducted on the second sample to evaluate the replicability of the factorial model established with the data from the first sample. This second EFA was carried out to have better evidence of the stability or volatility of the structural model suggested by the first sample results [75]. It is important to highlight that at this phase of the validation process, performing an additional EFA instead of performing a confirmatory factor analysis (CFA) is recommended to check the stability of the first EFA. Following well-founded guidelines in the psychometric discipline about preventing the quick movement from EFA to CFA to avoid further misconceptions when interpreting test adaptation results (e.g., promoting problematic CFA results by not establishing solid exploratory results) [75]. This is why this study presents a highly recommended practice, although often neglected steps when new test editions are in exploratory phases. Hence, two EFA procedures were conducted before moving to other intermediate steps (i.e., EFA under CFA environments).
Lastly, after the EFA, the reliability indices for each subscale were calculated using Cronbach’s Alpha (α) [76]. The descriptive, exploratory-factorial, and reliability analyses were performed using SPSS v22.
3. Results
3.1. Normality Analysis
The multivariate normality analyses performed on the first sample showed that MSES items had an absolute coefficient in the ranges from −2.05 to −0.750 for skew and −0.076 to 4.804 for the kurtosis index. Kline [77] suggests that, in the presence of large samples, items that reach absolute values greater than 3.0 and 10.0 for skew and kurtosis, respectively, are considered problematic; therefore, we concluded that the total sample data fulfilled multivariate normality criteria.
3.2. Exploratory Factor Analysis
The principal axis factoring extraction method with oblique rotation was used to perform the EFA [78]. This type of analysis is recommended when multivariate data normality is established by evaluating skew and kurtosis, and there is a theoretical proposal to establish the possible factors for the instrument under assessment [79].
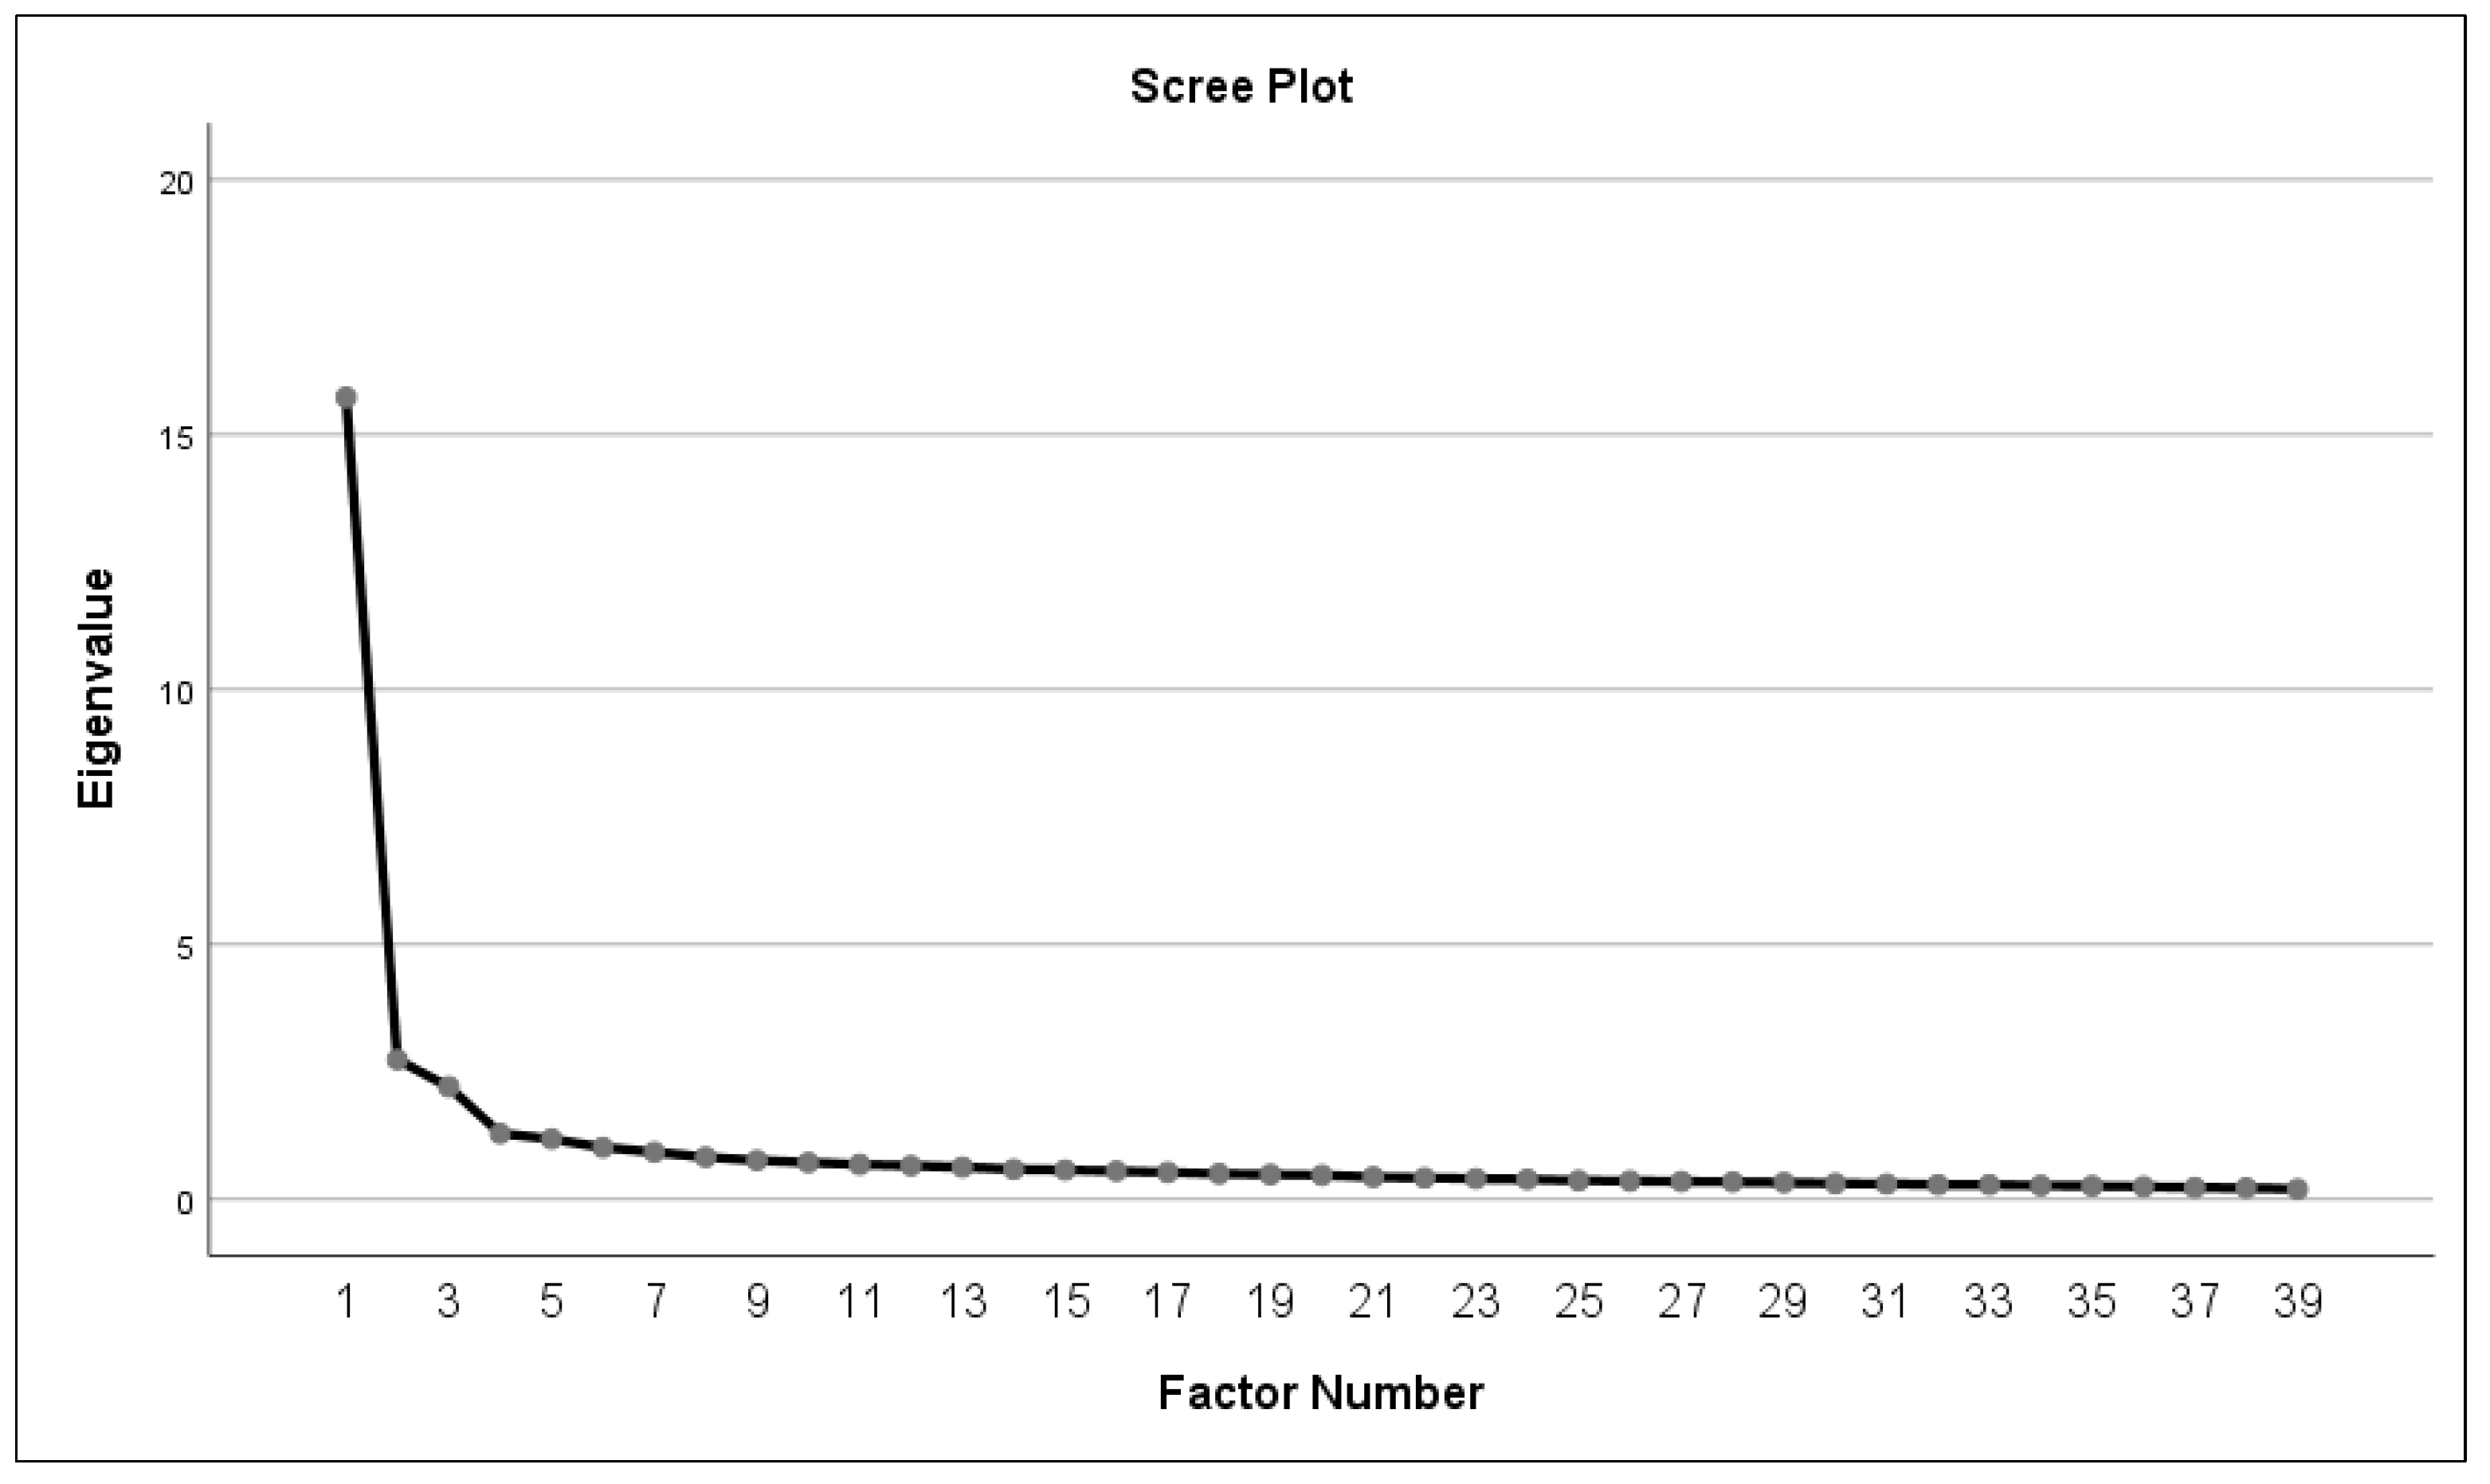
A scree-plot test was performed to identify a turning point that would help determine the number of factors to consider when performing the EFA (see Figure 1). The results of this scree plot determined that three factors were optimal for this analysis, adding to those established by the original instrument that considered three factors. These results and the combination of a broad sample (n > 250) and an average commonality equal to or greater than 0.55 suggested that this number of factors was ideal to keep executing EFA modeling [80]. The initial commonalities resulting from the items were in a range of 0.369–0.674.
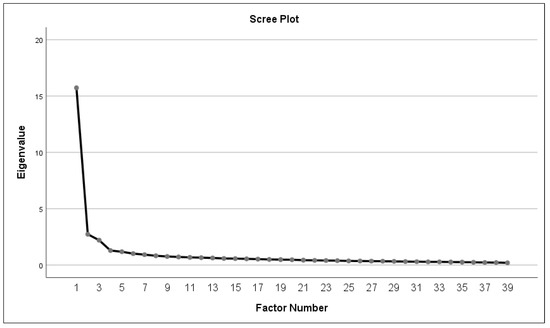
Figure 1.
Results of the “scree plot” of the eigenvalues showing an inflection in the third factor.
As a result of this EFA, the MSES adaptation to Mexican Spanish lost 13 items (original items numbered as Q1, Q8, Q12, Q19, Q20, Q22, Q25, Q31, Q32, Q33, Q34, Q39, and Q45). These items were eliminated because they did not meet the minimum loading factor criterion of 0.30 to be considered part of a factor. Therefore, for this Mexican edition, the instrument decreased from 52 to 39 items (see Table 1). These 39 items were grouped into three factors showing eigenvalues greater than 1 (Kaiser criterion [81]) that explained a total cumulative variance of 53.03% (see Table 1).

Table 1.
Results of the first exploratory factor analysis.
Regarding the Kaiser Meyer Olkin coefficient (KMO), the result was 0.961, which was well above the limit of 0.5 suggested by Kaiser [82], indicating that the sample was adequate to perform exploratory factor analyses. On the other hand, the Bartlett sphericity test presented χ² (741) = 20,805.313 and p < 0.01, which indicated that the correlation between the items was significantly different from an identity matrix, that is, there was a good correlation between the items to consider that items group in a cluster, which is a requirement necessary for the execution of exploratory factor analysis modeling.
The solution indicated by these EFA results was that the 39 remaining items could be clustered as the original MSES three-dimension model (everyday math activities, math-related college courses, and math problem-solving). These 39 items presented a factorial load range from 0.454 to 0.812 (see Table 1). These results align with the guidelines for optimal practice when performing exploratory factor analyses where a loading factor greater than 0.30 is recommended to interpret factors having at least three items [73].
The items eliminated from the adaptation of the MSES to Mexican Spanish are described in Table 2. These items were translated back into English to present the results of the EFA more clearly in this work.
Table 2.
Items eliminated following the EFA results of the first sample.
3.3. Replicability
Direct replication of the solution obtained with the factorial analysis of the first sample was made using the second sample data after eliminating the 13 items that did not load into any factor in the first EFA. It is advisable to carry out this type of external analysis with an independent sample from the one used in a first EFA to evaluate the potential for replicability of the structural solution obtained before exploring it in subsequent studies using more rigorous analyses (e.g., confirmatory factor analysis [79]).
The results of this second analysis showed that the structure proposed in the first modeling has a high percentage of stability, which suggests that this adaptation of the MSES is adequate to continue its validation process with additional independent samples. The result of this second analysis showed similar fit indices (KMO = 0.942; Barlett χ² (741) = 11,823, p < 0.01, total explained variance = 48.272%), as well as the three-dimension model that is suggested from the original instrument. The items evaluated in this second EFA presented loading factors and adequate factorial locations similar to those obtained with the first sample (see Table 3).
Table 3.
Results of direct replication by EFA with the second sample.
The first sample’s solution found with the EFA could not be fully replicated in the second sample because item Q13 did not load in the expected factor, and item Q6 did not reach a loading factor greater than 0.30 despite loading into the expected factor (see Table 3). Although the exact replication of the first EFA results was not achieved, these results showed that the three-dimension model was highly stable based on the pattern and similar structure shown in Table 1 and Table 3. Following these results, items Q6 and Q13 were eliminated, finishing the exploratory analyses with 37 items in three factors, 13 items for everyday math activities, 8 for math-related college courses, and 16 for math problem-solving.
Additionally, the squared difference of the item loads in the two exploratory analyses was below 0.04, suggesting that the criteria, structure, and item load differential can be considered positive indicators to recommend future psychometric explorations of the rotated three-factor solution (external exploratory replicability). It is recommended that for future explorations, use only the 37 items (see Appendix A) indicated by the data validation tests of this research work [79].
Finally, the factor reliability analyses of both samples are presented in Table 4. The Cronbach’s alpha values presented in Table 4 showed a similar behavior between the first and the second sample.
Table 4.
Cronbach’s alpha results of the first and second samples.
4. Discussion
It is essential to highlight that the three MSES factors in their original form were conserved according to the theory with which they were designed (everyday math activities, math-related college courses, and math problem-solving). The relevance of this structure is that the latest studies in the literature describing work conducted with validation processes using exploratory factor analyses were suggesting that more factors were necessary for the MSES structure, for instance, structures presenting four [83] or five factors [40].
The replication results of the first EFA are acceptable because only two items showed slight changes in their factor loadings, with item Q13 loading in two factors simultaneously and item Q6 loading into the same factor but having for their cross-loading a coefficient below the 0.30 established as a criterion to consider item clustering. This consistency in replicability creates confidence that the three-factor model that this study proposes can be stable in future validation tests. In turn, these results suggest that despite losing some items in each of the three factors, the MSES continues to retain sufficient stability to continue using it as an instrument to measure feelings of mathematical self-efficacy in students nowadays.
After the exploratory factor analyses, 15 items were eliminated, 13 in the first EFA and two in the second. The loss of some items due to lacking correlations (i.e., factorial loadings) with one of the three mathematical self-efficacy factors was expected because nearly four decades have passed since the MSES was created. A more detailed analysis of the discarded items from the original MSES version indicates that they were distributed in the three mathematics self-efficacy factors as follows: five from everyday math activities, eight from math-related college courses, and two from the math problem-solving factor.
The factor that lost the most items was math-related college courses (8 items: Q19, Q20, Q22, Q25, Q31, Q32, Q33, and Q34), which could be caused by differences in the type and content of the subjects students used to study 40 years ago compared to the content students learn in current mathematics courses. This point becomes relevant if the type of items eliminated from this factor is analyzed in detail. The content of the eight items that did not load in any factor were mathematics courses of various difficulty levels (see Table 2). This result suggests that STEM majors today may have different views about mathematics courses offered 40 years ago, generating a greater interest in developing students’ mathematics abilities due to the importance that these skills have shown to have for completing a STEM degree in the last 40 years [39,45,50,84]. In the end, if STEM students place greater importance on their mathematical preparation, their mathematical self-efficacy may be higher [46].
When analyzing the deleted items of the everyday math activities (five items: Q1, Q6, Q8, Q12, and Q13) and math problem-solving (two items: Q39 and Q45) factors for the Spanish MSES adaptation (see Table 2), it must be considered that the students of this time have a different lifestyle than 40 years ago. The evolution of students and the development of new technologies have modified the pedagogical or academic tools that students use to complete their homework, for instance, students today have easy access to technologies such as inexpensive scientific calculators and math software on mobile devices that can make some MSES items appear as outdated or out of place. Therefore, some MSES items must be updated to present students with questions that require new technologies and consider that many students depend too much on this technology and do not feel comfortable performing operations without the help of calculators [85]. Moreover, it is possible that given the highly specialized nature of the programs (i.e., heavily designed to attend STEM courses) of this research, these deleted items could have been affected by an uncontextualized mathematics content; future research using this MSES version could aim at updating math sentences to keep exploring structural adaptations for this tool beyond the model this work reports.
Another aspect to consider for questions related to transportation means is the possible socioeconomic differences of the students. Students who have access to a car may answer items related to car use differently than students who commute by public transportation. This can jeopardize the readability of some MSES related to this topic because each student’s perspective on this activity is very contextual [86].
Although the results shown in the exploratory factor analyses were an excellent start to validate the Mexican MSES adaptation, the authors of this research recommend continuing factor analyses with the 29 items suggested by the results in this study for the factors of everyday math activities (13 items) and math problem-solving (16 items) to strengthen the solution this study proposes (see Appendix A). The authors suggest replacing the eight items of the factor of math-related college courses with math courses appropriate for the population to be studied. Continuing structural research under exploratory mode is recommended when no substantial evidence exists [75] or a new edition is an incipient instrument for a target language (i.e., Spanish and its variants). In a subsequent stage, we recommend an exploratory factor analysis under a confirmatory factor analysis framework (EFA/CFA) to target test the belonging of each item to one of the three factors established by the theory and the exploratory factor analyses before moving to a fully confirmatory modeling stage. The methodological steps presented in this research to validate data collected with new or adapted instruments could be seen as an opportune area to improve trustworthiness by researchers that usually rush or even skip the instrument validation process. This way more reliable instruments could be developed to better assess psychological aspects of students’ learning and behaviors and ultimately improve the quality of future research projects [87].
The need to continue with the validation process despite positive results in this first stage using exploratory factor analyses demonstrates the importance of recognizing the value of validation steps of an instrument as a process of continuous refining. It is common in educational research to rush the validation process and simplify it to apply basic content validity tests [14,63]. This problem can be seen in several studies that use the MSES without further validation tests, mutilating parts of the instrument and adjusting it without considering that this can alter the results on the data when measuring the mathematical self-efficacy of the participants [21,32].
The adaptation process in this study highlights the importance of the possible cultural and interpretation barriers that can occur when translating an instrument into another language for different populations [34]. Before beginning with the psychometric validation tests, one must consider these language and culture barriers to adapt an instrument to another language. In this way, by executing and documenting a thorough validity study since translation stages, as this study promotes, it is possible to provide more certainty to researchers and educators that the data collected with recommended instruments will be more precise and more adequately represent the experiences of the population to be evaluated [88].
Assuming that a theory is developed through the analysis and study of mathematical self-efficacy, having a sound measurement tool can contribute to a better understanding of how students learn and practice mathematical topics related to solving problems in STEM areas, generating better learning environments to develop students’ mathematical skills [89]. Thus, outcomes from this study would benefit our understanding about the psychological interest moving students to seek STEM degrees; moreover, such an understanding could ultimately have a positive impact on the interest of groups customarily underrepresented in taking courses in mathematics and STEM, such as women [43,89]. Although women equally take advanced courses in high school like their male peers, they are less likely to take advanced courses related to science and mathematics [90,91]. Thus, female students have little experience in handling advanced math and science topics, which could negatively affect their possible interest in a STEM degree [11]. By better understanding the different needs of students with different genders and academic backgrounds, educators could foster a greater diversity of people interested in STEM and learning and practicing mathematics; thus, counting on accurate information collected by valid and reliable assessment tools would enable developing programs that facilitate providing minority students better services to finish their studies [11].
Having a wider variety of instruments to assess mathematics self-efficacy more precisely adapted to different languages and cultures will improve the quality of studies worldwide. These instruments could help the international community of STEM educators design better strategies to attract a larger and more diverse population of students to these careers and provide them with better tools so that they can complete their studies successfully.
Limitations and Future Work
Although this adaptation of the MSES to the Spanish language and Mexican context is a good start to expand the literature about mathematics self-efficacy, its application in other Spanish-speaking countries in Latin America and Europe or among Spanish-speaking students in the United States can generate unreliable information as this study support the use of this MSES edition for Mexican samples. Proper language adaptations and further validation tests must be made when considering this tool to collect data in samples that can be clearly perceived as culturally different for Spanish students. It is difficult to reach a language and cultural consensus between students from different countries, and some words and sentences may be perceived differently depending on the contexts experienced by students in each country despite speaking the same language. However, the version of MSES presented in this research can support further adaptation projects to other contexts and cultures similar to the Mexican environment. The processes followed in this adaptation process can be used as a guide to continue refining the instrument and achieve a more reliable measurement of the self-efficacy levels of mathematics of STEM students in different populations.
5. Conclusions
The results of this study are a first step to adapt the MSES to a version of the Spanish language and Mexican culture to measure the levels of math self-efficacy in STEM students (see Appendix A). Although favorable results were presented on the validity tests of the data analyzed utilizing exploratory factor analyses, this validation process should be followed by additional exploratory factor analyses and confirmatory factor analysis to obtain a more refined adaptation of the MSES. The validation and adaptation process presented in this study seeks to encourage researchers who wish to analyze the mathematical self-efficacy of current Latino and/or Spanish-speaking students using the MSES to properly test the validity of the data collected and consider the importance of a cultural adaptation of their assessing instruments. In addition, thorough adaptations of renowned instruments to different cultures and languages could facilitate the development of environments where researchers from other cultures and countries could feel included in the research agenda about mathematics self-efficacy. In the end, verifying the accuracy of the data collected through psychometric tools (e.g., via factor analyses strategies) facilitates obtaining more reliable results that can help us better understand the effects that mathematical self-efficacy can generate on the behavior and performance of STEM students.
Author Contributions
Conceptualization, G.M.-S. and J.A.V.V.; Investigation, G.M.-S.; Methodology, J.A.V.V.; Project administration, O.I.G.P.; Writing—original draft, G.M.-S.; Writing—review & editing, J.A.V.V. and O.I.G.P. All authors have read and agreed to the published version of the manuscript.
Funding
This research received no external funding.
Institutional Review Board Statement
The study was conducted in accordance with the Declaration of Helsinki, and approved by the academic vice-rectory from Instituto Tecnologico de Durango since the Institutional Review Board does not exist for studies involving humans.
Informed Consent Statement
Informed consent was obtained from all subjects involved in this study.
Data Availability Statement
Due to institutional restrictions, data is available upon request.
Acknowledgments
The authors acknowledge the Writing Lab, Institute for the Future of Education, Tecnológico de Monterrey, Mexico, for the financial and logistical support in the publication of this open-access work.
Conflicts of Interest
The authors declare no conflict of interest.
Appendix A
Table A1.
Final version of the MSES adaptation.
Table A1.
Final version of the MSES adaptation.
| Q1 | Determinar cuánto pagarás de interés por un préstamo de $675 en dos años con un interés de 14.75% anual. | |
| Q2 | Calcular la cantidad de madera que necesitas comprar para construir dos libreros de 2 mts. de alto y 1 mt. de ancho. | |
| Q3 | Calcular los impuestos que tendrías que pagar en un año de trabajo dependiendo de tu ingreso anual (30% de ISR). | |
| Q4 | Calcular cuánta tela necesitas comprar para hacer cortinas para dos ventanas cuadradas iguales de 1.5 mts. de cada lado. | |
| Q5 | Calcular cuánto interés ganarás con tu cuenta de ahorros en 6 meses, y analizar cómo ese interés es calculado. | |
| Q6 | Estimar el costo total de tu mandado en tu cabeza conforme tomas los artículos. | |
| Q7 | Determinar el monto del impuesto por ventas (IVA 16%) en una compra de ropa. | |
| Q8 | Determinar la cantidad de propina correspondiente a tu parte de una cuenta de restaurante dividida entre ocho personas. | |
| Q9 | Establecer un presupuesto mensual para ti mismo. | |
| Q10 | Balancear tus gastos y tus ingresos semanales sin equivocación. | |
| Q11 | Determinar cuál de dos empleos de verano es la mejor oferta; uno con un salario mayor pero sin prestaciones, el otro con un salario menor más gastos de hospedaje, manutención y transporte. | |
| Q12 | Calcular cuánto ahorrarías si hay un 15% de descuento en un artículo que deseas comprar. | |
| Q13 | Calcular las cantidades de una receta para una cena para 41 personas cuando la receta original es para 12 personas. | |
| Q14 * | Bioquímica | |
| Q15 * | Ciencias de la Computación | |
| Q16 * | Fisiología | |
| Q17 * | Economía | |
| Q18 * | Zoología | |
| Q19 * | Contabilidad | |
| Q20 * | Filosofía | |
| Q21 * | Administración de Empresas | |
| Q22 | En villa estrella, una operación Ѳ con dos variables a y b está definida por a Ѳ b = a x (a + b). Por lo tanto, 2 Ѳ 3 es igual a __________ | |
| Q23 | Sally necesita tres piezas de cartulina para un proyecto escolar. Si las piezas están representadas por los rectángulos A, B, y C, acomoda sus áreas en orden creciente (asume que b > a). | 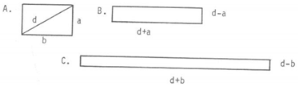 |
| Q24 | El promedio de tres números es 30. El cuarto número es por lo menos 10. ¿Cuál es el promedio mínimo de los cuatro números? | |
| Q25 | Para construir una mesa, Michele necesita 4 piezas de madera de 2.5 pies de longitud para las patas. Desea determinar cuánta madera necesita para 5 mesas. Razona de la siguiente manera: 5 × (4 × 2.5) = (5 × 4) 2.5. ¿Qué propiedad de los números reales está utilizando? | |
| Q26 | Cinco puntos se encuentran en una línea. T está a un lado de G. K está a un lado de H. C está a un lado de T. H está a un lado de G. Determina el orden de aparición de estos cinco puntos sobre la línea. | |
| Q27 | Hay tres números. El segundo es el doble del primero, y el primero es un tercio del otro número. La suma de los tres es 48. Encuentra el número más grande. | |
| Q28 | En cierto triángulo, el lado más corto es de 6 pulgadas, el lado más largo es el doble de largo que el más corto, y el tercer lado es 3.4 pulgadas más corto que el lado más largo. ¿Cuál es la suma de los tres lados en pulgadas? | |
| Q29 | Las manecillas de un reloj forman un ángulo obtuso cuando marca las ____ en punto. (Considera que hay más de una respuesta correcta). | |
| Q30 | Bridget compra un paquete que contiene estampillas de 9 centavos y de 13 centavos por $2.65. Si hay 25 estampillas en el paquete, ¿cuántas estampillas de 13 centavos hay en el paquete? | |
| Q31 | Escribe una ecuación que exprese la condición “el producto de dos números R y S es uno menos que el doble de la suma de ambos”. | |
| Q32 | ”. | |
| Q33 | pulgadas? | |
| Q34 | C + 32. ¿Cuántos grados Fahrenheit son 20 grados centígrados? | |
| Q35 | = | |
| Q36 | Si 3X – 2 = 16, ¿cuál es el valor de X? | |
| Q37 | La cuenta de Fred para algunos artículos para el hogar fue de $13.64. Si el pagó con un billete de 20, ¿cuánto le deben dar de cambio? | |
* Items Q14, Q15, Q16, Q17, Q18, Q19, Q20, and Q21 should be replaced by math courses with adequate difficulty level for the population of interest.
References
- Committee on STEM Education. Federal Science, Technology, Engineering, and Mathematics (STEM) Education. 2013. Available online: https://obamawhitehouse.archives.gov/sites/default/files/microsites/ostp/stem_stratplan_2013.pdf (accessed on 24 September 2019).
- Thomas, B.; Watters, J.J. Perspectives on Australian, Indian and Malaysian approaches to STEM education. Int. J. Educ. Dev. 2015, 45, 42–53. [Google Scholar] [CrossRef] [Green Version]
- Gobierno de la República. Plan Nacional de Desarrollo 2019–2024. 2019. Available online: https://lopezobrador.org.mx/wp-content/uploads/2019/05/PLAN-NACIONAL-DE-DESARROLLO-2019-2024.pdf (accessed on 5 May 2020).
- English, L.D. STEM education K-12: Perspectives on integration. Int. J. STEM Educ. 2016, 3, 1–8. [Google Scholar] [CrossRef]
- Shaughnessy, M. Mathematics in a STEM context. Math. Teach. Middle Sch. 2013, 18, 324. [Google Scholar]
- Ejiwale, J.A. Barriers to successful implementation of STEM education. J. Educ. Learn. 2013, 7, 63. [Google Scholar] [CrossRef] [Green Version]
- Rozgonjuk, D.; Kraav, T.; Mikkor, K.; Orav-puurand, K.; Täht, K. Mathematics anxiety among STEM and social sciences students: The roles of mathematics self-efficacy, and deep and surface approach to learning. Int. J. STEM Educ. 2020, 7, 1–11. [Google Scholar] [CrossRef]
- Fitzallen, N. STEM education: What does mathematics have to offer? In Proceedings of the 38th Annual Conference of the Mathematics Education Research Group of Australasia, Hobart, TAS, Australia, 3–7 July 2015; Volume 1, pp. 237–244. [Google Scholar]
- Maltese, A.V.; Tai, R.H. Pipeline persistence: Examining the association of educational experiences with earned degrees in STEM among U.S. students. Sci. Educ. 2011, 95, 877–907. [Google Scholar] [CrossRef]
- Trusty, J. Effects of high school course-taking and other variables on choice of science and mathematics college majors. J. Couns. Dev. 2002, 80, 464–474. [Google Scholar] [CrossRef]
- Tyson, W.; Lee, R.; Borman, K.M.; Hanson, M.A. Science, technology, engineering, and mathematics (STEM) pathways: High school science and math coursework and postsecondary degree attainment. J. Educ. Stud. Placed Risk 2007, 12, 243–270. [Google Scholar] [CrossRef]
- Rose, H.; Betts, J.R. Math Matters: The Links between High School Curriculum, College Graduation, and Earnings; Public Policy Institute of California: San Francisco, CA, USA, 2001. [Google Scholar]
- Moore, T.J.; Stohlmann, M.S.; Wang, H.H.; Tank, K.M.; Glancy, A.W.; Roehrig, G.H. Implementation and integration of engineering in K-12 STEM education. In Engineering in Pre-College Settings: Synthesizing Research, Policy, and Practices; Purdue University Press: West Lafayette, IA, USA, 2014; pp. 35–60. [Google Scholar]
- Brown, S.; Burnham, J. Engineering student’s mathematics self-efficacy development in a freshmen engineering mathematics ourse. Int. J. Eng. Educ. 2012, 28, 113–129. [Google Scholar]
- Hackett, G. Role of mathematics self-efficacy in the choice of math-related majors of college women and men: A path analysis. J. Couns. Psychol. 1985, 32, 47–56. [Google Scholar] [CrossRef]
- Lent, R.W.; Brown, S.D.; Hackett, G. Toward a unifying social cognitive theory of career and academic interest, choice, and performance. J. Vocat. Behav. 1994, 45, 79–122. [Google Scholar] [CrossRef]
- Mau, W.C. Factors that influence persistence in science and engineering career aspirations. Career Dev. Q. 2003, 51, 234–243. [Google Scholar] [CrossRef] [Green Version]
- Bandura, A. Social Foundations of Thought and Action: A Social Cognitive Theory; Prentice Hall: Englewood Cliffs, NJ, USA, 1986. [Google Scholar]
- Cooper, S.E.; Robinson, D.A. The relationship of mathematics self-efficacy beliefs to mathematics anxiety and performance. Meas. Eval. Couns. Dev. 1991, 24, 4–8. [Google Scholar]
- Williams, T.; Williams, K. Self-efficacy and performance in mathematics: Reciprocal determinism in 33 nations. J. Educ. Psychol. 2010, 102, 453–466. [Google Scholar] [CrossRef]
- Briley, J.S. The relationships among mathematics teaching efficacy, mathematics self-efficacy, and mathematical beliefs for elementary pre-service teachers. Issues Undergrad. Math. Prep. Sch. Teach. 2012, 5, 1–13. [Google Scholar]
- May, D.K. Mathematics Self-Efficacy and Anxiety Questionnaire. Ph.D. Thesis, The University of Georgia, Athens Clarke County, GA, USA, 2009. [Google Scholar]
- Ozyurek, R. The reliability and validity of the mathematics self-efficacy informative sources scale. Educ. Sci. Theory Pract. 2010, 10, 439–447. [Google Scholar]
- Andrews, P.; Diego-Mantecón, J. Instrument adaptation in cross-cultural studies of students’ mathematics-related beliefs: Learning from healthcare research. Comp. J. Comp. Int. Educ. 2015, 45, 545–567. [Google Scholar] [CrossRef] [Green Version]
- De Camposeco Torres, F.M. La Autoeficacia Como Variable en la Motivación Intrínseca y Extrínseca en Matemáticas a Través de un Criterio Étnico. Ph.D. Thesis, Universidad Complutense de Madrid, Madrid, Spain, 2012. [Google Scholar]
- Zalazar Jaime, M.F.; Aparicio Martín, M.D.; Ramírez Flores, C.M.; Garrido, S.J. Estudios preliminares de adaptación de la escala de fuentes de autoeficacia para matemáticas. Rev. Argent. Cienc. Comport. 2011, 3, 1–6. [Google Scholar]
- Betz, N.E.; Hackett, G. The relationship of mathematics self-efficacy expectations to the selection of science-based college majors. J. Vocat. Behav. 1983, 23, 329–345. [Google Scholar] [CrossRef]
- O’Brien, V.; Martinez-Pons, M.; Kopala, M. Mathematics self-efficacy, ethnic identity, gender, and career interests related to mathematics and science. J. Educ. Res. 1999, 92, 231–235. [Google Scholar] [CrossRef]
- Gatobu, S.; Arocha, J.F.; Hoffman-Goetz, L. Numeracy and health numeracy among Chinese and Kenyan immigrants to Canada: Role of math self-efficacy. SAGE Open 2014, 4, 1–10. [Google Scholar] [CrossRef]
- Lent, R.; Lopez, F.; Bieschke, K. Mathematics self-efficacy sources and relation to science-based career choice. J. Couns. Psychol. 1991, 38, 424–430. [Google Scholar] [CrossRef]
- Hall, J.M.; Ponton, M.K. Mathematics self-efficacy of college freshman. J. Dev. Educ. 2005, 28, 26–32. [Google Scholar]
- Bates, A.B.; Latham, N.; Kim, J. Linking preservice teachers mathematics self-efficacy and mathematics teaching efficacy to their mathematical performance. Sch. Sci. Math. 2011, 111, 325–333. [Google Scholar] [CrossRef]
- Chávez, L.M.; Canino, G. Toolkit on Translating and Adapting Instruments; Human Services Research Institute: Cambridge, MA, USA, 2005. [Google Scholar]
- Walther, J. Understanding interpretive research through the lens of a cultural verfremdungseffekt. J. Eng. Educ. 2014, 103, 450–462. [Google Scholar] [CrossRef]
- International Test Commission. The ITC Guidelines for Translating and Adapting Tests. 2007. Available online: https://www.intestcom.org/files/guideline_test_adaptation_2ed.pdf (accessed on 18 November 2018).
- McMullan, M.; Jones, R.; Lea, S. Math anxiety, self-efficacy, and ability in British undergraduate nursing students. Res. Nurs. Health 2012, 35, 178–186. [Google Scholar] [CrossRef] [PubMed]
- Junge, M.E.; Dretzke, B.J. Mathematical self-efficacy gender differences in gifted/talented adolescents. Gift. Child Q. 1995, 39, 22–26. [Google Scholar] [CrossRef]
- Riddle, K.; Domiano, L. Does teaching methodology affect medication dosage calculation skills of undergraduate nursing students? J. Nurs. Educ. Pract. 2020, 10, 36–41. [Google Scholar] [CrossRef]
- Kranzler, J.H.; Pajares, F. An exploratory factor analysis of the mathematics self-efficacy scale-revised (MSES-R). Meas. Eval. Couns. Dev. 1997, 29, 215–229. [Google Scholar] [CrossRef]
- Langenfeld, T.E.; Pajares, F. The mathematics self-efficacy scale: A validation study. In Proceedings of the Annual Meeting of the American Educational Research Association, Atlanta, GA, USA, 12–16 April 1993. [Google Scholar]
- Margot, K.C.; Kettler, T. Teachers perception of STEM integration and education: A systematic literature review. Int. J. STEM Educ. 2019, 6, 1–16. [Google Scholar] [CrossRef] [Green Version]
- Nauta, M.M.; Kahn, J.H.; Angell, J.W.; Cantarelli, E.A. Identifying the antecedent in the relation between career interests and self-efficacy: Is it one, the other, or both? J. Couns. Psychol. 2002, 49, 290–301. [Google Scholar] [CrossRef]
- Tracey, T.J.G. Development of interests and competency beliefs: A 1-year longitudinal study of fifth- to eighth-grade students using the ICA-R and structural equation modeling. J. Couns. Psychol. 2002, 49, 148–163. [Google Scholar] [CrossRef]
- Lent, R.W.; Brown, S.D.; Hackett, G. Contextual supports and barriers to career choice: A social cognitive analysis. J. Couns. Psychol. 2000, 47, 36–49. [Google Scholar] [CrossRef]
- Grigg, S.; Perera, H.N.; McIlveen, P.; Svetleff, Z. Relations among math self efficacy, interest, intentions, and achievement: A social cognitive perspective. Contemp. Educ. Psychol. 2018, 53, 73–86. [Google Scholar] [CrossRef]
- Gardner, J.; Pyke, P.; Belcheir, M.; Schrader, C. Testing our assumptions: Mathematics preparation and its role in engineering student success. In Proceedings of the 2007 American Society for Engineering Education Annual Conference and Exposition, Honolulu, HI, USA, 24–27 June 2007. [Google Scholar]
- Middleton, J.A.; Krause, S.; Maass, S.; Beeley, K.; Collofello, J.; Culbertson, R. Early course and grade predictors of persistence in undergraduate engineering majors. In Proceedings of the 2014 IEEE Frontiers in Education Conference, El Paso, TX, USA, 21–24 October 2015. [Google Scholar]
- Van Dyken, J.; Benson, L.; Gerard, P. Persistence in Engineering: Does Initial Mathematics Course Matter? In Proceedings of the ASEE Annual Conference & Exposition, Seattle, WA, USA, 14–17 June 2015. [Google Scholar]
- Dare, E.A.; Ellis, J.A.; Roehrig, G.H. Driven by Beliefs: Understanding Challenges Physical Science Teachers Face When Integrating Engineering and Physics. J. Pre-College Eng. Educ. Res. 2014, 4, 5. [Google Scholar] [CrossRef]
- Geisinger, B.N.; Raman, D.R. Why they leave: Understanding student attrition from engineering majors. Int. J. Eng. Educ. 2013, 29, 914–925. [Google Scholar]
- Peña-Calvo, J.V.; Inda-Caro, M.; Rodríguez-Menéndez, C.; Fernández-García, C.M. Perceived supports and barriers for career development for second-year STEM students. J. Eng. Educ. 2016, 105, 341–365. [Google Scholar] [CrossRef]
- Council, N.R. Rising Above the Gathering Storm: Energizing and Employing America for a Brighter Economic Future; The National Academic Press: Washington, DC, USA, 2007. [Google Scholar]
- Faulkner, B.; Johnson-Glauch, N.; Choi, D.S.; Herman, G.L. When am I ever going to use this? An investigation of the calculus content of core engineering courses. J. Eng. Educ. 2020, 109, 1–22. [Google Scholar] [CrossRef]
- Suresh, R. The relationship between barrier courses and persistence in engineering. J. Coll. Student Retent. Res. Theory Pract. 2006, 8, 215–239. [Google Scholar] [CrossRef]
- Jones, B.D.; Paretti, M.C.; Hein, S.F.; Knott, T.W. An analysis of motivation constructs with first-year engineering students: Relationships among expectancies, values, achievement, and career plans. J. Eng. Educ. 2010, 99, 319–336. [Google Scholar] [CrossRef]
- Chen, P.P. Exploring the accuracy and predictability of the self-efficacy beliefs of seventh-grade mathematics students. Learn. Individ. Differ. 2003, 14, 77–90. [Google Scholar] [CrossRef]
- Chen, P.; Zimmerman, B. A Cross-National Comparison Study on the Accuracy of Self-Efficacy Beliefs of Middle-School Mathematics Students. J. Exp. Educ. 2007, 75, 221–244. [Google Scholar] [CrossRef]
- Kitsantas, A.; Cheema, J.; Ware, H.W. Mathematics achievement: The role of homework and self-efficacy beliefs. J. Adv. Acad. 2011, 22, 310–339. [Google Scholar] [CrossRef] [Green Version]
- Zakariya, Y.F.; Goodchild, S.; Bjørkestøl, K.; Nilsen, H.K. Calculus self-efficacy inventory: Its development and relationship with approaches to learning. Educ. Sci. 2019, 9, 170. [Google Scholar] [CrossRef] [Green Version]
- Pajares, F.; Graham, L. Self-efficacy, motivation constructs, and mathematics performance of entering middle school students. Contemp. Educ. Psychol. 1999, 24, 124–139. [Google Scholar] [CrossRef] [Green Version]
- Stevens, T.; Olivarez, A.; Lan, W.Y. Role of mathematics self-efficacy and motivation in mathematics performance across ethnicity. J. Educ. Res. 2004, 97, 208–221. [Google Scholar] [CrossRef]
- Bandura, A. Guide for cosntructing self-efficay scales. In Self-Efficacy Beliefs of Adolescents; Pajares, F., Urdan, T., Eds.; Information Age Publishing: Charlotte, NC, USA, 1997; pp. 307–337. [Google Scholar]
- Andrew, S.; Salamonson, Y.; Halcomb, E.J. Nursing students confidence in medication calculations predicts math exam performance. Nurse Educ. Today 2009, 29, 217–223. [Google Scholar] [CrossRef]
- Randhawa, B.S.; Beamer, J.E.; Lundberg, I. Role of mathematics self-efficacy in the structural model of mathematics achievement. J. Educ. Psychol. 1993, 85, 41–48. [Google Scholar] [CrossRef]
- Silk, K.J.; Parrott, R.L. Math anxiety and exposure to statistics in messages about genetically modified foods: Effects of numeracy, math self-efficacy, and form of presentation. J. Health Commun. 2014, 19, 838–852. [Google Scholar] [CrossRef]
- Nunnally, J.; Bernstein, I. Psychometric Theory; McGraw-Hill: New York, NY, USA, 1994. [Google Scholar]
- Hackett, G.; Betz, N.E. An exploration of the mathematics self-efficacy/mathematics performance correspondence. J. Res. Math. Educ. 1989, 20, 261–273. [Google Scholar] [CrossRef]
- Cassirer, E. Antropología Filosófica: Introducción a una Filosofía de la Cultura; Fondo de Cultura Económica: Mexico City, Mexico, 1967. [Google Scholar]
- Greenbaum, T. The Handbook for Focus Group Research; SAGE Publications: Thousand Oaks, CA, USA, 1997. [Google Scholar]
- Hardesty, D.M.; Bearden, W.O. The use of expert judges in scale development: Implications for improving face validity of measures of unobservable constructs. J. Bus. Res. 2004, 57, 98–107. [Google Scholar] [CrossRef]
- Creswell, J.W. Research Design: Qualitative, Quantitative and Mixed Methods Research; Sage Publications, Inc.: Thousand Oaks, CA, USA, 2009. [Google Scholar]
- Fabrigar, L.; Wegener, D.; MacCallum, R.; Strahan, E. Evaluating the use of exploratory factor analysis in psychological research. Psychol. Methods 1999, 4, 272. [Google Scholar] [CrossRef]
- Costello, A.B.; Osborne, J. Best practices in exploratory factor analysis: Four recommendations for getting the most from your analysis. Pract. Assess. Res. Eval. 2005, 10, 7. [Google Scholar]
- Lee, W.C.; Godwin, A.; Hermundstad, A.L. Development of the engineering student integration instrument: Rethinking measures of integration. J. Eng. Educ. 2018, 107, 30–55. [Google Scholar] [CrossRef]
- Osborne, J.W.; Fitzpatrick, D.C. Replication analysis in exploratory factor analysis: What it is and why it makes your analysis better. Pract. Assess. Res. Eval. 2012, 17, 15. [Google Scholar]
- Thorndike, R.M.; Thorndike-Christ, T. Measurement and Evaluation in Psychology and Education; Pearson: Boston, MA, USA, 2010. [Google Scholar]
- Kline, R.B. Principles and Practice of Structural Equation Modeling; Guilford: New York, NY, USA, 2005. [Google Scholar]
- Hendrickson, A.; White, P. Promax: A quick method for rotation to oblique simple structure. Br. J. Stat. Psychol. 1964, 17, 65–70. [Google Scholar] [CrossRef]
- Osborne, J.W. Best Practices in Exploratory Factor Analysis; Createspac Publishing: Scotts Valley, CA, USA, 2014. [Google Scholar]
- Field, A. Discovering Statistics Using SPSS; Sage Publishing: London, UK, 2009. [Google Scholar]
- Kaiser, H.F. A second generation little jiffy. Psychometrika 1970, 35, 401–415. [Google Scholar] [CrossRef]
- Kaiser, H.F. An index of factorial simplicity. Psychometrika 1974, 39, 31–36. [Google Scholar] [CrossRef]
- Kelley, T.R.; Knowles, J.G. A conceptual framework for integrated STEM education. Int. J. STEM Educ. 2016, 3, 1–11. [Google Scholar] [CrossRef] [Green Version]
- Chen, X.; Soldner, M. STEM Attrition: College Students Paths into and Out of STEM Fields Statistical Analysis Report. 2013. Available online: https://nces.ed.gov/pubs2014/2014001rev.pdf (accessed on 20 January 2018).
- Ellington, A.J. A meta-analysis of the effects of calculators on students’ achievement and attitude levels in precollege mathematics classes. J. Res. Math. Educ. 2003, 34, 433–463. [Google Scholar] [CrossRef]
- Lopez, K.A.; Willis, D.G. Descriptive versus interpretive phenomenology: Their contributions to nursing knowledge. Qual. Health Res. 2004, 14, 726. [Google Scholar] [CrossRef] [PubMed]
- Bowen, G.A. Sensitizing Concepts; SAGE Publications: Thousand Oaks, CA, USA, 2006. [Google Scholar]
- Walther, J.; Sochacka, N.W.; Kellam, N.N. Quality in interpretive engineering education research: Reflections on an example study. J. Eng. Educ. 2013, 102, 626–659. [Google Scholar] [CrossRef]
- MacFarlane, B.; MacFarlane, B. Infrastructure of comprehensive STEM programming for advanced learners. STEM Educ. High-Ability Learn. Des. Implement. Program. 2016, 1, 139–160. [Google Scholar]
- Flores, A. Examining disparities in mathematics education: Achievement gap or opportunity gap? High Sch. J. 2007, 91, 29–42. [Google Scholar] [CrossRef]
- Reis, S.M.; Park, S. Gender differences in high-achieving students in math and science. J. Educ. Gift. 2001, 25, 52–73. [Google Scholar] [CrossRef]
Publisher’s Note: MDPI stays neutral with regard to jurisdictional claims in published maps and institutional affiliations. |
© 2022 by the authors. Licensee MDPI, Basel, Switzerland. This article is an open access article distributed under the terms and conditions of the Creative Commons Attribution (CC BY) license (https://creativecommons.org/licenses/by/4.0/).