Abstract
The outcomes of industry–university collaboration, in an open innovation context, may be of great support to firms, in their response to the challenges of today’s highly competitive environment. However, there is no empirical evidence on how these outcomes are influenced by their antecedents. Aiming to fill this gap, a research model to investigate the impact of the major antecedents, identified in the literature as motives, barriers and knowledge transfer channels on the beneficial outcomes and drawbacks of open innovation between the two organizations was developed in this study. The research model was empirically assessed, using a dual-stage predictive approach, based on PLS-SEM and soft computing constituents (artificial neural networks and adaptive neuro-fuzzy inference systems). PLS-SEM was successfully used to test the hypotheses of the research model, while the soft computing approach was employed to predict the complex dependencies between the outcomes and their antecedents. Insights into the relative importance of the antecedents, in shaping the open innovation outcomes, were provided through the importance–performance map analysis. The findings revealed the antecedents that had a significant positive impact on both the beneficial outcomes and drawbacks of industry–university collaboration, in open innovation. The results also highlighted the predictor importance in the research model, as well as the relative importance of the antecedent constructs, based on their effects on the two analyzed outcomes.
MSC:
91
1. Introduction
Today, organizations must perform within a rapidly changing and highly competitive environment, where innovation is seen as one of the key drivers of success and thriving [1,2]. In such a complex environment, knowledge and technology for innovation are widely distributed in the global economy [3,4], so that even the most innovative organizations cannot rely only on their internal research and development sources [5].As a result, industry has to link its internal research and development activities with external resources in searching to become more innovative. In this context, the concept of open innovation, which emphasized the employment of both internal and external ideas and knowledge, to accelerate internal innovation and generate greater business value, from the internal and/or external exploitation of knowledge, has emerged [3].
Although organizations have, for decades, used external knowledge and technologies to improve their innovation processes, what makes open innovation so attractive is the integration, into a single concept, of a collection of already existing developments [6]. In this regard, open innovation is also considered as a sustainable trend, based on a longer evolution of organizations’ innovation activities, which is becoming a requirement rather than an option for many organizations, because they cannot perform internally the entire innovation process [7]. According to Huizingh [6], this offers new opportunities for rethinking the development of innovation strategies, in a global market, where networks expand and interdependencies grow. Therefore, since its initial introduction in the literature, open innovation has been of much interest [8,9,10,11], reflecting the technological, organizational, and societal trends in the last decade [12].
Within this framework, the research on open innovation has simultaneously extended to different areas, including the outcomes of the openness of innovation activities. The existing studies underline the assumption that open innovation is beneficial for industry to innovate successfully and highlight the benefits of industry from opening its innovation process [13,14,15,16]. At the same time, these studies underline potential drawbacks that may arise in implementing open innovation initiatives. Moreover, possible opposing forces can emerge within industry that open its innovation process [15,17], which emphasizes the necessity to create the enabling conditions to capture the benefits and mitigate against the disadvantages of open innovation. However, despite the literature contribution, a detailed approach providing the factors that articulate such conditions is not available.
While in the open innovation context, universities are recognized among the most important external knowledge sources for industry [11,18,19], the research concerning the outcomes of their collaboration from an open innovation perspective is limited. On the other hand, the collaboration between industry and universities is based on different determinants [20,21,22,23], and the successful implementation of such collaboration is the result of considering these determinants. Regarding the main determinants of open innovation between industry and universities, few studies address this issue in detail(e.g., [24]). Moreover, a comprehensive assessment of how the antecedent determinants influence the outcomes of open innovation is missing. Following the idea of Lazzarotti et al. [25], the assumption that outcomes of open innovation between industry and universities are contingent on a combination of different factors is adopted in this study. Thus, this paper focuses on developing a comprehensive model that links the beneficial outcomes and disadvantages to other main antecedent determinants of such collaboration and in investigating their specific relationships.
The remaining parts of this paper are structured as follows. The theoretical background of our approach is referred to in the next section, which also presents the hypotheses development of this study. Then, the research model and methodology are described in detail in the Section 3. After that, the results of the PLS-SEM and soft computing analysis are shown, which are succeeded by research discussions and implications. Summary of findings, limitations and directions for future research are presented in the final section.
2. Outcomes of Open Innovation between Industry–University: Research Setting
2.1. Background
Successful organizations in a global world have to open their boundaries to new ideas and knowledge from external sources, since they do not necessarily possess all the internal resources to innovate successfully. In the context of openness to external knowledge exploration, the innovation advance may be regarded as a continuum that progresses, from closed to open, through different stages of openness [17]. According to extant literature, opening the innovation process may have many benefits, but it may also stand for several disadvantages. In this regard, both the beneficial outcomes and drawbacks of openness should be considered in analyzing why some organizations can profit and others lose from openness.
Using a systematic literature review, Dahlander and Gann [17] indicated a couple of benefits, as well as disadvantages, of sourcing and acquiring external resources, mainly in industrial firms. They considered that both outcomes of knowledge inflow can be analyzed based on pecuniary versus non-pecuniary interactions; in the logic of exchange, pecuniary stands for monetary benefits or disadvantages, while non-pecuniary refers to indirect advantages or drawbacks. Although the outcomes take into account the associated benefits and disadvantages of the two forms of inbound innovation, future research is recommended to explore the contingent factors, under which openness may become a more successful approach. In line with the pecuniary versus non-pecuniary approach of Dahlander and Gann [17], Martovoy et al. [26] provided a conceptual overview based on a more extensive overview of the studies that addressed the benefits and disadvantages of open innovation. Regarding the employment of external knowledge, pecuniary benefits relate to profitability and growth, while the transaction costs stand for the main pecuniary disadvantages. The non-pecuniary advantages appear to affect some areas of the organization that can indirectly benefit from the inflow of relevant knowledge. At the same time, non-pecuniary disadvantages of knowledge inflow seem to have a negative impact on other organizations’ spheres. The opportunities and disadvantages of open innovation were also discussed in the context of firms that open up their innovation projects to external knowledge sources, where involving different types of external partners may have an important influence on the firms’ decision to abandon such projects [16]. Therefore, an alignment between the goals and objectives of the partners has been found as necessary to avoid the abandonment of their innovation projects.
Summarizing, like any other strategic approach, opening up the innovation, has its opportunities and challenges that may be addressed from different points of view. If the open innovation process is managed effectively, it may provide both monetary and non-monetary benefits that positively affect the performance and profitability of an organization at multiple levels [7]. However, collaboration activities with different partners in an open innovation setting are often recognized as slow, risky and costly [27,28]. This may lead to disappointing outcomes, especially when the agendas of partners are not aligned. However, the evidence of the benefits and downsides of collaboration in an open innovation context is still fragmented. The existing papers provide a theoretical conceptual frame [17], involve a pilot study based on a very small number of semi-structured interviews [26], employ an exploratory approach [29], or draw data from a Community Innovation Survey [16]. These studies are mainly related to industrial firms [16,17] or financial institutions [26]. The existing work also explores the influence of different external sources on the innovative performance of the firms, including universities [16,30,31].
The cooperation between industry–university is considered as a highly complex and sophisticated ecosystem [32], and their collaboration has been intensified in recent years [20]. The increasing contribution to the innovation of the knowledge and technology transfer, between industry–university, is one of the main reasons for intensifying this cooperation [33,34]. Regarding the outcomes of such collaboration, they have been analyzed together with other measures that characterize the process. Using a systematic literature review, Ankrah and Al-Tabbaa ([20], p.389) identified five main themes of university–industry collaboration to enhance innovation: organizational forms, motivations, formation process and operationalization, enabling and impeding factors, and outcomes. These themes were divided into different sub-themes and the composition of each sub-theme was further investigated, considering both the industry and universities’ perspectives. Four central measures that describe the knowledge transfer between industry and universities were also identified, based on a systematic literature review: channels, motives, barriers, and outcomes [23].
In an open innovation context, there is still scarce research focusing on the main industry–university determinants. Only several studies analyzed such determinants, considering motives, barriers, channels of knowledge transfer, benefits and drawbacks, as outcomes (e.g., [24]). While the approach of Ankrah and Al-Tabbaa [20], or Vick and Robertson [23], is theoretical in nature, the study of Baban et al. [24] is one of the first studies to provide comparative empirical evidence of the determinantsbetween industry–university collaboration, in an open innovation context. However, the understanding of the relationship between the outcomes and other major determinants of open innovations remains inadequate. The reason is because the existing research is mainly undertaken around each measure, rather than an approach that integrates such determinants. Moreover, there is a lack of empirical evidence on how these outcomes are related to their antecedent determinants.
2.2. Hypotheses Development
Among the existing studies, only Ankrah and Al-Tabbaa [20] developed a theoretical process framework for collaboration between industry and universities, which relate the outcomes to some other dominant themes of such collaboration. We draw on this framework in investigating the relationship between the outcomes and other antecedents that were previously identified as key determinants of industry–university collaboration, in the context of open innovation [24]. Different motives facilitate the adoption of open innovation between the two organizations, which also need to be aware of various barriers that inhibit the process. The industry and university actors use different channels of knowledge transfer, while seeking to address their collaboration in the open innovation context. As a result, the collaboration between the two parties may result in both benefits and drawbacks as the outcomes. Altogether, the motives, barriers and channels of knowledge transfer are supposed to influence the anticipated benefits and possible drawbacks of such collaboration. However, the investigation of this influence is still at an initial stage, and a model that links the antecedents with the outcomes of open innovation collaboration is not established [9]. Therefore, this study analyzes the relationships between motives, barriers, channels of knowledge transfer, considered as antecedents, and the beneficial outcomes and drawbacks resulting from these relationships.
In their approach, Ankrah et al. ([35], p.51) divided the possible benefits into three categories: economic, organizational and societal benefits. At the same time, they classified the possible drawbacks into four groups: deviation from mission/objective of the organization, quality issues, conflicts and risks. Regarding the relation between motives and these outcomes, clearly, connections between them are to be expected [20,35]. The previous studies of Barnes et al. [36], Geisler [37] and Montoro-Sanchez et al. [38], have also linked motivations to potential benefits from such collaboration. Moreover, Lee [39] reported a positive relationship between the motivational considerations and outcomes of university–industry research collaboration. Therefore, we hypothesize that:
Hypothesis 1 (H1).
The motives of open innovation between industry–university significantly impact the beneficial outcomes of their collaboration.
Hypothesis 2 (H2).
The motives of open innovation between industry–university significantly impact the drawbacks of their collaboration.
Since the organizational goals, missions, standards and values vary significantly between industry and universities, the incompatibility between such aspects can create barriers to their collaboration [40]. The literature on open innovation highlights the importance of the factors that impede industry–university collaboration [41,42,43]. If these factors are neglected or not properly managed, they may have a negative impact on successful knowledge transfer between industry and universities [20]. Although it is assumed that the perceived barriers may inhibit the outcomes of knowledge transfer, there is no evidence on how they influence the subsequent collaboration between the two organizations [43]. Therefore, we propose the following hypotheses:
Hypothesis 3 (H3).
The perceived barriers of open innovation between industry–university significantly impact the beneficial outcomes of their collaboration.
Hypothesis 4 (H4).
The perceived barriers of open innovation between industry–university significantly impact the drawbacks of their collaboration.
The collaborative innovation between industry–university is facilitated through multiple and varied knowledge transfer channels, which can be either formal or informal [44]. A substantial body of research has investigated these channels [20,45,46,47], revealing the multidimensionality of the knowledge transfer processes. Despite the recognized influence of the knowledge transfer channels on the outcomes [48], the research in this field is still at a preliminary stage. The study of Santoro [49] underlined the linkage among several components of industry–university activities and the level of generated tangible outcomes. In addition, the knowledge transfer channels may provide, if they are effectively managed, valuable, tangible innovation outcomes between the two organizations [50]. However, the expected effects of such channels on the outcomes have not been sufficiently examined, since quantitative studies are still missing. Therefore, we hypothesize that:
Hypothesis 5 (H5).
The knowledge transfer channels of open innovation between industry–university significantly impact the beneficial outcomes of their collaboration.
Hypothesis 6 (H6).
The knowledge transfer channels of open innovation between industry–university significantly impact the drawbacks of their collaboration.
3. Research Model and Methodology
3.1. Research Model
Although the collaboration between industry–university to improve innovation is the subject of considerable debate regarding the main aspects of this process, the literature on the relationship between the antecedents and outcomes of such collaboration is relatively scarce. A conceptual framework that integrates the five main aspects of industry–university collaboration to enhance innovation was developed by Ankrah and Al-Tabbaa [20], which provides an integrated analysis of their collaboration. The four central measures that describe the knowledge transfer between industry and universities identified by Vick and Robertson [23] were analyzed based on both sociopolitical and contextual perspectives. The degree of correspondence between the motives, beneficial outcomes and drawbacks of the university and industry actors are analyzed in [35] based on limited semi-structured interviews with both academics and industry participants. Therefore, future studies based on quantitative data are recommended in this research to generalize its results. To sum up, the existing studies are primarily based on conceptual frameworks or qualitative approaches developed in the broad context of industry–university collaboration. Moreover, the various aspects of industry–university collaboration presented in [20] are only theoretically linked together, while some of these aspects are individually analyzed in [23,35].
On the other hand, developing open innovation between industry–university is not a standardized process and so far there has been very little evidence on how the antecedents impact the outcomes of such collaboration. Among the existing studies, the work of Baban et al. [24] clearly provides empirical evidence regarding the five main constructs of the industry–university collaboration in the context of open innovation (motives, barriers, channels, beneficial outcomes and drawbacks) based on a quantitative method of data collection and analysis (i.e., survey). This evidence was drawn considering an ontology that has been documented through an extensive review of the extant literature on industry–university relations and included multiple items for each construct. Taking into account the ontology presented by Baban et al. [24] and the hypotheses stated above, a research model was developed in our study based on multi-item measures that include both pecuniary and non-pecuniary rationale indicators. Figure 1 depicts our research model that links together the constructs under investigation into a hierarchical component structure. The higher-order constructs of the proposed model are grouped into different categories based on literature recommendations as stated below.
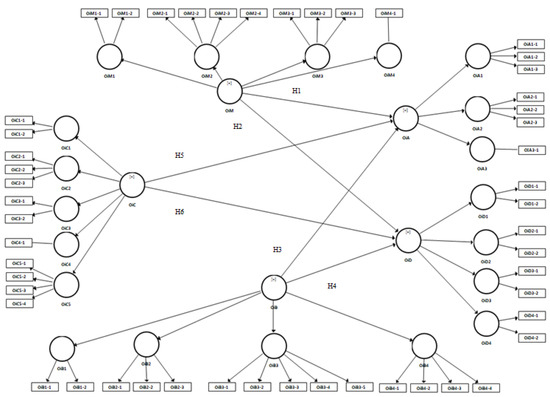
Figure 1.
The research model and hypotheses.
Following Ankrah et al. [35], the beneficial outcomes are grouped into three categories related to (OiA1) organizational, (OiA2) economic and (OiA3) societal advantages. At the same time, the drawbacks are coded under four headings: (OiD1) deviation from mission/objective of the organization, (OiD2) quality issues, (OiD3) conflicts and (OiD4) risks [35]. Regarding the antecedents of the open innovation between industry–university, they are grouped into different categories based on the recommendation of the literature. Accordingly, the motives are split into four categories: (OiM1) access to know how and ideas, (OiM2) access to the research results, (OiM3) efficiency and (OiM4) organizational motives [20,38]. The barriers are sub-divided into: (OiB1) awareness and connections, (OiB2) relevance to industry, (OiB3) uncertainty and (OiB4) organizational and managerial barriers [20,43]. Finally, the knowledge transfer channels are structured into five categories: (OiC1) publications, (OiC2) informal links and networks, (OiC3) research collaborations, (OiC4) consulting and (OiC5) training and employment [20,45]. Table 1 provides an overview of the constructs of the developed model, including the indicators of each category of the five constructs. All observable items in Table 1 are adapted from Baban and Baban [51].

Table 1.
Hierarchical constructs of the model.
3.2. Research Methodology
Since there is no empirical evidence on the developed model, we adopted an exploratory approach to investigate the relationships among the antecedents and outcomes of open innovation under examination in this study. Our exploratory approach was based on a survey conducted within two industrial areas, the Valenza Industrial District and Oradea Industrial Parks. The characteristics of these industrial areas as well as of the survey format are briefly presented next.
Located in a small city in the north-west part of Italy and formally recognized in 2002 from the Piedmont Region, Valenza Industrial District is considered one of the most important hubs for jewelry production. Although the reputation of the firms based in this district comes from the highest standards of design and quality of their products, they have to compete in a global market and face the challenges of new competitors from emerging economies. In responding to these challenges, the firms of Valenza Industrial District have to find new innovation approaches and open innovation with universities may help them to succeed in the global arena. The Oradea Industrial Parks are based in the north-west part of Romania and their development started in 2008. Today, four sites are included in the structure, managed by the Oradea Local Development Agency, a public company owned by Oradea Municipality. Most of the representative firms located in Oradea Industrial Parks are related to various leading manufacturing industries, which support knowledge and technology transfer with universities. They also have to perform in an world-class manufacturing environment that leads them to an ongoing transformation of their innovation strategies, including open innovation. All these provide the premise for collaboration of the firms based in the two industrial areas with universities in an open innovation context to integrate new external knowledge and develop new products, processes or technologies.
The self-administered survey questionnaires addressed the importance of each observable item of the five constructs depicted in Figure 1 and targeted firms from both industrial zones that interacted with universities. The response format was from 1 (not important) to 5 (very important) for all observable items. The respondents were people at the management level directly responsible for the firm’s innovation processes or its owner, which were selected using purposive sampling. In the end, a total of 98 usable responses were accepted in this study.
PLS-SEM was proposed to investigate the relationships among the constructs of the research model depicted in Figure 1. This choice was motivated by the following considerations presented in the literature [52,53,54,55]. First, our research is considered exploratory in nature, since the theoretical fundamentals for the hypotheses are relatively new and still developing. Second, the structure of our model includes many latent variables and observed items. Third, the data are not normally distributed as the Kolmogorov–Smirnov test indicated that the two-tailed p-values are less than 0.05. Fourth, the sample size of responses is relatively small. Nevertheless, assuming the commonly used research requirements (, significance level = 5%, level of statistical power = 80%) and the complexity of the paths in the proposed model (maximum number of arrows pointing at a latent variable is equal to five), the minimum sample size should be 70 ([56], p. 21). Therefore, the sample size of 98 may be considered sufficient for the purpose of our study.
Although PLS-SEM is able to test the hypotheses and research models, it is based on two sets of linear equations [54] and therefore cannot capture nonlinear relationships. However, a linear approach may not be sufficient in dealing with the complexity of the relationships among the determinants of open innovation. By contrast, artificial intelligence is capable of handling complex problems in the business context that are usually linked with human intelligence [57]. Among the existing artificial intelligence approaches, the soft computing methodologies have the capability to adapt their knowledge base through different optimization techniques [58]. Within the soft computing constituents, the artificial neural networks (ANN) have been recognized as useful in a research setting with a weak theory to support the hypotheses of the study [54], since they are capable ofworking with incomplete information [58]. This is the context of our work, in which no theory links the antecedents and outcomes in the developed model. Moreover, ANN can address complex interactions that involved both linear and nonlinear relationships, but it is not appropriate for theory testing because of its “blackbox” algorithm [59]. On the other hand, the adaptive neuro-fuzzy inference system (ANFIS) is another constituent ofsoft computing that has been successfully applied in modeling nonlinear relationships in the context of innovation [60,61].
Within this framework, a hybrid approach based on a dual-stage analysis was adopted. In the first stage, the PLS-SEM was employed to explore the causal relationships in our research model. The PLS-SEM analysis was performed through SmartPLS 3 software [62]. Then in the second stage, the efficacy of ANN and ANFIS in identifying the presence of the non-linear relationships in the developed research model was compared and the relative importance of the construct variables was evaluated. In this stage, the IBM SPSS Modeler and the Fuzzy Logic Toolbox™ of the Matlab® software were employed to carry out the ANN and ANFIS analysis, respectively.
4. Results
4.1. The PLS-SEM Analysis
The model depicted in Figure 1 is a hierarchical component model, in which the OiA and OiD are conceptualized as second-order constructs that OiM, OiB and OiC can explain. Since the main interest of our research is in estimating the higher-order constructs, a disjoint two-stage approach was used, as it provides the advantage of assessing a more parsimonious model [63]. Because we developed a second-order path model, the disjoint two-stage approach was performed in two phases, following the recommendations of Sarstedt et al. [64]. Moreover, the importance–performance map analysis was further conducted to evaluate the performance of the analyzed antecedents.
4.1.1. Assessment of the First-Order Model
In the first stage, the model was estimated without the second-order constructs. For this purpose, the model was created only by linking the first-order components of each OiM, OiB and OiC construct to all first-order components of OiB and OiC constructs. Then, the assessment of the measurement of this model was conducted using the evaluation criteria for the construct reliability and validity available in the literature [56]. Specifically, the assessment started with the evaluation of the factor loadings. The results showed that the outer loading of the indicator OiB3-2 was 0.092 and, therefore, below the 0.40 criterion. Consequently, it was eliminated from the construct OiB3. After the removal of OiB3-2 item, the outer loadings of the indicators OiM2-4, OiB3-4, OiB3-5, OiB4-3 and OiB4-4 remained between 0.40 and 0.70. Therefore, these indicators should also be considered for deletion. Nevertheless, their removal did not increase the composite reliability or average variance extracted measures above the recommended value. Thus, these items were not dropped from the model. Regarding the remaining indicators, their outer loadings were above 0.7 and they were all retained in the model. Table 2 presents the measurement properties of the model, developed in the first stage.
Table 2.
Reliability and validity assessment of the first-order model.
The conservative Cronbach’s alphas, of all first-order constructs, exceeded the threshold of 0.70, except for the OiB3 and OiC3 components that resulted in marginally lower values than 0.7 (0.685 and 0.688, respectively). However, the Cronbach’s alpha may decrease to an acceptable value of 0.60 in exploratory research [65]. Moreover, the composite reliability ρC measures of all first-order constructs were above the value of 0.7. Therefore, the internal consistency reliability was established. The results in Table 2 also indicated that the measures of all first-order constructs provide satisfactory levels of convergent validity, since their average variance extracted values (AVEs) were greater than 0.5.
Finally, the heterotrait-monotrait ratio (HTMT) was employed to assess the discriminant validity, following the guidelines of Hair et al. [53]. Table 3 shows the computed HTMT ratios of the first-order constructs. The HTMT values of all these components were below the threshold of 0.9, apart from that between the OiA1 and OiA2 components. Nevertheless, the correlation between these two constructs was computed as 0.903, which is very slightly above the 0.9 value. Another two ratios were found between the more conservative value of 0.85 and 0.9, while all the other HTMT ratios were less than the lower threshold value of 0.85. As such, these findings provided satisfactory support for the discriminant validity of the first-order constructs of the model. Once the estimated measurement properties of the first-order model exhibited acceptable values, the construct scores were extracted for the first-order components and then used to assess the second-order constructs.
Table 3.
Assessment of discriminant validity of the first-order constructs using the HTMT ratio.
4.1.2. Assessment of the Second-Order Model
In stage two, the construct scores of the first-order components, obtained from stage one, were used to create and estimate the second-order model that is depicted in Figure 2.
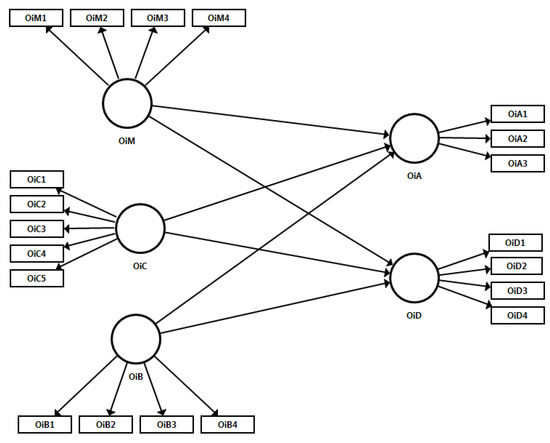
Figure 2.
The second-order model.
The assessment of the measurement of the second-order model was carried out using a similar approach to that adopted in step 1. Table 4 illustrates the results for the reliability and validity of the second-order constructs. The internal consistency reliability was established, as both the Cronbach’s alphas and composite reliability of all second-order constructs surpassed the threshold of 0.70. The AVEs values of all second-order constructs exceeded the limit of 0.5 and, thus, provide evidence of their convergent validity.
Table 4.
Reliability and validity assessment of the second-order model.
Table 5 shows the HTMT values of the second-order constructs, which were all less than the threshold of 0.9. Apart from three HTMT ratios that were found between 0.85 and 0.9, all the other HTMT ratios were less than 0.85. These findings indicated satisfactory support for the discriminant validity of the second-order constructs of the model.
Table 5.
Discriminant validity assessment of the second-order constructs using the HTMT ratio.
Finally, the structural model was assessed considering the metrics indicated by Hair et al. [53]. Before assessing the structural model, the collinearity was examined using the variance inflation factor (VIF). The results pointed out that the VIFs values of the antecedent constructs ranged from 1.643 to 2.941, which are below the threshold of 3 [53]. Therefore, the collinearity among these constructs was not considered an issue for this study.
Next, we evaluated the significance of the path coefficient and confirmed the developed hypotheses. For this purpose, a bootstrapping analysis, with 5000 subsamples, was performed. Table 6 displays the results of the examination. In terms of the influences of the antecedents on the advantages of open innovation, between industry–university, the impact of the motives of industry for engagement on the beneficial outcomes was significant (β = 0.396, t = 2.898, p < 0.01), as well as the impact of its preferred channels of knowledge transfer (β = 0.490, t = 4.282, p < 0.001). Therefore, hypotheses H1 and H5 were supported. In contrast, the impact of the perceived barriers on the beneficial outcomes was not significant (β = −0.021, t = 0.233, p > 0.1). Hence, hypothesis H3 was not supported.
Table 6.
Analysis of the significance of relationships.
Regarding the influences of the antecedents on the disadvantages of industry–university collaboration, in the context of open innovation, the impact of both perceived barriers of industry (β = 0.329, t = 2.666, p < 0.01), and its preferred channels of knowledge transfer (β = 0.328, t = 2.175, p < 0.01) on the drawbacks, was significant. Thus, the hypotheses H4 and H6 were supported. On the other hand, the motives of industry for engagement did not significantly influence the drawbacks (β = −0.091, t = 0.603, p > 0.1) and, therefore, the hypothesis H2 was not supported.
Lastly, the coefficient of determination R2 and cross-validated redundancy Q2 were employed to evaluate the quality of the structural model. Table 7 shows the results of this assessment, which were analyzed considering the guidelines presented by Hair et al. [53].The antecedent constructs OiM, OiC and OiB, together, explained 68.16% of the variance in beneficial outcomes () and 27.69% in drawbacks (). Since both OiA and OiD are explained by only three predictor constructs, their R2 can be considered as acceptable in the PLS path model [54]. In addition, the Q2 values were greater than 0 for both outcomes. These results suggested that our model has in-sample predictive relevance for these constructs [53].
Table 7.
The quality of the structural model.
4.1.3. The Importance–Performance Map Analysis
A perspective into the varying influences of the OiM, OiC and OiB predecessor constructs on the target OiA or OiD outcomes was given through the importance–performance map analysis (IPMA). More precisely, IPMA combines the total effects of the relationships between the predecessor constructs and target outcomes in the structural model (representing importance), with the average of the rescaled latent variable scores of the predecessor constructs (their performance) in a two-dimensional map [66]. In such a map, these two measures are graphically combined by contrasting the importance on the x-axis with the performance on the y-axis.
Because PLS-SEM assumes linear relationships, the importance is computed as the sum of the direct and all the indirect effects in the structural model [66]. Since there are no indirect effects in the model depicted in Figure 2, we have to consider only the direct effect between each Oixk antecedent () and each Oiyl outcome (). Therefore, the total effects of Oixk on Oiyl can be expressed as , where βkl are the structural model coefficients of the path that connect the antecedent Oixk to outcome Oiyl. Ringle and Sarstedt [66] recommended the employment of the unstandardized total effects as the importance measure that can be computed as , where and represent the standard deviation of the Oixk antecedent and Oiyl outcome, respectively. In this way, an increase in one antecedent’s performance would increase an outcome’s performance by the size of its unstandardized total effect [66].
Both the unstandardized total effects and the average of the antecedent scores of the IPMA are automatically computed by SmartPLS 3 [66]. To facilitate the comparison of results, the performance scores are first rescaled, on a range from 0 to 100, which is also automatically done by SmartPLS 3 [66].
Figure 3 and Figure 4 depict the IPMA maps at the constructs’ level. In the case of the target OiA outcome, the OiB predecessor was located on the left side of the IPMA map (lower importance), while the OiC and OiB predecessors were placed on the right side (higher importance). The highest performance was found for the OiM component, while the OiB and OiC components showed similar performance (see Figure 3).
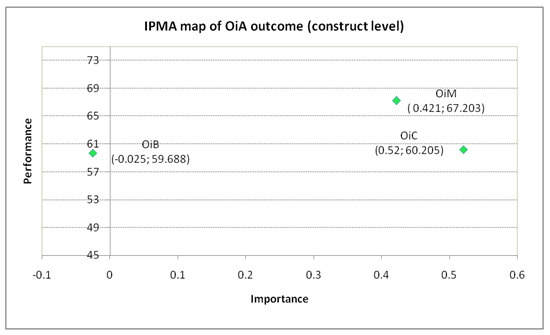
Figure 3.
The IPMA map of the target OiA outcome (construct level).
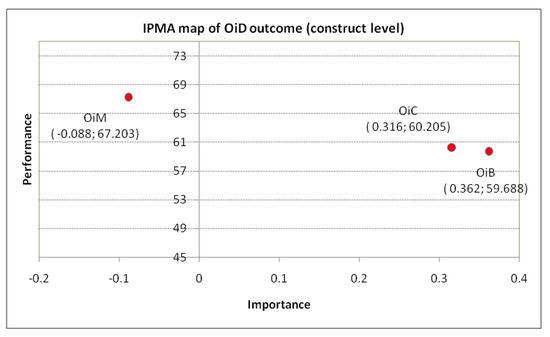
Figure 4.
The IPMA map of the target OiD outcome (construct level).
On the other hand, the OiM predecessor resulted in the upper-left of the IPMA map of the target OiD outcome (lowest importance, highest performance). The OiB and OiC predecessors were located in the lower-right part of the IPMA map, with similar importance–performance values (see Figure 4).
In addition, the two-dimensional IPMA map can be further divided into four quadrants to prioritize needs and make recommendations for future actions, when considering different statistics, such as the mean or median of both the importance and performance of the constructs as demarcation lines (see [67,68]).
4.2. The Soft Computing Approach
As the PLS-SEM assumes only linear relationships, it was combined first with a computational ANN model that is capable of capturing complex linear and non-linear interactions between its variables, to make the analysis even more useful.For this purpose, the latent variable scores of the significant hypothesized constructs from the PLS-SEM were used as the dataset for the ANN analysis. A typical ANN architecture incorporates several layers in a hierarchical structure, including one input layer, one or more hidden layers and one output layer [58]. Different sets of weights connect the hidden layer(s) to the input and output layer, respectively. The main advantage of ANN is its capability to capture unknown information from the data through the weight coefficients adjustment during the training process of the neural network, which is also called a learning process [69]. Although there are many ANNs available in literature, the multi-layer perceptron (MLP) was used in this study, considering its ability to learn nonlinear models [69].
Since there is no heuristic way to determine the network topology, we followed the indication of Svozil et al. [69], which recommended starting with one hidden layer, with a sufficiently large number of neurons. Therefore, in our study, we considered one single hidden layer and the architecture of the MLP network implemented in IBM SPSS Modeler, presented next. For an outcome Y = Oiy let X = (Oix1, Oix2) are the significant hypothesized constructs from the PLS-SEM analysis. The topology of the MLP network is as follows ([70], p. 291–292):
Input layer: J0 = 2 neurons, a0:1, a0:2; with a0:j = Oixj ().
The hidden layer: J1 neurons, a1:1,…, a1:J1; with a1:k = γ1(c1:k) and , where γ1 is the activation function for the hidden layer; w1:j,k is the weight leading from input layer-neuron j to hidden layer-neuron k (); and a0:0 = 1. The model employs hyperbolic tangent as an activation function for the hidden layer, which can be expressed as: .
Output layer: JI = 1 neuron, aI:1; with aI:1 = γI(cI:1) and , where a1:0 = 1. The softmax function is used as an activation function for output layer ().
The training of this MLP network is based on a backpropagation learning algorithm, which is described in detail in the literature [70].
A trial-and-error approach was adopted to determine the number of neurons in the hidden layer of the MLP network. First, the dataset was split into training, validation and testing sets, with a typical proportion 60-20-20, respectively [71]. Then, various models of ANN were built, with different neurons in the one hidden layer. After fitting each model, using the training data, the validation dataset was employed to compare these models and find the one with the best fit. Next, the best model was applied to the testing set to evaluate its predicting performance on data that are independent of the model. We drew on the RMSE statistic to assess the degree of the prediction error of the ANN models. Figure 5 displays the data stream developed with IBM SPSS Modeler to determine the network topology of each ANN model.
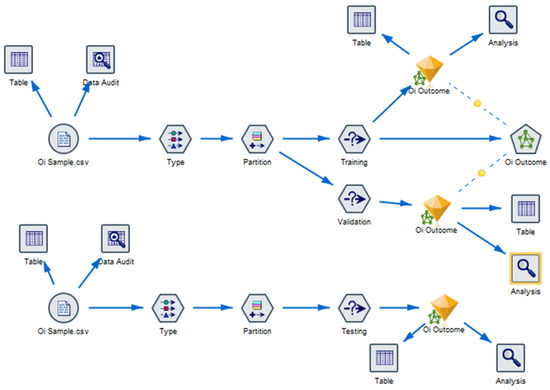
Figure 5.
The ANN topology determination stream developed with IBM SPSS Modeler.
Table 8 shows the RMSE statistics of the ANN models, varying from two to seven neurons in the hidden layer, for both OiA and OiD outcomes (J1 = 2… 7). It was observed that the topology with five neurons in the hidden layer produced the lowest value of RMSE for the validation set, in both cases (0.6490 and 0.8143, respectively). Thus, an ANN with five neurons in the hidden layer was considered appropriate for these outcomes, and its architecture for the OiA is shown in Figure 6. The RMSE values of the testing data were also computed as 0.5920 and 1.0752 for OiA and OiD outcomes, which are similar to those in the training data. Since these relatively low RMSE values were nearly the same for training, testing and validation data, the ANN models developed for the OiA and OiD outcomes can be considered as adequate predictors of new datasets.
Table 8.
RMSE variation of the ANN models with the number of neurons in the hidden layer.
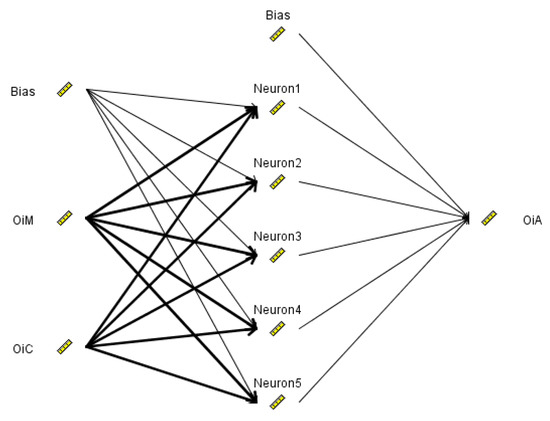
Figure 6.
The ANN topology for the OiA outcome.
On the other hand, ANFIS has been recognized as an effective method for modeling nonlinear and complex problems [72]. ANFIS integrates a fuzzy inference system that provides the framework for knowledge representation of the system expertise with the learning capabilities of neural networks [58]. Considering an input/output dataset, ANFIS constructs a fuzzy inference system and employs a multilayer feedforward neural network to adjust its membership function parameters. In this way, the fuzzy inference systems can learn from the data they are modeling. Although several fuzzy inference systems have been developed, the Sugeno fuzzy model is used in the ANFIS architecture. This model is based on Takagi and Sugeno’s “if-then” rule, which has linguistic terms, characterized by membership functions in the “if” premise part and a polynomial function of the input variables in the consequent “then” part [58]. The coefficients of the polynomial function in the rule consequents and the membership function parameters in the rule premise are automatically tuned through the learning process of the ANFIS.
The latent variable scores of the significant hypothesized constructs from the PLS-SEM were also employed as the input/output dataset for the ANFIS analysis. For each outcome, we considered an ANFIS model as a two-inputs and one single-output system. In each case, the fuzzy inference system was based on the zero-order Sugeno model, when the polynomial function of the consequent part is a constant. The same training, validation and testing sets from the ANN analysis were employed for the two ANFIS models. To achieve satisfactory generalization toward unknown data, the size of the training set is recommended to be at least equal to the total number of the modifiable parameters in the ANFIS model [73]. Consequently, three linguistic terms were associated with each membership function, considering the size of our training data, and 32 = 9 fuzzy rules were taken into account.
The architecture of these ANFIS models is illustrated, next, in the context of our study. In the case of the ANFIS under consideration, two input linguistic variables were used. Let the significant hypothesized constructs from the PLS-SEM analysis be the input linguistic variables and the linguistic terms associated with each variable . These linguistic terms have been defined as:
where
The membership functions associated with each linguistic term have been defined as:
For the zero-order Sugeno fuzzy model, a typicall IF-THEN rule can be expressed in the following form [58]:
where represents the singleton of k-th rule.
The architecture of the ANFIS consists of five layers, as follows ([58], pp. 336–337):
Layer 1is composed of adaptive nodes and its outputs are represented by the values of the membership functions of the input linguistic variables:
The parameters of the the membership function in relation (4) are called premise parameters.
Layer 2 is composed of fixed nodes and the output of each node can be represented as:
Layer 3 is also composed of fixed nodes and the output of each node can be represented as:
Layer 4 is composed of adaptive nodes and its outputs are:
The parameters in this layer are referred to as the consequent parameters.
Layer 5 is composed of a single fixed node, which calculates the overall output:
A hybrid learning algorithm is used to identify both the premise and consequent parameters in relations (4) and (7), respectively, to minimize the difference between the ANFIS’s computed outputs with relation (8) and the corresponding observed values [58].
For each outcome, the grid partition was used to create the fuzzy inference system for all the eight membership functions, implemented in the Fuzzy Logic Toolbox™ of the Matlab® software, and the fuzzy rules were automatically built by the ANFIS system. Figure 7 illustrates the structure of the ANFIS model in Matlab® software for the OiA outcome. In this case, the psigmf membership function produced the lowest RMSE value of the validation set (0.7989), which is relatively similar to that in the training data (0.4541). For the OiD outcome, the lowest RMSE value of the validation set resulted for the trimf membership function (0.7442), which is nearly the same as the RMSE value of the training set (0.8543). The RMSE values of the testing data were also computed for both outcomes, as 1.0403 and 1.1239 for OiA and OiD, respectively.
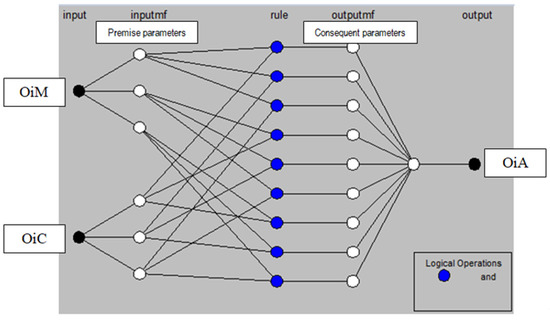
Figure 7.
The ANFIS structure for the OiA outcome.
The results of both the ANN and ANFIS analysis are summarized in Table 9. Since their relatively low RMSE values were similar for the training, validation and testing data, the ANN and ANFIS models can be considered as adequate predictors of new datasets.
Table 9.
Performance results of the ANN and ANFIS analysis.
As can be seen in Table 9, the ANFIS models produced lower RMSE values of training data for both outcomes. Nevertheless, the RMSE values of the validation and testing data are lower for the ANN models. Consequently, these results suggested that the ANN produced a slightly better solution than that resultingfrom the use of the ANFIS scheme. Therefore, the ANN approach was, furthermore, employed to investigate the relative importance of the construct variables of our model.
As the sample size is relatively small, a k-fold cross-validation approach was performed, to further avoid overfitting of the adopted ANN models. Considering the initial proportion of dataset splitting, five-fold cross-validation, with data partition of 80-20 for training and testing, was deployed using IBM SPSS Modeler. Table 10 summarizes the results of the cross-validation process, in which the RMSE and predictor importance of a model were computed as the average of the values in the five subsets. The RMSE values of the models were lower and their variations small, for both the training and test sets. Moreover, these values were similar to those in determining the topology of the ANN, which also indicated robust models.
Table 10.
The five-fold cross-validation and predictor importance analysis.
The predictor importance in each ANN model was computed using the algorithm implemented in IBM SPSS Modeler, which adopts the variance-based method to sensitivity analysis [70]. Table 10 reveals that OiM was the most significant predictor of the OiA outcome, followed by the OiC construct. This is a very interesting result, as OiC was found more important than OiM, based on their strength of influence in the PLS-SEM (see Table 6). Therefore, after capturing the non-linear relationships among the variables through the ANN, OiM was more important than the OiC construct. Regarding the OiD outcome, the importance of the two predictors OiB and OiC was almost the same, a result similar to that in the PLS-SEM analysis. However, the importance of the OiB was significantly higher than that of OiC, for the folds 1 and 4 of the cross-validation approach. At the same time, the result was in the opposite direction for folds 3 and 5. This also may suggest the presence of non-linear relationships among the constructs, in the case of the OiD outcome.
5. Discussion
In this study, we empirically assessed a model that investigated how the major antecedents impact the outcomes of open innovation between industry and universities. Since various motives have been attributed to both organizations for collaborating in open innovation, clearly, associations between motivations and outcomes are expected. In terms of the influences of motivational drivers on the outcomes of open innovation, between industry–university, we found that the industry’s motives for engagement have a significant positive impact on the beneficial outcomes. This result is in agreement with the findings of Ankrah et al. [35], which pointed out that motives can be seen as indications of anticipated benefits. At the same time, the industry’s preferred channels of knowledge transfer have a significant positive influence on the beneficial outcomes. In this case, the industry that collaborates with universities, through multiple channels, tends to have more economic and organizational benefits from this collaboration [35]. Finally, the perceived barriers by industry were determined as having a negative, but insignificant, effect on the beneficial outcomes. A possible explanation of this finding is that barriers are more likely to be associated with drawbacks. Moreover, the IPMA analysis revealed the lowest importance and performance of the perceived barriers on the beneficial outcomes (see Figure 3). Considering these findings, the focus should be given to the motives and channels of knowledge transfer. Since the motives were evaluated as having the highest performance and relatively high importance, they are influential in sustaining open innovation at a high level, and industry should concentrate on keeping them at these levels. The knowledge transfer channels received higher importance but lower performance. Thus, industry should pay close attention to this antecedent, since its ignorance might cause a significant negative impact on the collaboration with universities in open innovation.
Regarding the influences of the antecedents on the disadvantages of industry–university collaboration, in the context of open innovation, the perceived barriers of industry and preferred channels of knowledge transfer have a significant positive impact on the drawbacks. In the case of barriers, it is assumed that they may impede an effective and efficient knowledge and technology exchange [43]. However, evidence on the impact of perceived barriers on the drawbacks of collaborations has been missing until now. An interesting result is that the preferred knowledge transfer channels also have a significant positive influence on the drawbacks. This is in line with Barnes et al. [36], as the variety of analyzed channels indicates that collaboration between industry–university, in open innovation, is governed by the cumulative result of both negative and positive outcomes from those channels. Nevertheless, the channels of knowledge transfer were more positively related to the beneficial outcomes than to the drawbacks, according to their path coefficients in Table 6. Therefore, if the preferred channels of knowledge transfer are correctly managed, there tended to be many more benefits than challenges on the open innovation collaboration. On the other hand, the motives of the industry for engagement do not significantly influence the drawbacks. This is not surprising, since the motives are likely to be connected to the beneficial outcomes [35]. However, these motives were found as having the lowest importance and highest performance (see Figure 4). Although this construct was found not to be important, through active education about the impact of the identified motives, industry can diminish the challenges of its collaboration with universities in open innovation. At the same time, both the barriers and channels of knowledge transfer showed higher importance but lower performance. Therefore, industry should concentrate on these antecedents, as their ignorance might significantly lead to a lack of collaboration, in an open innovation context with universities. Considering these results, our study provides several research implications, which are discussed below.
The research field of open innovation outcomes continues to be scarce and dispersed, resulting in a limited understanding of how they are linked to other determinants of open innovation. On the whole, our findings fill this knowledge gap and expand the existing literature in several ways. First, the present study advances a research model that relates the major antecedent determinants of open innovation, between industry–university, previously identified in the literature [20,23,24]. Drawing on the conceptual framework developed by Ankrah and Al-Tabbaa [20], the developed research model connects the key antecedents with the collaboration outcomes of open innovation between the two actors. Our study offers new insights for research, in that we hypothesized the influence of such antecedents on the outcomes of open innovation. Addressing evidence that industry–university collaboration in an open innovation context may be either beneficial or detrimental [24], we also provide an understanding of which antecedents significantly impact the outcome of such collaboration. Therefore, the research model presents a more articulated picture of the outcomes of industry, in adopting inbound, open innovation with universities. On the other hand, the theoretical fundamentals of this study are still developing and the proposed model has been considered exploratory in nature. Thus, it can be used as a foundation, in extending future research, and new components are expected to be added to the model through the research advance in the complexity of the open innovation phenomenon.
Second, the investigation of the relationships among the constructs of our research model was conducted through the integration of both the PLS-SEM and soft computing tools. In a dual-stage predictive analysis, the PLS-SEM was first employed to test the hypotheses of the research model. However, PLS-SEM is able to individually capture only the linear relationships among the components of the model. Considering the complexity of the open innovation, these relationships may not necessarily follow a linear form. As a result, two soft computing constituents were proposed in the second stage of our analysis, to detect the presence of non-linear relationships in our model. One of them is ANN, which can capture both linear and nonlinear relationships, but it is not able to extract them from data [69]. Therefore, ANN is not appropriate for theory testing and it is mainly employed for prediction. Although PLS-SEM and ANN have been used together in diverse studies to complement each other [74], we found very few studies addressing their employment in the context of innovation (e.g., [75]). On the other hand, through the integration of the learning capabilities of neural networks, with the knowledge representation of the fuzzy inference system, ANFIS may also provide an effective way of predicting complex and nonlinear relationships, within the context of open innovation. As in the case of ANN, very few studies use the combination of PLS-SEM and ANFIS in the innovation field (e.g., [61]). The results in predicting the dependencies between the variables of the model were similar for the two soft computing constituents. ANN was, however, only marginally better in the context of our research.
Third, the predictor importance in the research model was established through the variance-based method of sensitivity analysis. The findings of the predictor importance analysis sustained the presence of non-linear relationships among the constructs of the model. Therefore, the two-stage predictive PLS-SEM and soft computing approach may represent a significant contribution, from amethodological point of view, since soft computing is able to compensate the shortcomings of PLS-SEM analysis.
6. Conclusions
6.1. Summary of Findings
Operating in a knowledge-based economy, industry is increasingly dependent on knowledge production, and universities play a pivotal role in this process [20,76]. Therefore, industry often collaborates with universities and the context of open innovation, and particularly its outcomes, may be of great support in responding to the challenges of today’s disruptive environment. However, there is a lack of evidence on how these outcomes are related to other key elements of open innovations, including their antecedents.
Aiming to fill this gap, our study develops a research model to investigate the impact of the major antecedents on the outcomes of open innovation, between industry and universities. The research model was empirically assessed, using a dual-stage predictive approach. First, the PLS-SEM was successfully used to test the hypotheses of the research model. Then, both ANN and ANFIS constituents of soft computing were employed to predict the dependencies between the outcomes and their antecedents. Since the ANN has been conducted to a slightly better solution, in the context of our research, it was next used to establish the predictor importance in the research model and to identify the presence of non-linear relationships among the constructs of the model. Our study also provided helpful insights into the relative importance of the antecedents, in shaping the open innovation outcomes through the IPMA at the construct level.
6.2. Limitations and Future Research
Considering the nature of our study, several limitations have to be acknowledged that also lead to the future research agenda. First, this study provides one of the first models that links the antecedents and outcomes of open innovation between industry–university, and there is no evidence on a similar model. Since its theoretical foundation is still developing, the indicators of some components of the model might not be fully captured. Nevertheless, the model offers the flexibility to incorporate any new indicator, identified through the research, in the complex field of open innovation. Additional studies are expected to confirm or modify our findings, once such indicators are identified.
Second, our exploratory investigation was based on a survey, conducted within two industrial areas, and the sample size of responses is relatively small. Thus, replications conducted in different nationwide contexts, involving larger sample sizes, are required before the results can be fully generalized.
Third, future research will also have to address the nonlinearity among the antecedent variables and outcomes, suggested by the sensitivity analysis engaged in the evaluation of the predictor importance of the ANN models. If such nonlinearity will continue to be supported in studies based on larger sample sizes, a nonlinear IPMA approach is expected to allow more elaborate conclusions and recommendations [66].
Author Contributions
Conceptualization, C.F.B., M.B. and A.R.; methodology, C.F.B.; software, M.B.; validation, C.F.B. and M.B.; formal analysis, C.F.B.; investigation, C.F.B. and M.B.; resources, A.R.; writing—original draft preparation, C.F.B. and A.R.; writing—review and editing, C.F.B. and A.R. All authors have read and agreed to the published version of the manuscript.
Funding
This research received no external funding.
Institutional Review Board Statement
Not applicable.
Informed Consent Statement
Not applicable.
Data Availability Statement
Not applicable.
Conflicts of Interest
The authors declare no conflict of interest.
References
- Fagerberg, J.; Verspagen, B. Innovation studies—The emerging structure of a new scientific field. Res. Policy 2009, 38, 218–233. [Google Scholar] [CrossRef]
- Fernandes, C.I.; Ferreira, J.J.M.; Raposo, M.L. Drivers to firm innovation and their effects on performance: An international comparison. Int. Entrep. Manag. J. 2013, 9, 557–580. [Google Scholar] [CrossRef]
- Chesbrough, H. Open innovation: A new paradigm for understanding industrial innovation. In Open Innovation: Researching a New Paradigm; Chesbrough, H., Vanhaverbeke, W., West, J., Eds.; Oxford University Press: Oxford, UK, 2006; pp. 1–12. [Google Scholar]
- Bogers, M.; Chesbrough, H.; Moedas, C. Open innovation: Research, practices, and policies. Calif. Manag. Rev. 2018, 60, 133–144. [Google Scholar] [CrossRef]
- Cassiman, B.; Veugelers, R. In Search of Complementarity in Innovation Strategy: Internal R&D and External Knowledge Acquisition. Manag. Sci. 2006, 52, 68–82. [Google Scholar]
- Huizingh, E.K.R.E. Open innovation: State of art and future perspectives. Technovation 2011, 31, 2–9. [Google Scholar] [CrossRef]
- Lichtenthaler, U. Open innovation: Past research, current debates, and future directions. Acad. Manag. Perspect. 2011, 25, 75–93. [Google Scholar]
- Bigliardi, B.; Ferraro, G.; Filippelli, S.; Galati, F. The past, present and future of open innovation. Eur. J. Innov. Manag. 2021, 24, 1130–1161. [Google Scholar] [CrossRef]
- Hossain, M.; Islam, K.M.Z.; Sayeed, M.A.; Kauranen, I. A comprehensive review of open innovation literature. J. Sci. Technol. Policy Manag. 2016, 7, 2–25. [Google Scholar] [CrossRef]
- Obradović, T.; Vlačić, B.; Dabić, M. Open innovation in the manufacturing industry: A review and research agenda. Technovation 2021, 102, 102221. [Google Scholar] [CrossRef]
- West, J.; Bogers, M. Leveraging External Sources of Innovation: A Review of Research on Open Innovation. J. Prod. Innov. Manag. 2014, 31, 814–831. [Google Scholar] [CrossRef]
- Dahlander, L.; Gann, D.M.; Wallin, M.W. How open is innovation? A retrospective and ideas forward. Res. Policy 2021, 50, 104218. [Google Scholar] [CrossRef]
- Cheng, C.C.J.; Huizingh, E.K.R.E. When is Open Innovation Beneficial? The Role of Strategic Orientation. J. Prod. Innov. Manag. 2014, 31, 1235–1253. [Google Scholar] [CrossRef]
- Cui, T.; Ye, H.; Teo, H.H.; Li, J. Information technology and open innovation: A strategic alignment perspective. Inf. Manag. 2015, 52, 348–358. [Google Scholar] [CrossRef]
- Manzini, R.; Lazzarotti, V.; Pellegrini, L. How to remain as closed as possible in the open innovation era: The case of Lindt & Sprüngli. Long Range Plan. 2017, 50, 260–281. [Google Scholar]
- Tranekjer, T.L. Open innovation: Effects from external knowledge sources on abandoned innovation projects. Bus. Process Manag. J. 2017, 23, 918–935. [Google Scholar] [CrossRef][Green Version]
- Dahlander, L.; Gann, D.M. How open is innovation? Res. Policy 2010, 39, 699–709. [Google Scholar] [CrossRef]
- Perkmann, M.; Walsh, K. University-industry relationships and open innovation: Towards a research agenda. Int. J. Manag. Rev. 2007, 9, 259–280. [Google Scholar] [CrossRef]
- Striukova, L.; Rayna, T. University-industry knowledge exchange: An exploratory study of Open Innovation in UK universities. Eur. J. Innov. Manag. 2015, 18, 471–492. [Google Scholar] [CrossRef]
- Ankrah, S.; AL-Tabbaa, O. Universities-industry collaboration: A systematic review. Scand. J. Manag. 2015, 31, 387–408. [Google Scholar] [CrossRef]
- Figueiredo, N.L.; Ferreira, J.J.M. More than meets the partner: A systematic review and agenda for University-Industry cooperation. Manag. Rev. Q. 2022, 72, 231–273. [Google Scholar] [CrossRef]
- Gerbin, A.; Drnovsek, M. Determinants and public policy implications of academic-industry knowledge transfer in life sciences: A review and a conceptual framework. J. Technol. Transf. 2016, 41, 979–1076. [Google Scholar] [CrossRef]
- Vick, T.E.; Robertson, M. A systematic literature review of UK university—Industry collaboration for knowledge transfer: A future research agenda. Sci. Public Policy 2018, 45, 579–590. [Google Scholar] [CrossRef]
- Baban, C.F.; Baban, M.; Rangone, A. Investigating determinants of industry-university collaboration in an open innovation context: Comparative evidence from an exploratory study. Sci. Technol. Soc. 2021, 26, 482–502. [Google Scholar] [CrossRef]
- Lazzarotti, V.; Bengtsson, L.; Manzini, R.; Pellegrini, L.; Rippa, P. Openness and innovation performance: An empirical analysis of openness determinants and performance mediators. Eur. J. Innov. Manag. 2017, 20, 463–492. [Google Scholar] [CrossRef]
- Martovoy, A.; Kutvonen, A.; Mention, A.-L.; Torkkeli, M. Open innovation in banking services:advantages and disadvantages. In Proceedings of the XXIII ISPIM Conference-Action for Innovation: Innovating from Experience, Barcelona, Spain, 17–20 June 2012; pp. 1–21. [Google Scholar]
- Knudsen, M.P.; Mortensen, T.B. Some immediate -but negative- effects of openness on product development performance. Technovation 2011, 31, 54–64. [Google Scholar] [CrossRef]
- Veer, T.; Lorenz, A.; Blind, K.B. How open is too open? The ‘dark side’ of openness along the innovation value chain. In Proceedings of the 35th DRUID Celebration Conference, Barcelona, Spain, 17–19 June 2013; pp. 1–30. [Google Scholar]
- Ullrich, A.; Vladova, G.; Grum, M.; Marquart, D. Does size matter? The effects of enterprise size on the perception of benefits and risks of open innovation projects. Int. J. Innov. Manag. 2018, 6, 71–101. [Google Scholar] [CrossRef]
- Laursen, K.; Salter, A. Open for innovation: The role of openness in explaining innovation performance among UK manufacturing firms. Strateg. Manag. J. 2006, 27, 131–150. [Google Scholar] [CrossRef]
- Le Roy, F.; Robert, M.; Lasch, F. Choosing the best partner for product innovation. Int. Stud. Manag. Organ. 2016, 46, 136–158. [Google Scholar] [CrossRef]
- Galan-Muros, V.; Davey, T. The UBC ecosystem: Putting together a comprehensive framework for university-business cooperation. J. Technol. Transf. 2019, 44, 1311–1346. [Google Scholar] [CrossRef]
- Awasthy, R.; Flint, S.; Sankarnarayana, R.; Jones, R.L. A framework to improve university-industry collaboration. J. Ind.-Univ. Collab. 2020, 2, 49–62. [Google Scholar] [CrossRef]
- Rajalo, S.; Vadi, M. University-industry innovation collaboration: Reconceptualization. Technovation 2017, 62–63, 42–54. [Google Scholar] [CrossRef]
- Ankrah, S.N.; Burgess, T.F.; Grimshaw, P.; Shaw, N.E. Asking both university and industry actors about their engagement in knowledge transfer: What single-group studies of motives omit. Technovation 2013, 33, 50–65. [Google Scholar] [CrossRef]
- Barnes, T.; Pashby, I.; Gibbons, A. Effective university-industry interaction: A multi-case evaluation of collaborative R&D projects. Eur. Manag. J. 2002, 20, 272–285. [Google Scholar]
- Geisler, E. Industry-university technology cooperation: A theory of inter-organizational relationships. Technol. Anal. Strat. Manag. 1995, 7, 217–229. [Google Scholar] [CrossRef]
- Montoro-Sanchez, A.; Mora Valentin, E.M.; Guerras-Martin, L.A. R&D cooperative agreements between firms and research organisations: A comparative analysis of the characteristics and reasons depending on the nature of the partner. Int. J. Technol. Manag. 2006, 35, 156–181. [Google Scholar]
- Lee, Y.S. The sustainability of university-industry research collaboration: An empirical assessment. J. Technol. Transf. 2000, 25, 111–133. [Google Scholar] [CrossRef]
- Muscio, A.; Vallanti, G. Perceived obstacles to university-industry collaboration: Results from a qualitative survey of Italian academic departments. Ind. Innov. 2014, 21, 410–429. [Google Scholar] [CrossRef]
- Bertello, A.; Ferraris, A.; De Bernardi, P.; Bertoldi, B. Challenges to open innovation in traditional SMEs: An analysis of pre-competitive projects in university-industry-government collaboration. Int. Entrep. Manag. J. 2022, 18, 89–104. [Google Scholar] [CrossRef]
- Bigliardi, B.; Galati, F. Which factors hinder the adoption of open innovation in SMEs? Anal. Strat. Manag. 2016, 28, 869–885. [Google Scholar] [CrossRef]
- Bruneel, J.; D’Este, P.; Salter, A. Investigating the factors that diminish the barriers to university-industry collaboration. Res. Policy 2010, 39, 858–868. [Google Scholar] [CrossRef]
- Azagra-Caro, J.M.; Barberá-Tomás, D.; Edwards-Schachter, M.; Tur, E.M. Dynamic interactions between university-industry knowledge transfer channels: A case study of the most highly cited academic patent. Res. Policy 2017, 46, 463–474. [Google Scholar] [CrossRef]
- Arvanitis, S.; Woerter, M. Firms’ transfer strategies with universities and the relationship with firms’ innovation performance. Ind. Corp. Chang. 2009, 18, 1067–1106. [Google Scholar] [CrossRef]
- De Wit-de Vries, E.; Dolfsma, W.A.; van der Windt, H.J.; Gerkema, M.P. Knowledge transfer in university-industry research partnerships: A review. J. Technol. Transf. 2019, 44, 1236–1255. [Google Scholar] [CrossRef]
- Fabiano, G.; Marcellusi, A.; Favato, G. Channels and processes of knowledge transfer: How does knowledge move between university and industry? Sci. Public Policy 2020, 47, 256–270. [Google Scholar] [CrossRef]
- Lima, J.C.F.; Torkomian, A.L.V.; Pereira, S.C.F.; Oprime, P.C.; Hashiba, L.H. Socioeconomic impacts of university-industry collaborations-a systematic review and conceptual model. J. Open Innov. Technol. Mark. Complex. 2021, 7, 137. [Google Scholar] [CrossRef]
- Santoro, M.D. Success breeds success: The linkage between relationship intensity and tangible outcomes in industry-university collaborative ventures. J. High Technol. Manag. Res. 2000, 11, 255–273. [Google Scholar] [CrossRef]
- Alexander, A.T.; Childe, S.J. Innovation: A knowledge transfer perspective. Prod. Plan. Control 2013, 24, 208–225. [Google Scholar] [CrossRef]
- Baban, C.F.; Baban, M. Main dimensions of open innovation between industry and university: An exploratory approach in a Romanian environment. In Proceedings of the ICERI 2018 Conference, Seville, Spain, 12–14 November 2018; pp. 9726–9734. [Google Scholar]
- Chin, W.W. How to write up and report PLS analyses. In Handbook of Partial Least Squares; Vinzi, E.V., Chin, W., Henseler, J., Wang, H., Eds.; Springer: Berlin/Heidelberg, Germany, 2010; pp. 655–690. [Google Scholar]
- Hair, J.F.; Risher, J.J.; Sarstedt, M.; Ringle, C.M. When to use and how to report the results of PLS-SEM. Eur. Bus. Rev. 2019, 31, 2–24. [Google Scholar] [CrossRef]
- Henseler, J.; Ringle, C.M.; Sinkovics, R.R. The use of partial least squares path modeling in international marketing. In New Challenges to International Marketing; Sinkovics, R.R., Ghauri, P.N., Eds.; Emerald Group Publishing Limited: Bingley, UK, 2009; pp. 277–319. [Google Scholar]
- Sarstedt, M.; Ringle, C.M.; Smith, D.; Reams, R.; Hair, J.F. Partial least squares structural equation modeling (PLS-SEM): A useful tool for family business researchers. J. Fam. Bus. Strategy 2014, 5, 105–115. [Google Scholar] [CrossRef]
- Hair, J.; Hult, T.; Ringle, C.; Sarstedt, M. A Primer on Partial Least Squares Structural Equation Modeling (PLS-SEM); Sage Publications: Thousand Oaks, CA, USA, 2014. [Google Scholar]
- Makarius, E.E.; Mukherjee, D.; Fox, J.D.; Fox, A.K. Rising with the machines: A sociotechnical framework for bringing artificial intelligence into the organization. J. Bus. Res. 2020, 20, 262–273. [Google Scholar] [CrossRef]
- Jang, J.-S.R.; Sun, C.T.; Mizutani, E. Neuro-Fuzzy and Soft Computing: A Computational Approach to Learning and Machine Intelligence; Prentice-Hall: Upper Saddle River, NJ, USA, 1997. [Google Scholar]
- Chan, F.T.S.; Chong, A.Y.L. A SEM-neural network approach for understanding determinants of interorganizational system standard adoption and performances. Decis. Support Syst. 2012, 54, 621–630. [Google Scholar] [CrossRef]
- Chien, S.-C.; Wang, T.-Y.; Lin, S.-L. Application of neuro-fuzzy networks to forecast innovation performance—The example of Taiwanese manufacturing industry. Expert Syst. Appl. 2010, 37, 1086–1095. [Google Scholar] [CrossRef]
- Ho, Y.-C.; Tsai, C.-T. Comparing ANFIS and SEM in linear and nonlinear forecasting of new product development performance. Expert Syst. Appl. 2011, 38, 6498–6507. [Google Scholar] [CrossRef]
- Ringle, C.M.; Wende, S.; Becker, J.-M. SmartPLS 3; SmartPLS GmbH: Boenningstedt, Germany, 2015. [Google Scholar]
- Becker, J.M.; Klein, K.; Wetzels, M. Hierarchical latent variable models in PLS-SEM: Guidelines for using reflective-formative type models. Long Range Plan. 2012, 45, 359–394. [Google Scholar] [CrossRef]
- Sarstedt, M.; Hair, J.F., Jr.; Cheah, J.-H.; Becker, J.-M.; Ringle, C.M. How to specify, estimate, and validate higher-order constructs in PLS-SEM. Australas. Mark. J. 2019, 27, 197–211. [Google Scholar] [CrossRef]
- Hair, J.; Anderson, R.; Tatham, R.; Black, W. Multivariate Data Analysis, 7th ed.; Pearson Education: New York, NY, USA, 2009. [Google Scholar]
- Ringle, C.M.; Sarstedt, M. Gain more insight from your PLS-SEM results: The importance-performance map analysis. Ind. Manag. Data Syst. 2016, 116, 1865–1886. [Google Scholar] [CrossRef]
- Berghman, L.; Matthyssens, P.; Streukens, S.; Vandenbempt, K. Deliberate learning mechanisms for stimulating strategic innovation capacity. Long Range Plan. 2013, 46, 39–71. [Google Scholar] [CrossRef]
- Matzler, K.; Bailom, F.; Hinterhuber, H.H.; Renzl, B.; Pichler, J. The asymmetric relationship between attribute-level performance and overall customer satisfaction: A reconsideration of the importance-performance analysis. Ind. Mark. Manag. 2004, 33, 271–277. [Google Scholar] [CrossRef]
- Svozil, D.; Kvasnicka, V.; Pospichal, J. Introduction to multi-layer feed-forward neural networks. Chemom. Intell. Lab. Syst. 1997, 39, 43–62. [Google Scholar] [CrossRef]
- IBM. SPSS Modeler 18 Algorithms Guide. Available online: http://public.dhe.ibm.com/software/analytics/spss/documentation/modeler/18.0/en/AlgorithmsGuide.pdf (accessed on 1 November 2020).
- Wendler, T.; Gröttrup, S. Data Mining with SPSS Modeler; Springer International Publishing: Cham, Switzerland, 2016. [Google Scholar]
- Kar, S.; Das, S.; Ghosh, P.K. Applications of neuro fuzzy systems: A brief review and future outline. Appl. Soft Comput. 2014, 15, 243–259. [Google Scholar] [CrossRef]
- Alotaibi, F.D.; Abdennour, A.; Ali, A.A. A robust prediction model using ANFIS based on recent TETRA outdoor RF measurements conducted in Riyadh city-Saudi Arabia. Int. J. Electron. Commun. 2008, 62, 674–682. [Google Scholar] [CrossRef]
- Albahri, A.S.; Alnoor, A.; Zaidan, A.A.; Albahri, O.S.; Hameed, H.; Zaidan, B.B.; Peh, S.S.; Zain, A.B.; Siraj, S.B.; Masnan, A.; et al. Hybrid artificial neural network and structural equation modelling techniques: A survey. Complex. Intell. Syst. 2021, 1–21. [Google Scholar] [CrossRef] [PubMed]
- Lee, V.H.; Foo, A.T.L.; Leong, L.Y.; Ooi, K.B. Can competitive advantage be achieved through knowledge management? A case study on SMEs. Expert Syst. Appl. 2016, 65, 136–151. [Google Scholar] [CrossRef]
- Mascarenhas, C.; Ferreira, J.J.; Marques, C. University-industry cooperation: A systematic literature review and research agenda. Sci. Public Policy 2018, 45, 708–718. [Google Scholar] [CrossRef]


Publisher’s Note: MDPI stays neutral with regard to jurisdictional claims in published maps and institutional affiliations. |
© 2022 by the authors. Licensee MDPI, Basel, Switzerland. This article is an open access article distributed under the terms and conditions of the Creative Commons Attribution (CC BY) license (https://creativecommons.org/licenses/by/4.0/).