1. Introduction
Social scientists have paid little attention to the variation of intermarriage across local marriage markets. Data constraints may explain the lack of spatial awareness in intermarriage research. Datasets seldom provide the geographical detail and sample density required for in-depth spatial analyses. Thus, researchers feel constrained to assume collapsibility of the marriage market (i.e., one country, one marriage market) at the risk of under- or over-estimating the social distance between groups based on national levels of intermarriage [
1]. The collapsibility bias primarily arises from two well-established facts. First, most individuals find their future spouses/partners in the places where they live, work, study, relax and conduct their main activities [
2]. Second, demographic, ethnic and racial compositions vary from place to place [
3,
4]. Not all individuals are exposed to the same opportunities.
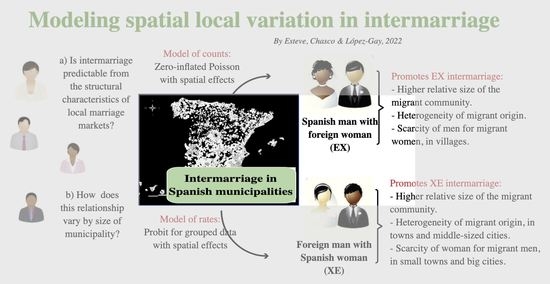
In this paper, we move beyond the collapsibility assumption to investigate the relationship between intermarriage and space. We develop spatial models to predict the absolute and relative number of intermarried couples as a function of the structural characteristics of local marriage markets. Our models combine several features not commonly found in previous research. First, we neither assume collapsibility of the marriage market nor define standardized geographic areas based on an equal number of inhabitants or any other equalizing criteria (e.g., same area). Instead, we utilize spatial analysis techniques to incorporate the characteristics of area (i.e., municipalities in Spain) and the corresponding neighboring areas as determinants of intermarriage. Second, we construct a set of structural variables to portray marriage markets at the local scale in terms of the relative size of the migrant community, homogeneity of migrant origins, and sex imbalances in migrant and native groups. Third, we examine intermarriage variations by size of place, from small towns to large cities.
This paper addresses two main questions: (a) Is intermarriage predictable from the structural characteristics of local marriage markets? (b) How is intermarriage related to relative group size, homogeneity of migrant origin, and sex ratios, and how does this relationship vary by size of place?
Our models are applied to intermarriage between foreign-national women (migrant women) and Spanish men and intermarriage between foreign-national men (migrant men) and Spanish women. By foreign nationals, we are referring to men and women who do not have Spanish citizenship. We model the absolute number and relative frequency of intermarried couples in Spain from 2005 to 2007 in all its 8111 municipalities. For this purpose, we use full counts of marriage micro-data from the Spanish Vital Registration System from 2005–2007. This period is particularly relevant for the study of intermarriage in Spain, since it falls at the end of the first major stage of international migration in the country, which started by the second half of the 1990s. To predict the absolute number of intermarried couples, we use a zero-inflated Poisson model with spatially lagged independent variables. For the relative frequency (intermarriage rate), we use a probit model for grouped data with spatially lagged independent variables. Both models include the same explanatory variables but differ in the way the endogenous variable has been defined.
2. Background and Hypotheses
Conceptually, patterns of assortative mating result from the interplay among three forces: individual preferences, third-party influences (i.e., church, state, and family), and the structural context of opportunities [
5,
6]. Most individuals in modern society are assumed to have the freedom to choose their partners because third parties have lost most of their historical influence on partner choice [
7,
8]. However, for some ethnic groups, this may not be the case (e.g., migrants coming from countries with different religions). In the context of individual choice, assortative mating becomes a matter of individual preferences and structural opportunities. Researchers have developed various alternatives to control for opportunities, but they seldom formulate hypotheses regarding its direct influence on assortative mating (some exceptions are [
9,
10,
11], or, more recently, refs. [
12,
13]). This paper examines the effect of structural constraints on intermarriage. We develop a local model of intermarriage that combines three characteristics. First, the model avoids collapsibility of the marriage market by defining marriage markets from a local perspective but considers the influence of neighboring areas. Second, the model includes structural variables constructed from the entire population and not exclusively from the population in union. Third, the model allows for variations on intermarriage by size of place.
Following [
1], collapsibility refers to the assumption that marriage markets are collapsible; the odds of intermarriage on the local scale mirror the national scale. Collapsibility implies that the availability of a uniform pool of candidates in one’s place of residence and in the distance to one’s place of residence (work, study, or leisure) are not relevant dimensions in the marital search process. Neither of these two suppositions applies to the real world. First, the distribution of migrant, ethnic, racial or other groups across marriage markets is far from uniform [
3,
14,
15]. Second, people tend to choose spatially homogamous partners [
5,
16,
17,
18,
19]. As a result, people are exposed to different opportunities. In this regard, in [
1], it is demonstrated that the odds of intermarriage between blacks and whites were underestimated when assuming the collapsibility of the marriage market. Following this idea, our model defines marriage markets at the local scale for both the dependent (i.e., intermarried couples) and the independent variables (i.e., local characteristics of the marriage market). However, our model also considers the influence of neighboring areas by including spatially lagged independent variables.
A common practice in intermarriage research is to control for the structural constraints of the marriage market. Typically, these constraints are constructed only from the population in union (e.g., [
20,
21,
22]). For example, intermarriage research widely utilizes log-linear models. These models adjust the observed marriage patterns for differences in group size by controlling for the marginal distributions of a contingency table that classifies couples by the husband’s and wife’s characteristics. Consequently, the characteristics of the marriage market are exclusively inferred from the married population, overlooking the non-married population.
On the contrary, the structural variables used in our model are based on the entire population, similar to [
9]. We borrow two indicators from this research: group relative size and heterogeneity origins. Relative size refers to the share of the minority group in each community. In our case, the minority group refers to the migrant population, which is the population born abroad. Heterogeneity refers to the diversity of origins in the migrant community. We expect a positive relationship between the relative size of the migrant community and intermarriage with the native population. Intermarriage in absolute and relative terms will increase as the size of the migrant community increases: more migrants means more opportunities to intermarry. From a migrant’s point of view, the opposite may hold: a migrant’s propensity to marry out of his or her group may decrease as the size of the migrant community increases. However, our models do not predict a migrant’s probability to marry out of his or her group but the occurrence of intermarriage in each municipality.
Regarding heterogeneity in migrant origins, intermarriage will be in lower immigrant communities that are very homogeneous. The classical assumption is that homogenous communities will encourage endogamous marriages, assuming there are no major imbalances in the number of men and women of the same origin.
The demographic literature on the marriage squeeze has shown that societal sex imbalances can promote intermarriage with other groups [
23,
24,
25,
26,
27]. First generation migrant communities historically present skewed sex distributions because of male- or female-dominated flows of migration. However, skewed sex ratios are not exclusive in-migrant groups; they are also common in specific areas among natives. In rural areas with female out-migration, males outnumber females [
28,
29]. We expect that skewed sex ratios among migrants and natives will promote intermarriage between them.
Finally, a less investigated feature of marriage markets concerns the importance of size of place. We argue that intermarriage varies by size of place and that the relationship between intermarriage and the structural constraints of the local marriage market will also differ. We assume that residential segregation is lower in small towns than in large cities that provide more opportunity for group interaction. Thus, we expect that the relationship between the size of the migrant community and intermarriage will be stronger in small municipalities than in larger ones. In general, the model we present (i) incorporates the local dimension of marriage markets (i.e., does not assume collapsibility), (ii) examines the association between intermarriage and the structural constrains of the marriage market on the local scale, and (iii) investigates if intermarriage varies by size of place.
3. International Migration and Intermarriage in Spain
Our models are based on intermarriage between Spanish men and women and foreign-national women and men, respectively. Spain is considered a new country of immigration [
30,
31,
32]. Between 1998 and 2008, the foreign-born population in Spain grew from 0.6 to 5.2 million international migrants coming from many countries but mainly from Latin American countries (e.g., Ecuador, Colombia, Bolivia, Argentina, Peru), Africa (Morocco), and Eastern Europe (Romania). As a result, the total population of Spain grew from 39.9 to 46.2 million during the same period. After 2008, the economic recession slowed the number of international arrivals. In fact, the migratory balance was negative between 2010 and 2015, which was also driven by the sharp increase in return migration and migration to other countries of the foreign population [
33]. The demographic impact of international migration is not limited to variations in the total population. International migrants are a source of other demographic impacts mainly on fertility and nuptial dynamics. Migrant women have contributed to the rise of fertility rates in Spain and to the increase in the number of births in recent years [
34,
35]. Foreign-born mothers constituted approximately 20% of the total number of children born in Spain from 2005–2013. Regarding nuptiality, international migration has had a notorious impact on marriage dynamics in Spain [
36]. According to the 2011 census, there were 0.5 million mixed couples in Spain of whom 66% were married and 34% were cohabiting.
The Spanish vital registration system has registered more than 300,000 marriages between Spanish citizens and foreign nationals since 2000. In this year, mixed marriages between Spanish nationals and foreign-born nationals represented 6.8% of all marriages. In 2013, the intermarriage rate had reached 14.6%. Several articles have documented patterns and trends of mixed marriages in Spain on the basis of marriage registration statistics [
36,
37], which only include marriages in Spain. This aspect is a limitation on the study of marriage patterns from the migrant perspective because it does not capture marriages abroad or cohabiting couples. However, with regard to intermarriage, Esteve and Bueno have shown that the vast majority of mixed marriages between Spanish citizens and foreign nationals are registered in the Spanish civil registration system [
38]. Data from these registers show that Spanish men intermarry more than Spanish women. From 1998 to 2012, Spanish men married mostly women from Latin America and Eastern Europe. Spanish women married men from Western and Southern Europe and Latin America. This pattern has been changing in recent years because the number of Spanish women marrying Moroccans has increased. This fact reflects second-generation Moroccans (born in Spain with Spanish citizenship) marrying Moroccan citizens [
36] and shows that the country of citizenship is not necessarily the best indicator of ethnicity.
From the migrant perspective, several studies based on census and survey data have noted that some migrant groups are more likely than others to intermarry with Spaniards. In general, African and Asian migrants are the least likely to marry Spanish nationals [
39,
40,
41,
42]. In contrast, European and Latin Americans are the most likely to marry Spanish nationals. Most of these studies have been conducted at a national level. In general, there is a lack of knowledge concerning how intermarriage in Spain varies across regions and the role played by the structural characteristics of local marriage markets. In
Figure 1, we show the distribution of intermarried couples by municipality who married in Spain from 2005–2007. We distinguish between intermarriage between Spanish men and migrant women (
Figure 1a) and between Spanish women and migrant men (
Figure 1b). As we explain in the coming section, these data come from the Spanish vital registration systems and basically reflect the distribution of our dependent variable, that is, the number of intermarriages by municipality. Generally, the municipality distribution of intermarried couples reflects the spatial distribution of the Spanish population, with Madrid, in the center, and Barcelona, on the northeast coast, registering the largest number of intermarried couples from 2005 to 2007. The main goal of this article is to model the spatial distribution of intermarriage considering the local characteristics of the marriage market regarding size of the population, heterogeneity of migrant origins and the sex ratios in the migrant and native communities.
4. Data and Variables
4.1. Marriage and Population Register Data
We utilized all marriage records from the MNP (Spanish vital registration statistics). The analysis is based on 42,972 heterosexual marriages between foreign-national women and Spanish men and 26,310 marriages between foreign-national men and Spanish women that occurred in Spain from 2005–2007. By foreign nationals, we are referring to men and women who do not have Spanish citizenship. We pooled the data for these three years to increase the sample size. Marriages are geo-referenced at the municipality of residence. It must be said that the public use files of marriage microdata are yearly available from the INE (Spanish National Statistical Institute)’s website only for the capital cities and municipalities with more than 50,000 inhabitants (2% of the total number of municipalities in Spain, where 53% of the residents live). The present study has been possible due to a special request we made to the INE to obtain all marriage microdata at the municipality level, which was provided for a past period.
In 2007, Spain was divided into 8111 municipalities, which are the smallest geo-political unit, though the final sample used in the models was reduced to 8079 municipalities due to data availability problems. During the observed period, 3326 municipalities registered at least one marriage between a migrant woman and a Spanish man, and 2120 municipalities registered at least one marriage between a Spanish woman and a migrant man. This means that for the vast majority of municipalities, there were no intermarriages registered during this period and, therefore, our absolute and relative measures of intermarriage will be zero.
Although one advantage of official marriage data is the inclusion of all marriages contracted in Spain, the marriages contracted and registered in the MNP system are not representative of the unions that migrants form after migration. Our data do not include the unions of migrants who returned to their countries to marry or migrants who cohabit. As we do not know more details about the partners (e.g., socioeconomic variables), we are not able to examine the status exchange hypothesis, nor to measure the relevance of the citizenship acquisition for certain groups, as has been observed in other countries [
43]. The data only include unions of migrants who married in Spain. Although these data may not be representative of the unions that migrants form after migration, previous research has shown that the vast majority of unions between migrants and natives are registered in the Spanish marriage registration system. Migrants and natives are more likely to marry than cohabit, and they are more likely to marry in Spain than abroad (see [
38,
44]).
We utilize all population counts at the municipal level from the “Padrón” (Population Register) to construct the dependent and independent model variables (relative group size, homogeneity of national origins, male/female availability for migrant women/men, and the sex ratio among natives). The “Padrón” offers annual counts of the population registered in each municipality by age, sex, country of birth and country of citizenship.
4.2. Construction of Variables
Table 1 provides a detailed description of the dependent and independent variables included in the model and describes the statistical sources from which these variables were created.
4.2.1. The Dependent Variables
We use the following two measures of intermarriage as a dependent variable: the absolute number of intermarried couples (intermarriage) and the percentage of marriages between a Spanish national and a foreign national (intermarriage rate).
Intermarriage is the number (counts) of marriages in each municipality between Spanish citizens and foreign-national individuals in Spain from 2005–2007. We distinguish two types of intermarriage based on the sex of the spouses: Spanish men marrying foreign-national women and Spanish women marrying foreign-national men.
Intermarriage rate refers to the percentage of marriages between Spanish men/women and foreign-national women/men of the total number of marriages contracted in each municipality from 2005 to 2007.
4.2.2. Independent Variables
The model includes the following four independent or exogenous variables: (1) the relative size of the migrant population (i.e., foreign nationals); (2) the homogeneity of national origins among the migrant population; (3) the scarcity of migrant men/women for the migrant women/men population; and (4) the sex ratio among natives. All variables were computed at the municipality level with data from the “Padrón”.
The relative size of the migrant community corresponds to the proportion of the foreign-national population in each municipality. We expect this variable to be positively related to intermarriage.
The homogeneity of national origins among the migrant population equals the summation of the squared proportion of each origin. This variable equals 1 when all foreign nationals hold the same nationality and tends to 0 as the number of origins increase. We expect this variable to be negatively related to intermarriage.
The scarcity of migrant men/women for migrant women/men is equal to the proportion of foreign-national women/men that do not have an opposite sex counterpart of the same national origin. This indicator expresses in relative terms the scarcity of men/women of each national origin. For example, a value of scarcity of 1 indicates that each foreign-national men/woman does not have a female/male counterpart of the same origin. A value of 0.6 indicates that for 60% of foreign-national men/women, there is no female/male counterpart, indicating that a man of the same origin exists for only 40% of these men/women. We expect that the scarcity of men/women of the same national origin will be directly related to the intermarriage rate.
The sex ratio among natives is the log transformation of the ratio between the number of Spanish men aged 15–64 and the number of Spanish women aged 15–64 for each municipality. We expect that the sex ratio will be directly related to the intermarriage rate.
4.2.3. Spatially Lagged Variables
The structural variables described above were constructed at the municipality level. Neighboring areas may exert an additional influence on local intermarriage. To capture the existence of spatial dependence in intermarriage, we constructed the spatial lags of the independent variables. Spatial dependence reflects a situation where values observed in one location or region depend on the values of neighboring observations in nearby locations. A variable spatial lag is a variable vector constructed with a (weighted) average of values from neighboring municipalities or regions. This calculation places elements
wij in the
n ×
n spatial weight matrix
W, for
n the number of municipalities, such that
results in a scalar representing a linear combination of values obtained by neighboring observations [
45]. In this paper, the spatial weight matrix utilizes an inverse distance function for a 170 km distance band, such that each element (
wij) is equal to
for each pair of municipalities
i,
j located at a distance
km and zero otherwise (see [
46] for further information). We utilize 170 km as the minimum distance at which every municipality has at least one neighbor.
We have built the spatial lags of the four independent variables: relative group size, homogeneity of national origin, scarcity of men/women for migrant women/men and sex ratio among natives.
4.2.4. Size of Municipality
The municipalities were classified in nine groups based on the number of inhabitants. We utilized the classification provided by the Spanish National Statistical Institute to present the results. The classification ranges from less than 250 inhabitants to more than 100,000 (
Table 2). Size of place was not included as an independent variable in the model. Instead, we specified a spatial regimes model in which we estimate a different model for each of the municipal groups to test whether the level of intermarriage and the impact of structural variables vary by size of municipality.
5. Model Specifications
Building a robust model to predict spatial variation of intermarriage at the local level is a complex task. In this section, we document the process of model specification and testing.
5.1. Zero Inflated Poisson (ZIP) with Spatial Effects
The first model estimates the absolute number of local intermarried couples as a Zero-Inflated Poisson (ZIP) model, which allows control for the excess of zero counts corresponding to the municipalities without mixed marriages [
47]. Because local intermarriages are both counts and rare events, a Poisson distribution is the best option. The excess zeros are supposed to be generated by a separate process from the count values and they must be modeled independently. Thus, the ZIP model must estimate two models, a Poisson count model and the logit model for predicting excess zeros. It has the following three parts:
- ●
A Probability Mass Function (PMF), , which is used to calculate the probability of observing a zero count.
- ●
A PMF, , which is used to calculate the probability of observing k events, given that .
- ●
A link function used to express the mean rate, , as a function of p regression variables X.
Hence, the PMF of the ZIP regression model can be specified as a mixture model of the following two component distributions:
where the counts
, for
observations, equals zero with probability
and follow a Poisson distribution with mean
and probability
. Hence,
is the proportion of excess zeros for the
ith observation (e.g., a Spanish municipality), and
, for
the value of one of the
p explanatory variables of the regression model for the
ith observation and
the vector of the regression coefficients. The second part of Equation (1),
, corresponds with the standard Poisson regression model for
the random dependent variable that denotes the observed count of the
ith observation.
Note that ZIP models assume that an
ith observation is 0 with a probability
or is a realization of a Poisson random variable, which can also be 0, with a probability (
. That is, zero observations arise from both the zero-component distribution,
, and the Poisson distribution,
. The zero-component distribution is related to model the ‘excess’ or ‘inflated’ zeros that are observed in addition to the zeros that are expected to be observed under the assumed Poisson distribution [
48]. When the data set does not have any excess zeros in the dependent variable, the value of
and the PMF of the ZIP model reduces to the PMF of the standard Poisson model [
49].
The way of estimating the proportion of excess zeros,
, is by estimating them through a logistic function of
p regression variables
X, as follows:
where
y’ is a binary 0/1 random variable which adopts the value 0 if the underlying dependent variable of counts,
y, is 0, and 1 in all the other cases; and
is a vector of parameters. The estimation of this logistic model yields a vector of
n fitted probabilities,
, which is simply set to
(
). Once estimated, we set vector
into the probability functions of the ZIP model presented in Equation (1) and estimate it by Maximum Likelihood (ML).
Hence, in a ZIP model,
and
can be explicitly expressed as a function of explanatory variables
X, as follows:
As in [
50], we suppose the existence of a potential impact of social interactions—in the form of local spatial spillovers—on the probability of a municipality of having mixed marriages. This spatial version of ZIP model takes the form of a cross-sectional spatially lagged SLX model [
51,
52,
53]. It is an augmented model which incorporates the spatial lags of the explanatory variables in the expressions of Equation (3) as follows:
Additionally, we also test for the existence of spatial instability in the form of nine municipality groups based on size of place to find out whether the level of intermarriage and the impact of structural variables vary by municipality size, such as in [
54]. It is a so-called spatial regimes regression model. Hence, the specification of Equation (4) is as follows:
where
g represents the different municipality groups.
5.2. Probit Model for Grouped Data with Spatial Effects
The second model estimates local intermarriage rates between migrant women and Spanish men and between migrant men and Spanish women as a probit model of grouped data [
55] because the dependent variable consists of a number of observed proportions or relative frequencies of sets of individuals who share similar characteristics (e.g., living in the same municipality). In this case, the dependent variable consists of the
n number of observed proportions (
) of mixed marriages over the total number of marriages contracted in each municipality. We disregard other possible specifications such as Tobit regression [
56] or beta regression models [
57] because they suppose that the dependent variable is either continuous (though censored by the modeler for somewhat reasons) or bounded between 0 and 1, excluding extreme values, respectively.
These observed proportions can be considered as the realization of an indirect utility function:
where
is the theoretical or population proportion of the
ith observation,
is a vector gathering a set of
k variables which explains the intermarriage decision and
β contains a set of parameters.
One of the functional forms most frequently used in application for the
F function is the probit model, which by means of the Slutsky’s theorem on convergence in probability, can be linearized. The Cumulative Distribution Function (CDF) of the standard normal distribution is expressed as
. Since the CDF is strictly monotonic, it is an inverse form,
, which by means of a Taylor series approximation leads to the probit model for grouped data or ‘gprobit’ model [
58]:
where
is a well-behaved error term normally distributed with zero mean but heteroskedastic variance, which is given by the following expression:
where
is the Probability Distribution Function (PDF) of the standard normal distribution. We can use a two-step estimator to obtain the Weighted Least Squares (WLS), which will be applied to the observations with weights proportional to
[
59,
60].
Since the gprobit model shown in Equation (7) is a linear model, it is possible to specify local spatial spillovers, in the form of spatial lagged explanatory variables, and spatial regimes, for the municipality groups, leading to the following augmented gprobit model:
6. Results
6.1. Modeling the Number of Intermarriages
Table 3 shows the Maximum Likelihood (ML) estimations of the ZIP model for both marriages between Spanish men and migrant women (first panel) and between Spanish women and migrant men (second panel). Model estimations and testing were computed with the software STATA, version 15. These results can be replicated using the database and coding available from [
61].
In the second column of
Table 3, this model does not differentiate between size of place, i.e., all municipalities regardless of size are pooled in the same regression. Intermarriage counts are predicted based on the four independent variables and their corresponding spatial lags to control for spatial autocorrelation effects (all computations and tests, such as spatial autocorrelation Moran’s
I and Spatial Chow–Wald tests, are available from the authors upon request).
From columns three to eleven, the ZIP model tests the existence of spatial instability in the form of nine municipality groups based on size of place and indicates whether the level of intermarriage and the impact of structural variables vary by municipality size. For both types of mixed marriages,
Table 3 results show heterogeneity in the coefficients across the municipality groups. Furthermore, some of the spatially lagged variables are highly significant for certain groups. Both results demonstrate the bias of the general estimation (in column 2) as well as the need to control for spatial dependence. To assess the goodness of fit of each model, we computed the Pseudo
R2 with and without the spatially lagged variables. The inclusion of the spatially lagged variables enhances the explanatory capacity of all models, though the improvement is better in the larger municipalities. These results suggest that the influence of the characteristics of neighboring municipalities on intermarriage is higher in larger municipalities than in smaller ones.
Regarding the coefficients and how many of them are statistically significant, the relative size of the migrant community turns out to be the most important factor. The relative size of the migrant community, when significant, is positively related to the number of intermarried couples. All coefficients but four are significant, at least, at the 10% level. Municipalities with larger migrant communities have more intermarriage than those with smaller communities.
The impact of migrant origin homogeneity is lower than the group’s relative size and becomes significant in seven of the nine municipality groups for intermarriage between Spanish men and migrant women and in three of the nine municipality types for Spanish women and migrant men. Consistent with our expectations, the homogeneity of migrant origin, when significant, is inversely related to intermarriage. This result shows that there is less intermarriage in municipalities whose migrant communities are more homogeneous in terms of national origins.
Contrary to the previous two variables, the impact of sex ratios among both migrants and natives on intermarriage is less consistent. The sex ratio coefficients are neither uniform across sizes of municipalities nor between the two types of intermarriage. We expected that skewed sex ratios would result in more intermarriage. This expectation is true in the groups of large cities and also in the municipalities with less than 1000 inhabitants where migrant communities are female-dominated. In these municipalities, the scarcity of migrant men for migrant women is related to more intermarriage.
Regarding intermarriage between Spanish women and migrant men, the scarcity of migrant women for migrant men has mainly a negative effect on intermarriage, suggesting that in municipalities with male-dominated migrant communities, Spanish women are less likely to intermarry than in municipalities with more balanced migrant communities. The explanation of this paradox may be in the origin of the migrants of the male-dominated communities. As previous research has shown on a national scale, some migrants are more likely to intermarry than others. For example, Moroccans are the least likely to marry Spanish women with no Moroccan ancestry though Moroccan migrant communities in Spain are traditionally male-dominated.
The sex ratio among natives has not shown the expected impact. Sex ratios among natives were expected to increase intermarriage showing the spatially lagged variable the expected positive relationship. The excess of males in neighboring areas increases intermarriage between Spanish males and migrant women in a determined municipality. In the case of Spanish women marrying migrant men, sex ratios among natives, when statistically significant, reduce intermarriage, meaning that in municipalities where native women are scarce, less Spanish women intermarry.
6.2. Modeling the Intermarriage Rate
Table 4 shows the Weighted Least Squares estimations of the gprobit model for both intermarriage rates between Spanish men and foreign women (first panel) and between Spanish women and foreign men (second panel). Model estimations and testing were computed with the software STATA, version 15. These results can be replicated using the database and coding available from [
61]. In the second column of
Table 4, this model does not differentiate among size of place, i.e., all municipalities regardless of size are pooled in the same regression. Intermarriage rates are predicted based on the four independent variables and their corresponding spatial lags to control for spatial autocorrelation effects. From columns three to eleven, the gprobit model tests the existence of spatial instability in the form of nine municipality groups based on size of place and indicates whether intermarriage rates and the impact of structural variables vary by municipality size.
Table 4 results for both types of mixed marriages show heterogeneity in the coefficients across the municipality groups. Furthermore, several spatially lagged variables are highly significant for certain groups. Both results demonstrate the bias of the general estimation (in column 2) and the need to control for spatial dependence. We also report the
R2 with and without the spatially lagged variables.
Overall, modeling the intermarriage rate yields more statistically significant parameters, and they are more consistent with our initial hypotheses. Although the R2 values are somewhat lower than the pseudo-R2 values of the ZIP models, they are not straightforwardly comparable: while the pseudo R2 is computed as the correlation coefficient between the real and estimated dependent variables, the R2. is the determination coefficient of an Ordinary Least Squares (OLS) estimation. The relative size of the migrant community in the municipality is the explanatory variable with the highest number of statistically significant coefficients and is the most influential to intermarriage. The relationship between relative size of the migrant community and the intermarriage rate is positive for all sizes.
The homogeneity of migrant origin is statistically significant in only three sizes of municipalities for intermarriage between Spanish men and migrant women and also for intermarriage between Spanish women and migrant men. Inconsistent with our expectations, the homogeneity of migrant origin, when significant, is positively related to intermarriage between migrant men and Spanish women, which occurs in rural municipalities with less than 1000 inhabitants. This result shows that there is more intermarriage of this type in villages whose migrant communities are more homogeneous in terms of national origins.
The scarcity of migrant men for migrant women of the same origin is positively related to the share of intermarriage between Spanish men and migrant women in municipalities of sizes from 5000 to 100,000 inhabitants. These results indicate that when migrant communities are female-dominated, the intermarriage rate between Spanish men and migrant women is higher. Regarding intermarriage between Spanish women and migrant men, the impact is negative for practically all municipality sizes indicating that in male-dominated migrant communities, the intermarriage rate between Spanish women and migrant men is lower than in municipalities with gender-balanced migrant communities.
The relationship between the sex ratio among natives and the intermarriage rate is statistically significant in five municipality sizes for intermarriage between Spanish men and migrant women and significant in only two municipality sizes for intermarriage between Spanish women and migrant men. In both cases of intermarriage, the model yields the expected negative sign only for the group of large cities above 100,000 inhabitants. This result means that in municipalities where the number of native men or women is far greater than the number of women or men, there is little intermarriage between Spanish women and migrant men or Spanish men and migrant women, respectively.
7. Discussion and Conclusions
In this paper, we presented a spatial regimes model to predict the absolute number and relative importance of intermarriage in Spain between native men and migrant women and between native women and migrant men. Our models combine three main features. First, the models did not assume collapsibility of the marriage market. Instead, we examined intermarriage rates at the local level based on structural characteristics of local marriage markets and their neighboring areas. The structural characteristics of the neighboring areas were specified with spatially lagged variables that utilized a spatial weight matrix to determine the vicinity relationship among spatial units. Second, the explanatory variables in the model included the following structural characteristics at the local level: the relative size of the migrant community, the homogeneity of migrant origin, and the sex ratios in migrant and native communities. Third, a spatial regime model was implemented to examine significant differences in intermarriage by size of place.
Regarding our modeling strategy, results show that the local characteristics of the marriage markets have an impact on both the absolute and relative importance of intermarriage and that these effects vary by size of place. We have also shown that including spatially lagged variables, which means considering the influence of neighboring areas, always improves the fit of the models, particularly among the medium and large municipalities. The explanatory capacity of our models, measured as R2, is higher in the largest municipalities. However, this result does not exclude finding statistically significant coefficients among the smallest municipalities as well.
The results indicate that intermarriage is more likely to occur where there are communities of migrants and where these migrants are diverse in terms of origin. The more migrants and the more diverse they are, the more intermarriage there will be. This relationship holds true for both the absolute and relative measures of intermarriage. Specifically, the relative size of the migrant community turns out to be the most important factor for both models and intermarriage types. When significant, the relative size of the migrant community is positively related to the number of intermarried couples. Hence, municipalities with larger migrant communities have more intermarriage than those with smaller communities.
However, in the relative measure of intermarriage, the impact of homogeneity of migrant origin on intermarriage provides additional insights, since it is positively related with intermarriage between foreign men and Spanish women in smaller municipalities. Residential segregation may explain this fact. In small municipalities, the presence of migrants from a same origin—mainly when they are from a Latin American country—encourages social integration. Conversely, the coexistence of migrants of different nationalities and cultures in a village, typically farmworkers, might produce higher levels of segregation.
The impact of the sex ratio in the migrant and native communities on intermarriage is not uniform across all municipality sizes and does not always have the expected positive sign. The clearest impact of sex ratios is that the relative importance of intermarriage between Spanish men and migrant women is higher in municipalities whose migrant communities are female-dominated. In contrast, male-dominated migrant communities are not associated with more intermarriage between Spanish women and migrant men. These results suggest that male-dominated migrant communities are not enough to encourage intermarriage among native women. The social cultural background of these migrants may play a role as well. For example, male-dominated migrant communities in Spain generally consist of Moroccan migrants, and research has shown that these migrants are very unlikely to marry native Spanish women with no Moroccan ancestry.
Future research should investigate further the relationship between the characteristics of the local marriage markets and the levels and opportunities for intermarriage. In the context of an increasingly heterogeneous foreign population in Spain, it is also relevant to study whether intermarriage propensity differs according to the origin of migrants, though information on the country of citizenship at the local level might be problematic to obtain due to confidentiality reasons. If data availability were not a concern, residential segregation indicators in municipalities is an important dimension to consider; this is as important as the social and cultural backgrounds of the migrant communities who settled in each municipality. The ideal study should consider all types of unions but, more importantly, all marriages regarding the country where they were contracted. This consideration will provide us with a broader understanding of intermarriage dynamics in local communities and will enable us to disentangle whether the structural opportunities of the marriage market operate in the same manner for migrants as for natives. The importance given in this article to the local context of opportunities should not undermine the importance of individual preferences and expectations concerning marriage and intermarriage.
Author Contributions
Conceptualization, A.E. and A.L.-G.; methodology, A.E. and C.C.; software, C.C. and A.L.-G.; validation, A.E., C.C. and A.L.-G.; formal analysis, A.E., C.C. and A.L.-G.; investigation, A.E. and C.C.; resources, A.E., C.C. and A.L.-G.; data curation, A.E. and A.L.-G.; writing—original draft preparation, A.E.; writing—review and editing, A.E., C.C. and A.L.-G.; visualization, C.C. and A.L.-G.; project administration, A.E.; funding acquisition, A.E., C.C. and A.L.-G. All authors have read and agreed to the published version of the manuscript.
Funding
GLOBFAM project: Ministerio de Ciencia e Innovación de España, grant number RTI2018-096730-B-I00; CERCA Programme, Generalitat de Catalunya, grant number 2017 SGR 1454; Talent Programme, Universitat Autònoma de Barcelona, grant number 2018-ALG; eS-MiData Project, Comunidad de Madrid, grant number 447379001.
Institutional Review Board Statement
Not applicable.
Informed Consent Statement
Not applicable.
Data Availability Statement
The data and scripts are available in the Spatial and Regional Economics research group (ECONRES) of the Universidad Autónoma de Madrid at
https://econresuam.wordpress.com/opendata (accessed date: 27 February 2022).
Conflicts of Interest
The authors declare no conflict of interest.
References
- Harris, D.R.; Ono, H. How Many Interracial Marriages Would There Be If All Groups Were of Equal Size in All Places? A New Look at National Estimates of Interracial Marriage. Soc. Sci. Res. 2005, 34, 236–251. [Google Scholar] [CrossRef]
- Rontos, K.; Salvati, L. Space Matters? Exploring Gender Differentials in the Age at Marriage, Greece (1980–2017). Soc. Sci. 2020, 9, 59. [Google Scholar] [CrossRef] [Green Version]
- Boschman, S. Residential Segregation and Interethnic Contact in the Netherlands. Urban Stud. 2012, 49, 353–367. [Google Scholar] [CrossRef]
- Asibey, M.O.; Poku-Boansi, M.; Adutwum, I.O. Residential Segregation of Ethnic Minorities and Sustainable City Development. Case of Kumasi, Ghana. Cities 2021, 116, 103297. [Google Scholar] [CrossRef]
- Kalmijn, M. Intermarriage and Homogamy: Causes, Patterns, Trends. Annu. Rev. Sociol. 1998, 24, 395–421. [Google Scholar] [CrossRef] [Green Version]
- Lichter, D.T.; Qian, Z. The Study of Assortative Mating: Theory, Data, and Analysis. In Analytical Family Demography; Schoen, R., Ed.; The Springer Series on Demographic Methods and Population Analysis; Springer International Publishing: Cham, Switzerland, 2019; pp. 303–337. ISBN 978-3-319-93227-9. [Google Scholar]
- Rosenfeld, M.J. The Age of Independence: Interracial Unions, Same-Sex Unions, and the Changing American Family; Harvard University Press: Cambridge, MA, USA, 2007; ISBN 978-0-674-02497-7. [Google Scholar]
- Zhang, X.; Sassler, S. The Age of Independence, Revisited: Parents and Interracial Union Formation Across the Life Course. Sociol. Forum 2019, 34, 361–385. [Google Scholar] [CrossRef]
- Blau, P.M.; Blum, T.C.; Schwartz, J.E. Heterogeneity and Intermarriage. Am. Sociol. Rev. 1982, 47, 45–62. [Google Scholar] [CrossRef]
- Hwang, S.-S.; Saenz, R.; Aguirre, B.E. Structural and Assimilationist Explanations of Asian American Intermarriage. J. Marriage Fam. 1997, 59, 758–772. [Google Scholar] [CrossRef]
- Kalmijn, M.; Van Tubergen, F. A Comparative Perspective on Intermarriage: Explaining Differences Among National-Origin Groups in the United States. Demography 2010, 47, 459–479. [Google Scholar] [CrossRef]
- Bohm-Jordan, M.; Yang, P.Q. Determinants of Intermarriages among Foreign-Born Asians in the United States. Marriage Fam. Rev. 2021, 57, 59–91. [Google Scholar] [CrossRef]
- Corti, G.; Scherer, S. Mating Market and Dynamics of Union Formation. Eur. J. Popul. 2021, 37, 851–876. [Google Scholar] [CrossRef] [PubMed]
- Massey, D.S.; Denton, N.A. The Dimensions of Residential Segregation. Soc. Forces 1988, 67, 281–315. [Google Scholar] [CrossRef]
- Telles, E.; Esteve, A. Racial Intermarriage in the Americas. Sociol. Sci. 2019, 6, 293–320. [Google Scholar] [CrossRef] [Green Version]
- Bossard, J.H.S. Residential Propinquity as a Factor in Marriage Selection. Am. J. Sociol. 1932, 38, 219–224. [Google Scholar]
- Haandrikman, K.; Harmsen, C.; van Wissen, L.J.G.; Hutter, I. Geography Matters: Patterns of Spatial Homogamy in the Netherlands. Popul. Space Place 2008, 14, 387–405. [Google Scholar] [CrossRef]
- Hannemann, T.; Kulu, H.; Rahnu, L.; Puur, A.; Hărăguş, M.; Obućina, O.; González-Ferrer, A.; Neels, K.; Van den Berg, L.; Pailhé, A.; et al. Co-Ethnic Marriage versus Intermarriage among Immigrants and Their Descendants: A Comparison across Seven European Countries Using Event-History Analysis. Demogr. Res. 2018, 39, 487–524. [Google Scholar] [CrossRef] [Green Version]
- Qian, Z.; Lichter, D.T.; Tumin, D. Divergent Pathways to Assimilation? Local Marriage Markets and Intermarriage among U.S. Hispanics. J. Marriage Fam. 2018, 80, 271–288. [Google Scholar] [CrossRef] [PubMed]
- Mare, R.D. Five Decades of Educational Assortative Mating. Am. Sociol. Rev. 1991, 56, 15–32. [Google Scholar] [CrossRef]
- Qian, Z. Changes in Assortative Mating: The Impact of Age and Education, 1970–1990. Demography 1998, 35, 279–292. [Google Scholar] [CrossRef]
- Chiappori, P.-A. The Theory and Empirics of the Marriage Market. Annu. Rev. Econ. 2020, 12, 547–578. [Google Scholar] [CrossRef]
- Akers, D.S. On Measuring the Marriage Squeeze. Demography 1967, 4, 907–924. [Google Scholar] [CrossRef] [PubMed]
- Schoen, R. Measuring the Tightness of a Marriage Squeeze. Demography 1983, 20, 61–78. [Google Scholar] [CrossRef] [PubMed]
- McCaa, R. Ethnic Intermarriage and Gender in New York City. J. Interdiscip. Hist. 1993, 24, 207–231. [Google Scholar] [CrossRef]
- Choi, K.H.; Tienda, M. Marriage-Market Constraints and Mate-Selection Behavior: Racial, Ethnic, and Gender Differences in Intermarriage. J. Marriage Fam. 2017, 79, 301–317. [Google Scholar] [CrossRef] [PubMed] [Green Version]
- Weiss, I.; Stecklov, G. Assimilation and Ethnic Marriage Squeeze in Early 20th Century America: A Gender Perspective. Demogr. Res. 2020, 42, 99–132. [Google Scholar] [CrossRef]
- Camarero, L.; Sampedro, R. ¿Por qué se van las mujeres? El continuum de movilidad como hipótesis explicativa de la masculinización rural (Why Are Women Leaving? The Mobility Continuum as an Explanation of Rural Masculinization Process). Rev. Española Investig. Sociol. 2008, 124, 73–105. [Google Scholar] [CrossRef]
- Eckhard, J.; Stauder, J. Migration and the Partner Market: How Gender-Selective Relocations Affect Regional Mating Chances in Germany. Eur. J. Popul. 2018, 34, 59–86. [Google Scholar] [CrossRef]
- Arango, J. Becoming a Country of Immigration at the End of the Twentieth Century: The Case of Spain. In Eldorado or Fortress? Migration in Southern Europe; King, R., Lazaridis, G., Tsardanidis, C., Eds.; Palgrave Macmillan UK: London, UK, 2000; pp. 253–276. ISBN 978-0-333-98252-5. [Google Scholar]
- Recaño Valverde, J.; Domingo i Valls, A. Evolución de la distribución territorial y la movilidad geográfica de la población extranjera en España. Pap. Demogr. 2006, 281, 1–37. [Google Scholar]
- González-Ferrer, A.; Obućina, O.; Cortina, C.; Castro-Martín, T. Mixed Marriages between Immigrants and Natives in Spain: The Gendered Effect of Marriage Market Constraints. Demogr. Res. 2018, 39, 1–32. [Google Scholar] [CrossRef] [Green Version]
- Prieto-Rosas, V.; Recaño, J.; Quintero-Lesmes, D.C. Migration Responses of Immigrants in Spain during the Great Recession. Demogr. Res. 2018, 38, 1885–1932. [Google Scholar] [CrossRef] [Green Version]
- Vila, M.R.; Castro-Martín, T. Childbearing Patterns of Foreign Women in a New Immigration Country. Population 2007, 62, 351–379. [Google Scholar] [CrossRef] [Green Version]
- Desiderio, R. The Impact of International Migration on Fertility: An Empirical Study; Knomad Paper 36; World Bank Group: Washington, DC, USA, 2020; p. 32. [Google Scholar]
- Esteve, A.; López-Gay, A.; Serret, J. Revelaciones de una década de matrimonios entre españoles y extranjeros, 1998-08. Estad. Esp. 2013, 55, 213–230. [Google Scholar]
- Cortina, A.E. Clara Demographic Research—Changes in Educational Assortative Mating in Contemporary Spain. Available online: https://www.demographic-research.org/volumes/vol14/17/default.htm (accessed on 10 February 2022).
- Esteve, A.; Bueno, X. Tras El Rastro Estadístico de Las Parejas de Inmigrantes En España. Estad. Esp. 2010, 52, 91–125. [Google Scholar]
- Cabré, A.; Cortina Trilla, C.; Esteve, A. ¿Con quién se unen los latinoamericanos en España? Respuestas a partir de tres fuentes estadísticas. Pap. Demogr. 2006, 300, 1–21. [Google Scholar]
- Sánchez-Domínguez, M.; de Valk, H.; Reher, D. Marriage Strategies among Immigrants in Spain. Rev. Int. Sociol. 2011, 69, 139–166. [Google Scholar] [CrossRef]
- Medrano, J.D.; Cortina, C.; Safranoff, A.; Castro-Martín, T. Euromarriages in Spain: Recent Trends and Patterns in the Context of European Integration: Euromarriages in Spain. Popul. Space Place 2014, 20, 157–176. [Google Scholar] [CrossRef] [Green Version]
- Rodríguez-García, D.; de Miguel-Luken, V.M.; Solana-Solana, M. Las uniones mixtas y sus descendientes en España: Evolución y consideraciones sobre la mixticidad. Anu. CIDOB Inmigr. 2020, 167–196. [Google Scholar] [CrossRef]
- Guetto, R.; Azzolini, D. An Empirical Study of Status Exchange through Migrant/Native Marriages in Italy. J. Ethn. Migr. Stud. 2015, 41, 2149–2172. [Google Scholar] [CrossRef]
- Cortina, C.; Esteve, A.; Domingo, A. Crecimiento y singularidades demográficas de los matrimonios de extranjeros en España. Migr. Publ. Inst. Univ. Estud. Sobre Migr. 2006, 20, 75–105. [Google Scholar]
- LeSage, J.; Pace, R.K. Introduction to Spatial Econometrics; Chapman and Hall/CRC: New York, NY, USA, 2009; ISBN 978-0-429-13808-9. [Google Scholar]
- Anselin, L.; Rey, S.J. Modern Spatial Econometrics in Practice: A Guide to GeoDa, GeoDaSpace and PySAL; GeoDa Press: Chicago, IL, USA, 2014; ISBN 978-0-9863421-0-3. [Google Scholar]
- Lambert, D. Zero-Inflated Poisson Regression, with an Application to Defects in Manufacturing. Technometrics 1992, 34, 1–14. [Google Scholar] [CrossRef]
- Loeys, T.; Moerkerke, B.; De Smet, O.; Buysse, A. The Analysis of Zero-Inflated Count Data: Beyond Zero-Inflated Poisson Regression. Br. J. Math. Stat. Psychol. 2012, 65, 163–180. [Google Scholar] [CrossRef] [PubMed]
- Zero-Inflated Poisson Regression|R Data Analysis Examples. Available online: https://stats.oarc.ucla.edu/r/dae/zip/ (accessed on 13 February 2022).
- Quiroz, J.L.; Peeters, L.; Chasco, C.; Aroca, P. Equal Access to University Education in Chile? An Application Using Spatial Heckman Probit Models. Mathematics 2022, 10, 280. [Google Scholar] [CrossRef]
- Anselin, L. Spatial Externalities, Spatial Multipliers, And Spatial Econometrics. Int. Reg. Sci. Rev. 2003, 26, 153–166. [Google Scholar] [CrossRef]
- Epifani, I.; Ghiringhelli, C.; Nicolini, R. Population Distribution over Time: Modelling Local Spatial Dependence with a CAR Process. Spat. Econ. Anal. 2020, 15, 120–144. [Google Scholar] [CrossRef]
- Halleck Vega, S.; Elhorst, J.P. The Slx Model. J. Reg. Sci. 2015, 55, 339–363. [Google Scholar] [CrossRef]
- Mella-Márquez, J.M.; Chasco, C. Urban Growth and Territorial Dynamics: A Spatial-Econometric Analysis of Spain. In Spatial Dynamics, Networks and Modelling; Edward Elgar Publishing: Cheltenham, UK, 2006; p. 42. ISBN 978-1-78100-747-1. [Google Scholar]
- Gourieroux, C. Econometrics of Qualitative Dependent Variables; Cambridge University Press: Cambridge, MA, USA, 2000; ISBN 978-0-511-80560-8. [Google Scholar]
- Tobin, J. Estimation of Relationships for Limited Dependent Variables. Econometrica 1958, 26, 24–36. [Google Scholar] [CrossRef] [Green Version]
- Ferrari, S.; Cribari-Neto, F. Beta Regression for Modelling Rates and Proportions. J. Appl. Stat. 2004, 31, 799–815. [Google Scholar] [CrossRef]
- Greene, W.H. Econometric Analysis, 8th ed.; Pearson: New York, NY, USA, 2018; ISBN 978-0-13-446136-6. [Google Scholar]
- Berkson, J. Tables for Use in Estimating the Normal Distribution Function by Normit Analysis: Part I. Description and Use of Tables Part II. Comparison Between Minimum Normit Χ2 Estimate and the Maximum Likelihood Estimate. Biometrika 1957, 44, 411–435. [Google Scholar] [CrossRef]
- Chasco, C.; Aroca, P.; Anselin, L. Probit Models for Grouped-Data Migration Flows: A Theoretical Note. Economia 2019, 42, 1–8. [Google Scholar] [CrossRef] [Green Version]
- Esteve, A.; Chasco, C.; López-Gay, A. Modeling Spatial Local Variations in Intermarriage. Available online: https://b2share.eudat.eu/records/e0006de39f5b4d138fe41e6acde57cb6 (accessed on 28 February 2022).
| Publisher’s Note: MDPI stays neutral with regard to jurisdictional claims in published maps and institutional affiliations. |
© 2022 by the authors. Licensee MDPI, Basel, Switzerland. This article is an open access article distributed under the terms and conditions of the Creative Commons Attribution (CC BY) license (https://creativecommons.org/licenses/by/4.0/).


