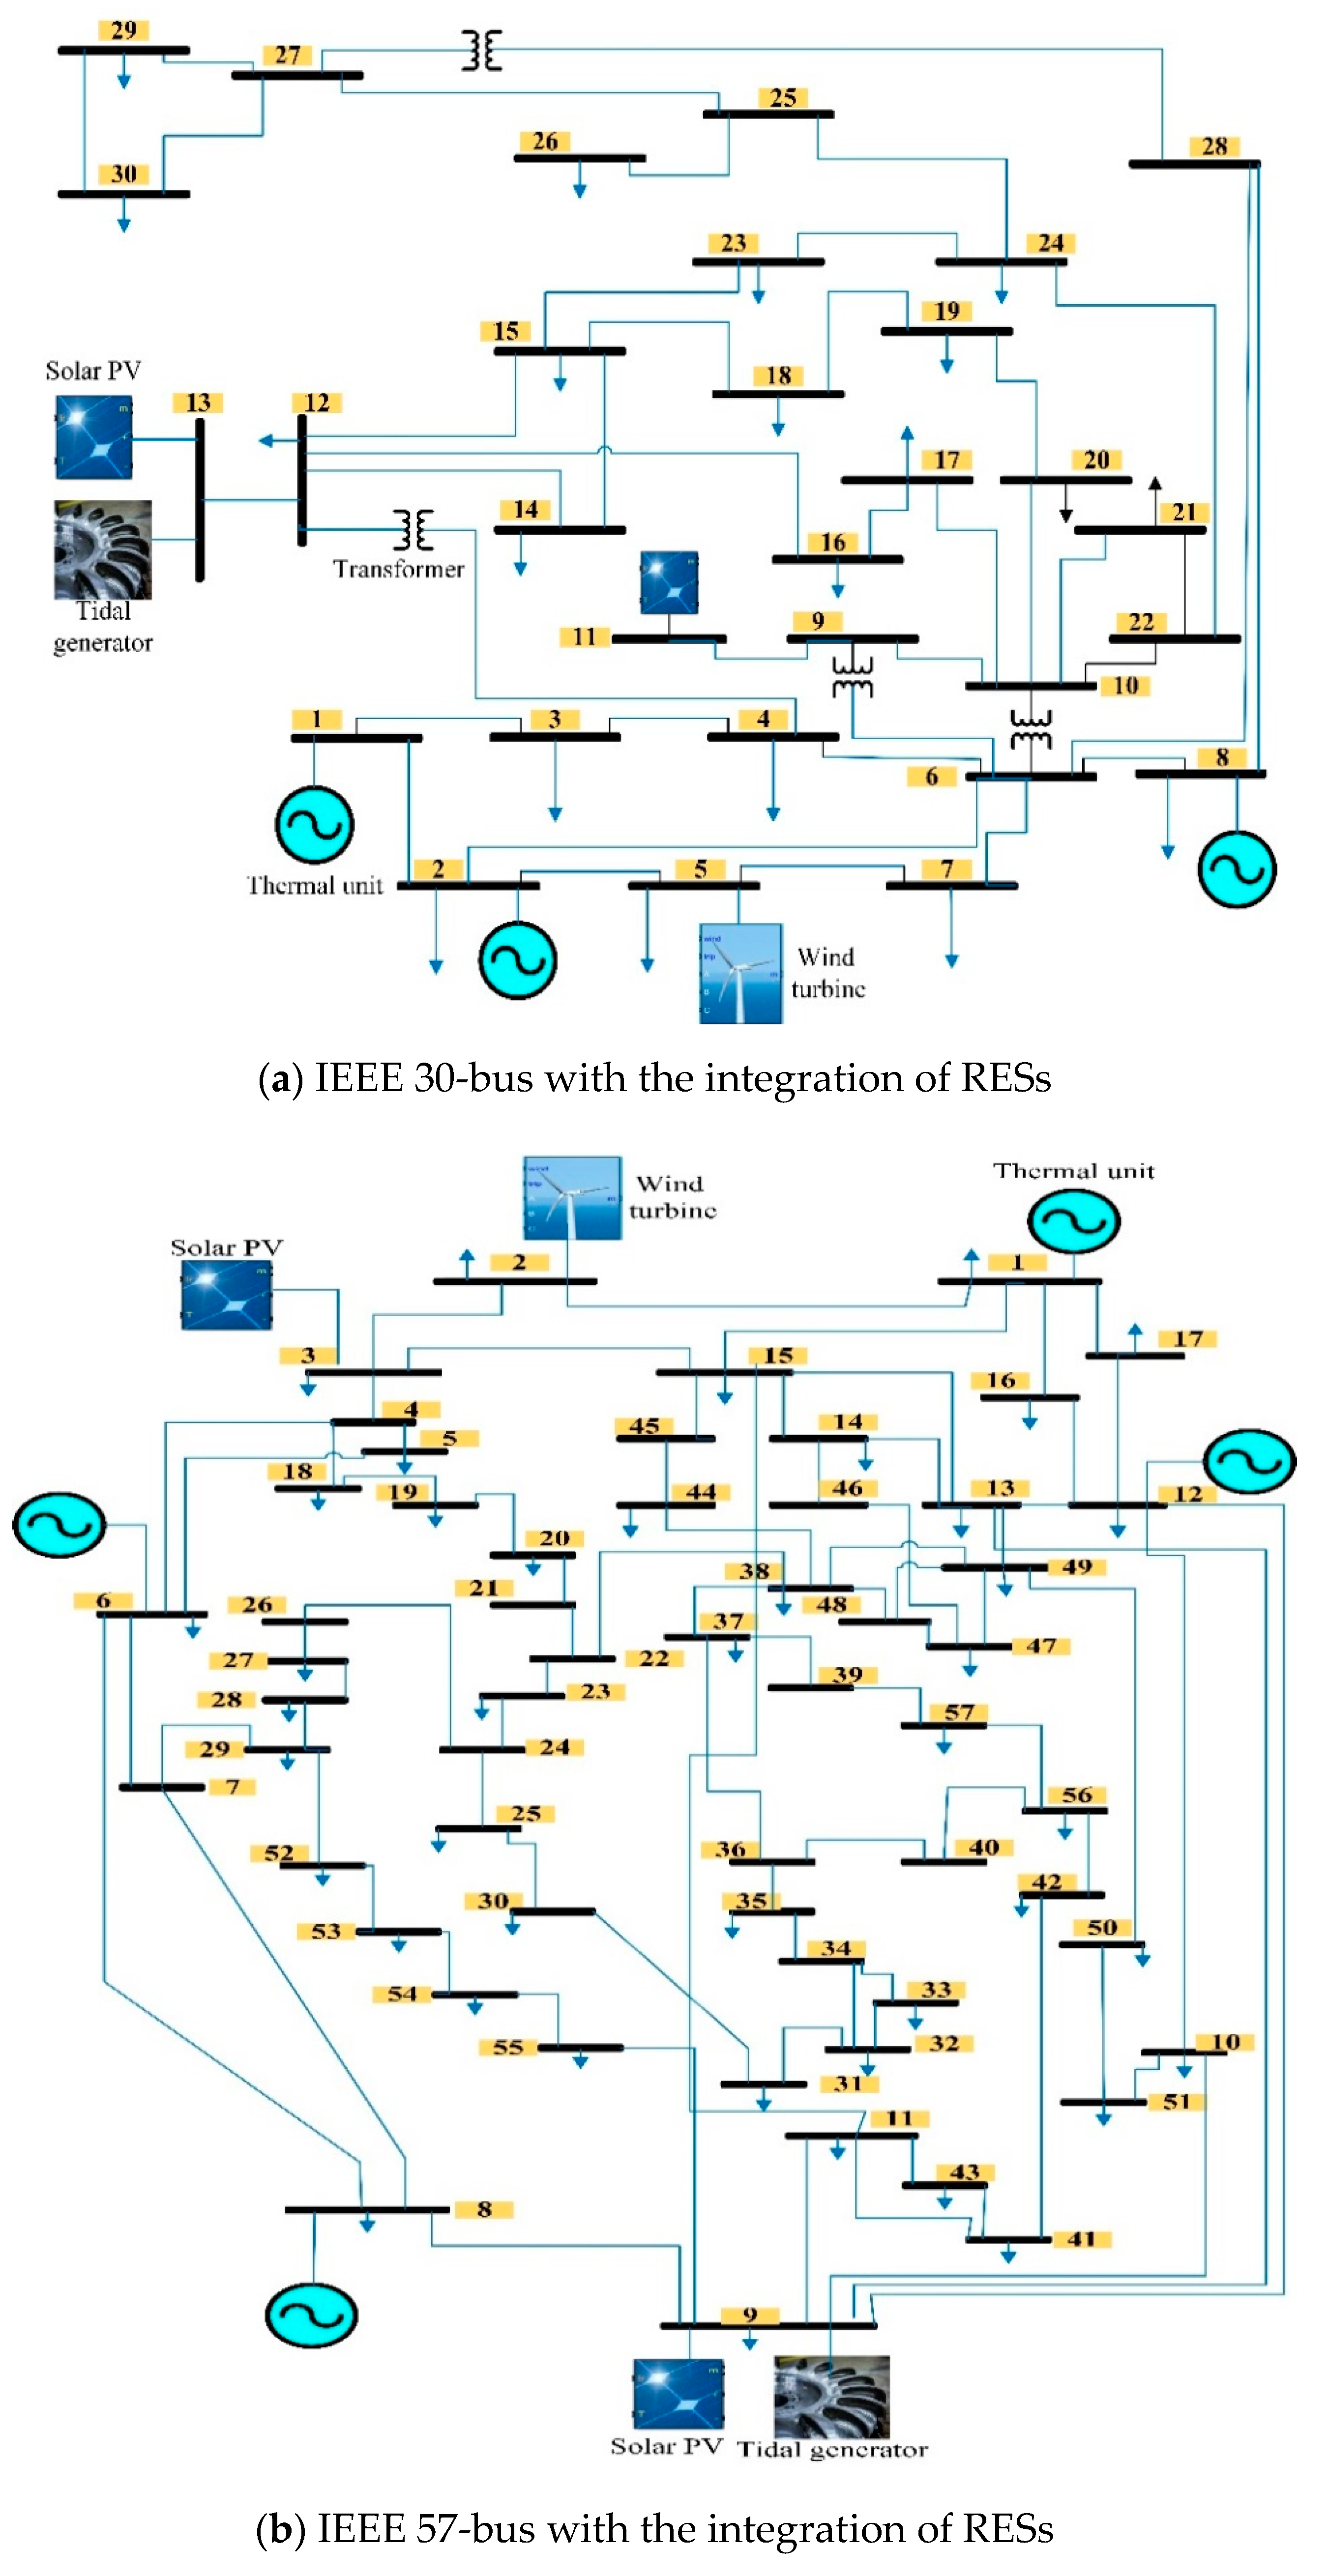
Figure 1.
The systems under study: (a) IEEE30-bus; and (b) IEEE57-bus.
Figure 1.
The systems under study: (a) IEEE30-bus; and (b) IEEE57-bus.
Figure 2.
The cost of fuel functions with and without the effect of valve point.
Figure 2.
The cost of fuel functions with and without the effect of valve point.
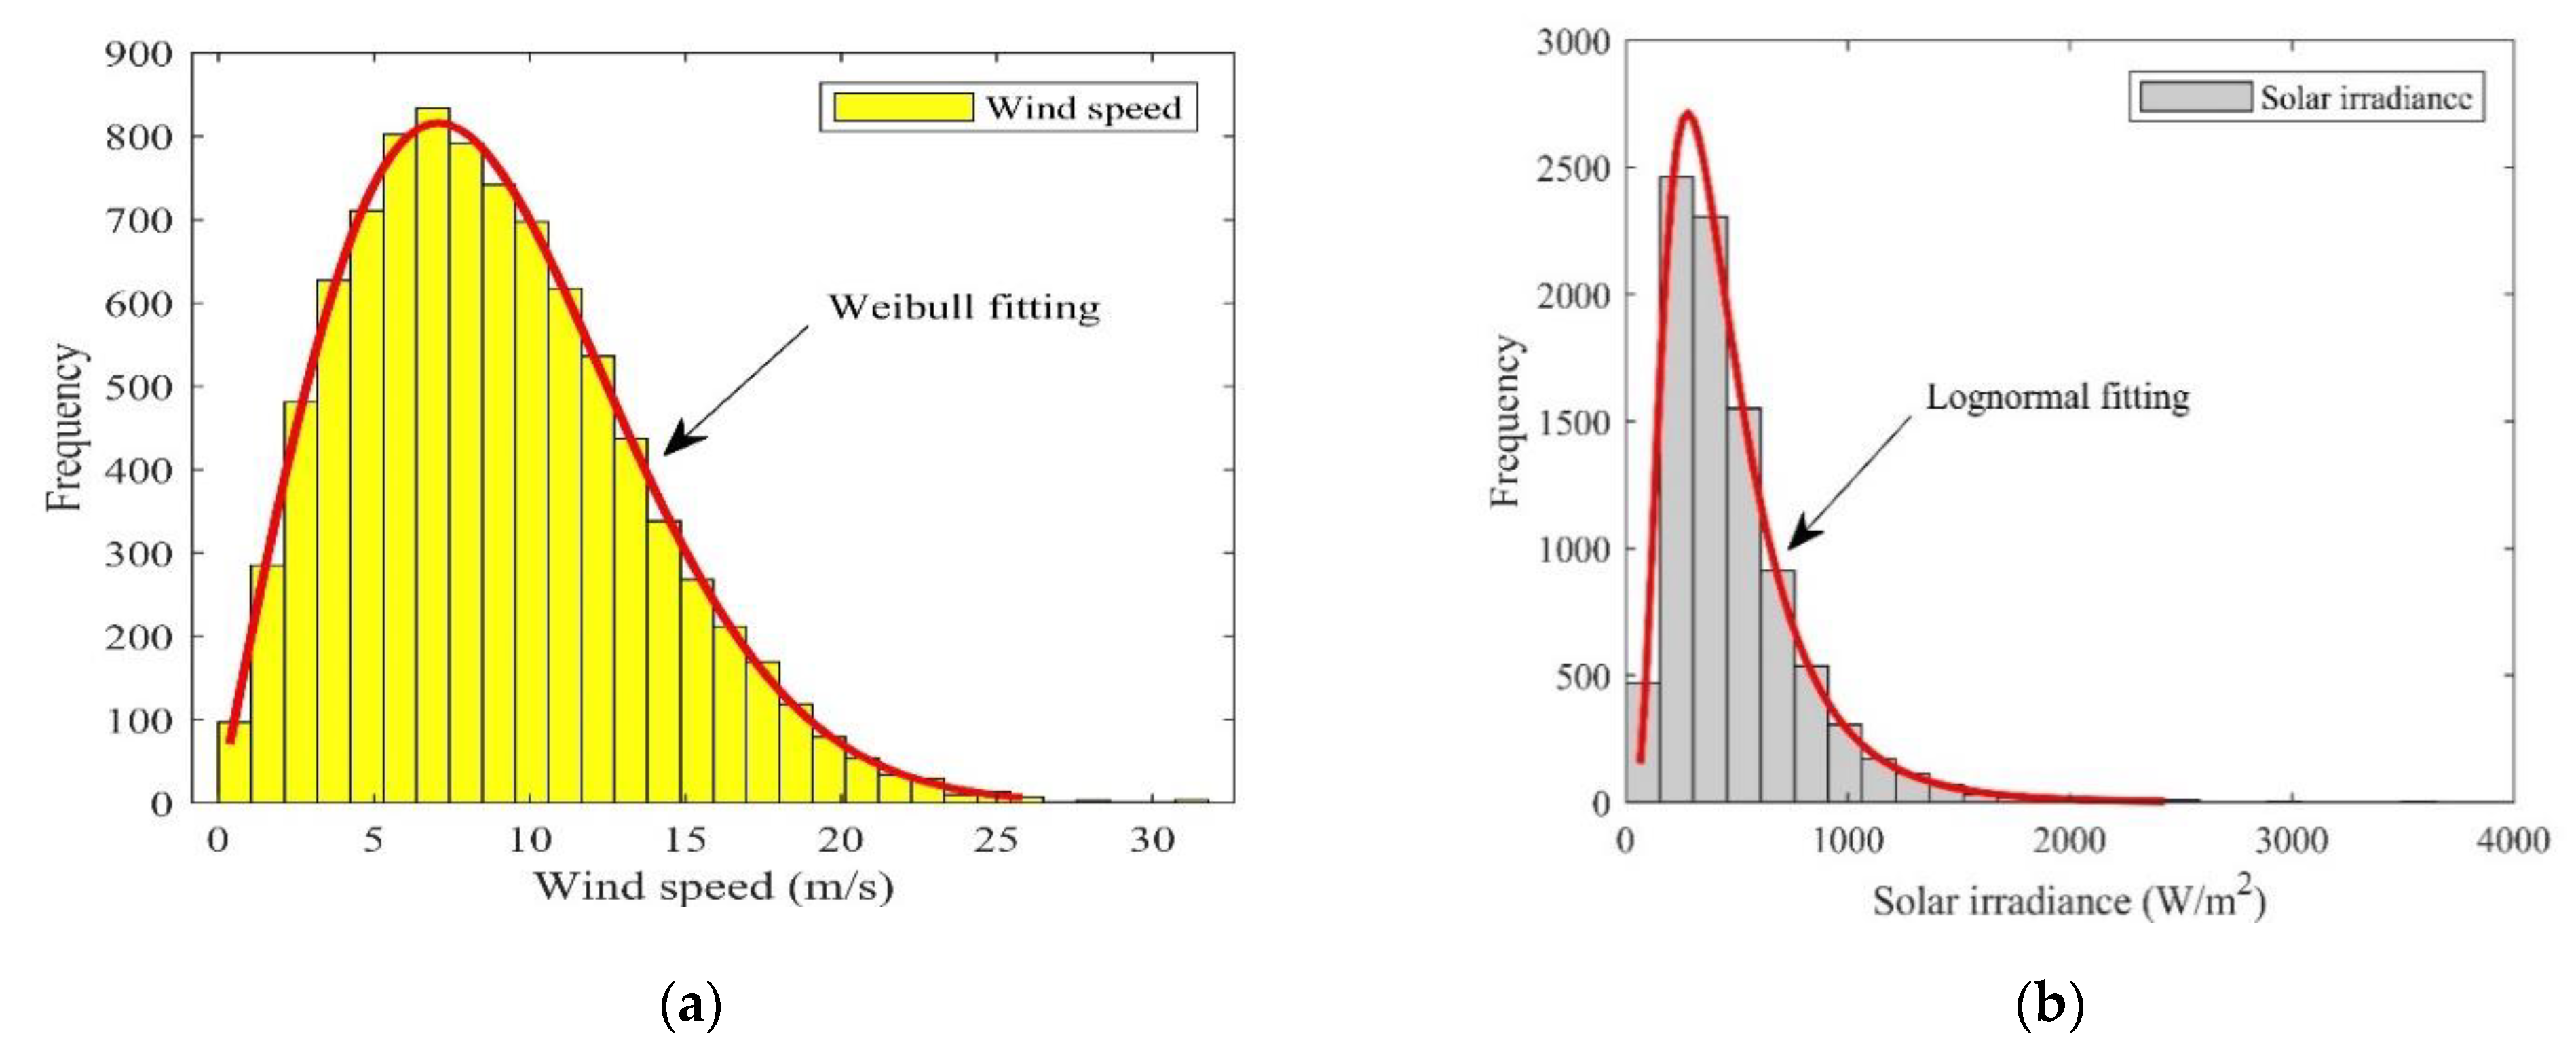
Figure 3.
Measured PDFs of WP, PV irradiance, and tidal: (a) WF; (b) LF; and (c) GF.
Figure 3.
Measured PDFs of WP, PV irradiance, and tidal: (a) WF; (b) LF; and (c) GF.
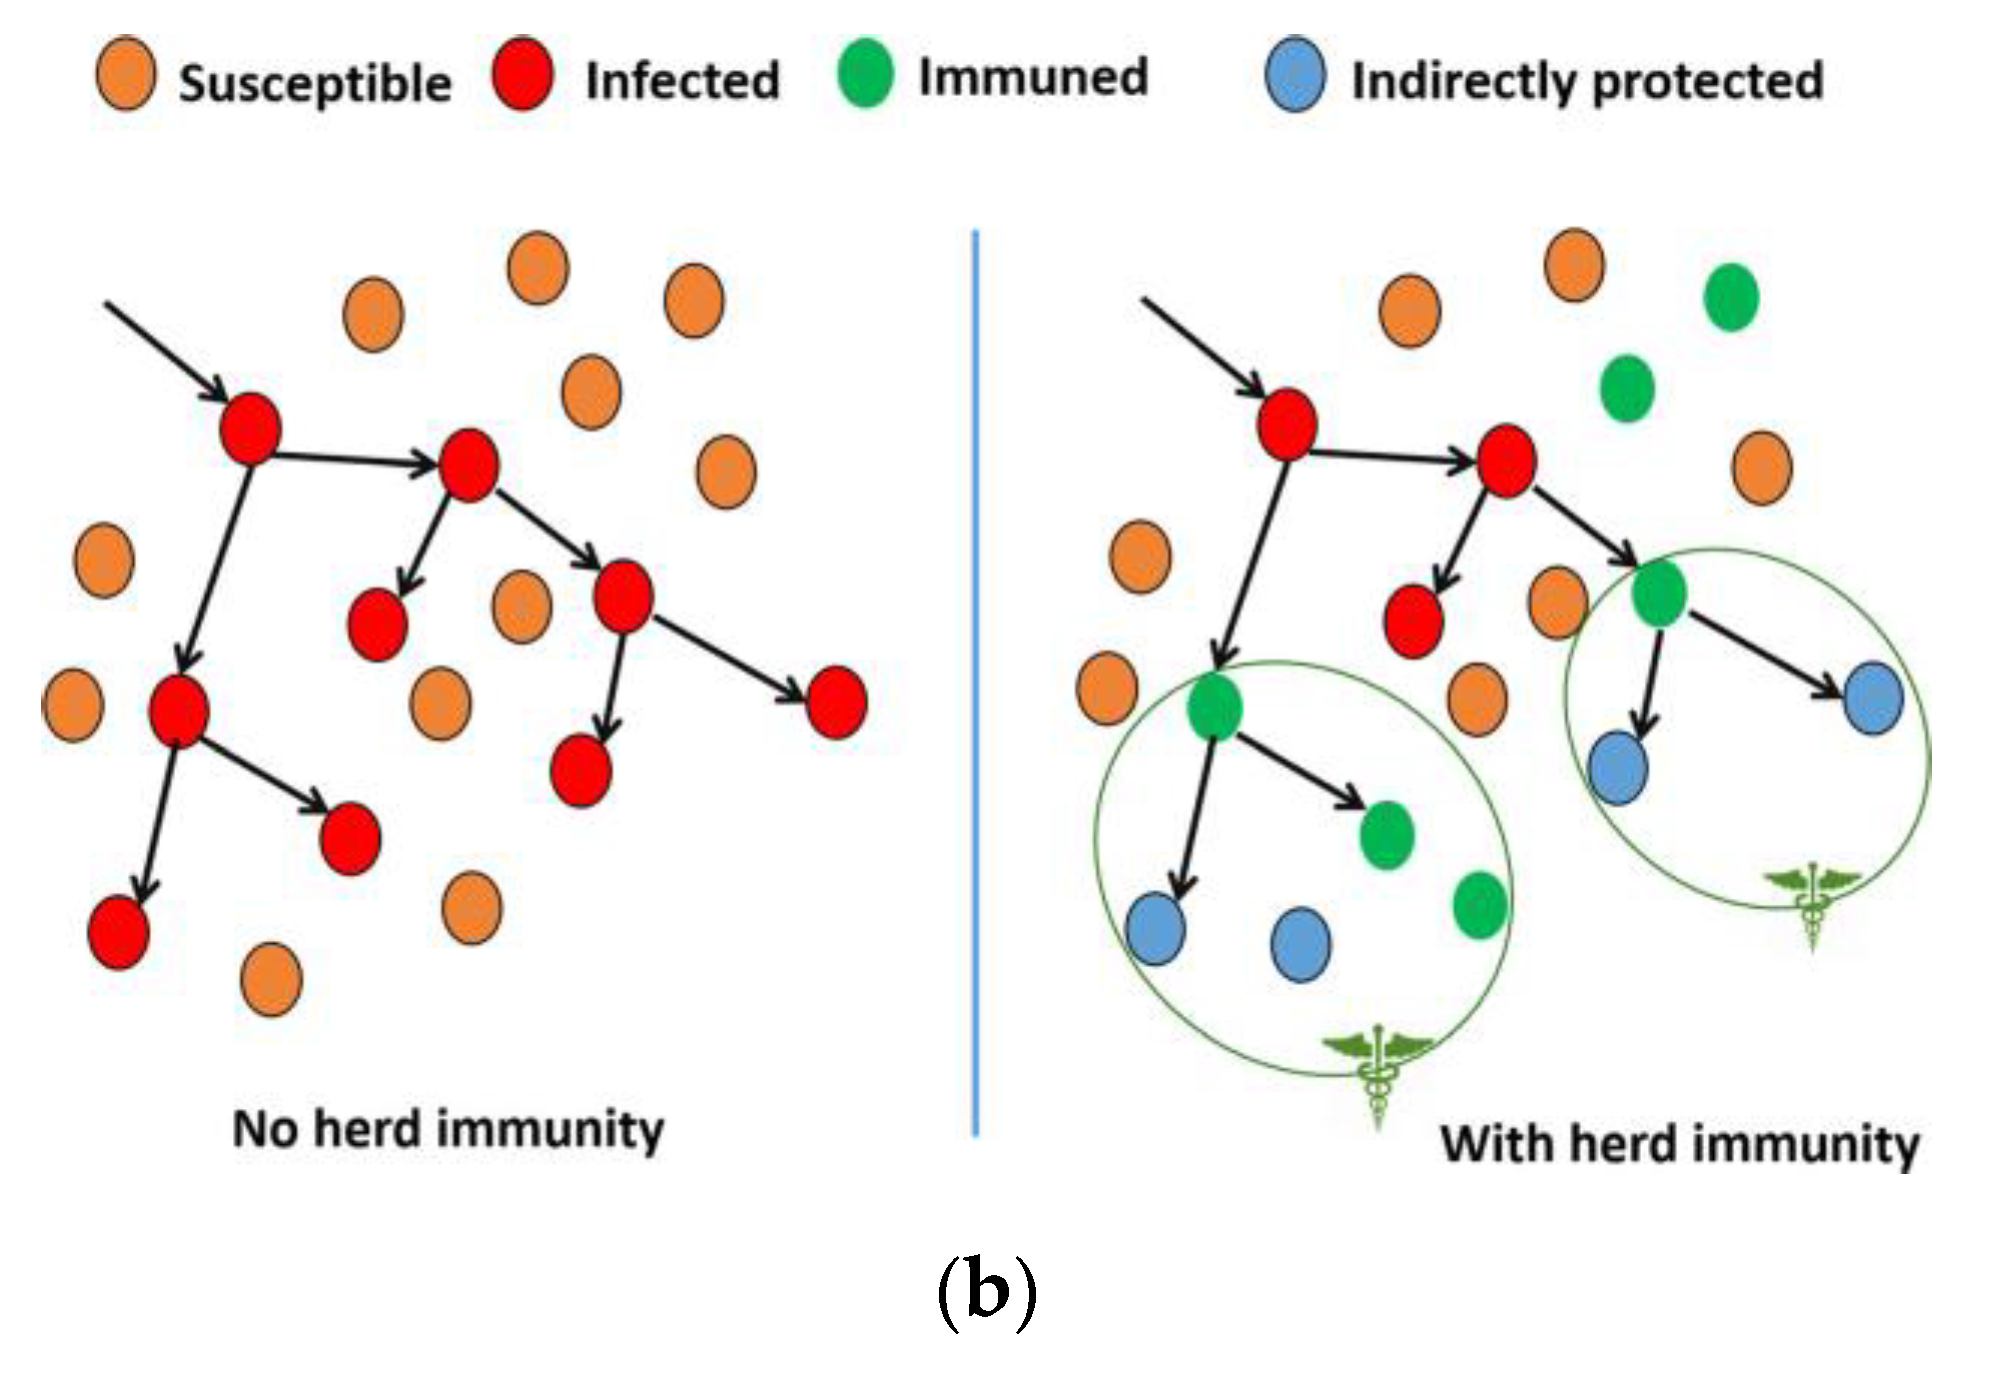
Figure 4.
Herd immunity: (
a) population; and (
b) hierarchy [
63].
Figure 4.
Herd immunity: (
a) population; and (
b) hierarchy [
63].
Figure 5.
CHIO algorithm’s flowchart [
64].
Figure 5.
CHIO algorithm’s flowchart [
64].
Figure 6.
The AHP implementation flowchart.
Figure 6.
The AHP implementation flowchart.
Figure 7.
The implementation procedure of the EETD problem, including AHP and TOPSIS, techniques.
Figure 7.
The implementation procedure of the EETD problem, including AHP and TOPSIS, techniques.
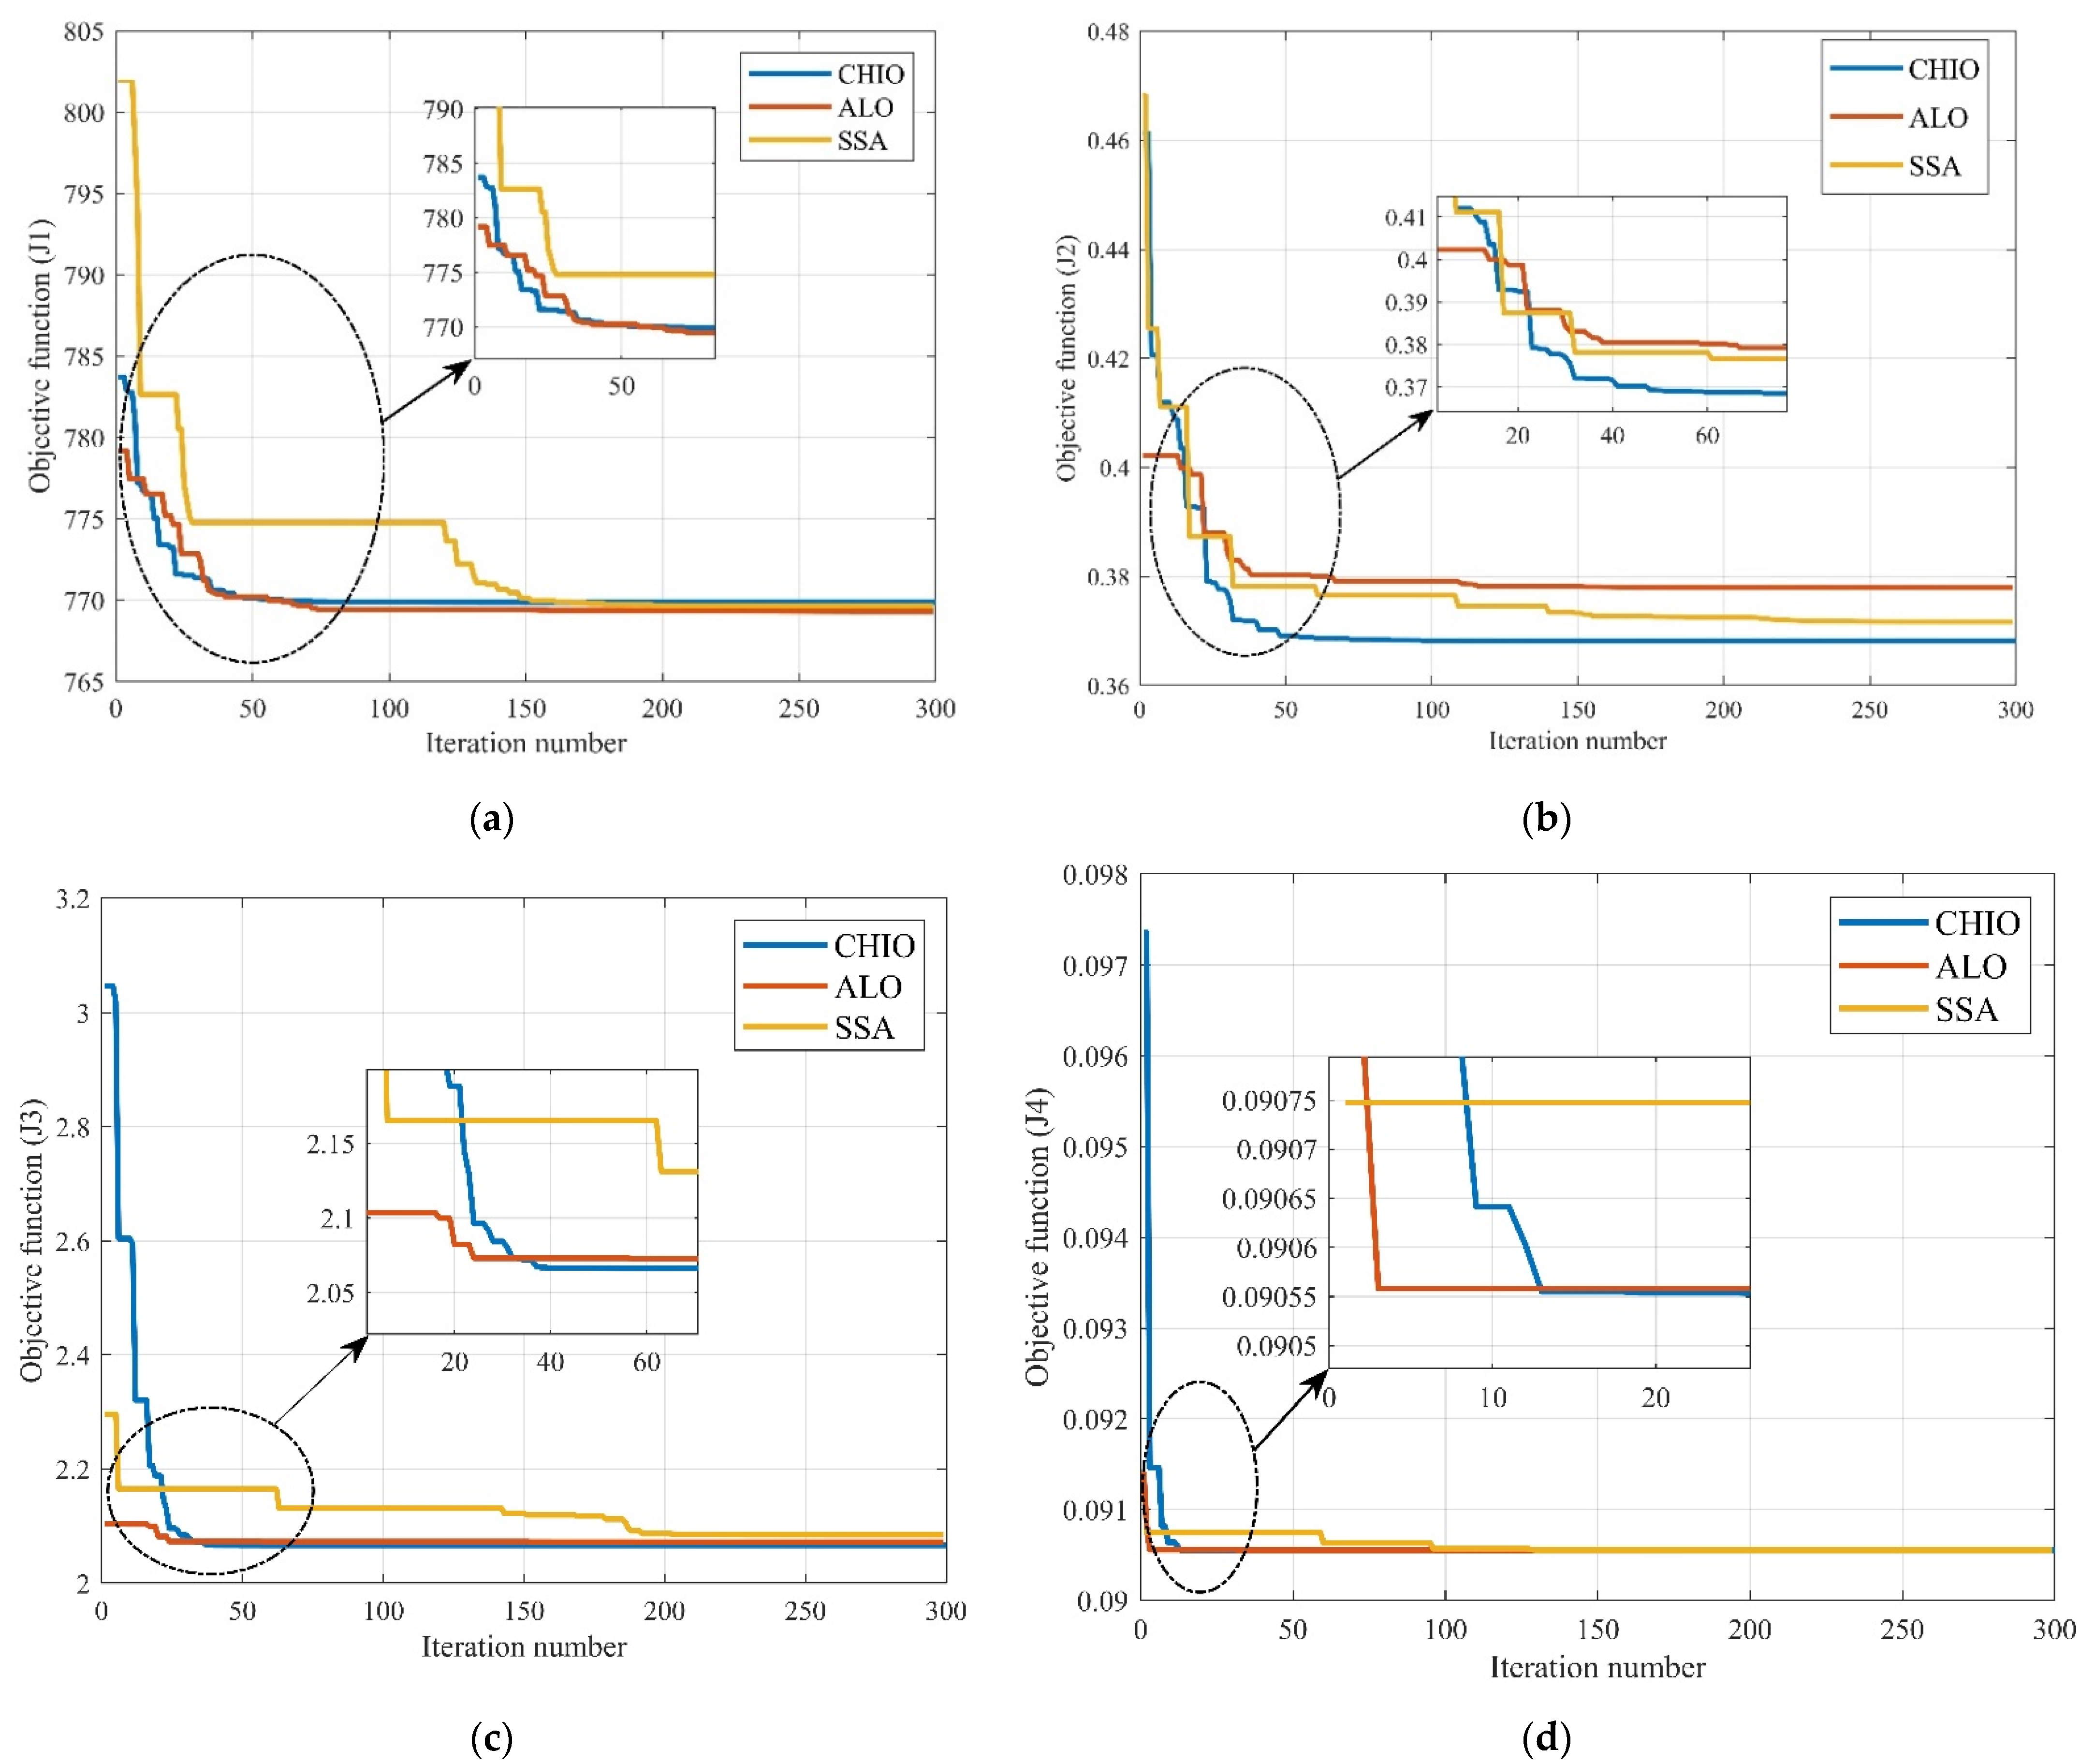
Figure 8.
Convergence rates for Scenarios 1, 2, 3, 4, and 5 with CHIO, ALO, and SSA: (a) convergence rates for Scenario 1; (b) convergence rates for Scenario 2; (c) convergence rates for Scenario 3; (d) convergence rates for Scenario 4; (e) convergence rates for Scenario 5.
Figure 8.
Convergence rates for Scenarios 1, 2, 3, 4, and 5 with CHIO, ALO, and SSA: (a) convergence rates for Scenario 1; (b) convergence rates for Scenario 2; (c) convergence rates for Scenario 3; (d) convergence rates for Scenario 4; (e) convergence rates for Scenario 5.
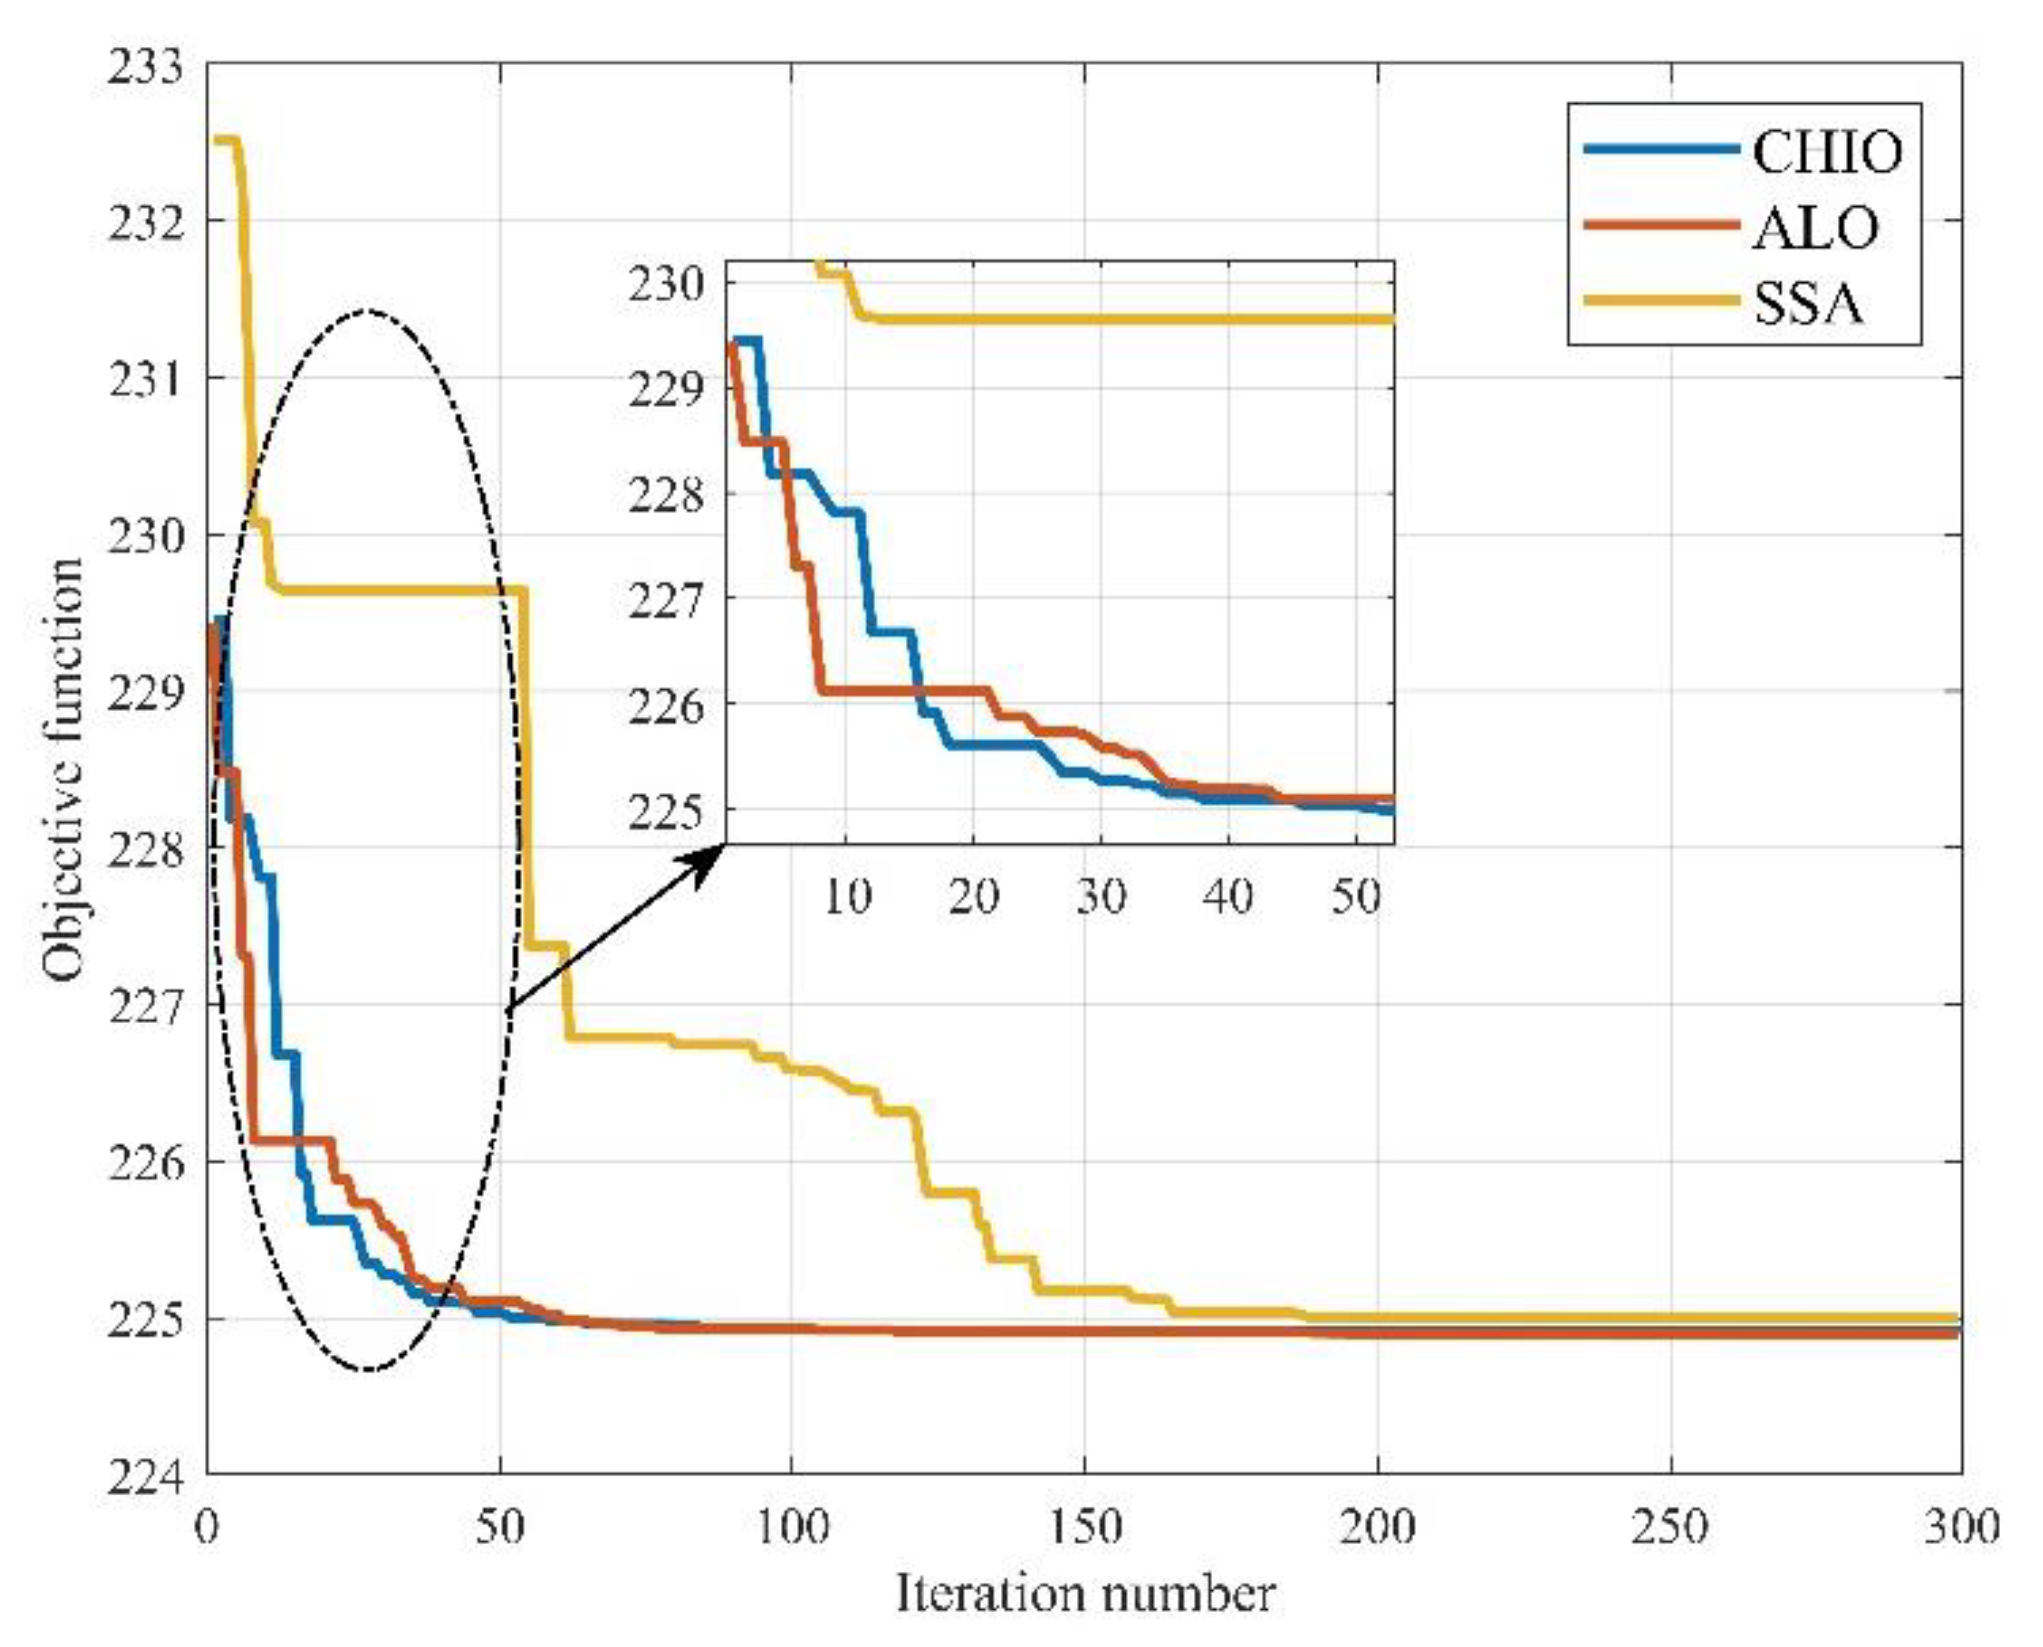
Figure 9.
Convergence rates for Scenarios 6, 7, and 8 with CHIO, ALO, and SSA: (a) convergence rates for Scenario #6; (b) convergence rates for Scenario 7; (c) convergence rates for Scenario 8.
Figure 9.
Convergence rates for Scenarios 6, 7, and 8 with CHIO, ALO, and SSA: (a) convergence rates for Scenario #6; (b) convergence rates for Scenario 7; (c) convergence rates for Scenario 8.
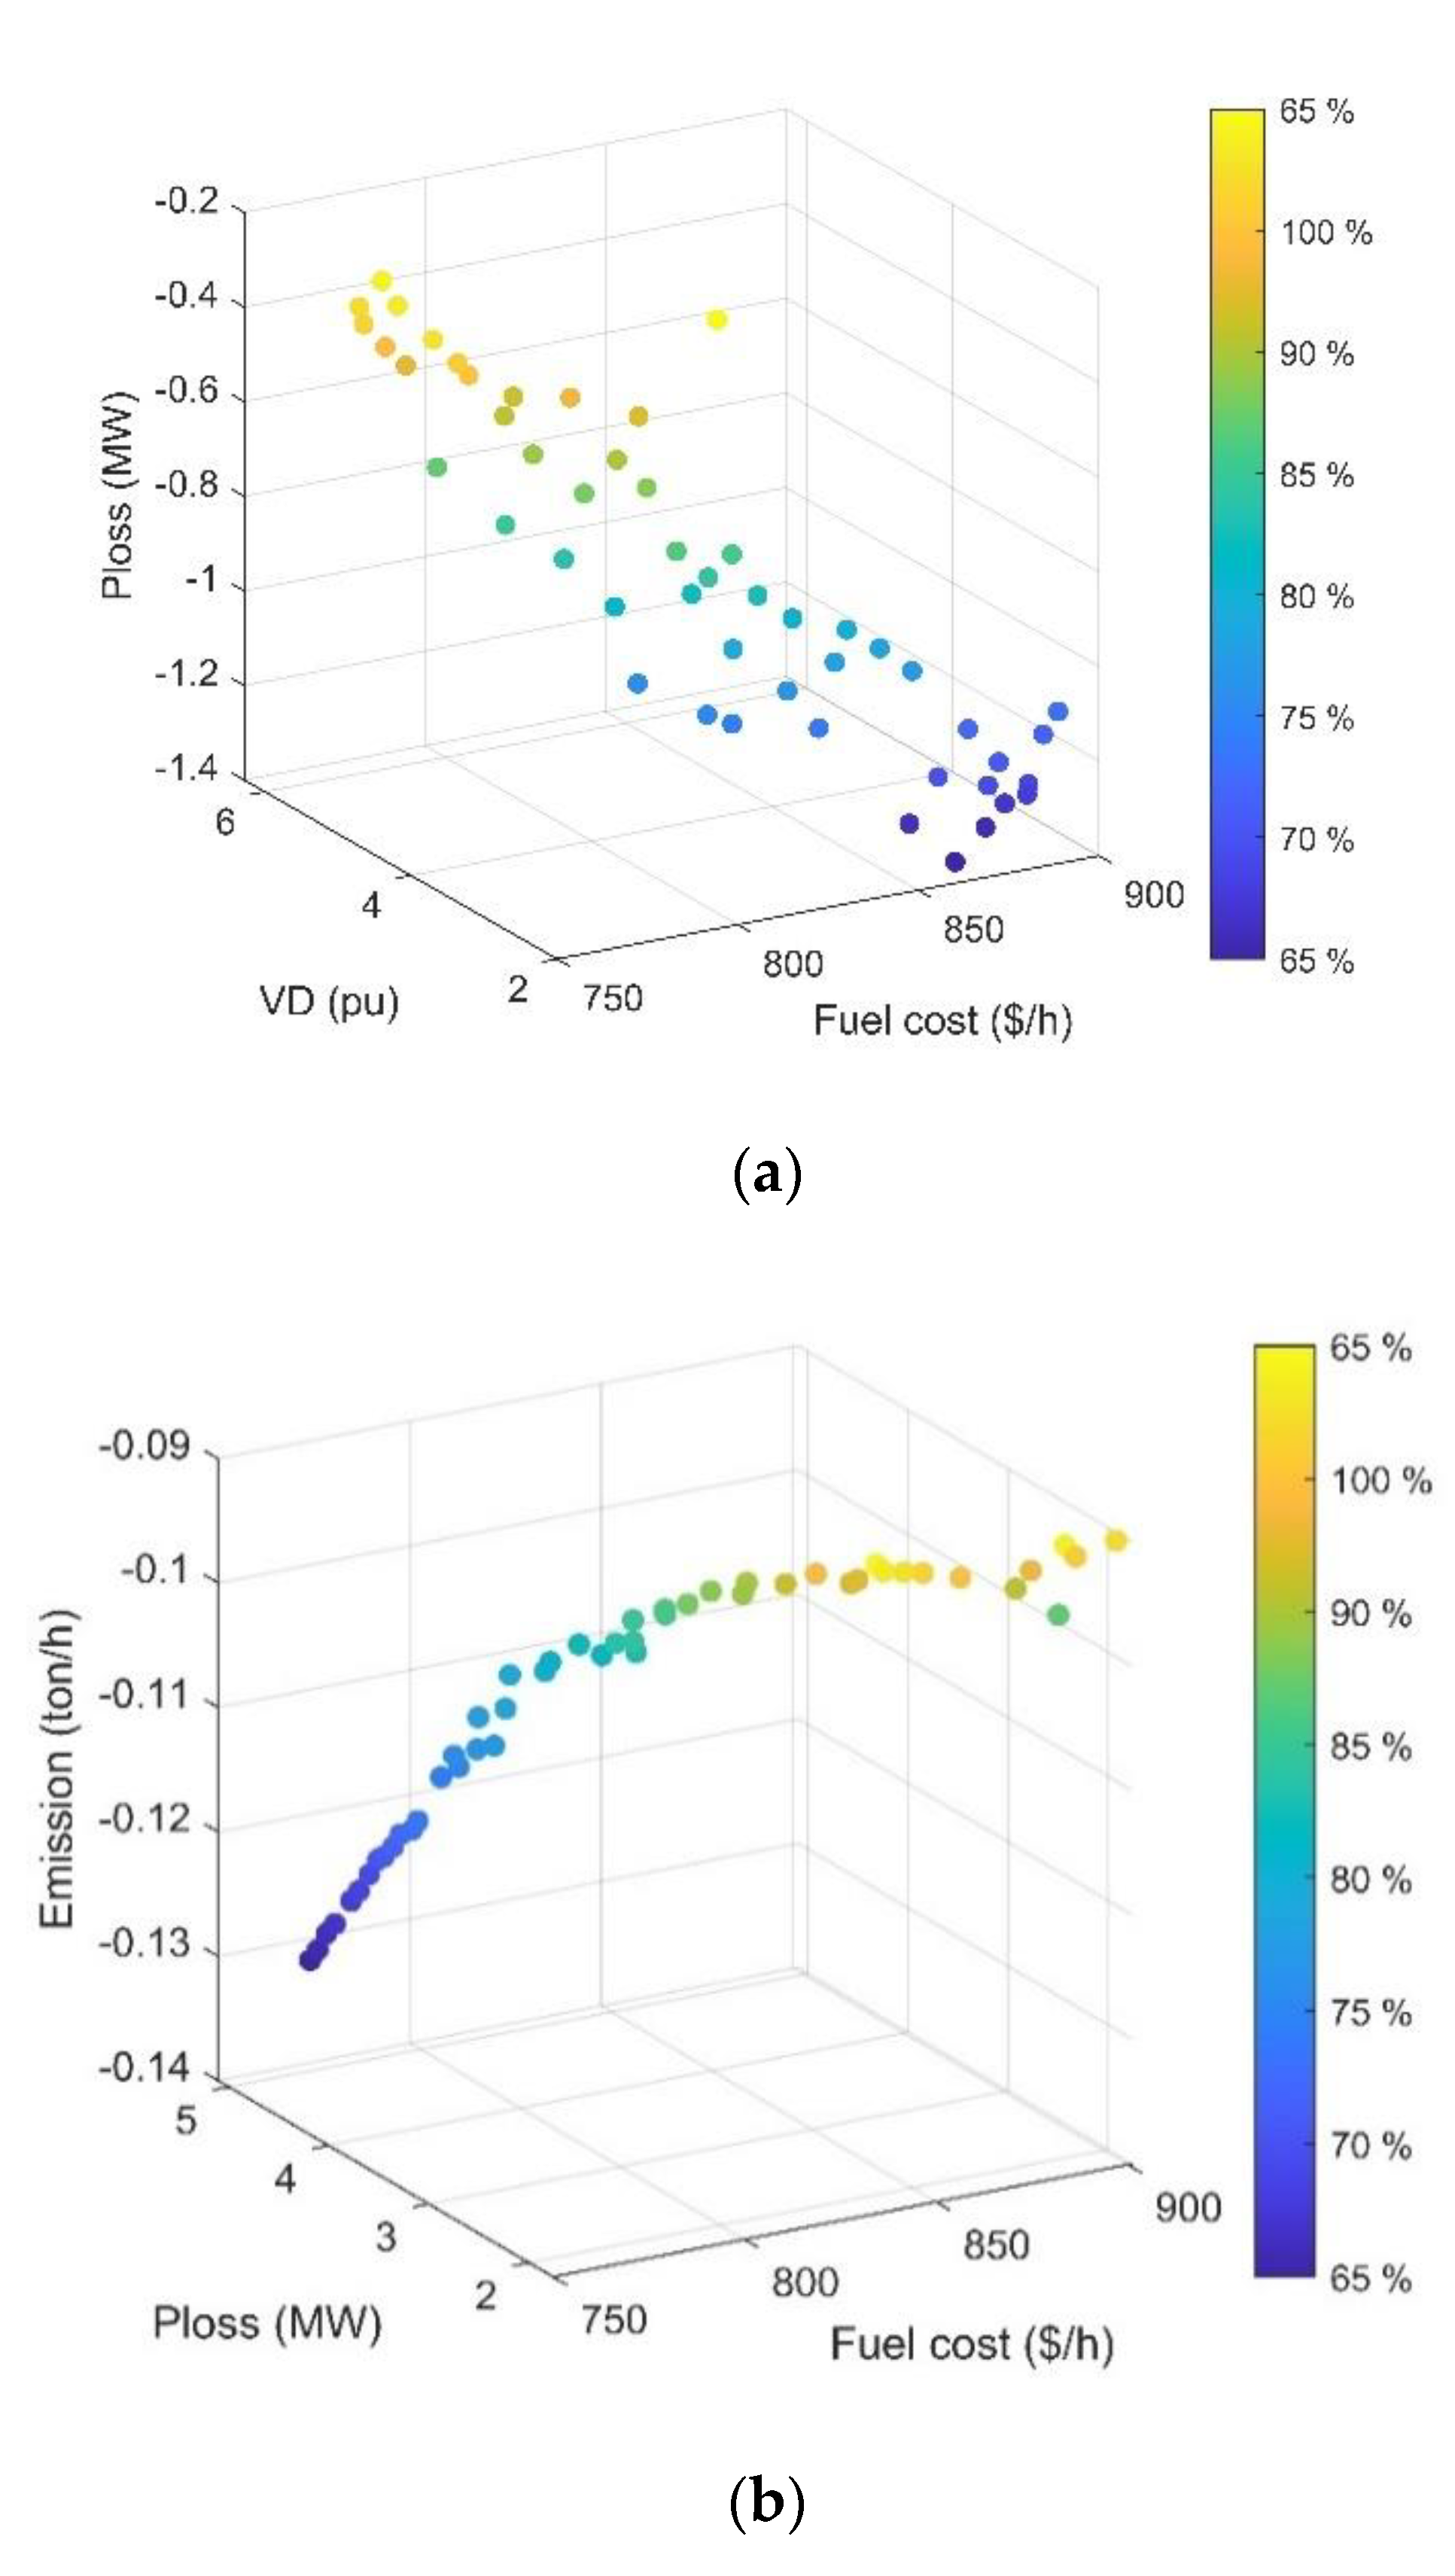
Figure 10.
Pareto fronts with CHIO, ALO, and SSA for Scenario 6–8. (a) Pareto fronts with CHIO, ALO, and SSA for Scenario 6; (b) Pareto fronts with CHIO, ALO, and SSA for Scenario 7; (c) Pareto fronts with CHIO, ALO, and SSA for Scenario 8.
Figure 10.
Pareto fronts with CHIO, ALO, and SSA for Scenario 6–8. (a) Pareto fronts with CHIO, ALO, and SSA for Scenario 6; (b) Pareto fronts with CHIO, ALO, and SSA for Scenario 7; (c) Pareto fronts with CHIO, ALO, and SSA for Scenario 8.
Figure 11.
Pareto fronts with CHIO, ALO, and SSA for Scenarios 9–11: (a) Pareto fronts with CHIO, ALO, and SSA for Scenario 9; (b) Pareto fronts with CHIO, ALO, and SSA for Scenario 10; (c) Pareto fronts with CHIO, ALO, and SSA for Scenario 11.
Figure 11.
Pareto fronts with CHIO, ALO, and SSA for Scenarios 9–11: (a) Pareto fronts with CHIO, ALO, and SSA for Scenario 9; (b) Pareto fronts with CHIO, ALO, and SSA for Scenario 10; (c) Pareto fronts with CHIO, ALO, and SSA for Scenario 11.
Figure 12.
Convergence rates for Scenario 12 with ALO, SSA, and CHIO.
Figure 12.
Convergence rates for Scenario 12 with ALO, SSA, and CHIO.
Figure 13.
Convergence rates for Scenario 13 with ALO, SSA, and CHIO.
Figure 13.
Convergence rates for Scenario 13 with ALO, SSA, and CHIO.
Figure 14.
Convergence rates for Scenario 14 with ALO, SSA, and CHIO.
Figure 14.
Convergence rates for Scenario 14 with ALO, SSA, and CHIO.
Figure 15.
The convergence rate and the Pareto front for the dual-objective for Scenario 15 using the AHP and TOPSIS: (a) convergence rates using the AHP with ALO, SSA, and CHIO; (b) Pareto fronts with CHIO, ALO, and SSA.
Figure 15.
The convergence rate and the Pareto front for the dual-objective for Scenario 15 using the AHP and TOPSIS: (a) convergence rates using the AHP with ALO, SSA, and CHIO; (b) Pareto fronts with CHIO, ALO, and SSA.
Figure 16.
The convergence rate and the Pareto front for the dual objectives for Scenario 16 using AHP and TOPSIS: (a) convergence rates using AHP with ALO, SSA, and CHIO; (b) Pareto fronts with ALO, SSA, and CHIO.
Figure 16.
The convergence rate and the Pareto front for the dual objectives for Scenario 16 using AHP and TOPSIS: (a) convergence rates using AHP with ALO, SSA, and CHIO; (b) Pareto fronts with ALO, SSA, and CHIO.
Table 2.
Optimal location of the RESs in the IEEE 30-bus and IEEE 57-bus schemes.
Table 2.
Optimal location of the RESs in the IEEE 30-bus and IEEE 57-bus schemes.
| Systems | IEEE30-Bus | IEEE57-Bus |
|---|
| Photovoltaic (PV) | Bus 11 | Bus 3 |
| Wind (WP) | Bus 5 | Bus 2 |
| PV + Tidal power (PVTP) | Bus 13 | Bus 9 |
Table 3.
Parameters of the IEEE30-bus and IEEE57-bus systems [
55].
Table 3.
Parameters of the IEEE30-bus and IEEE57-bus systems [
55].
| | IEEE30-Bus | IEEE57-Bus |
|---|
| Elements | Quantity | Parameters | Quantity | Parameters |
|---|
| Generators | 6 | 3 TPGs and 3 RESs | 7 | 4 TPGs and 3 RESs |
| TPGs | 3 | Buses 1(swing), 2, and 8 | 4 | Buses 1 (swing), 6, 8, and 12 |
| RESs | PV | 25 | Bus 11, 75 MW | 75 | Bus 3, 175 MW |
| WP | 1 | Bus 5, 50 MW | 1 | Bus 2, 90 MW |
| PVTP | 1 | Bus 13, 45 + 5 MW | 1 | Bus 9, 75 + 15 MW |
| Static VAR compensator | 9 | Buses 10, 12, 15, 17, 20, 21,
23, 24, and 29 | 3 | Buses 18, 25, and 53 |
| Load connected (P and Q) | - | 283.40 MW and 126.20 MVAr | - | 1250.80 MW and 336.40 MVAr |
| Number of PQ buses | 24 | 24 buses | 50 | 50 buses |
| Load voltage permissible range (pu) | - | 0.950–1.10 | - | 0.950–1.10 |
Table 4.
Description of SOEETD and MOEETD formulation.
Table 4.
Description of SOEETD and MOEETD formulation.
Test
System | EETD Formulation | Economical | Environmental | Technical |
|---|
| No. of Objective Functions | Scenario | Fuel Costs | Emissions | VD | Ploss | L-Max |
|---|
| IEEE-30 | 1 | 1 | ✓ | | | | |
| 2 | | ✓ | | | |
| 3 | | | ✓ | | |
| 4 | | | | ✓ | |
| 5 | | | | | ✓ |
| 2 | 6 | ✓ | ✓ | | | |
| 7 | ✓ | | ✓ | | |
| 8 | ✓ | | | | ✓ |
| 3 | 9 | ✓ | | ✓ | ✓ | |
| 10 | ✓ | ✓ | | ✓ | |
| 11 | ✓ | ✓ | ✓ | | |
| 4 | 12 | ✓ | ✓ | ✓ | ✓ | |
| 5 | 13 | ✓ | ✓ | ✓ | ✓ | ✓ |
| IEEE-57 | 1 | 14 | ✓ | | | | |
| 2 | 15 | ✓ | | ✓ | | |
| 16 | ✓ | ✓ | | | |
Table 5.
Emission and cost coefficients for IEEE 30-bus and IEEE 57-bus of the TPGs [
30].
Table 5.
Emission and cost coefficients for IEEE 30-bus and IEEE 57-bus of the TPGs [
30].
| Emission coefficients |
| Generators | Bus | (t/h) | (t/pu·MWh) | (t/pu·MW2h) |
| |
| IEEE 30-bus |
| TPG1 | 1 | 0.04092 | −0.05553 | 0.0649 | 0.0003 | 6.668 |
| TPG2 | 2 | 0.02543 | −0.06048 | 0.05639 | 0.0006 | 3.334 |
| TPG3 | 8 | 0.05327 | −0.0356 | 0.0339 | 0.003 | 2 |
| IEEE 57-bus |
| TPG1 | 1 | 4.091 | −5.554 | 6.49 | 0.0002 | 0.286 |
| TPG2 | 6 | 2.543 | −6.047 | 5.638 | 0.0005 | 0.333 |
| TPG3 | 8 | 6.131 | −5.55 | 5.151 | 0.0001 | 0.667 |
| TPG4 | 12 | 3.491 | −5.754 | 6.39 | 0.0003 | 0.266 |
| Cost coefficients |
| Generators | Bus |
($/h) |
($/MWh) |
($/MW2h) |
($/h) |
(MW−1) |
| IEEE 30-bus |
| TPG1 | 1 | 30 | 2 | 0.00377 | 18 | 0.038 |
| TPG2 | 2 | 25 | 1.76 | 0.0176 | 16 | 0.039 |
| TPG3 | 8 | 20 | 3.26 | 0.00833 | 12 | 0.046 |
| IEEE 57-bus |
| TPG1 | 1 | 0 | 20 | 0.0775795 | 18 | 0.037 |
| TPG2 | 6 | 0 | 40 | 0.01 | 16 | 0.038 |
| TPG3 | 8 | 0 | 20 | 0.02222 | 13.5 | 0.041 |
| TPG4 | 12 | 0 | 20 | 0.03226 | 18 | 0.037 |
Table 6.
The judgment matrix and the weights.
Table 6.
The judgment matrix and the weights.
| System | Scenario | Judgment Matrix (M) | Weights |
|---|
| IEEE 30-bus | 6 | | 0.6667
0.3333 |
| 7 | | 0.6667
0.3333 |
| 8 | | 0.6667
0.3333 |
| 9 | | 0.5
0.25
0.25 |
| 10 | | 0.44118
0.39706
0.16176 |
| 11 | | 0.44118
0.39706
0.16176 |
| 12 | | 0.34711
0.27273
0.27273
0.10744 |
| 13 | | 0.29032
0.20968
0.20968
0.20968
0.080642 |
| IEEE 57-bus | 15 | | 0.6667
0.3333 |
| 16 | | 0.6667
0.3333 |
Table 7.
Lists of control variables for Scenarios 1–3 for IEEE 30-bus test scheme.
Table 7.
Lists of control variables for Scenarios 1–3 for IEEE 30-bus test scheme.
| Variables and Parameters | Bounds | Scenario #1 | Scenario #2 | Scenario #3 |
|---|
| Min | Max | CHIO | ALO | SSA | CHIO | ALO | SSA | CHIO | ALO | SSA |
|---|
| Active power (MW) | PTPG2 | 20 | 80 | 37.445 | 38.257 | 37.622 | 46.634 | 46.634 | 46.634 | 80 | 53.655 | 60.324 |
| PTPG5 | 10 | 60 | 38.714 | 38.588 | 37.862 | 60 | 58.316 | 59.684 | 60 | 56.919 | 57.537 |
| PTPG8 | 10 | 35 | 10 | 10 | 10 | 35 | 35 | 35 | 35 | 28.991 | 34.084 |
| PTPG11 | 10 | 60 | 40.571 | 38.336 | 41.687 | 56.043 | 59.536 | 59.257 | 29.748 | 57.191 | 55.194 |
| PTPG13 | 10 | 60 | 31.952 | 32.236 | 32.339 | 48.609 | 47.19 | 47.433 | 10 | 17.146 | 10.21 |
| Reactive power (MVAr) | Q2 | −20 | 60 | 10.108 | 21.867 | −20 | 60 | −6.6963 | −20 | −20 | −20 | −20 |
| Q5 | −30 | 35 | 35 | 26.714 | 35 | −30 | 35 | −1.7046 | 35 | 35 | 35 |
| Q8 | −15 | 40 | 40 | 40 | 40 | 40 | −15 | −5.0345 | 40 | 40 | 40 |
| Q11 | −25 | 30 | 18.137 | 18.382 | 21.412 | −6.3482 | 2.2441 | 7.1202 | 36.844 | 39.512 | 39.207 |
| Q13 | −20 | 25 | 22.986 | 22.671 | 21.227 | 10.918 | 25 | 25 | 47.752 | 46.565 | 47.449 |
| Bus voltage (pu) | V1 | 0.96 | 1.10 | 1.1 | 1.1 | 1.1 | 1.1 | 1.0905 | 1.0729 | 1.0489 | 1.0438 | 0.99822 |
| V2 | 0.96 | 1.10 | 1.09 | 1.0918 | 0.99286 | 1.1 | 1.0567 | 0.95162 | 0.95 | 1.0384 | 0.99455 |
| V5 | 0.96 | 1.10 | 1.1 | 1.0722 | 1.0994 | 0.95 | 1.0876 | 0.96103 | 1.1 | 1.0993 | 1.093 |
| V8 | 0.96 | 1.10 | 1.1 | 1.097 | 1.0971 | 1.0918 | 0.95844 | 0.96006 | 1.0877 | 1.0927 | 1.0904 |
| V11 | 0.96 | 1.10 | 1.1 | 1.1 | 1.0991 | 0.96502 | 0.9741 | 0.95096 | 1.1 | 1.1 | 1.1 |
| V13 | 0.96 | 1.10 | 1.1 | 1.0986 | 1.0872 | 1.0163 | 1.0434 | 1.0124 | 1.1 | 1.0973 | 1.098 |
| Wgencost | Not applicable | 115.61 | 115.21 | 112.91 | 194.56 | 187.67 | 193.26 | 194.56 | 182.03 | 184.52 |
| PVgencost | 109.11 | 102.45 | 112.92 | 164.93 | 179.01 | 177.89 | 80.349 | 169.75 | 162.67 |
| PVTPgencost | 96.688 | 97.618 | 97.898 | 156.65 | 151.05 | 152.23 | 48.433 | 59.953 | 49.051 |
| Fuelvlvcost | 447.542 | 454.04 | 445.92 | 332.75 | 332.76 | 332.75 | 543.67 | 414.62 | 456.16 |
| Fuel costs ($/h) | 768.95 | 769.32 | 769.64 | 848.89 | 850.48 | 856.14 | 867.01 | 826.36 | 852.4 |
| VD (pu) | 1.1341 | 1.1054 | 0.90473 | 0.74422 | 0.83431 | 1.5518 | 0.36824 | 0.3779 | 0.3717 |
| Ploss (MW) | 5.54 | 5.6165 | 5.6392 | 4.2397 | 4.6292 | 5.9627 | 4.4902 | 3.9095 | 4.0356 |
| L-index | 0.11186 | 0.11316 | 0.12337 | 0.18187 | 0.19684 | 0.2305 | 0.07990 | 0.0799 | 0.0789 |
| Emissions (ton/h) | 0.15187 | 0.15363 | 0.15086 | 0.09055 | 0.09055 | 0.09055 | 0.10619 | 0.0987 | 0.0988 |
| Computation time (s) | 367.206 | 346.553 | 417.9415 | 361.393 | 413.8874 | 378.9375 | 538.9653 | 55.1077 | 465.364 |
Table 8.
Results of SOEETD problem using three optimization techniques for IEEE 30-bus (Scenarios 1–5).
Table 8.
Results of SOEETD problem using three optimization techniques for IEEE 30-bus (Scenarios 1–5).
| Scenarios | Optimizations | Fuel costs ($/h) | Emissions (ton/h) | VD (pu) | Ploss (MW) | L-Index |
|---|
| Scenario #1 | CHIO | 768.95 | 0.15187 | 1.1341 | 5.54 | 0.11186 |
| ALO | 769.32 | 0.15363 | 1.1054 | 5.6165 | 0.11316 |
| SSA | 769.64 | 0.15086 | 0.90473 | 5.6392 | 0.12337 |
| Scenario #2 | CHIO | 848.89 | 0.09055 | 0.74422 | 4.2397 | 0.18187 |
| ALO | 850.48 | 0.09055 | 0.83431 | 4.6292 | 0.19684 |
| SSA | 856.14 | 0.09055 | 1.5518 | 5.9627 | 0.2305 |
| Scenario #3 | CHIO | 867.01 | 0.10619 | 0.36824 | 4.4902 | 0.07990 |
| ALO | 826.36 | 0.0987 | 0.3779 | 3.9095 | 0.0799 |
| SSA | 852.4 | 0.0988 | 0.3717 | 4.0356 | 0.0789 |
| Scenario #4 | CHIO | 895.88 | 0.10281 | 1.3265 | 2.0661 | 0.1013 |
| ALO | 911.08 | 0.10922 | 1.3251 | 2.0724 | 0.10073 |
| SSA | 872.76 | 0.095233 | 1.322 | 2.0848 | 0.10155 |
| Scenario #5 | CHIO | 911.81 | 0.10833 | 0.4257 | 2.6828 | 0.071587 |
| ALO | 913.04 | 0.10822 | 0.42521 | 2.6832 | 0.071614 |
| SSA | 911.05 | 0.10792 | 0.42566 | 2.667 | 0.071596 |
Table 9.
Comparative analysis for SO functions for IEEE 30-bus test scheme (Scenarios 1–5) (The numbers in bold are the best values found).
Table 9.
Comparative analysis for SO functions for IEEE 30-bus test scheme (Scenarios 1–5) (The numbers in bold are the best values found).
| Scenarios | Scenario #1 | Scenario #2 | Scenario #3 | Scenario #4 | Scenario #5 |
|---|
| IGWO [52] | 811.838 | 0.09783 | - | 2.3584 | - |
| DA-PSO [37] | 802.12 | 0.205 | - | 3.189 | - |
| MOALO [70] | 799.14 | - | - | - | - |
| MODA [71] | 802.32 | - | - | - | - |
| WOA-PS [71] | 799.56 | 0.206 | - | 2.967 | - |
| PSO-SSO [72] | 798.98 | 0.205 | 1.25 | 2.858 | 0.124 |
| ECBO [73] | 799.035 | - | - | - | - |
| ECHT [36] | 800.41 | 0.205 | - | 3.084 | 0.136 |
| DA-APSO [74] | 802.63 | - | - | 3.003 | - |
| MVO [75] | 799.24 | - | - | 2.881 | 0.115 |
| ALO | 769.32 | 0.090553 | 0.37794 | 2.0724 | 0.071614 |
| SSA | 769.64 | 0.090553 | 0.37173 | 2.0848 | 0.071596 |
| CHIO | 768.95 | 0.090550 | 0.36824 | 2.0661 | 0.071587 |
Table 10.
Lists of control variables for Scenarios 6–8 for IEEE 30-bus test scheme: AHP-based solutions (The numbers in bold are the best values found).
Table 10.
Lists of control variables for Scenarios 6–8 for IEEE 30-bus test scheme: AHP-based solutions (The numbers in bold are the best values found).
| Variables and Parameters | Bounds | Scenario #6 | Scenario #7 | Scenario #8 |
|---|
| Min | Max | CHIO | ALO | SSA | CHIO | ALO | SSA | CHIO | ALO | SSA |
|---|
| Active power (MW) | PTPG2 | 20 | 80 | 36.731 | 36.279 | 38.165 | 37.265 | 36.304 | 38.277 | 37.393 | 37.786 | 37.368 |
| PTPG5 | 10 | 60 | 38.259 | 39.366 | 38.253 | 38.639 | 39.291 | 38.74 | 38.683 | 38.721 | 39.174 |
| PTPG8 | 10 | 35 | 10 | 10.001 | 10.794 | 10 | 10 | 10 | 10 | 10 | 10 |
| PTPG11 | 0 | 60 | 43.679 | 42.398 | 38.918 | 40.932 | 42.481 | 43.261 | 40.947 | 37.993 | 36.702 |
| PTPG13 | 10 | 60 | 32.958 | 31.971 | 32.57 | 32.446 | 31.727 | 31.403 | 31.862 | 32.205 | 33.668 |
| Reactive power (MVAr) | Q2 | −20 | 60 | 10.833 | 10.874 | 9.6167 | 18.225 | 11.811 | −20 | 11.203 | 11.39 | 19.449 |
| Q5 | −30 | 35 | 35 | 35 | 35 | 24.834 | 35 | 35 | 35 | 35 | 26.742 |
| Q8 | −15 | 40 | 40 | 40 | 40 | 40 | 40 | 40 | 40 | 40 | 40 |
| Q11 | −25 | 30 | 19.086 | 18.154 | 18.192 | 21.655 | 19.127 | 22.201 | 18.895 | 18.226 | 19.549 |
| Q13 | −20 | 25 | 19.924 | 22.768 | 22.559 | 14.549 | 16.545 | 19.504 | 20.235 | 22.113 | 19.33 |
| Bus voltage (pu) | V1 | 0.96 | 1.10 | 1.1 | 1.1 | 1.1 | 1.1 | 1.1 | 1.1 | 1.1 | 1.1 | 1.1 |
| V2 | 0.96 | 1.10 | 1.0899 | 1.0905 | 1.0897 | 1.0879 | 1.089 | 0.9585 | 1.0899 | 1.0901 | 1.09 |
| V5 | 0.96 | 1.10 | 1.1 | 1.0996 | 1.0894 | 1.0655 | 1.1 | 1.0985 | 1.1 | 1.0993 | 1.0702 |
| V8 | 0.96 | 1.10 | 1.1 | 1.0999 | 1.0769 | 1.1 | 1.0874 | 1.0692 | 1.1 | 1.0955 | 1.0763 |
| V11 | 0.96 | 1.10 | 1.1 | 1.1 | 1.1 | 1.1 | 1.0966 | 1.1 | 1.1 | 1.1 | 1.1 |
| V13 | 0.96 | 1.10 | 1.0913 | 1.0997 | 1.0987 | 1.0721 | 1.0798 | 1.0823 | 1.0919 | 1.0975 | 1.088 |
| Wgencost | Not applicable | 114.16 | 117.71 | 114.14 | 115.37 | 117.47 | 115.7 | 115.51 | 115.63 | 117.09 |
| PVgencost | 119.65 | 115.73 | 104.92 | 110.19 | 115.64 | 118.66 | 110.68 | 101.58 | 98.182 |
| PVTPgencost | 99.824 | 96.776 | 98.611 | 98.248 | 96.042 | 95.024 | 96.568 | 97.476 | 102.11 |
| Fuelvlvcost | 436.16 | 439.69 | 452.51 | 445.08 | 440.45 | 441.12 | 446.73 | 454.86 | 452.84 |
| Fuel costs ($/h) | 769.79 | 769.91 | 770.19 | 768.89 | 769.6 | 770.5 | 769.49 | 769.55 | 770.22 |
| VD (pu) | 1.0767 | 1.1414 | 1.1208 | 0.87394 | 0.96677 | 0.88008 | 1.0753 | 1.1121 | 1.0101 |
| Ploss (MW) | 5.3788 | 5.4231 | 5.5705 | 5.4964 | 5.4415 | 5.5104 | 5.5244 | 5.6632 | 5.627 |
| L-index | 0.11387 | 0.11146 | 0.11234 | 0.12229 | 0.1179 | 0.12414 | 0.11259 | 0.11388 | 0.11691 |
| Emissions (ton/h) | 0.1478 | 0.15006 | 0.15161 | 0.15101 | 0.15036 | 0.14771 | 0.15158 | 0.15475 | 0.15446 |
| Execution time (s) | 385.0354 | 353.1225 | 384.7674 | 343.9965 | 348.5127 | 430.5964 | 309.6968 | 408.3730 | 391.4846 |
Table 11.
Numerical results of Scenarios 6–8 for IEEE 30-bus test scheme “Dual-objectives”.
Table 11.
Numerical results of Scenarios 6–8 for IEEE 30-bus test scheme “Dual-objectives”.
| Scenarios | Scenario #6 | Scenario #7 | Scenario #8 |
|---|
| Optimizations | CHIO | ALO | SSA | CHIO | ALO | SSA | CHIO | ALO | SSA |
|---|
| Fuel costs ($/h) | 769.79 | 769.91 | 770.19 | 768.89 | 769.6 | 770.5 | 769.49 | 769.55 | 770.22 |
| Emissions (ton/h) | 0.1478 | 0.1501 | 0.1516 | 0.1510 | 0.1504 | 0.1477 | 0.1516 | 0.1548 | 0.1545 |
| VD (pu) | 1.0767 | 1.1414 | 1.1208 | 0.8739 | 0.9668 | 0.8801 | 1.0753 | 1.1121 | 1.0101 |
| Ploss (MW) | 5.3788 | 5.4231 | 5.5705 | 5.4964 | 5.4415 | 5.5104 | 5.5244 | 5.6632 | 5.627 |
| L-index | 0.1139 | 0.1115 | 0.1123 | 0.1223 | 0.1179 | 0.1241 | 0.1139 | 0.1126 | 0.1169 |
Table 12.
Lists of control variables for Scenarios 6–8 for IEEE 30-bus test scheme: TOPSIS-based solutions (The numbers in bold are the best values found).
Table 12.
Lists of control variables for Scenarios 6–8 for IEEE 30-bus test scheme: TOPSIS-based solutions (The numbers in bold are the best values found).
| Variables and Parameters | Bounds | Scenario #6 | Scenario #7 | Scenario #8 |
|---|
| Min | Max | CHIO | ALO | SSA | CHIO | ALO | SSA | CHIO | ALO | SSA |
|---|
| Active power (MW) | PTPG2 | 0 | 80 | 47.845 | 48.982 | 46.078 | 45.621 | 40.152 | 66.178 | 39.117 | 47.489 | 42.04 |
| PTPG5 | 10 | 60 | 49.719 | 53.164 | 51.233 | 24.064 | 55.8 | 40.281 | 42.978 | 42.409 | 45.261 |
| PTPG8 | 10 | 35 | 33.338 | 29.341 | 30.902 | 22.187 | 31.809 | 26.5 | 30.152 | 33.634 | 34.153 |
| PTPG11 | 0 | 60 | 54.086 | 54.074 | 54.865 | 38.309 | 42.535 | 39.127 | 45.717 | 55.79 | 44.429 |
| PTPG13 | 10 | 60 | 41.396 | 42.335 | 44.852 | 20.455 | 18.392 | 21.337 | 36.454 | 36.587 | 41.89 |
| Reactive power (MVAr) | Q2 | −20 | 60 | −19.618 | 12.779 | −20 | −20 | −20 | 60 | −20 | −20 | −20 |
| Q5 | −30 | 35 | 34.737 | 35 | 35 | 35 | 35 | −17.095 | 35 | 35 | 35 |
| Q8 | −15 | 40 | 40 | 40 | 40 | 72.152 | 40 | 40 | 40 | 40 | 40 |
| Q11 | −25 | 30 | 20.212 | 15.917 | 11.242 | 31.598 | 38.362 | 30 | 43.473 | 39.702 | 38.295 |
| Q13 | −20 | 25 | 25 | 19.142 | 25 | 29.794 | 47.92 | 25 | 46.347 | 47.177 | 46.652 |
| Bus voltage (pu) | V1 | 0.96 | 1.10 | 1.0659 | 1.0995 | 1.0533 | 0.96637 | 1.0343 | 0.97412 | 1.0226 | 1.0384 | 0.99867 |
| V2 | 0.96 | 1.10 | 1.052 | 1.0989 | 0.97869 | 0.97955 | 1.0103 | 1.0998 | 0.99434 | 1.019 | 0.96053 |
| V5 | 0.96 | 1.10 | 1.0491 | 1.0989 | 1.0657 | 1.0446 | 1.0825 | 0.98497 | 1.0773 | 1.0997 | 1.0447 |
| V8 | 0.96 | 1.10 | 1.0624 | 1.0995 | 1.0687 | 1.0366 | 1.0743 | 1.0966 | 1.0753 | 1.0985 | 1.0639 |
| V11 | 0.96 | 1.10 | 1.0734 | 1.0988 | 1.0218 | 1.09 | 1.1 | 1.1 | 1.0962 | 1.1 | 1.1 |
| V13 | 0.96 | 1.10 | 1.0808 | 1.0981 | 1.0548 | 1.0662 | 1.1 | 1.0963 | 1.0829 | 1.1 | 1.1 |
| Wgencost | Not applicable | 154.01 | 167.18 | 159.74 | 75.685 | 177.55 | 120.69 | 129.76 | 127.81 | 137.73 |
| PVgencost | 157.51 | 157.62 | 160.32 | 102.42 | 116.29 | 105.3 | 126.84 | 164.06 | 122.63 |
| PVTPgencost | 128.89 | 132.48 | 141.83 | 66.546 | 62.286 | 68.505 | 111.31 | 111.82 | 130.62 |
| Fuelvlvcost | 375.16 | 359.52 | 356.61 | 559.47 | 448.08 | 512.21 | 424.55 | 406.85 | 412.72 |
| Fuel costs ($/h) | 815.57 | 816.8 | 818.5 | 804.13 | 804.21 | 806.7 | 792.46 | 810.54 | 803.7 |
| VD (pu) | 0.54468 | 1.3086 | 0.53194 | 0.37806 | 0.38057 | 0.39431 | 0.55733 | 0.39718 | 0.39866 |
| Ploss (MW) | 3.086 | 2.7679 | 3.2697 | 8.0997 | 4.7286 | 5.3882 | 5.0538 | 4.1804 | 4.3633 |
| L-index | 0.11179 | 0.1011 | 0.13014 | 0.088852 | 0.08199 | 0.1176 | 0.079419 | 0.08353 | 0.08072 |
| Emissions (ton/h) | 0.092838 | 0.09288 | 0.09303 | 0.17045 | 0.11515 | 0.11512 | 0.11124 | 0.09741 | 0.10176 |
| Computation time (s) | 1070.14 | 318.07 | 441.79 | 1260.03 | 403.06 | 501.39 | 1265.38 | 433.11 | 466.480 |
Table 13.
Comparative analysis for dual objective functions (Scenarios 6–8).
Table 13.
Comparative analysis for dual objective functions (Scenarios 6–8).
| Scenarios | Scenario #6 | Scenario #7 | Scenario #8 |
|---|
| Objective Functions | Fuel Costs ($/h) | Emissions (ton/h) | Fuel Costs ($/h) | VD (pu) | Fuel Costs ($/h) | L-Index |
|---|
| MOMICA [34] | 865.06 | 0.222 | 804.96 | 0.095 | - | - |
| MOFA-CPA [33] | 852.02 | 0.279 | - | - | - | - |
| MODA [37] | 838.604 | 0.254 | 807.2807 | 0.023 | - | - |
| PSO-SSO [72] | 834.804 | 0.243 | 803.99 | 0.094 | 830.35 | 0.125 |
| ECHT [36] | - | - | 803.72 | 0.095 | - | - |
| DA-APSO [74] | - | - | 802.63 | 0.116 | - | - |
| ALO | 769.91 | 0.15006 | 769.6 | 0.96677 | 769.55 | 0.11388 |
| SSA | 770.19 | 0.15161 | 770.5 | 0.88008 | 770.22 | 0.11259 |
| CHIO | 769.79 | 0.1478 | 768.89 | 0.87394 | 769.49 | 0.11691 |
Table 14.
Lists of control variables for Scenarios 9–11 for IEEE 30-bus test scheme: AHP-based solutions (The numbers in bold are the best values found).
Table 14.
Lists of control variables for Scenarios 9–11 for IEEE 30-bus test scheme: AHP-based solutions (The numbers in bold are the best values found).
| Variables and Parameters | Bounds | Scenario #9 | Scenario #10 | Scenario #11 |
|---|
| Min | Max | CHIO | ALO | SSA | CHIO | ALO | SSA | CHIO | ALO | SSA |
|---|
| Active power (MW) | PTPG2 | 0 | 80 | 37.915 | 37.263 | 37.519 | 37.575 | 37.915 | 36.998 | 36.901 | 37.704 | 38.33 |
| PTPG5 | 10 | 60 | 39.431 | 39.388 | 39.224 | 39.494 | 39.405 | 39.785 | 38.405 | 37.865 | 36.99 |
| PTPG8 | 10 | 35 | 10 | 10 | 10 | 10 | 10 | 10.017 | 10 | 10 | 10.183 |
| PTPG11 | 0 | 60 | 37.924 | 38.554 | 42.819 | 41.433 | 41.144 | 42.807 | 43.679 | 37.467 | 39.543 |
| PTPG13 | 10 | 60 | 33.009 | 33.044 | 32.741 | 32.477 | 33.166 | 32.29 | 31.781 | 33.385 | 32.736 |
| Reactive power (MVAr) | Q2 | −20 | 60 | 18.253 | 19.472 | 16.951 | 17.964 | 18.299 | 18.561 | 18.407 | 16.73 | 17.025 |
| Q5 | −30 | 35 | 24.857 | 26.403 | 23.888 | 25.398 | 26.694 | 28.245 | 24.611 | 24.745 | 24.721 |
| Q8 | −15 | 40 | 40 | 40 | 40 | 40 | 40 | 40 | 40 | 40 | 40 |
| Q11 | −25 | 30 | 21.124 | 18.252 | 20.827 | 19.39 | 18.651 | 19.265 | 23.083 | 20.747 | 21.473 |
| Q13 | −20 | 25 | 15.705 | 19.236 | 17.916 | 21.272 | 22.718 | 20.103 | 10.631 | 16.58 | 14.895 |
| Bus voltage (pu) | V1 | 0.96 | 1.10 | 1.1 | 1.1 | 1.1 | 1.1 | 1.1 | 1.1 | 1.1 | 1.1 | 1.1 |
| V2 | 0.96 | 1.10 | 1.0882 | 1.0896 | 1.0883 | 1.0899 | 1.0909 | 1.091 | 1.0871 | 1.0872 | 1.0871 |
| V5 | 0.96 | 1.10 | 1.0661 | 1.0692 | 1.0658 | 1.0695 | 1.072 | 1.0734 | 1.0638 | 1.0646 | 1.064 |
| V8 | 0.96 | 1.10 | 1.0995 | 1.099 | 1.0908 | 1.1 | 1.0988 | 1.0919 | 1.098 | 1.0784 | 1.0962 |
| V11 | 0.96 | 1.10 | 1.1 | 1.0946 | 1.1 | 1.1 | 1.1 | 1.1 | 1.1 | 1.0986 | 1.0991 |
| V13 | 0.96 | 1.10 | 1.0758 | 1.086 | 1.0824 | 1.0934 | 1.0985 | 1.0912 | 1.0597 | 1.0774 | 1.0723 |
| Wgencost | Not applicable | 117.92 | 117.78 | 117.25 | 118.12 | 117.83 | 119.07 | 114.63 | 112.92 | 110.18 |
| PVgencost | 101.29 | 102.96 | 117.07 | 112.26 | 112.23 | 116.7 | 119.65 | 100.3 | 105.73 |
| PVTPgencost | 100.07 | 100.15 | 99.192 | 98.338 | 100.51 | 97.759 | 96.223 | 101.19 | 99.137 |
| Fuelvlvcost | 450.24 | 448.3 | 436.4 | 440.65 | 439.73 | 436.03 | 439.35 | 455.56 | 453.9 |
| Fuel costs ($/h) | 769.19 | 769.53 | 769.91 | 769.38 | 770.3 | 769.56 | 769.85 | 769.97 | 768.95 |
| VD (pu) | 0.89865 | 0.96724 | 0.95242 | 1.0514 | 1.1035 | 1.0609 | 0.78891 | 0.88963 | 0.85853 |
| Ploss (MW) | 5.5598 | 5.547 | 5.3219 | 5.3811 | 5.367 | 5.3112 | 5.4224 | 5.6972 | 5.6488 |
| L-index | 0.12136 | 0.11871 | 0.11957 | 0.11559 | 0.11345 | 0.11468 | 0.1258 | 0.12208 | 0.1232 |
| Emissions (ton/h) | 0.15239 | 0.1525 | 0.14674 | 0.14855 | 0.14763 | 0.14732 | 0.14897 | 0.15521 | 0.15312 |
| Execution time (s) | 279.63 | 347.842 | 362.581 | 274.884 | 375.193 | 384.989 | 272.287 | 364.287 | 385.129 |
Table 15.
Lists of control variables for Scenarios 9–11 for IEEE 30-bus test scheme: TOPSIS-based solutions (The numbers in bold are the best values found).
Table 15.
Lists of control variables for Scenarios 9–11 for IEEE 30-bus test scheme: TOPSIS-based solutions (The numbers in bold are the best values found).
| Variables and Parameters | Bounds | Scenario #9 | Scenario #10 | Scenario #11 |
|---|
| Min | Max | CHIO | ALO | SSA | CHIO | ALO | SSA | CHIO | ALO | SSA |
|---|
| Active power (MW) | PTPG2 | 0 | 80 | 45.405 | 48.361 | 62.321 | 46.448 | 53.022 | 45.228 | 57.368 | 48.538 | 49.279 |
| PTPG5 | 10 | 60 | 55.529 | 50.909 | 52.175 | 71.7 | 56.496 | 54.824 | 49.2 | 46.063 | 48.875 |
| PTPG8 | 10 | 35 | 32.838 | 26.289 | 30.04 | 34.277 | 29.567 | 29.562 | 31.29 | 25.863 | 26.658 |
| PTPG11 | 0 | 60 | 42.484 | 55.725 | 51.342 | 59.487 | 57.34 | 51.823 | 51.129 | 51.793 | 50.458 |
| PTPG13 | 10 | 60 | 34.013 | 43.227 | 25.283 | 40.994 | 41.834 | 42.571 | 39.104 | 43.911 | 39.191 |
| Reactive power (MVAr) | Q2 | −20 | 60 | −20 | 15.13 | −20 | 13.944 | −3.0635 | −20 | −20 | −2.0587 | 32.849 |
| Q5 | −30 | 35 | 35 | 32.075 | 35 | 23.902 | 34.535 | 35 | 35 | 35 | 19.43 |
| Q8 | −15 | 40 | 40 | 40 | 40 | 40 | 40 | 40 | 33.567 | 40 | 40 |
| Q11 | −25 | 30 | 23.42 | 19.691 | 21.981 | 17.235 | 16.358 | 11.408 | 25.992 | 19.223 | 18.668 |
| Q13 | −20 | 25 | 18.363 | 12.202 | 25 | 19.746 | 18.545 | 18.641 | 24.103 | 21.071 | 25 |
| Bus voltage (pu) | V1 | 0.96 | 1.10 | 1.0745 | 1.0734 | 1.0649 | 1.095 | 1.0915 | 1.0813 | 1.0526 | 1.0631 | 1.0155 |
| V2 | 0.96 | 1.10 | 1.0537 | 1.0697 | 1.0252 | 1.0947 | 1.0846 | 1.0137 | 0.96787 | 1.054 | 1.0201 |
| V5 | 0.96 | 1.10 | 1.0716 | 1.0596 | 1.0815 | 1.0859 | 1.0813 | 1.0654 | 1.0569 | 1.0653 | 0.99491 |
| V8 | 0.96 | 1.10 | 1.0651 | 1.0713 | 1.0763 | 1.0983 | 1.0869 | 1.0725 | 1.0326 | 1.0621 | 1.0204 |
| V11 | 0.96 | 1.10 | 1.0899 | 1.0729 | 1.0787 | 1.097 | 1.0851 | 1.0479 | 1.0754 | 1.0661 | 1.025 |
| V13 | 0.96 | 1.10 | 1.065 | 1.0468 | 1.0787 | 1.0955 | 1.0831 | 1.059 | 1.0594 | 1.0612 | 1.0585 |
| Wgencost | Not applicable | 176.48 | 158.51 | 163.35 | 244.28 | 180.33 | 173.68 | 152.07 | 140.59 | 150.86 |
| PVgencost | 115.16 | 163.95 | 147.25 | 177.97 | 169.19 | 148.74 | 146.02 | 149.08 | 143.64 |
| PVTPgencost | 103.26 | 135.73 | 77.989 | 127.38 | 130.44 | 133.12 | 120.58 | 138.35 | 120.81 |
| Fuelvlvcost | 406.04 | 355.05 | 429.43 | 308.98 | 349.31 | 357.93 | 397.85 | 376.03 | 386.85 |
| Fuel costs ($/h) | 800.93 | 813.24 | 818.02 | 858.61 | 829.27 | 813.47 | 816.52 | 804.05 | 802.16 |
| VD (pu) | 0.59367 | 0.50992 | 0.53133 | 1.2231 | 0.96821 | 0.48706 | 0.43323 | 0.46179 | 0.73504 |
| Ploss (MW) | 3.3057 | 3.06 | 3.326 | 1.9072 | 2.5598 | 3.0963 | 3.2613 | 3.5004 | 3.7856 |
| L-index | 0.11386 | 0.11634 | 0.11076 | 0.10076 | 0.10914 | 0.12837 | 0.11684 | 0.11521 | 0.12004 |
| Emissions (ton/h) | 0.09912 | 0.09411 | 0.09662 | 0.091123 | 0.09144 | 0.09394 | 0.093589 | 0.09718 | 0.09799 |
| Computation time (s) | 995.1156 | 318.7531 | 524.7601 | 1000.5954 | 302.5808 | 425.4336 | 1186.5667 | 322.3311 | 431.3868 |
Table 16.
Comparative analysis for triple-objective functions (Scenarios 9–11) (The numbers in bold are the best values found).
Table 16.
Comparative analysis for triple-objective functions (Scenarios 9–11) (The numbers in bold are the best values found).
| Scenarios | Scenario #9 | Scenario #10 | Scenario #11 |
|---|
| Objective Functions | Fuel Costs ($/h) | VD (pu) | Power Losses (MW) | Fuel Costs ($/h) | Emissions (ton/h) | Power Losses (MW) | Fuel Costs ($/h) | Emissions (ton/h) | VD (pu) |
|---|
| MOFA-CPA [33] | - | - | - | 878.13 | 0.2165 | 3.9232 | - | - | - |
| MODA [37] | - | - | - | 867.9070 | 0.2640 | 4.5342 | - | - | - |
| PSO-SSO [72] | 864.27 | 0.316 | 4.545 | 865.18 | 0.224 | 4.093 | 804.332 | 0.346 | 0.164 |
| ALO | 769.19 | 0.96724 | 5.547 | 770.3 | 0.14763 | 5.367 | 769.97 | 0.15521 | 0.88963 |
| SSA | 769.91 | 0.95242 | 5.3219 | 769.56 | 0.14732 | 5.3112 | 768.95 | 0.15312 | 0.85853 |
| CHIO | 769.53 | 0.89865 | 5.5598 | 769.38 | 0.14855 | 5.3811 | 769.85 | 0.14897 | 0.78891 |
Table 17.
Lists of control variables for Scenario 12 for IEEE 30-bus test scheme: TOPSIS-based solutions (The numbers in bold are the best values found).
Table 17.
Lists of control variables for Scenario 12 for IEEE 30-bus test scheme: TOPSIS-based solutions (The numbers in bold are the best values found).
| Variables and Parameters | Min. | Max. | CHIO | ALO | SSA |
|---|
| Active power (MW) | PTG2 | 20 | 80 | 48.714 | 50.953 | 47.125 |
| PTG5 | 10 | 60 | 48.81 | 54.609 | 50.637 |
| PTG8 | 10 | 35 | 27.752 | 33.426 | 31.178 |
| PTG11 | 10 | 60 | 54.453 | 48.113 | 54.953 |
| PTG13 | 10 | 48.652 | 39.445 | 36.464 | 43.843 |
| Reactive power (MVAr) | Q2 | −20 | 60 | 33.559 | 6.7174 | −20 |
| Q5 | −30 | 35 | 26.541 | 35 | 28.401 |
| Q8 | −15 | 40 | 40 | 38.79 | 40 |
| Q11 | −25 | 30 | 16.525 | 17.953 | 16.23 |
| Q13 | −20 | 25 | 14.031 | 14.739 | 12.23 |
| Bus voltage (pu) | V1 | 0.96 | 1.10 | 1.071 | 1.0769 | 1.0804 |
| V2 | 0.96 | 1.10 | 1.0723 | 1.0716 | 0.99356 |
| V5 | 0.96 | 1.10 | 1.0543 | 1.074 | 1.0452 |
| V8 | 0.96 | 1.10 | 1.0697 | 1.0619 | 1.05 |
| V11 | 0.96 | 1.10 | 1.0634 | 1.0759 | 1.0526 |
| V13 | 0.96 | 1.10 | 1.0499 | 1.0581 | 1.0363 |
| Wgencost | Not applicable | 150.62 | 172.84 | 157.47 |
| PVgencost | 159.28 | 134.89 | 160.63 |
| PVTPgencost | 121.73 | 111.72 | 138.18 |
| Fuelvlvcost | 375.46 | 392.93 | 361.45 |
| Total cost ($/h) | 807.09 | 812.37 | 817.74 |
| VD (pu) | 0.4942 | 0.59979 | 0.46338 |
| Ploss (MW) | 3.2669 | 2.9596 | 3.1828 |
| L-index | 0.11517 | 0.11298 | 0.13688 |
| Emission (ton/h) | 0.095747 | 0.093889 | 0.092843 |
| Computation time (s) | 1070.1630 | 302.5195 | 404.1681 |
Table 18.
Lists of control variables for Scenario 13 for IEEE 30-bus test scheme: TOPSIS-based solutions (The numbers in bold are the best values found).
Table 18.
Lists of control variables for Scenario 13 for IEEE 30-bus test scheme: TOPSIS-based solutions (The numbers in bold are the best values found).
| Variables and Parameters | Min | Max | CHIO | ALO | SSA |
|---|
| Active power (MW) | PTG2 | 20 | 80 | 73.507 | 47.479 | 47.016 |
| PTG5 | 10 | 60 | 54.844 | 45.5 | 47.761 |
| PTG8 | 10 | 35 | 33.146 | 25.043 | 33.585 |
| PTG11 | 10 | 60 | 56.072 | 46.144 | 46.941 |
| PTG13 | 10 | 48.652 | 38.813 | 35.025 | 40.565 |
| Reactive power (MVAr) | Q2 | −20 | 60 | −20 | 1.6023 | 33.452 |
| Q5 | −30 | 35 | 35 | 31.742 | 6.0559 |
| Q8 | −15 | 40 | 40 | 40 | 40 |
| Q11 | −25 | 30 | 37.94 | 20.115 | 24.597 |
| Q13 | −20 | 25 | 44.923 | 25 | 25 |
| Bus voltage (pu) | V1 | 0.96 | 1.10 | 1.0326 | 1.0659 | 1.0516 |
| V2 | 0.96 | 1.10 | 0.97156 | 1.0572 | 1.0502 |
| V5 | 0.96 | 1.10 | 1.0951 | 1.0475 | 1.0134 |
| V8 | 0.96 | 1.10 | 1.0909 | 1.0718 | 1.0592 |
| V11 | 0.96 | 1.10 | 1.0948 | 1.0763 | 1.0775 |
| V13 | 0.96 | 1.10 | 1.0941 | 1.0916 | 1.0695 |
| Wgencost | Not applicable | 173.76 | 138.58 | 146.75 |
| PVgencost | 164.98 | 128.43 | 131.24 |
| PVTPgencost | 119.51 | 106.59 | 125.99 |
| Fuelvlvcost | 406 | 414.66 | 400.5 |
| Total cost ($/h) | 864.25 | 788.26 | 804.47 |
| VD (pu) | 0.39559 | 0.55259 | 0.42219 |
| Ploss (MW) | 3.1204 | 3.9664 | 3.4982 |
| L-index | 0.075979 | 0.11077 | 0.10948 |
| Emission (ton/h) | 0.096721 | 0.10653 | 0.096649 |
| Computation time (s) | 991.7640 | 347.8191 | 358.4133 |
Table 19.
Comparative analysis for quad and quanta objective functions (Scenarios 12 and 13) (The numbers in bold are the best values found).
Table 19.
Comparative analysis for quad and quanta objective functions (Scenarios 12 and 13) (The numbers in bold are the best values found).
| Scenarios | Scenario #12 | Scenario #13 |
|---|
| Objective Functions | Fuel Costs ($/h) | Emission (ton/h) | VD (pu) | Power Losses (MW) | Fuel Costs ($/h) | Emissions (ton/h) | VD (pu) | Power Losses (MW) | L-Index |
|---|
| MOMICA [34] | 830.188 | 0.252 | 0.298 | 5.585 | - | - | - | - | - |
| I-NSGA-III [35] | 881.9395 | 0.2209 | 0.1754 | 4.7449 | 843.8571 | 0.1485 | 0.2388 | 5.7405 | 0.1253 |
| MODA [37] | 828.49 | 0.265 | 0.585 | 5.912 | - | - | - | - | - |
| ECHT [36] | 830.2123 | 0.253 | 0.296 | 5.586 | - | - | - | - | - |
| PSO-SSO [72] | 826.94 | 0.258 | 0.466 | 5.515 | 826.8 | 0.256 | 0.463 | 5.464 | 0.145 |
| ALO | 769.07 | 0.14957 | 0.84792 | 5.5493 | 769.93 | 0.14867 | 0.97541 | 5.3714 | 0.11758 |
| SSA | 770.43 | 0.14799 | 0.83337 | 5.4257 | 770.18 | 0.15455 | 0.8247 | 5.6446 | 0.12473 |
| CHIO | 768.92 | 0.15177 | 0.92664 | 5.4395 | 770.13 | 0.14624 | 0.86862 | 5.3023 | 0.12242 |
Table 20.
Lists of control variables for Scenario 14 for IEEE 57-bus test scheme (The numbers in bold are the best values found).
Table 20.
Lists of control variables for Scenario 14 for IEEE 57-bus test scheme (The numbers in bold are the best values found).
| Variables and Parameters | Bounds | Scenario #14 |
|---|
| Min | Max | CHIO | ALO | SSA |
|---|
| Active power (MW) | PTPG1 | 80 | 200 | 142.03 | 143.32 | 142.02 |
| PTPG2 | 30 | 100 | 100 | 100 | 100 |
| PTPG3 | 40 | 140 | 140 | 140 | 140 |
| PTPG6 | 30 | 100 | 90.462 | 99.915 | 85.404 |
| PTPG8 | 100 | 550 | 381.24 | 375.31 | 384.08 |
| PTPG9 | 30 | 100 | 48.64 | 48.587 | 48.605 |
| PTPG12 | 100 | 410 | 362.39 | 362.87 | 364.11 |
| Reactive power (MVAr) | Q2 | −17 | 50 | 46.138 | 49.685 | 50 |
| Q3 | −10 | 60 | 29.639 | 28.616 | −10 |
| Q6 | −8 | 25 | 5.0015 | 1.2401 | −8 |
| Q8 | −140 | 200 | 42.065 | 40.539 | 69.403 |
| Q9 | −3 | 9 | 5 | 9 | −3 |
| Q12 | −150 | 155 | 56.541 | 67.292 | 69.611 |
| Bus voltage (pu) | V1 | 0.95 | 1.10 | 1.1 | 1.0991 | 1.1 |
| V2 | 0.95 | 1.10 | 1.1 | 1.1 | 1.0999 |
| V3 | 0.95 | 1.10 | 1.1 | 1.1 | 1.0078 |
| V6 | 0.95 | 1.10 | 1.1 | 1.0994 | 0.9591 |
| V8 | 0.95 | 1.10 | 1.1 | 1.1 | 1.1 |
| V11 | 0.95 | 1.10 | 1.1 | 1.098 | 1.0423 |
| V12 | 0.95 | 1.10 | 1.0821 | 1.0865 | 1.0823 |
| Wgencost | Not applicable | 555.43 | 555.43 | 555.43 |
| PVgencost | 1646.6 | 1616.9 | 1658.4 |
| PVTPgencost | 156.77 | 156.57 | 156.63 |
| Fuelvlvcost | 30,393 | 30,427 | 30,399 |
| Fuel costs ($/h) | 32,752 | 32,756 | 32,770 |
| VD (pu) | 4.9146 | 4.9821 | 4.5556 |
| Ploss (MW) | 12.738 | 12.708 | 13.098 |
| L-index | 0.2321 | 0.2294 | 0.2417 |
| Emissions (ton/h) | 1.2322 | 1.2582 | 1.2763 |
| Computation time (s) | 347.42 | 399.24 | 609.65 |
Table 21.
Lists of control variables for Scenario 15 using AHP and TOPSIS for IEEE 57-bus test scheme (The numbers in bold are the best values found).
Table 21.
Lists of control variables for Scenario 15 using AHP and TOPSIS for IEEE 57-bus test scheme (The numbers in bold are the best values found).
| Variables and Parameters | Bounds | Scenario #15—AHP | Scenario #15—TOPSIS |
|---|
| Min | Max | CHIO | ALO | SSA | CHIO | ALO | SSA |
|---|
| Active power (MW) | PTPG1 | 80 | 200 | 141.13 | 146.85 | 142.12 | | | |
| PTPG2 | 30 | 100 | 100 | 100 | 100 | 97.284 | 99.802 | 99.991 |
| PTPG3 | 40 | 140 | 140 | 140 | 140 | 136.61 | 139.98 | 140 |
| PTPG6 | 30 | 100 | 90.525 | 66.72 | 64.232 | 66.124 | 75.725 | 49.604 |
| PTPG8 | 100 | 550 | 381.28 | 391.52 | 390.9 | 394.54 | 400.59 | 342.82 |
| PTPG9 | 30 | 100 | 48.555 | 48.524 | 48.595 | 47.437 | 48.526 | 48.244 |
| PTPG12 | 100 | 410 | 362.39 | 374 | 375.88 | 349.16 | 360.12 | 406.63 |
| Reactive power (MVAr) | Q2 | −17 | 50 | 50 | 47.376 | 50 | 50 | 50 | −17 |
| Q3 | −10 | 60 | 30.456 | 28.034 | −10 | 32.267 | −10 | 35.239 |
| Q6 | −8 | 25 | 5.0223 | 9.0762 | −8 | −8 | 25 | 25 |
| Q8 | −140 | 200 | 42.625 | 37.959 | 63.327 | 45.618 | 13.908 | 28.807 |
| Q9 | −3 | 9 | 9 | 9 | 9 | 9 | 9 | 9 |
| Q12 | −150 | 155 | 56.269 | 63.386 | 65.015 | 139.05 | 155 | 155 |
| Bus voltage (pu) | V1 | 0.95 | 1.10 | 1.099 | 1.0996 | 1.1 | 1.0096 | 1.0153 | 0.99824 |
| V2 | 0.95 | 1.10 | 1.1 | 1.1 | 1.0977 | 1.0274 | 1.038 | 0.95031 |
| V3 | 0.95 | 1.10 | 1.1 | 1.1 | 0.9876 | 1.0113 | 0.99729 | 1.003 |
| V6 | 0.95 | 1.10 | 1.1 | 1.0991 | 1.0437 | 0.99375 | 1.0266 | 1.0878 |
| V8 | 0.95 | 1.10 | 1.1 | 1.1 | 1.1 | 1.0164 | 1.0094 | 1.0091 |
| V11 | 0.95 | 1.10 | 1.1 | 1.1 | 1.099 | 1.0247 | 1.0577 | 1.0997 |
| V12 | 0.95 | 1.10 | 1.0815 | 1.0866 | 1.0836 | 1.0257 | 1.0426 | 1.0941 |
| Wgencost | Not applicable | 555.43 | 555.43 | 555.43 | 539.82 | 555.32 | 555.43 |
| PVgencost | 1645.4 | 1691.9 | 1689.8 | 1706.3 | 1732.7 | 1468.1 |
| PVTPgencost | 156.45 | 156.33 | 156.6 | 152.24 | 156.33 | 155.27 |
| Fuelvlvcost | 30,397 | 30,367 | 30,384 | 30,900 | 30,490 | 31,052 |
| Fuel costs ($/h) | 32,754 | 32,771 | 32,786 | 33,299 | 32,935 | 33,230 |
| VD (pu) | 4.8974 | 4.9926 | 4.6149 | 1.0707 | 1.0937 | 1.0872 |
| Ploss (MW) | 12.736 | 12.458 | 12.717 | 16.833 | 16.794 | 16.379 |
| L-index | 0.23147 | 0.22979 | 0.2404 | 0.26182 | 0.26843 | 0.25241 |
| Emissions (ton/h) | 1.2584 | 1.341 | 1.3454 | 1.3261 | 1.3465 | 1.3064 |
| Computation time (s) | 427.4885 | 414.6923 | 596.62 | 1303.38 | 455.579 | 560.509 |
Table 22.
Lists of control variables for Scenario 16 using AHP and TOPSIS for IEEE 57-bus test scheme (The numbers in bold are the best values found).
Table 22.
Lists of control variables for Scenario 16 using AHP and TOPSIS for IEEE 57-bus test scheme (The numbers in bold are the best values found).
| Variables and Parameters | Bounds | Scenario #16—AHP | Scenario #16—TOPSIS |
|---|
| Min | Max | CHIO | ALO | SSA | CHIO | ALO | SSA |
|---|
| Active power (MW) | PTPG1 | 80 | 200 | 140.44 | 142.84 | 158.66 | 140.44 | 142.84 | 158.66 |
| PTPG2 | 30 | 100 | 100 | 100 | 100 | 100 | 100 | 99.849 |
| PTPG3 | 40 | 140 | 140 | 140 | 140 | 139.99 | 140 | 139.99 |
| PTPG6 | 30 | 100 | 90.488 | 95.416 | 65.626 | 99.938 | 100 | 99.78 |
| PTPG8 | 100 | 550 | 381.21 | 384.31 | 392.53 | 320.04 | 336.72 | 320.58 |
| PTPG9 | 30 | 100 | 48.653 | 48.614 | 48.601 | 48.609 | 48.671 | 48.578 |
| PTPG12 | 100 | 410 | 362.38 | 357.39 | 372.12 | 339.96 | 345.59 | 334.15 |
| Reactive power (MVAr) | Q2 | −17 | 50 | 46.138 | 49.066 | 49.93 | 45.377 | 45.545 | 30.186 |
| Q3 | −10 | 60 | 29.64 | 28.429 | 30.756 | 26.853 | 21.835 | −4.2581 |
| Q6 | −8 | 25 | 4.9955 | 3.4006 | 10.004 | 7.0424 | 4.1125 | −8 |
| Q8 | −140 | 200 | 42.068 | 39.15 | 47.067 | 44.505 | 35.441 | 83.674 |
| Q9 | −3 | 9 | 9 | 9 | −3 | 9 | 9 | 9 |
| Q12 | −150 | 155 | 56.541 | 67.055 | 61.353 | 80.818 | 102.34 | 48.528 |
| Bus voltage (pu) | V1 | 0.95 | 1.10 | 1.1 | 1.0993 | 1.099 | 1.0995 | 1.1 | 1.0934 |
| V2 | 0.95 | 1.10 | 1.1 | 1.1 | 1.1 | 1.0994 | 1.1 | 1.0852 |
| V3 | 0.95 | 1.10 | 1.1 | 1.1 | 1.1 | 1.0992 | 1.1 | 1.0724 |
| V6 | 0.95 | 1.10 | 1.1 | 1.1 | 1.0992 | 1.0995 | 1.1 | 1.0496 |
| V8 | 0.95 | 1.10 | 1.1 | 1.1 | 1.1 | 1.0987 | 1.1 | 1.0915 |
| V11 | 0.95 | 1.10 | 1.1 | 1.0999 | 0.9527 | 1.0968 | 1.1 | 1.0907 |
| V12 | 0.95 | 1.10 | 1.0821 | 1.0858 | 1.0833 | 1.0887 | 1.1 | 1.0614 |
| Wgencost | Not applicable | 555.43 | 555.43 | 555.43 | 555.39 | 555.43 | 555.36 |
| PVgencost | 1645.4 | 1658.3 | 1696.8 | 1363.1 | 1439.8 | 1365.3 |
| PVTPgencost | 156.82 | 156.67 | 156.62 | 156.65 | 156.9 | 156.54 |
| Fuelvlvcost | 30,393 | 30,383 | 30,363 | 31,269 | 30,897 | 31,395 |
| Fuel costs ($/h) | 32,751 | 32,753 | 32,772 | 33,344 | 33,049 | 33,473 |
| VD (pu) | 4.9146 | 4.9718 | 4.8841 | 4.9968 | 5.2342 | 3.8727 |
| Ploss (MW) | 12.738 | 12.968 | 12.601 | 14.258 | 13.762 | 15.241 |
| L-index | 0.2321 | 0.2298 | 0.2317 | 0.22947 | 0.22395 | 0.25315 |
| Emissions (ton/h) | 1.2553 | 1.2581 | 1.3422 | 1.0976 | 1.1198 | 1.0964 |
| Computation time (s) | 422.21 | 404.68 | 488.94 | 1575.13 | 402.319 | 477.557 |
Table 23.
Economic benefits of the presented CHIO approach in comparison with other approaches with and without the integration of RESs.
Table 23.
Economic benefits of the presented CHIO approach in comparison with other approaches with and without the integration of RESs.
| System | Scenario # | IEEE without RESs | IEEE Integrated with RESs | Saving Difference with and without RESs |
|---|
| Competitive Techniques | Savings ($/h) | Annual Savings ($/yr.) | Competitive Techniques | Savings ($/h) | Annual Savings ($/yr.) | Savings ($/h) | Annual Savings ($/yr.) |
|---|
| IEEE 30-bus | 1 | PSO-SSO [72] | 798.98 | 0.0550 | 481.80 | CHIO | 768.95 | 12.45 | 109,062 | 30.03 | 263,062.8 |
| ECBO [73] | 799.035 | GWO [76] | 781.40 | | |
| 6 | PSO-SSO [72] | 834.804 | 0.110 | 963.60 | CHIO | 769.79 | 12.51 | 109,588 | 65.014 | 569,522.6 |
| MVO [75] | 834.95 | SHADE [76] | 782.30 | | |
| IEEE 57-bus | 14 | PSO-SSO [72] | 41,666.66 | 7.96 | 69,729.6 | CHIO | 32,752 | 4 | 35,040 | 8914.66 | 78,092,421.6 |
| DA-PSO [37] | 41,674.62 | ALO | 32,756 | | |
| 16 | PSO-SSO [72] | 41,672.56 | 151.9 | 1,330,644 | CHIO | 32,751 | 2 | 17,520 | 8921.56 | 78,152,865.6 |
| SSO [72] | 41,824.46 | ALO | 32,753 | | |
Table 24.
Environmental benefits of the presented CHIO approach in comparison with other approaches with and without the integration of RESs.
Table 24.
Environmental benefits of the presented CHIO approach in comparison with other approaches with and without the integration of RESs.
| System | Scenario # | IEEE without RESs | IEEE Integrated with RESs | Saving Difference with and without RESs |
|---|
| Competitive Techniques | Savings (ton/h) | Annual Savings (ton/yr.) | Competitive Techniques | Savings (ton/h) | Annual Savings (ton/yr.) | Savings (ton/h) | Annual Savings (ton/yr.) |
|---|
| IEEE 30-bus | 10 | PSO-SSO [72] | 0.224 | 0.001 | 8760 | CHIO | 0.14855 | 1.6115 | 14,116.3 | 0.075 | 657 |
| PSO [72] | 0.225 | GWO [76] | 1.76 | | |
| 13 | PSO-SSO [72] | 0.256 | 0.001 | 8760 | CHIO | 0.14624 | 0.314 | 2750.6 | 0.11 | 963.6 |
| SSA [72] | 0.257 | SHADE [76] | 0.46 | | |
| IEEE 57-bus | 14 | PSO-SSO [72] | 1.3433 | 0.5654 | 4947.25 | CHIO | 1.2322 | 0.026 | 227.76 | 0.11 | 973.236 |
| DA-PSO [37] | 1.9087 | ALO | 1.2582 | | |
| 16 | PSO-SSO [72] | 1.36 | 0.24 | ALO | 1.2581 | 1.2553 | 0.0028 | 24.528 | 0.105 | 917.172 |
| SSO [72] | 1.60 | | | | |
Table 25.
Technical benefits of the presented CHIO method in comparison with other methods with and without the integration of RESs.
Table 25.
Technical benefits of the presented CHIO method in comparison with other methods with and without the integration of RESs.
| System | Scenario # | IEEE without RESs | IEEE Integrated with RESs | Saving Difference with and without RESs |
|---|
| Competitive Techniques | Savings (MW) | Annual Savings (MW) | Competitive Techniques | Savings (MW) | Annual Savings (MW/yr.) |
|---|
| IEEE 30-bus | 1 | PSO-SSO [72] | 8.602 | 0.0112 | 98.112 | CHIO | 5.54 | 3.062 | 26,823.12 |
| ECBO [73] | 8.6132 | | |
| 4 | PSO-SSO [72] | 2.858 | 0.023 | 201.48 | CHIO | 2.0661 | 0.7919 | 6937.044 |
| MVO [75] | 2.881 | | |
| IEEE 57-bus | 14 | PSO-SSO [72] | 14.916 | 0.022 | 192.72 | CHIO | 12.736 | 2.18 | 19,096.8 |
| DA-PSO [37] | 14.938 | | |
| 16 | PSO-SSO [72] | 15.169 | 0.217 | 1900.9 | CHIO | 12.738 | 2.431 | 21,295.56 |
| SSO [72] | 15.386 | | |


