Article

Utilization of Improved Machine Learning Method Based on Artificial Hummingbird Algorithm to Predict the Tribological Behavior of Cu-Al2O3 Nanocomposites Synthesized by In Situ Method

1
Mechanical Engineering Department, Faculty of Engineering, King Abdulaziz University, Jeddah P.O. Box 80204, Saudi Arabia
2
Faculty of Computer Science & Engineering, Galala University, Suze 435611, Egypt
3
Artificial Intelligence Science Program, Faculty of Science & Engineering, Galala University, Galala Plateau 43511, Egypt
4
Department of Mathematics, Faculty of Science, Zagazig University, Zagazig 44519, Egypt
5
Department of Mechanical Design and Production Engineering, Faculty of Engineering, Zagazig University, Zagazig P.O. Box 44519, Egypt
6
Mechanical Department, Higher Technological Institute, Tenth of Ramadan City 44629, Egypt
*
Author to whom correspondence should be addressed.
Mathematics 2022, 10(8), 1266; https://doi.org/10.3390/math10081266
Submission received: 14 March 2022 / Revised: 6 April 2022 / Accepted: 8 April 2022 / Published: 11 April 2022

Abstract

:
This paper presents a machine learning model to predict the effect of Al2O3 nanoparticles content on the wear rates in Cu-Al2O3 nanocomposite prepared using in situ chemical technique. The model developed is a modification of the random vector functional link (RVFL) algorithm using artificial hummingbird algorithm (AHA). The objective of using AHA is used to find the optimal configuration of RVFL to enhance the prediction of Al2O3 nanoparticles. The preparation of the composite was done using aluminum nitrate that was added to a solution containing scattered copper nitrate. After that, the powders of CuO and Al2O3 were obtained, and the leftover liquid was removed using a thermal treatment at 850 °C for 1 h. The powders were consolidated using compaction and sintering processes. The microhardness of the nanocomposite with 12.5% Al2O3 content is 2.03-fold times larger than the pure copper, while the wear rate of the same composite is reduced, reaching 55% lower than pure copper. These improved properties are attributed to the presence of Al2O3 nanoparticles and their homogenized distributions inside the matrix. The developed RVFl-AHA model was able to predict the wear rates of all the prepared composites at different wear load and speed, with very good accuracy, reaching nearly 100% and 99.5% using training and testing, respectively, in terms of coefficient of determination R2.

1. Introduction

Metal matrix nanocomposites (MMNCs) are extensively used in modern industries due to their mechanical behavior, tribological properties, and other desirable engineering properties [1,2,3,4]. The oxide dispersion strengthening (ODS) method is used to create nanocomposites that contain very fine particles of the ceramic oxide in a metallic matrix, resulting in an MMNCs-reinforced multi-phase system [5,6,7,8,9]. Copper and its alloys are used in a number of technical applications, including electronics and electrical sliding contacts in motors and generators. When compared to common industrial metals, it is also used as brushes, electric contacts, resistance welding electrodes, and bearings due to its superior electrical and thermal properties, good mechanical properties, corrosion resistance, and ease of forming and machining [10,11,12,13,14]. Nonetheless, the most significant disadvantages of copper in many applications are the highest coefficient of friction, little wear resistance, and low strength, which limit/prevent their use in heavy duty applications. The researchers tried to tackle these problems by emerging ceramic particles in the Cu-matrix for improving tribological properties, such as adding graphite [15,16] and graphene [17,18,19], or improving strength by adding ZrO2 [20,21,22], SiC [23,24], graphene [25,26], and alumina [27,28], etc.
Copper matrix composites (CMCs)-reinforced with particles such as alumina (Al2O3) show improved physical and mechanical properties and can be characterized using conventional methods employed for metals [29,30]. The effect of Al2O3 on the abrasion properties of the CMCs is such that in addition to the increase of Al2O3 reducing the wear rate of the MMCs, increasing its particle size also reduces the amount of wear. As the mass percentage and particle size of Al2O3 increase, the density of the MMCs decreases, while the porosity, microhardness, and strength of the CMCs increase with decreasing size and increasing the mass percentage of the Al2O3 particles [31]. In addition to ceramic compounds, other compounds are also used to reinforce metal matrix composites. Among these materials is graphene, which has been proposed as an excellent reinforcement for CMCs due to its excellent thermal, electrical, and mechanical properties. A number of studies, with the successful production of graphene-reinforced CMCs, have shown that graphene has a positive effect on the mechanical properties of the final products and the thermal conductivity of a copper matrix [32,33,34].
Powder metallurgy is one of the best techniques to manufacture metal matrix nanocomposites due to its low cost [35,36,37]. Despite this important advantage for the industry, the low dispersion of reinforcement phase in the matrix limits its applicability. The low dispersion of the phases is due to the difference in the surface energy of ceramic phase nanoparticles and the metal phases, which make the ceramics particles tends to agglomerate [38,39,40]. The use of mechanical alloying as a subsequent step of the powder metallurgy help to overcome this problem by achieving good dissolution of the ceramic particles inside the matrix phase through welding and fracturing of the metallic particles that entrap ceramics particles in between them during this process [41,42,43].
Owing to the advantages of artificial intelligence of providing solutions for very complex problems regardless of the availability of labs and cost, it was deployed to predict the wear rates of Cu-Al2O3 nanocomposites under abrasive wear condition [44,45,46,47]. In addition, the machine learning applications used in engineering, chemical, and other fields [48,49,50,51,52]. The newly developed Random Vector Functional Link (RVFL) algorithm was trained using experimental data obtained from abrasive wear tests to predict the response of these composites with different Al2O3 contents with good accuracy.
In this work, Cu-Al2O3 nanocomposites were manufactured using in situ technique with different Al2O3 concentrations. The microstructure, hardness, and wear properties were characterized for all the produced composites. The abrasive wear rates were measured at different applied loads and velocities. The evolution of wear rates with Al2O3 content was correlated to the microstructural changes in the consolidated samples. Finally, the trained RVFL algorithm was used to predict the wear rates for different composites with larger range of reinforcement content. The utilization of this technique will help for developing these composites in military and medical applications.

2. Experiments

The in situ chemical process was used to synthesis of Cu-Al2O3 nanocomposite powder from water-soluble copper Cu (NO3)2. 3H2O and aluminum nitrates Al (NO3)3. 9H2O. The following steps describe the in situ chemical process:
  • Cu (NO3)2. 3H2O and Al (NO3)3. 9H2O were dissolved in water using a magnetic stirrer at 70 °C for 30 min. The salt concentrations were chosen to produce a Cu-Al2O3 nanocomposite system with 2.5, 7.5, and 12.5 wt.% Al2O3.
  • To obtain nitrate salt powder precursor particles, dry spraying was performed with a sprayer at 180 °C. Copper oxide (CuO) and aluminum oxide (Al2O3) phases were obtained by oxidation of the powder at 850 °C for 1 h in an air atmosphere.
  • The powders were reduced in hydrogen for 30 min at 500 °C, resulting in copper oxide being reduced to its metallic state and Al2O3 remaining as the scattered ceramic phase.
To consolidate the samples, powders were put inside a steel die and then cold pressed at a pressure of 700 MPa. Finally, the compacted samples were sintered for 2 h in hydrogen gas at a temperature of 900 °C. Microstructural characterization of the as-milled powder and sintered samples were performed by means of X-ray diffraction measurement (XRD) analysis using a D2 PHASER diffractometer (30 kV and 10 mA settings) with Cu-Kα radiation (λ = 1.54184 Å) and field emission scanning electron microscopy (SEM) JEOL JSM−5900LV (15kV) attached with energy dispersive spectrometers (EDS) and secondary electron (SE) and backscattered electron (BSE) detectors.
Microhardness was characterized using a HXS−1000A microhardness tester. The microhardness was measured at 10 different locations, and the mean value of microhardness was computed for each sample. According to ASTM, the pin-on-disc test was used (G77−98). A steel ring with a counterface diameter of 73 mm was used. The specimens that were tested had a contact area of 48 mm2. The sliding speeds of the pin over the disc were used: 0.91, 1.07, 1.21, and 1.62 m/s. Four normal loads were applied: 2, 4, 6, and 8 N. Abrasive SiC paper of 400 grit was used on the disc. Each sample had the same sliding distance of 200 m. Before testing, the specimens were degreased using acetone. The weight loss was measured using an electronic balance with a resolution of 0.0001 g. Three samples were tested for each configuration.

3. Machine Learning Models

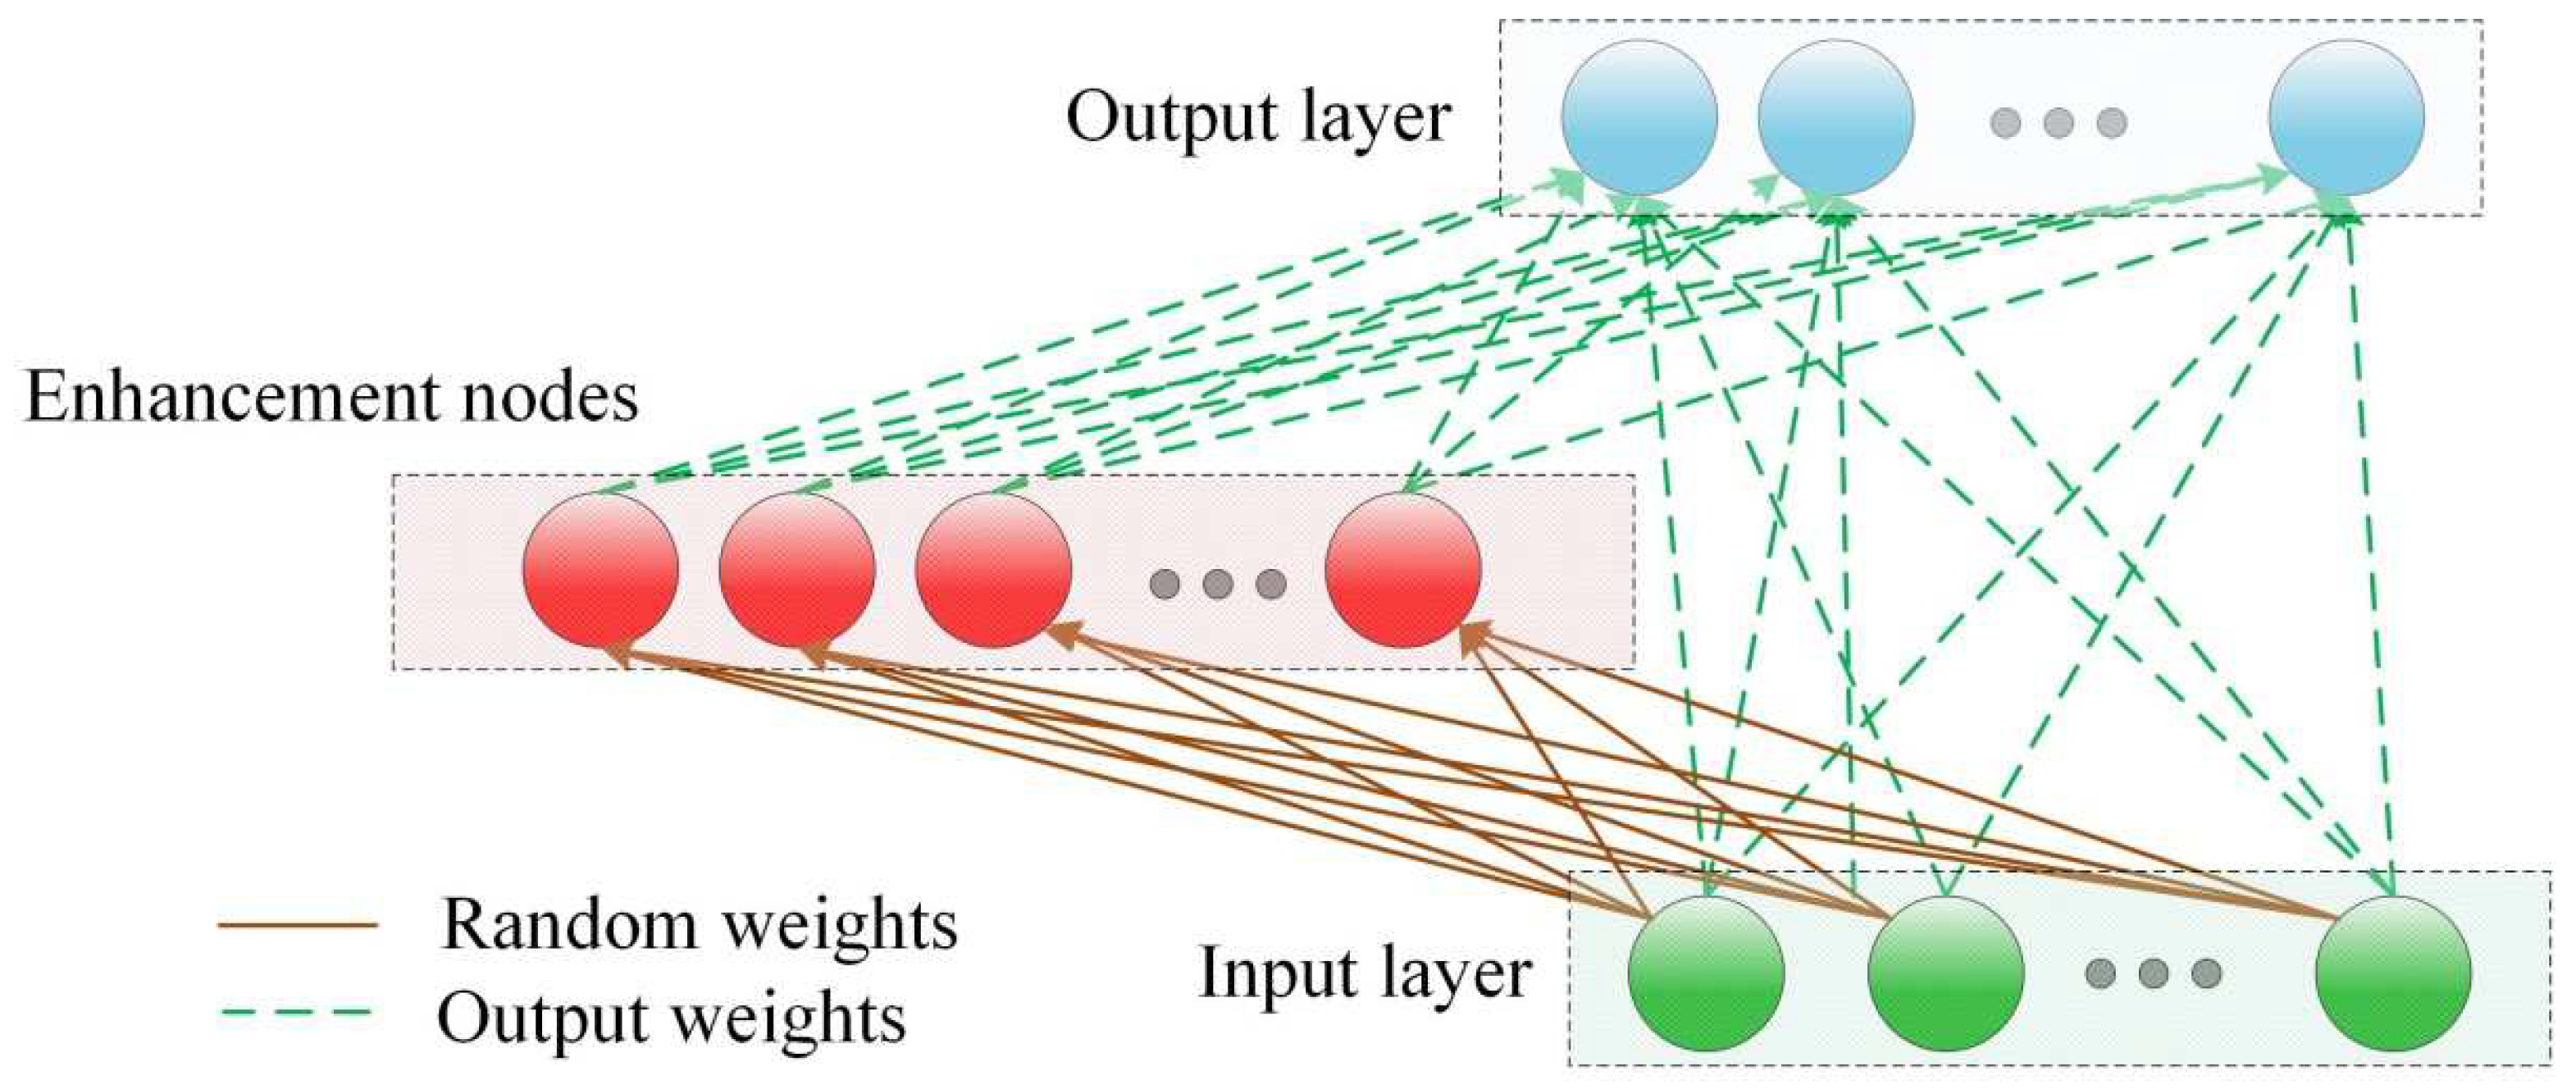
3.1. Random Vector Functional Link

The processes of a Random Vector Functional Link (RVFL) network are introduced in this section. It is similar to standard feedforward neural networks in that it connects input and output nodes, as seen in Figure 1 [53,54]. Furthermore, only the weights of the output layer must be modified. The input layer’s bias and weights are created at random and do not need to be changed. These benefits contribute to improved prediction performance while avoiding the overfitting for traditional ANN models.
The RVFL prediction begins with the input data being applied to the input nodes and these data containing M samples being formulated as ( a i ,   b i ) (here, a i R n ,   b i R m ,   i = 1 , , M ) . The output of the hidden nodes is then calculated as:
O j ( c j a i + d j ) = 1 1 + e ( c j a i + d j )   ,   d j [ 0 , ξ ] ,   c j [ ξ , ξ ]
where ξ is the scalar factor, and d i is the bias parameter. Following that, the RVFL forecasts the output based on the output weight c , which can be expressed as:
Z = K c ,       c R n + P  
where K = [ K 1 , K 2 ] exemplifies the input data, and K 1 and K 2 are defined as
K 1 = [ a 11 a 1 n a N 1 a N n ] ,   K 2 = [ O 1 ( c 1 a 1 + d 1 ) O P ( c P a 1 + d P ) O 1 ( c 1 a N + d 1 ) O P ( c P a N + d P ) ]
The value of c is modernized utilizing the following formula:
c = K Z

3.2. Artificial Hummingbird Algorithm (AHA)

In this part, the steps of new MH technique named artificial hummingbird algorithm (AHA), which simulates behavior of hummingbirds, is introduced. There are three types of flight skills named axial, diagonal, and omnidirectional flights; these skills are used for foraging strategies [55]. In addition, there are different types of search strategies, including guided foraging, territorial foraging, and migrating foraging; to emulate the memory function of hummingbirds a visit table is also formed.
The mathematical formulation of the AHA is illustrated by constructing the initial population X of N hummingbirds. This is defined using Equation (5):
X i = L + r × ( U L ) , i = 1 , 2 , , N
where L and U denote to the lower and upper boundaries for a d -dimensional, respectively. r stands for random vector in (0, 1). In addition, the visit table of food sources is constructed using Equation (6):
V T i j = { 0                         i f   i j n u l l                           i = j ,   i = 1 , , N , j = 1 , , N ,
where for i = j , V T i j = n u l l stands for the food taken by a hummingbird at its specific food source. In addition, i j , V T i j = 0 stands for the hummingbird i visiting j food source.

3.2.1. Guided Foraging

In this stage, there are three flight skills, including omnidirectional, diagonal, and axial flights, that are applied during this foraging. The axial flight can be defined as:
D i = { 1                         i f   i = r a n d i ( [ 1 , d ] ) 0                           e l s e ,   i = 1 , , d ,
The diagonal flight is formulated as:
D i = { 1   i f   i = P ( i ) ,   j [ 1 , k ] ,   P = r a n d p e r m ( k ) ,   k [ 2 , r 1 ( d 2 ) + 1 ] 0               e l s e ,   i = 1 , , d ,
The omnidirectional flight is represented as:
D i = 1 ,   i = 1 , , d ,
where r a n d i ( [ 1 , d ] ) stands for a random integer from 1 to d, r a n d p e r m ( k ) represents a random permutation of integers from 1 to k, and r 1 [ 0 ,   1 ] denotes a random number.
The guided foraging behavior can be formulated as
V i ( t + 1 ) = X i , t ( t ) + a × D × ( X i ( t ) X i , t ( t ) ) , a N ( 0 , 1 )
where X i , t ( t ) represents the food source i at iteration t . X i , t ( t ) is the target food source that visited by ith hummingbird. The value of X i can be update using the following equation:
X i ( t + 1 ) = { X i ( t )               i f   f ( X i ( t ) ) f ( V i ( t + 1 ) ) V i ( t + 1 )                                           o t h e r w i s e                
where f stands for the fitness value.

3.2.2. Territorial Foraging

A hummingbird is more likely to hunt for a new food source after visiting its target food source when the flower nectar has been consumed rather than visiting other current food sources. As a result, a hummingbird might easily migrate to a nearby place inside its own territory, where a new food source may be discovered as a candidate solution that is potentially superior to the existing one. The following is the mathematical equation for modeling:
V i ( t + 1 ) = X i , t ( t ) + b × D × X i ( t ) , b N ( 0 , 1 )

3.2.3. Migration Foraging
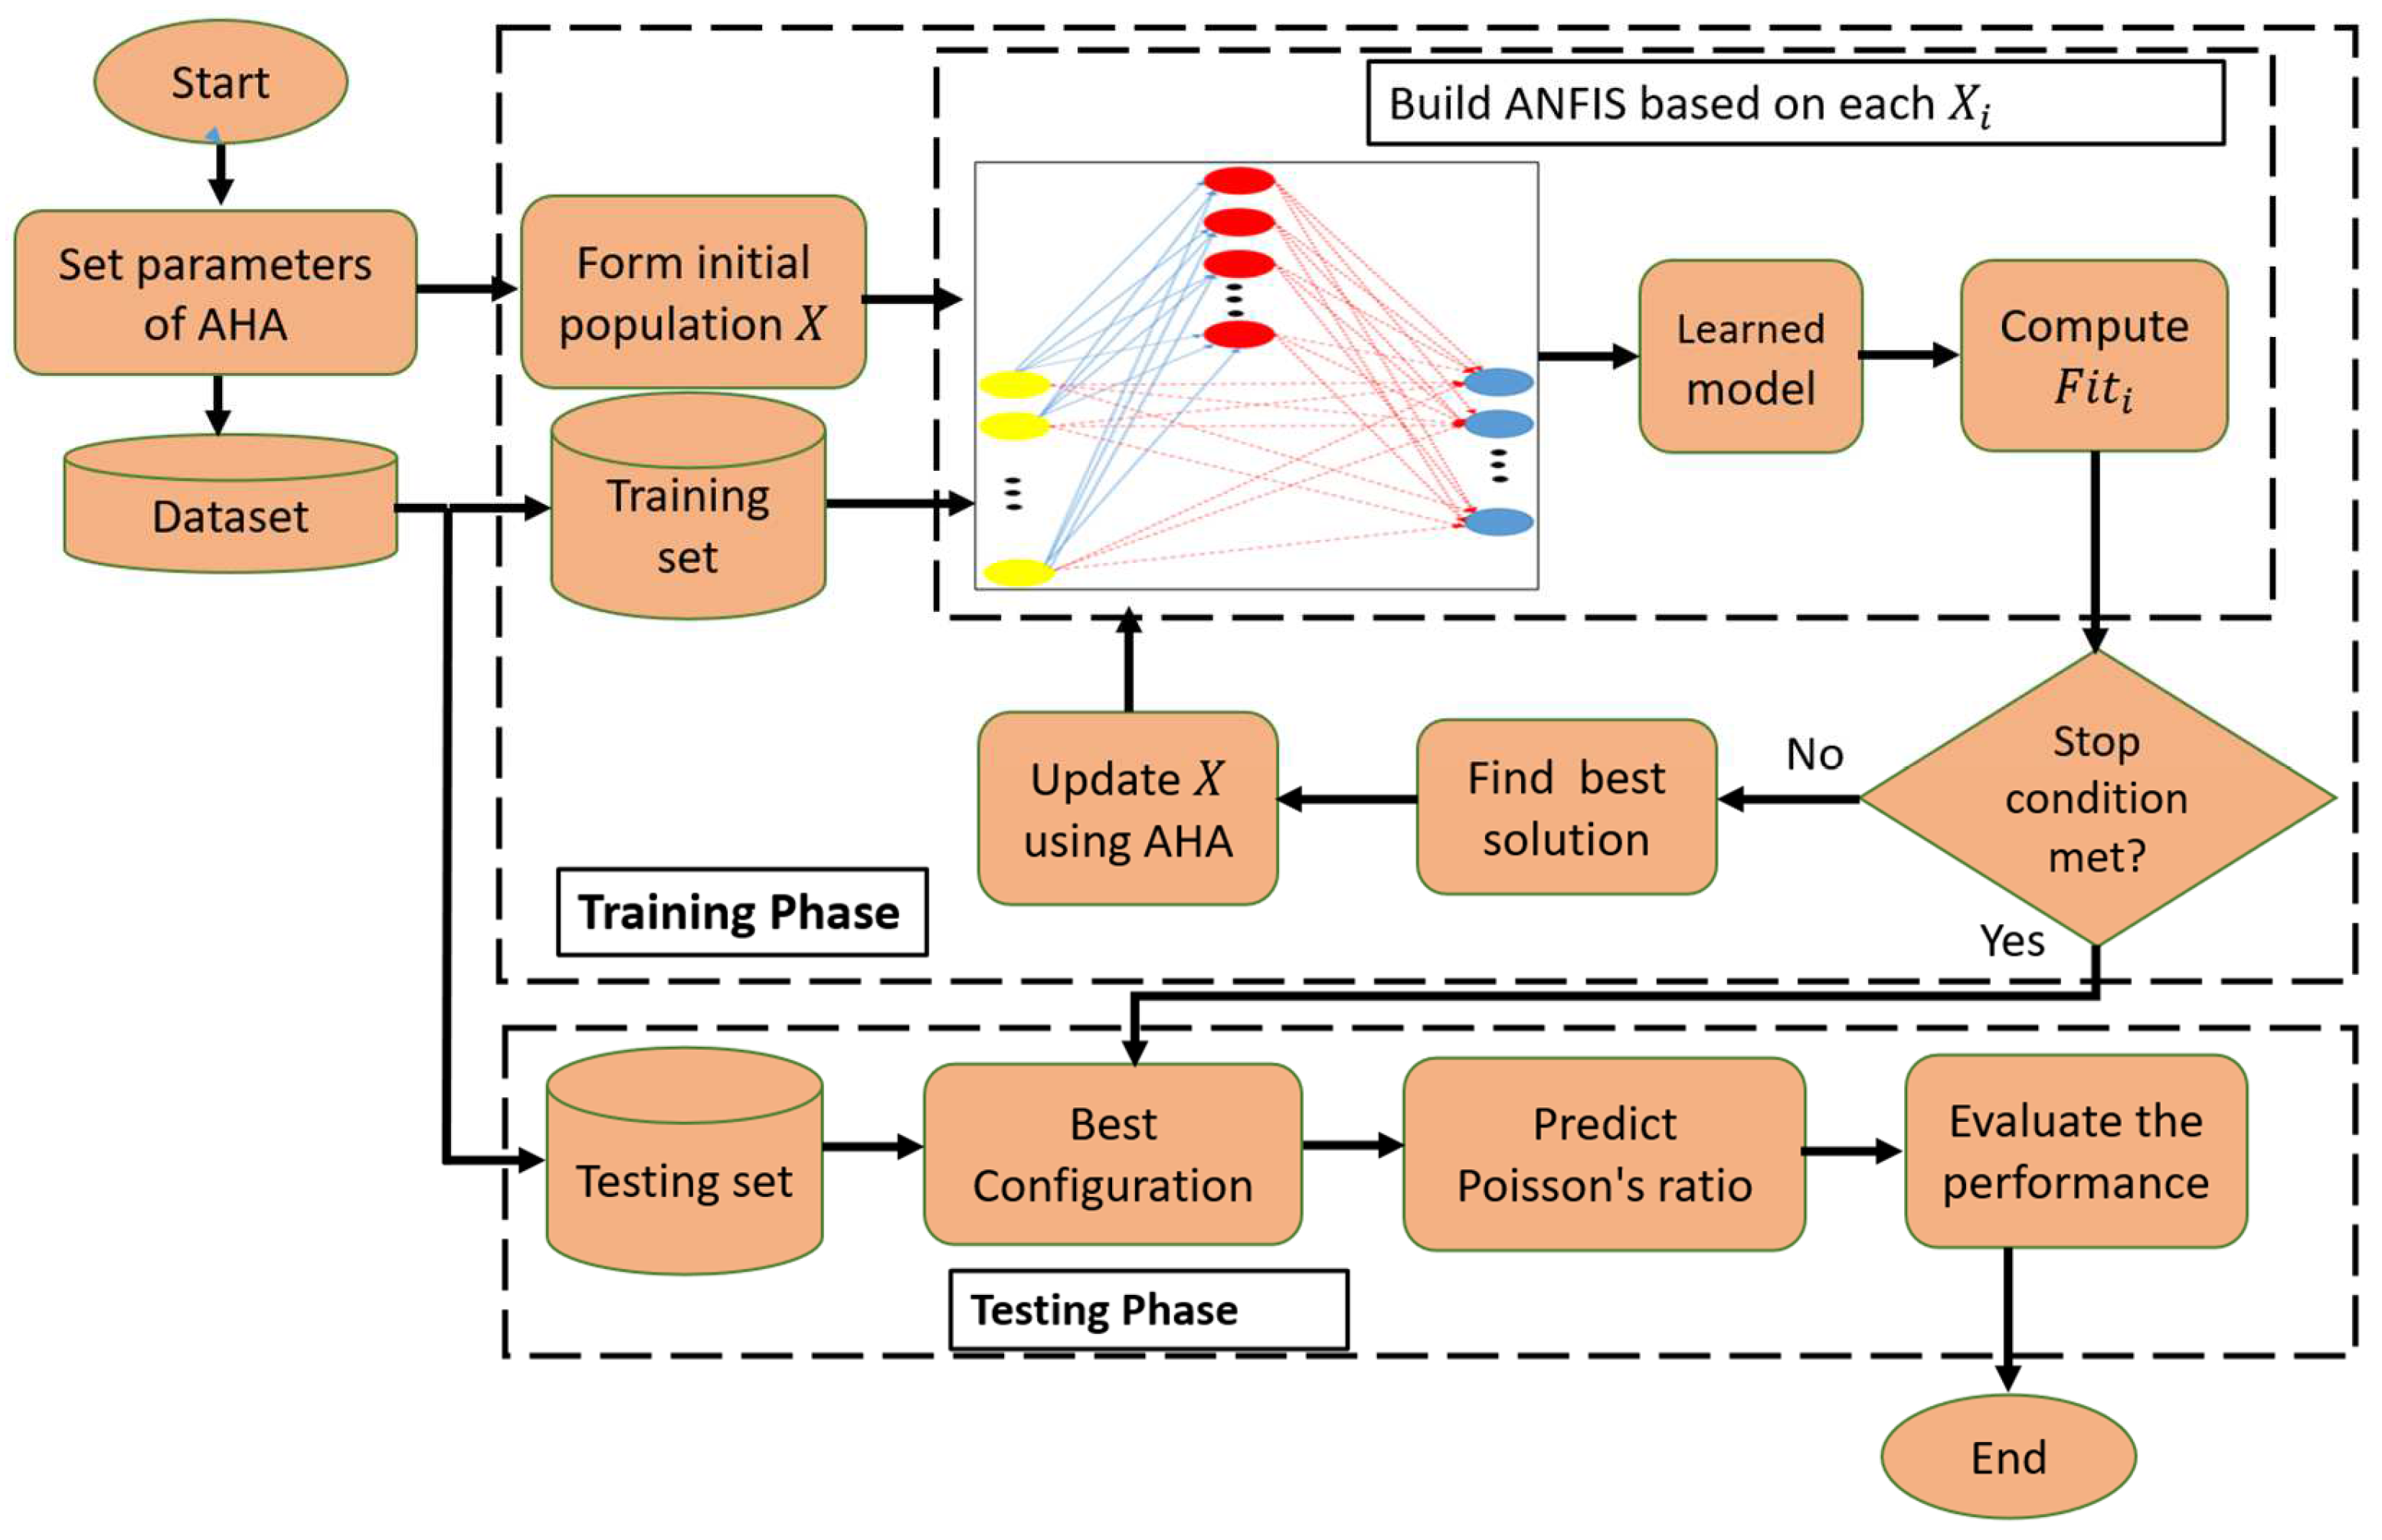
In the case that the hummingbird’s favorite feeding spot runs out of food, it migrates to a more distant eating spot. A migration coefficient is established in the AHA algorithm. This hummingbird will abandon the old source and eat at the new one, and the visit table will be changed as a result. The following is a description of a hummingbird’s migration foraging from the source with the lowest nectar-refilling rate to a new one produced at random:
X w ( t + 1 ) = L + r × ( U L ) ,
where X w stands for the food source with the worst fitness value.

3.3. Proposed Model

The general steps of the created RVFL-AHA approach (as in Figure 2). This algorithm modifies the characteristics of AHA to handle the integer optimization problem. It begins with dividing the input data into two groups for training and testing, with 70% and 30%, respectively, allocated to training and testing sets. The following stage is to create the initial population X , which consists of N agents with dim components, using the following equation:
X i j = l j + r × ( u j l j ) ,   i = 1 , , N , j = 1 , , d i m , r [ 0 , 1 ]
Each X i represents a different RVFL configuration, which is determined by three factors: the number of hidden nodes ( N h ), the activation function ( A F ), and the randomization mechanism ( R T ).
The following step is to calculate the fitting value ( F i t i ) of each agent X i , which evaluates the performance of the RVFL configuration based on X i , using the equation:
F i t i = i = 1 N s ( Y P Y T ) 2 N s
where Y P is the RVFL prediction based on X i , and Y T is the training set’s target output. The next stage is to determine the optimum configuration and change the values of other configurations using AHA operators. The stop conditions are then evaluated, and if they are satisfied, the updating process is stopped, and the testing set is applied to the optimal configuration to evaluate the produced method’s performance.

4. Results and Discussion

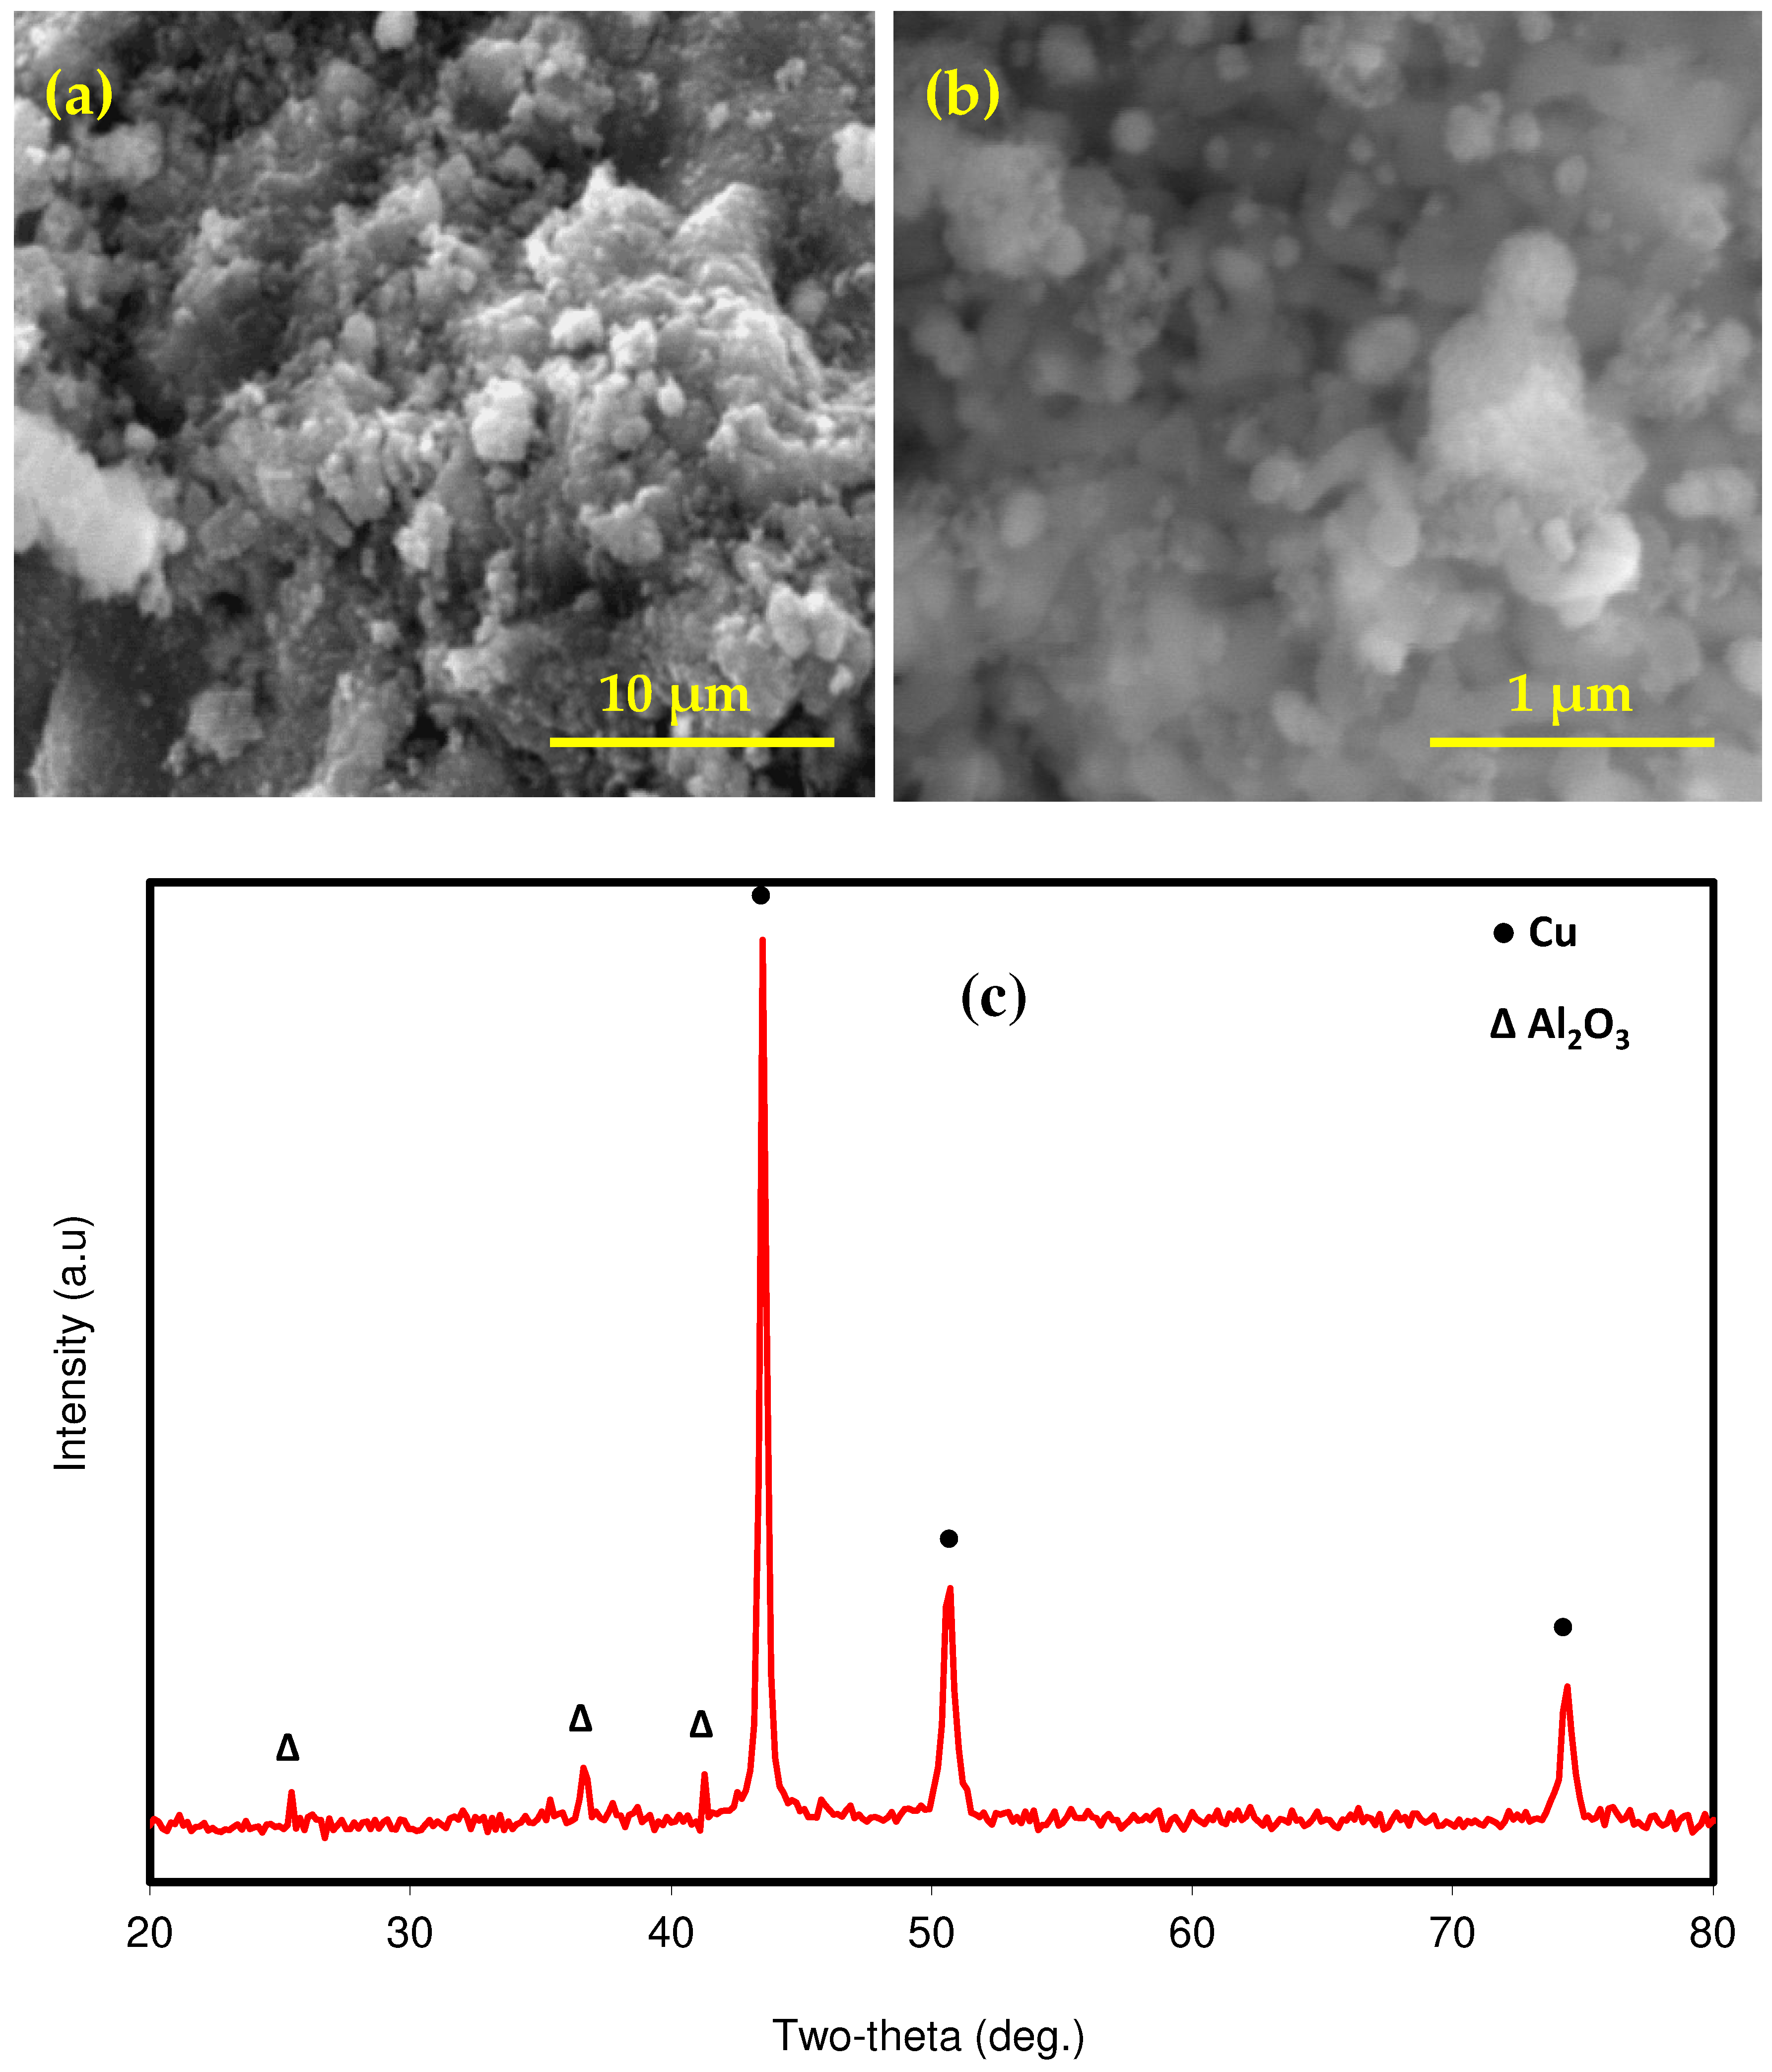
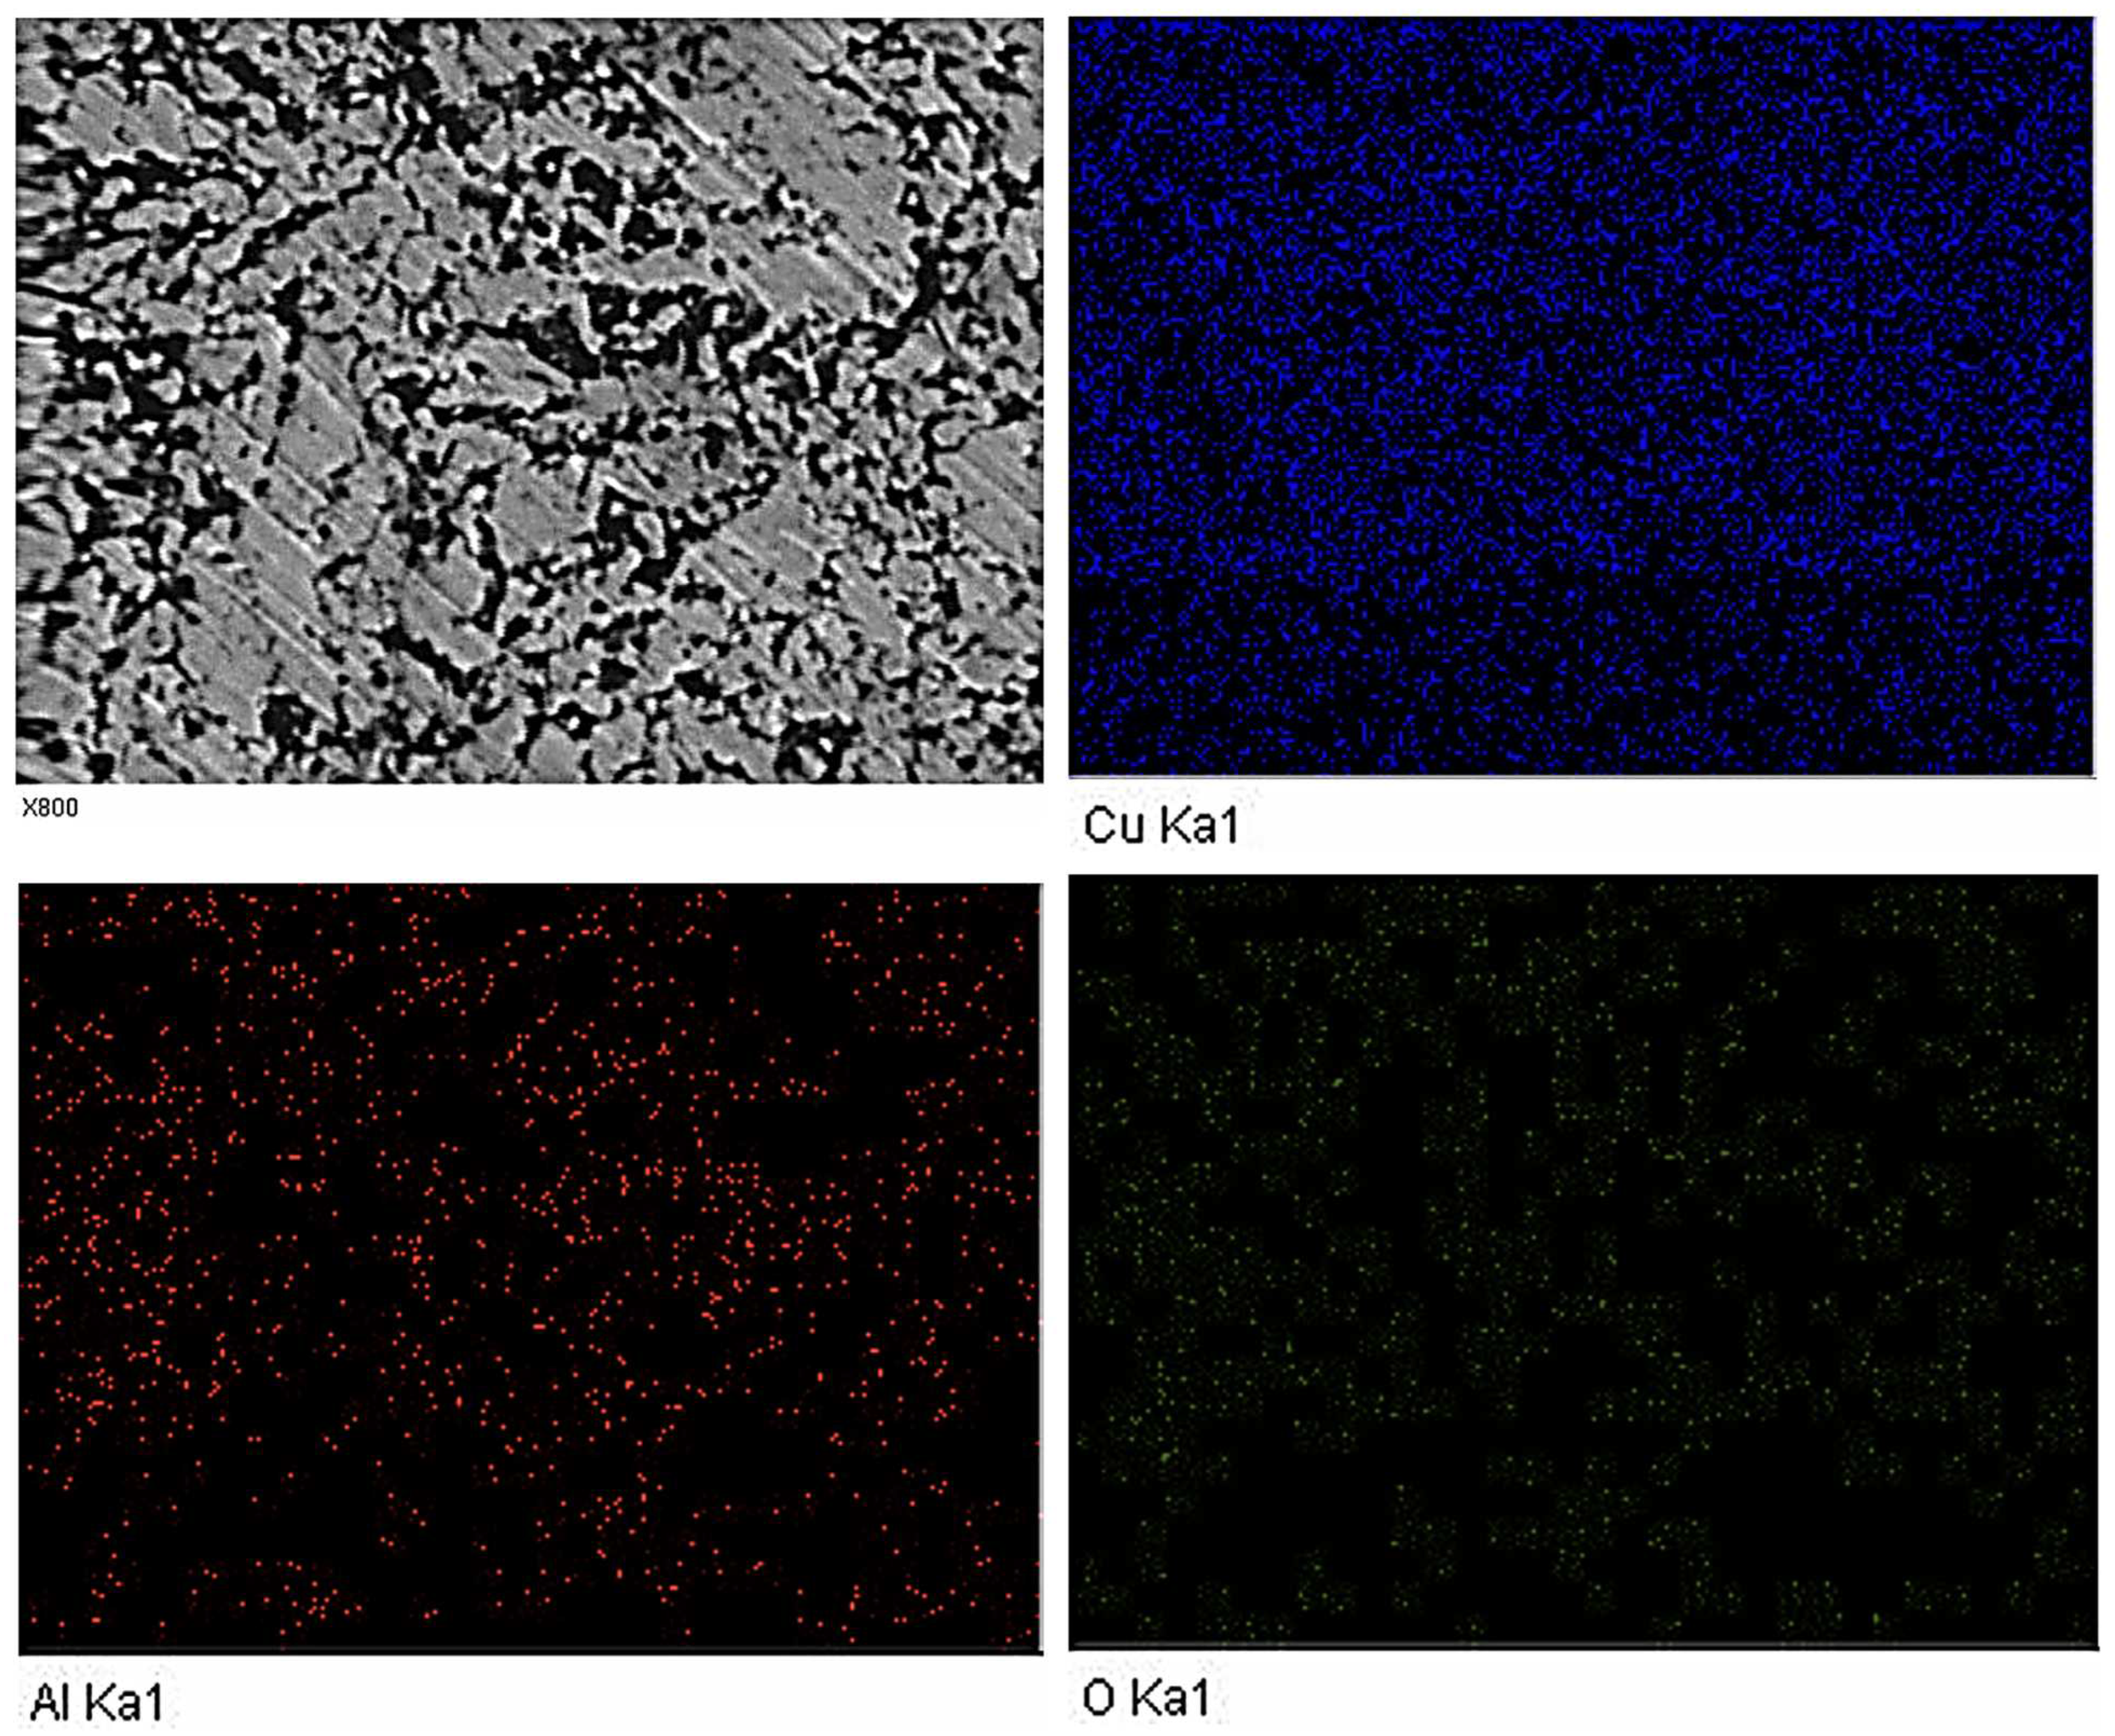
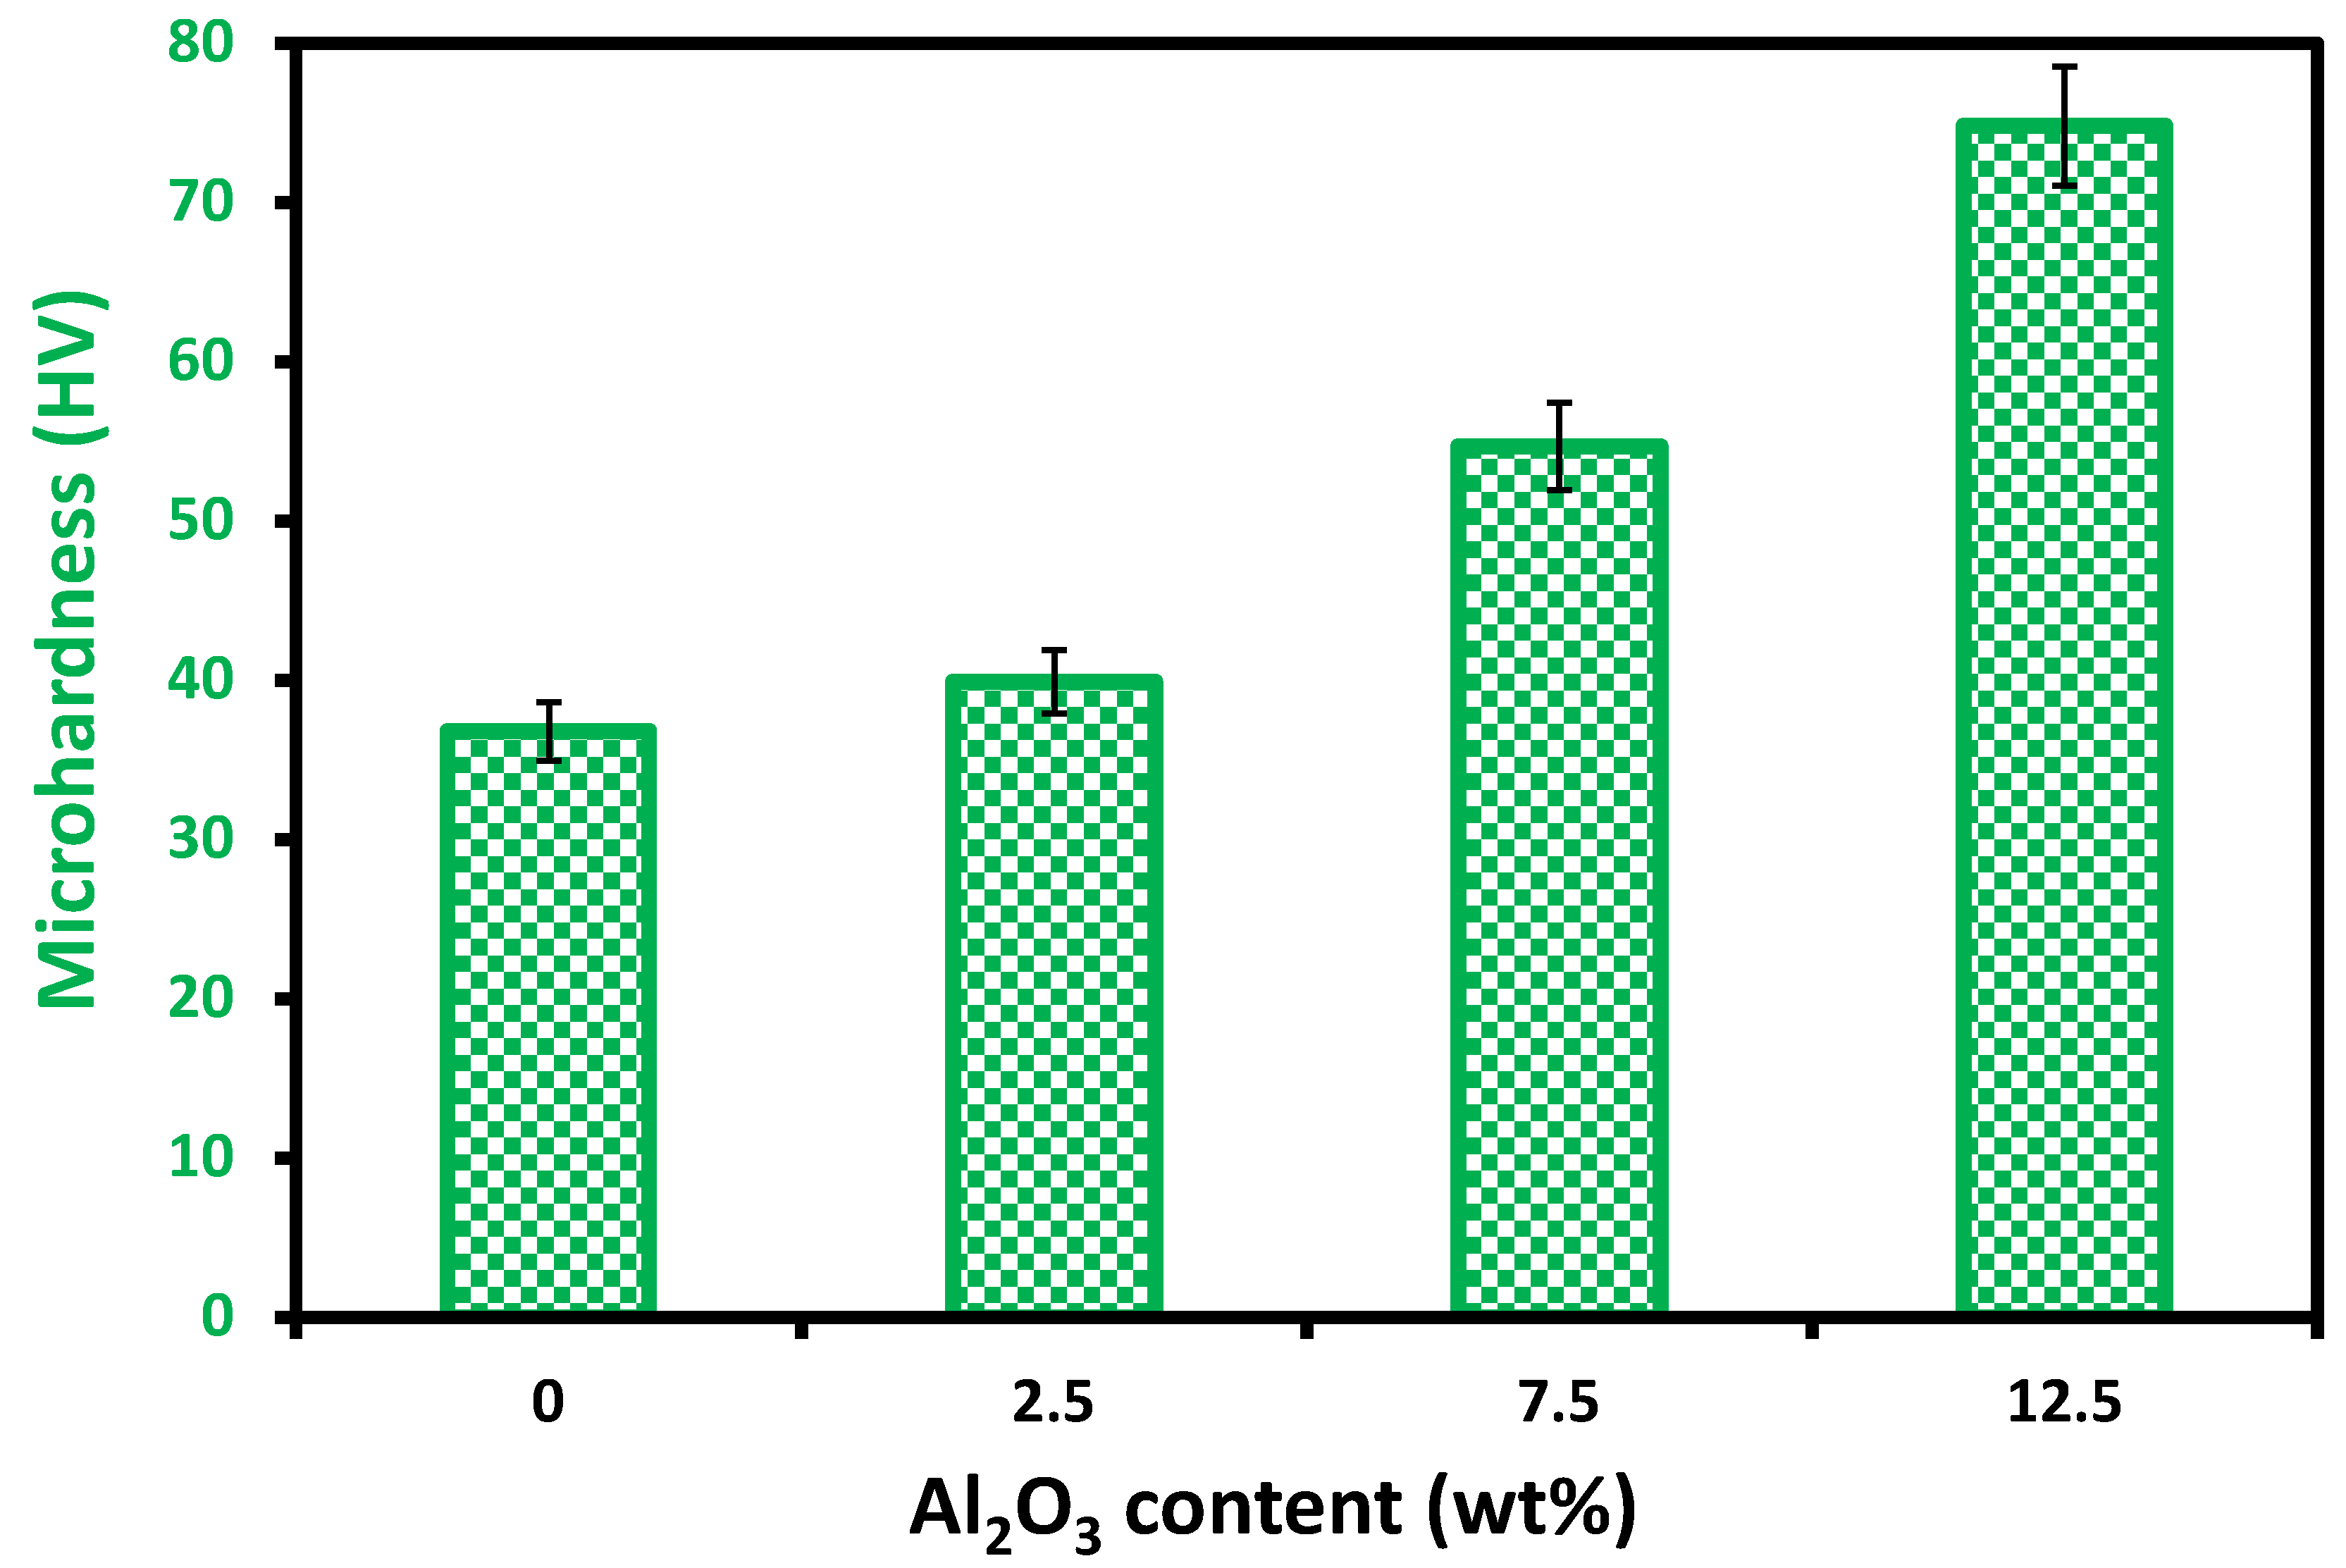
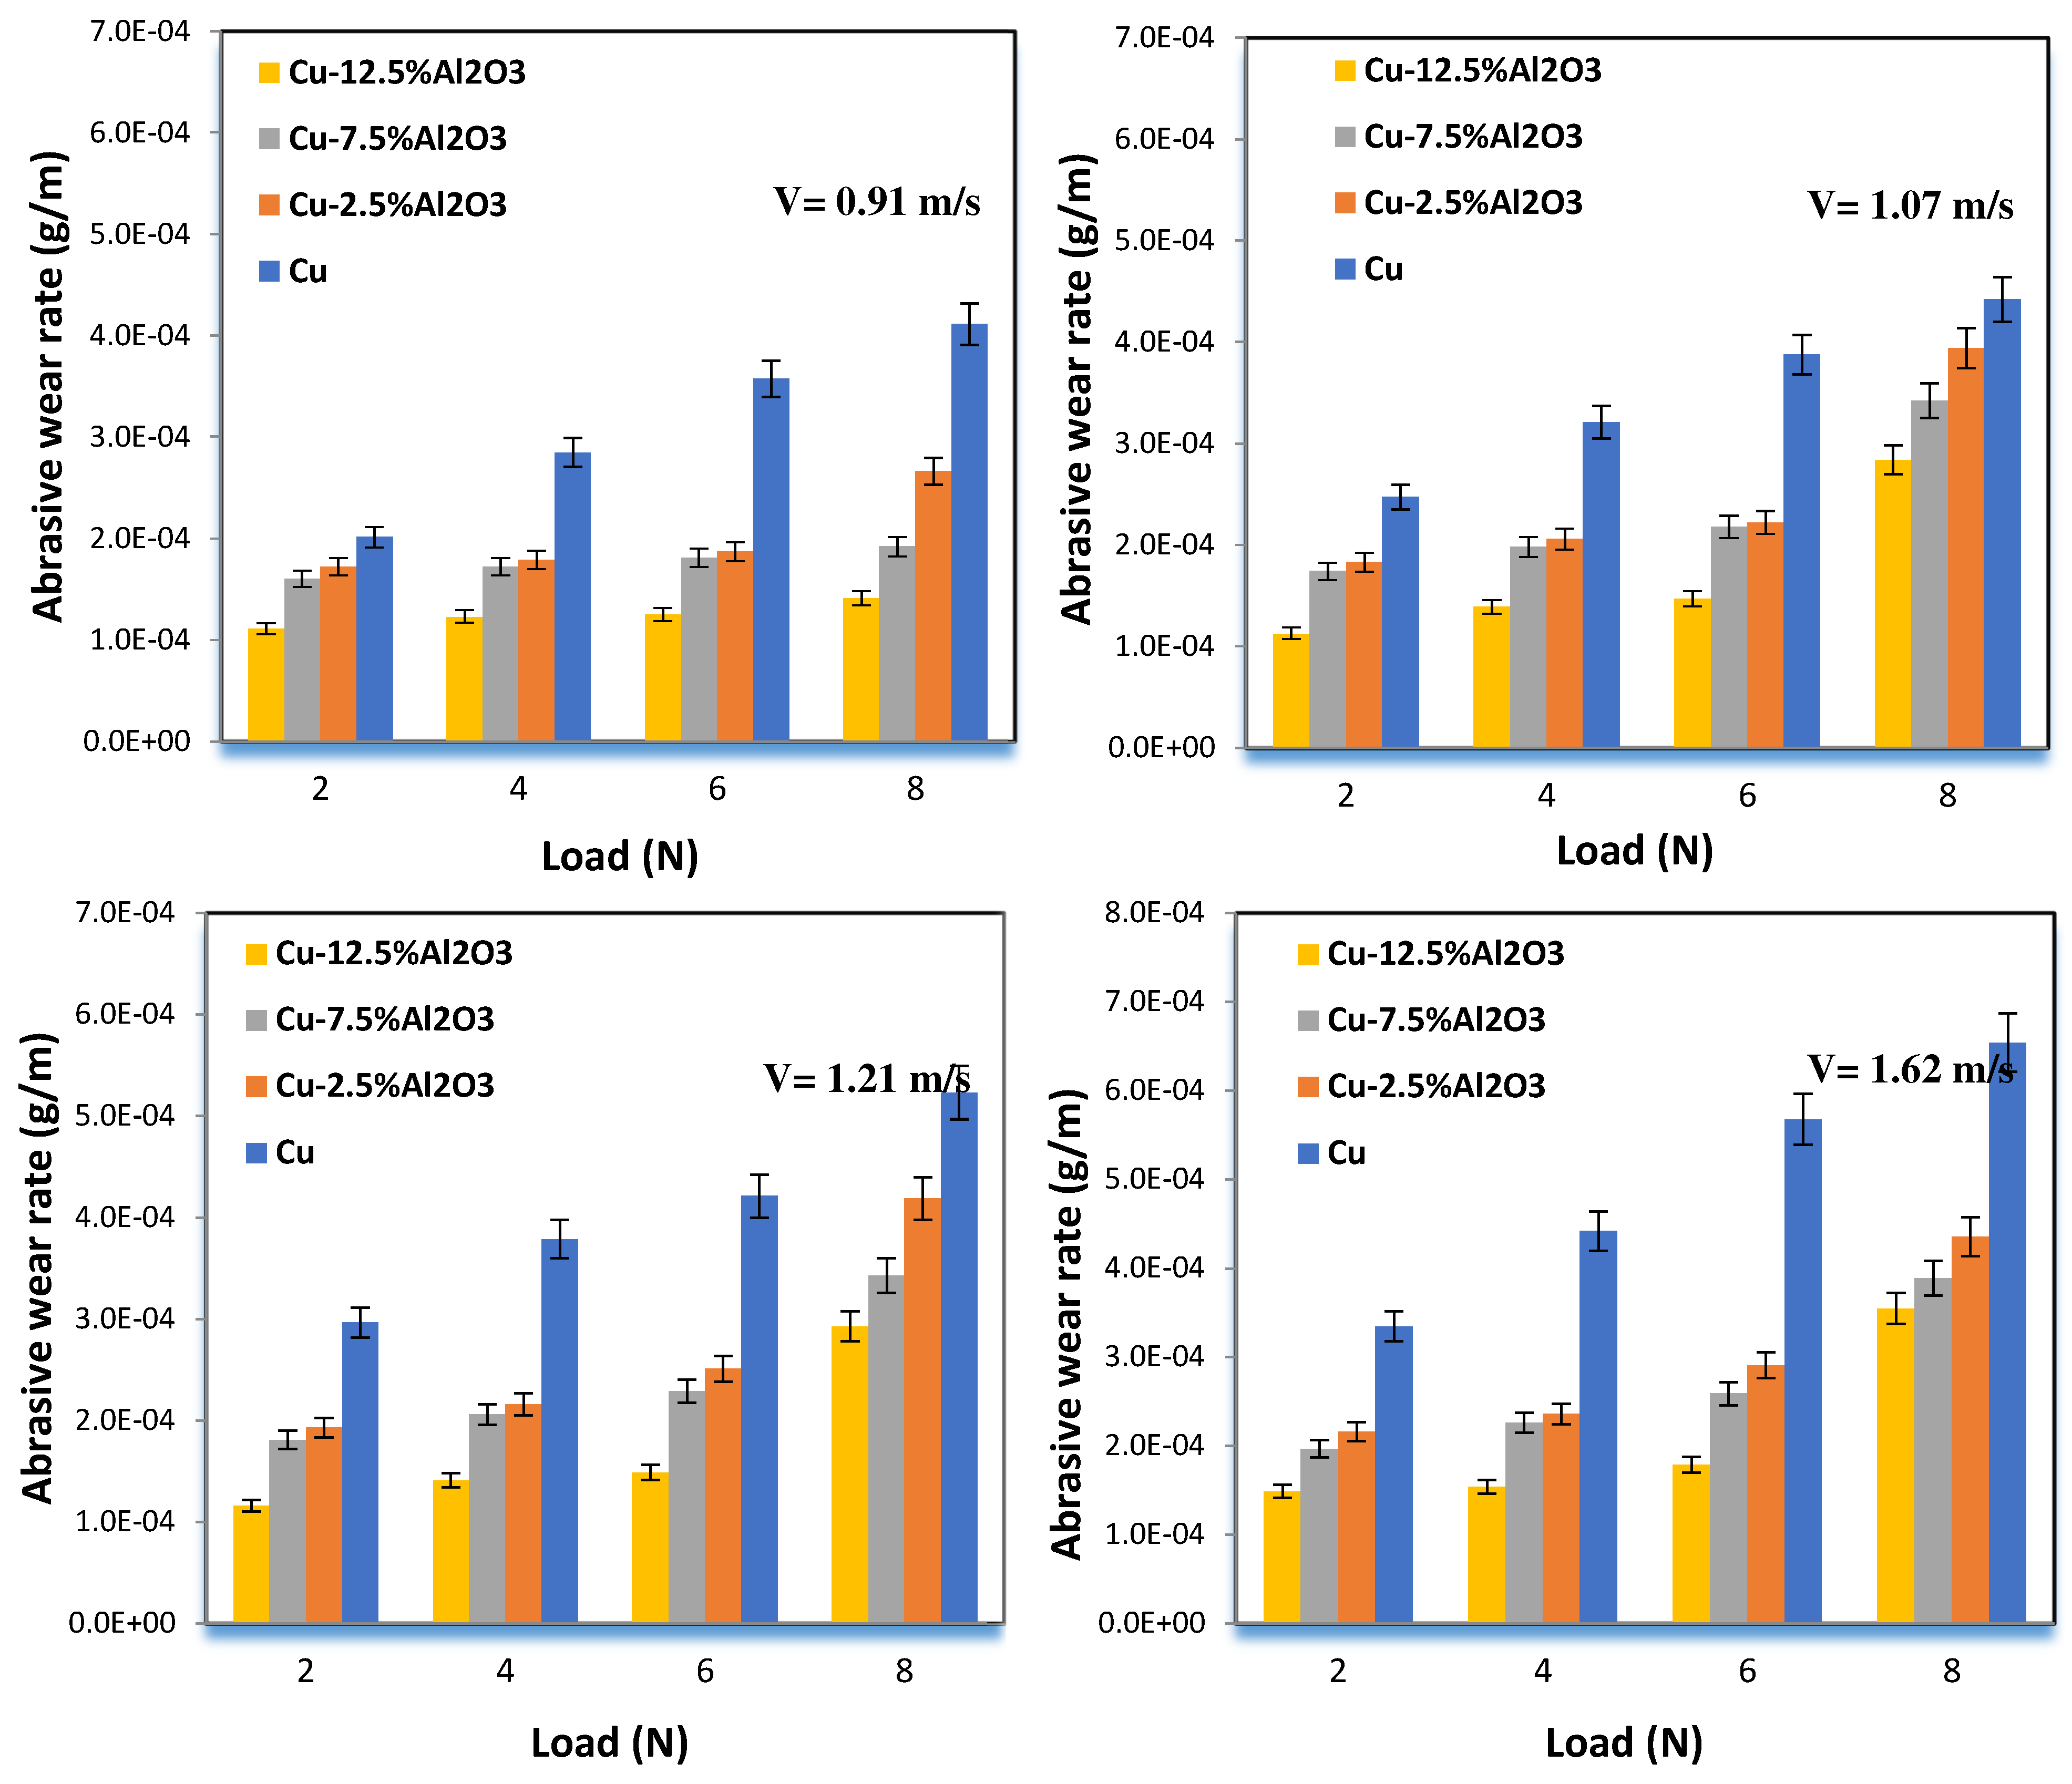
4.1. Structural and Tribological Properties

After reduction, the shape of the Cu-7.5%Al2O3 nanocomposite powders is shown in Figure 3. As seen in Figure 3a, the particles cluster to form large particle clusters of around 200 nm average size. The roughly spherical form of the generated particles after reduction improves wettability throughout phases [29,31]. The microstructure of solidified composites is influenced by the form of reinforcing particles [56]. Figure 3b demonstrates that the particle size after the chemical procedure is nanoscale.
The XRD results of the same composite are given in Figure 3c to guarantee the sample’s chemical composition following the chemical treatment. This study demonstrates that the sample only contains Cu and Al2O3 phases, with no impurities from chemical processes. This provides proof of the manufacturing process’s authenticity as well as the composition of the materials produced.
A phase-mapping analysis of the Cu−7.5%Al2O3 nanocomposite is shown in Figure 4. The figure demonstrates that the material does not contain any contaminants because only the three components are observed, which indicates that Al2O3 nanoparticles are homogenously distributed inside the Cu matrix. The presence of Al2O3 at grain boundaries decreases the capacity of grains to re-weld during sintering, resulting in welded grains of a large size, similar to pure metal behavior. As a result, the presence of Al2O3 nanoparticles reinforces the grains by penetrating the grains’ lamellar structure and precipitating on the grain borders. The good distribution of Al2O3 inside the Cu is another key element that influences the characteristics of nanocomposites [27,28,57].
Figure 5 depicts the difference in microhardness with Al2O3 concentrations. In general, microhardness is generally increased by increasing Al2O3 content, as low as 12.5% Al2O3. These findings are consistent with the densification parameters and microstructure. This can be explained by (i) good sinterability, (ii) better microstructure with uniform small pores and good distribution of Al2O3 on the Cu matrix, and (iii) high densities. In addition, the sintering temperature and time were appropriate in order to prevent grain growth. A strong bond between the matrix and reinforcements is also responsible for microhardness improvement. In this figure, the effect of Al2O3 content on microhardness consists of improved microhardness up to 12.5% Al2O3. The main cause of microhardness improvement is the existence of Al2O3, which possesses high microhardness and assists in reducing deformation at the contact surface. Moreover, the grain refinement helps with the dislocation impedance, which contributes to the microhardness improvement as well [58]. Because of the reduced size of crystallites, there are more grain boundaries, which obstruct dislocation movement and thus increase microhardness.
Figure 6 depicts the effects of Al2O3 concentrations on the abrasive wear rate of a Cu-Al2O3 nanocomposite tested at four different loads. The pattern of the results is nearly identical for the four considered loads, with abrasive wear rates reduced by up to 12.5% Al2O3 content. With increasing applied loads, the abrasive wear rate for specimens increases. The wear rate is determined by the material’s physical and mechanical properties [59,60,61,62]. The hardness and strength of the material are observed to increase in samples containing up to 12.5% Al2O3, as discussed in this section, resulting in lower rates of wear. Both properties, however, are reduced after this value, indicating an increased wear rate because of agglomeration, which provides a larger surface area for plastic deformation and simple material removal. However, after this value, both properties are reduced, indicating a higher wear rate due to agglomeration, which provides a larger area for plastic deformation and easy material removal.

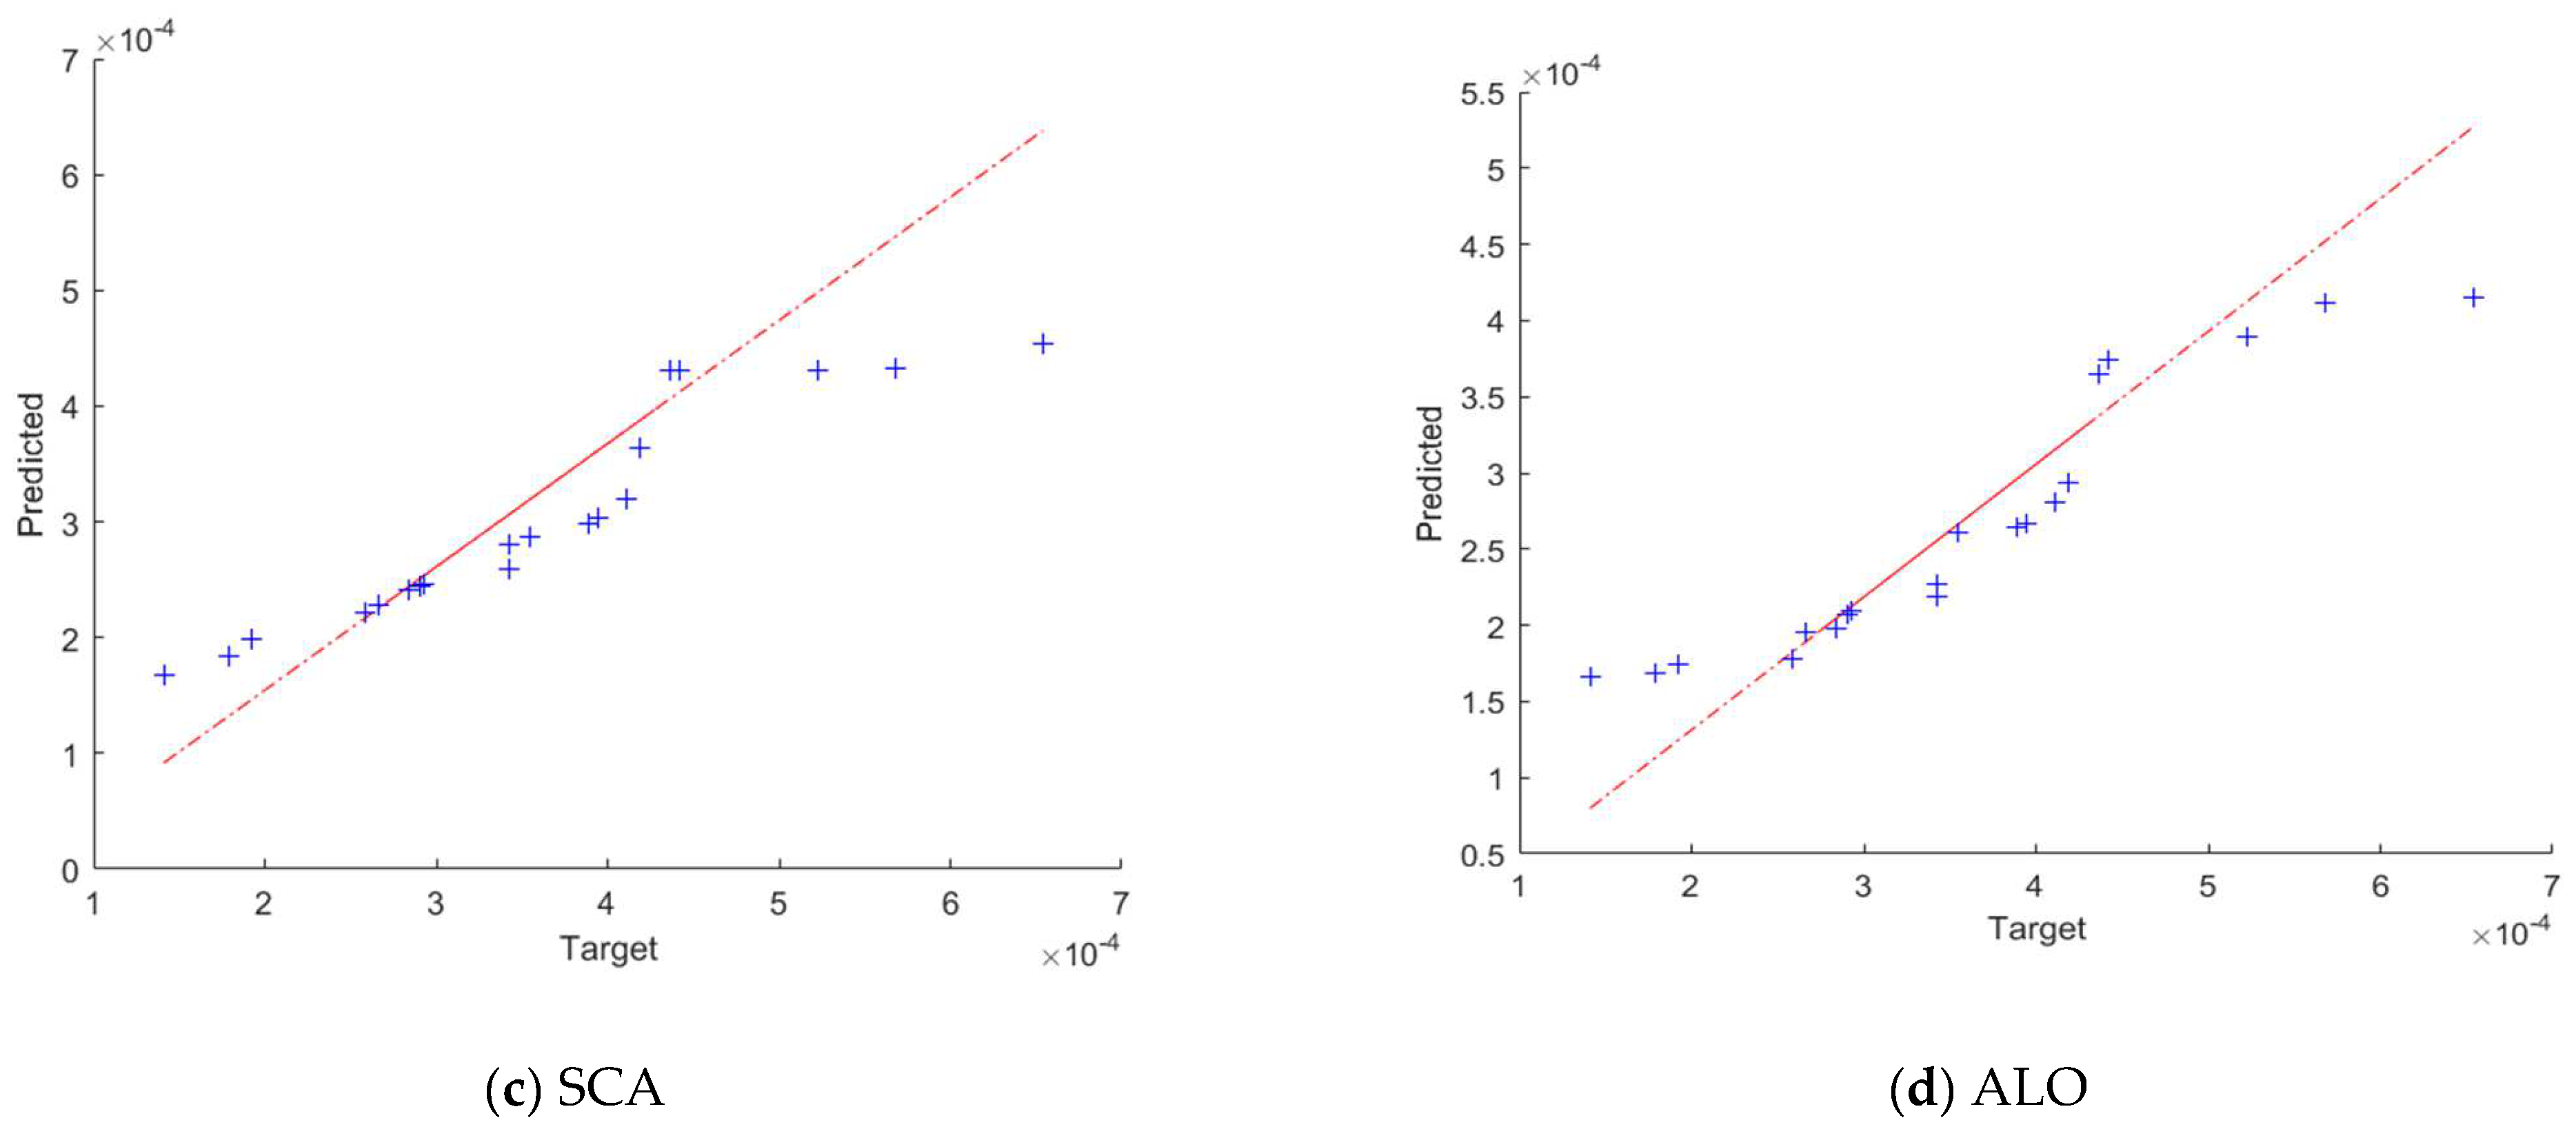
4.2. Prediction of Wear Rates Using the Improved RVFL Model

Within this section, the efficiency of the developed method to predict the wear rates is compared with traditional RVFL and evaluated. In addition, the data consist of the volume fraction, load, and speed as input and wear rate as target value. The data set is split into 70% training and 30% testing sets, and this was conducted 25 independent times. The performance of the RVFL-AHA is compared with other methods, including sine-cosine algorithm (SCA), salp swarm algorithm (SSA), and ant lion optimizer (ALO). The parameter setting of these methods are assigned according to the original implementation of each of them. A set of performance measures was used to assess the performance of such as: root mean square error (RMSE), mean absolute error (MAE), and coefficient of determination R2. These measures are defined as:
R 2 = ( i = 1 n s ( d i d ¯ ) ( y i y ¯ ) ) 2 i = 1 n s ( d i d ¯ ) 2 × i = 1 n s ( y i y ¯ ) 2  
R M S E = 1 n s i = 1 n s ( d i y i ) 2  
M A E = 1 n s i = 1 n s | d i y i |
In Equations (16)–(18), n s ,   d ,   y ,   d ¯ ,   and   y ¯ represent the number of testing/training samples, observed value, predicted value, average of observed values, and average of predicted values, respectively.
The results of the developed RVFL-AHA and other methods, including SCA, SSA, and ALO, are illustrated in Table 1 and Figure 7. It can be noticed from these results that the developed RVFL-AHA has higher performance than SSA, SCA, and ALO. For instance, the ability of RVFL-AHA to learn from the training set is better than others as observed from RMSE, R2, and MAE. The difference between RVFL-SSA, RVFL-SCA, and RVFL-ALO with RVFL-AHA is 8.9200 × 10⁶, 8.6500 × 10⁶, and 2.7900 × 10⁶, respectively, in terms of RMSE. In case of using the testing set, it can be noticed that the presented RVFL-AHA has higher R2 than RVFL, whereas it has smaller RMSE and MAE than between RVFL-SSA, RVFL-SCA, and RVFL-ALO. Moreover, Figure 7 depicts the QQ plots for wear rate and its predicted value using RVFL-SSA, RVFL-SCA, RVFL-ALO, and RVFL-AHA for the testing set. It can be seen from this figure that the RVFL-SCA and RVFL-ALO nearly have the same correlation during the learning stage. However, the developed RVFL-AHA is a better fit than other methods since the data group around the straight line during the testing set.
According to the previous discussion, it can be noticed the performance of developed RVFL-AHA is better than other methods. However, the proposed RVFL-AHA still has some limitations, such as time complexity, since the number of solutions and parameters have high influence on this computational method. This can be solved by using parallel processing technique.

5. Conclusions

An enhanced machine learning model based on Random Vector Functional Link was developed in this work to predict the wear rates of Cu-Al2O3 nanocomposites with different Al2O3 content and tested at different wear rate conditions. An in situ chemical reaction method was used to produce Cu-Al2O3 nanocomposites with good Al2O3 nanoparticles dispersion. The produced samples were tested to characterize their microstructure and mechanical and tribological properties. The characterization results showed great enhancement in the mechanical and tribological properties of the composites, reaching 100% and 55% for the composite containing 12.5% Al2O3 nanoparticles. This huge improvement is due to the presence of Al2O3 nanoparticles that possesses excellent properties and their good dispersion inside the Cu matrix, which increases the impedance of the material to penetration loads.
The developed machine learning model using artificial hummingbird algorithm (AHA) to enhance the performance of the Random Vector Functional Link (RVFL) to predict the wear rate. The results showed that the model was able to predict the wear rates of all the produced composites, with different Al2O3 content being tested at different wear conditions as well as different loads and speeds. The accuracy of the proposed model was checked using coefficient of determination R2, achieving nearly 100% and 99.5% using training and testing sets, respectively.

Author Contributions

A.M.S. (project administration, funding acquisition, data curation); I.R.N. (software, validation, formal analysis, investigation); G.S.A. (formal analysis, investigation); M.S.A.-E. (software, visualization, data curation); M.A.E. (conceptualization, methodology, formal analysis); A.F. (conceptualization, methodology, review and editing). All authors have read and agreed to the published version of the manuscript.

Funding

The authors extend their appreciation to the Deputyship for Research and Innovation, Ministry of Education in Saudi Arabia, for funding this research work through the project number (IFPRC−015−135−2020) and King Abdulaziz University, DSR, Jeddah, Saudi Arabia.

Institutional Review Board Statement

Not applicable.

Informed Consent Statement

Not applicable.

Data Availability Statement

Not applicable.

Conflicts of Interest

The authors declare no conflict of interest.

References

  1. Rajkovic, V.; Bozic, D.; Jovanovic, M.T. Effects of copper and Al2O3 particles on characteristics of Cu–Al2O3 composites. Mater. Des. 2010, 31, 1962–1970. [Google Scholar] [CrossRef]
  2. Casati, R.; Vedani, M. Metal Matrix Composites Reinforced by Nano-Particles—A Review. Metals 2014, 4, 65–83. [Google Scholar] [CrossRef]
  3. Wagih, A.; Fathy, A.; Sebaey, T.A. Experimental investigation on the compressibility of Al/Al2O3 nanocomposites. Int. J. Mater. Prod. Technol. 2016, 52, 312–332. [Google Scholar] [CrossRef]
  4. Tjong, S.C.; Lau, K.C. Tribological behaviour of SiC particle-reinforced copper matrix composites. Mater. Lett. 2000, 43, 274–280. [Google Scholar] [CrossRef]
  5. Sadoun, A.M.; Abd El-Wadoud, F.; Fathy, A.; Kabeel, A.M.; Megahed, A.A. Effect of through-the-thickness position of aluminum wire mesh on the mechanical properties of GFRP/Al hybrid composites. J. Mater. Res. Technol. 2021, 15, 500–510. [Google Scholar] [CrossRef]
  6. Vettivel, S.; Selvakumar, N.; Leema, N.; Lenin, A. Electrical resistivity, wear map and modeling of extruded tungsten reinforced copper composite. J. Mater. Des. 2014, 56, 791–806. [Google Scholar] [CrossRef]
  7. Sadoun, A.M.; Meselhy, A.F.; Deabs, A.W. Improved strength and ductility of friction stir tailor-welded blanks of base metal AA2024 reinforced with interlayer strip of AA7075. Results Phys. 2020, 16, 102911. [Google Scholar] [CrossRef]
  8. Shaat, M.; Fathy, A.; Wagih, A. Correlation between grain boundary evolution and mechanical properties of ultrafine-grained metals. Mech. Mater. 2020, 143, 103321. [Google Scholar] [CrossRef]
  9. Sadoun, A.M.; Wagih, A.; Fathy, A.; Essa, A.R.S. Effect of tool pin side area ratio on temperature distribution in friction stir welding. Results Phys. 2019, 15, 102814. [Google Scholar] [CrossRef]
  10. Varol, T.; Canakci, A. Microstructure, electrical conductivity and hardness of multilayer graphene/Copper nanocomposites synthesized by flake powder metallurgy. Met. Mater. Int. 2015, 21, 704–712. [Google Scholar] [CrossRef]
  11. Samal, C.; Parihar, J.; Chaira, D. The effect of milling and sintering techniques on mechanical properties of Cu–graphite metal matrix composite prepared by powder metallurgy route. J. Alloy. Compd. 2013, 569, 95–101. [Google Scholar] [CrossRef]
  12. Saber, D.; El-Aziz, K.A.; Fathy, A. Corrosion behavior of copper—Alumina nanocomposites in different corrosive media. Int. J. Mech. Eng. 2016, 5, 1–10. [Google Scholar]
  13. Elmahdy, M.; Abouelmagd, G.; Mazen, A.A.E. Microstructure and properties of Cu-ZrO2 nanocomposites synthesized by in situ processing. Mater. Res. 2018, 21, 1103–1107. [Google Scholar] [CrossRef] [Green Version]
  14. Elmahdy, M.; Abouelmagd, G.; Mazen, A.A. Investigation on microstructure and thermal properties of in-situ synthesized Cu–ZrO2 nanocomposites. Int. J. Mater. Res. 2017, 108, 1103–1107. [Google Scholar] [CrossRef]
  15. Xiao, J.; Zhang, L.; Zhou, K.; Wang, X. Microscratch behavior of copper–Graphite composites. J. Tribol. Int. 2013, 57, 38–45. [Google Scholar] [CrossRef]
  16. Rodrigues, I.; Guedes, M.; Ferro, A. Processing of Copper-Graphite-Alumina Powders by High-Energy Milling. In Proceedings of the PM2014 World Congress-Proceedings of the 2014 World Conference on Powder Metallurgy, Orlando, FL, USA, 18–22 May 2014. [Google Scholar]
  17. Khamaj, A.; Farouk, W.M.; Shewakh, W.M.; Abu-Oqail AM, I.; Wagih, A.; Abu-Okail, M. Effect of lattice structure evolution on the thermal and mechanical properties of Cu–Al2O3/GNPs nanocomposites. Ceram. Int. 2021, 47, 16511–16520. [Google Scholar] [CrossRef]
  18. Gao, X.; Yue, H.; Guo, E.; Zhang, H.; Lin, X.; Yao, L.; Wang, B. Preparation and tensile properties of homogeneously dispersed graphene reinforced aluminum matrix composites. Mater. Des. 2016, 94, 54–60. [Google Scholar] [CrossRef]
  19. Sadoun, A.M.; Najjar, I.M.R.; Abd-Elwahed, M.S.; Meselhy, A. Experimental study on properties of Al–Al2O3 nanocomposite hybridized by graphene nanosheets. J. Mater. Res. Technol. 2020, 9, 14708–14717. [Google Scholar] [CrossRef]
  20. Abd-Elwahed, M.S.; Wagih, A.; Najjar, I.M.R. Correlation between micro/nano-structure, mechanical and tribological properties of copper-zirconia nanocomposites. Ceram. Int. 2020, 46, 56–65. [Google Scholar] [CrossRef]
  21. Fathy, A. Investigation on microstructure and properties of Cu-ZrO2 nanocomposites synthesized by in situ processing. Mater. Lett. 2018, 213, 95–99. [Google Scholar] [CrossRef]
  22. Abd-Elwahed, M.S.; Ibrahim, A.F.; Reda, M.M. Effects of ZrO2 nanoparticle content on microstructure and wear behavior of titanium matrix composite. J. Mater. Res. Technol. 2020, 9, 8528–8534. [Google Scholar] [CrossRef]
  23. Torabi, H.; Arghavanian, R. Investigations on the corrosion resistance and microhardness of Cu–10Sn/SiC composite manufactured by powder metallurgy process. J. Alloy. Compd. 2019, 806, 99–105. [Google Scholar] [CrossRef]
  24. Meselhy, A.F.; Reda, M.M. Investigation of mechanical properties of nanostructured Al-SiC composite manufactured by accumulative roll bonding. J. Compos. Mater. 2019, 53, 3951–3961. [Google Scholar] [CrossRef]
  25. Wagih, A.; Abu-Oqail, A.; Fathy, A. Effect of GNPs content on thermal and mechanical properties of a novel hybrid Cu-Al2O3/GNPs coated Ag nanocomposite. J. Ceram. Intern. 2019, 45, 1115–1124. [Google Scholar] [CrossRef]
  26. Sadoun, A.M.; Fathy, A.; Abu-Oqail, A.; Elmetwaly, H.T.; Wagih, A. Structural, mechanical and tribological properties of Cu–ZrO2/GNPs hybrid nanocomposites. Ceram. Int. 2020, 46, 7586–7594. [Google Scholar] [CrossRef]
  27. Ramkumar, K.R.; Sivasankaran, S.; Alaboodi, A.S. Effect of alumina content on microstructures, mechanical, wear and machining behavior of Cu-10Zn nanocomposite prepared by mechanical alloying and hot-pressing. J. Alloy. Compd. 2017, 709, 129–141. [Google Scholar] [CrossRef]
  28. Yadav, R.S.; Yadava, V. Experimental investigations on electrical discharge diamond peripheral surface grinding (EDDPSG) of hybrid metal matrix composite. J. Manuf. Process. 2017, 27, 241–251. [Google Scholar] [CrossRef]
  29. Sadoun, A.; Ibrahim, A.; Abdallah, A.W. Fabrication and evaluation of tribological properties of Al2O3 coated Ag reinforced copper matrix nanocomposite by mechanical alloying. J. Asian Ceram. Soc. 2020, 8, 1228–1238. [Google Scholar] [CrossRef]
  30. Barakat, W.S.; Wagih, A.; Elkady, O.A.; Abu-Oqail, A.; Fathy, A.; EL-Nikhaily, A. Effect of Al2O3 nanoparticles content and compaction temperature on properties of Al–Al2O3 coated Cu nanocomposites. Compos. Part B Eng. 2019, 175, 107140. [Google Scholar] [CrossRef]
  31. Sadoun, A.M.; Meselhy, A.F.; Abdallah, A.W. Microstructural, mechanical and wear behavior of electroless assisted silver coated Al2O3–Cu nanocomposites. Mater. Chem. Phys. 2021, 266, 124562. [Google Scholar] [CrossRef]
  32. Megahed, M.; Fathy, A.; Morsy, D.; Shehata, F. Mechanical Performance of glass/epoxy composites enhanced by micro-and nanosized aluminum particles. J. Ind. Text. 2021, 51, 68–92. [Google Scholar] [CrossRef]
  33. Güler, O.; Cuvalci, H.; Canakci, A.; Celebi, M. The Effect of Nano Graphite Particle Content on the Wear Behaviour of ZA27 Based Hybrid Composites. Adv. Compos. Lett. 2017, 26, 30–36. [Google Scholar] [CrossRef] [Green Version]
  34. Wagih, A. Mechanical properties of Al–Mg/Al2O3 nanocomposite powder produced by mechanical alloying. Adv. Powder Technol. 2015, 26, 253–258. [Google Scholar] [CrossRef]
  35. Raj, R.; Thakur, D.G. Qualitative and Quantitative Assessment of Microstructure in Al-B4C Metal Matrix Composite Processed by Modified Stir Casting Technique. Arch. Civ. Mech. Eng. 2016, 16, 949–960. [Google Scholar] [CrossRef]
  36. Bhatt, J.; Balachander, N.; Shekher, S.; Karthikeyan, R.; Peshwe, D.R.; Murty, B.S. Synthesis of Nanostructured Al-Mg-SiO2 Metal Matrix Composites Using High- Energy Ball Milling and Spark Plasma Sintering. J. Alloy. Compd. 2012, 536, S35–S40. [Google Scholar] [CrossRef]
  37. Wagih, A. Synthesis of nanocrystalline Al2O3 reinforced Al nanocomposites by high-energy mechanical alloying: Microstructural evolution and mechanical properties. Trans. Indian Inst. Met. 2016, 69, 851–857. [Google Scholar] [CrossRef]
  38. Canakci, A.; Varol, T.; Cuvalci, H.; Erdemir, F.; Ozkaya, S. Development and Characterization of Bronze-Cr-Ni Composites Produced by Powder Metallurgy. Sci. Eng. Compos. Mater. 2015, 22, 425–432. [Google Scholar] [CrossRef]
  39. Wagih, A.; Fathy, A. Improving compressibility and thermal properties of Al–Al2O3 nanocomposites using Mg particles. J. Mater. Sci. 2018, 53, 11393–11402. [Google Scholar] [CrossRef]
  40. Mohamed, A.; Mohammed, M.M.; Ibrahim, A.F.; El-Kady, O.A. Effect of nano Al2O3 coated Ag reinforced Cu matrix nanocomposites on mechanical and tribological behavior synthesis by P/M technique. J. Compos. Mater. 2020, 54, 4921–4928. [Google Scholar] [CrossRef]
  41. Wagih, A. Effect of Mg addition on mechanical and thermoelectrical properties of Al–Al2O3 nanocomposite. Trans. Nonferrous Met. Soc. China 2016, 26, 2810–2817. [Google Scholar] [CrossRef]
  42. Wagih, A. Effect of milling time on morphology and microstructure of Al-Mg/Al2O3 nanocomposite powder produced by mechanical alloying. Int. J. Adv. Eng. Sci. 2014, 4, 1–7. [Google Scholar]
  43. Cipolloni, G.; Menapace, C.; Pellizzari, M.; Ischia, G. Differences of the microstructural evolution of Cu powder during continuous and interrupted mechanical milling. Powder Metall. 2017, 60, 232–239. [Google Scholar] [CrossRef]
  44. Khatir, S.; Boutchicha, D.; le Thanh, C.; Tran-Ngoc, H.; Nguyen, T.N.; Abdel-Wahab, M. Improved ANN technique combined with Jaya algorithm for crack identification in plates using XIGA and experimental analysis. Theor. Appl. Fract. Mech. 2020, 107, 102554. [Google Scholar] [CrossRef]
  45. Zenzen, R.; Khatir, S.; Belaidi, I.; le Thanh, C.; Wahab, M.A. A modified transmissibility indicator and Artificial Neural Network for damage identification and quantification in laminated composite structures. Compos. Struct. 2020, 248, 112497. [Google Scholar] [CrossRef]
  46. Wang, S.; Wang, H.; Zhou, Y.; Liu, J.; Dai, P.; Du, X.; Wahab, M.A. Automatic laser profile recognition and fast tracking for structured light measurement using deep learning and template matching. Measurement 2021, 169, 108362. [Google Scholar] [CrossRef]
  47. Zhao, W.; Wang, L.; Mirjalili, S. Artificial hummingbird algorithm: A new bio-inspired optimizer with its engineering applications. Comput. Methods Appl. Mech. Eng. 2022, 388, 114194. [Google Scholar] [CrossRef]
  48. Hasheminejad, N.; Pipintakos, G.; Vuye, C.; De Kerf, T.; Ghalandari, T.; Blom, J. Utilizing deep learning and advanced image processing techniques to investigate the microstructure of a waxy bitumen. Constr. Build. Mater. 2021, 313, 125481. [Google Scholar] [CrossRef]
  49. Dobbelaere, M.R.; Plehiers, P.P.; Van de Vijver, R.; Stevens, C.V.; Van Geem, K.M. Machine learning in chemical engineering: Strengths, weaknesses, opportunities, and threats. Engineering 2021, 7, 1201–1211. [Google Scholar] [CrossRef]
  50. Zhong, S.; Zhang, K.; Bagheri, M.; Burken, J.G.; Gu, A.; Li, B.; Ma, X.; Marrone, B.L.; Ren, Z.J.; Schrier, J.; et al. Machine Learning: New Ideas and Tools in Environmental Science and Engineering. Environ. Sci. Technol. 2021, 55, 12741–12754. [Google Scholar] [CrossRef]
  51. Sadoun, A.M.; Najjar, I.R.; Alsoruji, G.S.; Wagih, A.; Elaziz, M.A. Utilizing a Long Short-Term Memory Algorithm Modified by Dwarf Mongoose Optimization to Predict Thermal Expansion of Cu-Al2O3 Nanocomposites. Mathematics 2022, 10, 1050. [Google Scholar] [CrossRef]
  52. Najjar IM, R.; Sadoun, A.M.; Alsoruji, G.S.; Abd Elaziz, M.; Wagih, A. Predicting the mechanical properties of Cu–Al2O3 nanocomposites using machine learning and finite element simulation of indentation experiments. Ceram. Int. 2022, 48, 7748–7758. [Google Scholar] [CrossRef]
  53. Elmaadawy, K.; Elaziz, M.A.; Elsheikh, A.H.; Moawad, A.; Liu, B.; Lu, S. Utilization of random vector functional link integrated with manta ray foraging optimization for effluent prediction of wastewater treatment plant. J. Environ. Manag. 2021, 298, 113520. [Google Scholar] [CrossRef] [PubMed]
  54. Khoshaim, A.B.; Moustafa, E.B.; Bafakeeh, O.T.; Elsheikh, A.H. An Optimized Multilayer Perceptrons Model Using Grey Wolf Optimizer to Predict Mechanical and Microstructural Properties of Friction Stir Processed Aluminum Alloy Reinforced by Nanoparticles. Coatings 2021, 11, 1476. [Google Scholar] [CrossRef]
  55. Zayed, M.E.; Zhao, J.; Li, W.; Elsheikh, A.H.; Elaziz, M.A. A hybrid adaptive neuro-fuzzy inference system integrated with equilibrium optimizer algorithm for predicting the energetic performance of solar dish collector. Energy 2021, 235, 121289. [Google Scholar] [CrossRef]
  56. Sadoun, A.M.; Mohammed, M.M.; Fathy, A.; El-Kady, O.A. Effect of Al2O3 addition on hardness and wear behavior of Cu–Al2O3 electro-less coated Ag nanocomposite. J. Mater. Res. Technol. 2020, 9, 5024–5033. [Google Scholar] [CrossRef]
  57. Abd-Elwahed, M.S.; Meselhy, A.F. Experimental investigation on the mechanical, structural and thermal properties of Cu–ZrO2 nanocomposites hybridized by graphene nanoplatelets. Ceram. Int. 2020, 46, 9198–9206. [Google Scholar] [CrossRef]
  58. Asiri, S.; Wagih, A.; Eltaher, M.A. Predictive model for spherical indentation on elastoplastic nanocomposites: Loading and unloading behavior. Ceram. Int. 2019, 45, 3088–3100. [Google Scholar] [CrossRef]
  59. Wagih, A.; Shaat, M. The dependence of accumulative roll bonded copper mechanical properties on grain sub-division, stacking faults, and lattice strains. Mater. Sci. Eng. A 2019, 756, 190–197. [Google Scholar] [CrossRef]
  60. Sadoun, A.M.; Mohammed, M.M.; Elsayed, E.M.; Meselhy, A.F.; El-Kady, O.A. Effect of nano Al2O3 coated Ag addition on the corrosion resistance and electrochemical behavior of Cu-Al2O3 nanocomposites. J. Mater. Res. Technol. 2020, 9, 4485–4493. [Google Scholar] [CrossRef]
  61. Elwan, M.; Fathy, A.; Wagih, A.; Essa AR, S.; Abu-Oqail, A.; EL-Nikhaily, A.E. Fabrication and investigation on the properties of ilmenite (FeTiO3)-based Al composite by accumulative roll bonding. J. Compos. Mater. 2020, 54, 1259–1271. [Google Scholar] [CrossRef]
  62. Omer, G.L.; Ertan, E. The investigation of contact performance of oxide reinforced copper composite via mechanical alloying. J. Mater. Process. Technol. 2009, 209, 1286–1290. [Google Scholar]
Figure 1. The RVFL network.
Mathematics 10 01266 g001
Figure 2. The RVFL-AHA for prediction of wear rate.
Mathematics 10 01266 g002
Figure 3. (a) FESEM micrograph of the Cu−7.5%Al2O3 nanocomposite powder, (b) magnified view of showing the exact morphology of powders, and (c) XRD analysis of the produced powder.
Mathematics 10 01266 g003
Figure 4. Mapping and EDS analysis of Cu−7.5%Al2O3 nanocomposite.
Mathematics 10 01266 g004
Figure 5. Effect of Al2O3 contents on the hardness of Cu-Al2O3 nanocomposite.
Mathematics 10 01266 g005
Figure 6. Abrasive wear rate as function of applied loads of Cu-Al2O3 nanocomposites at different sliding speeds.
Mathematics 10 01266 g006
Figure 7. The QQ-plots of the wear rate and its prediction using AHA, SSA, SCA, and ALO.
Mathematics 10 01266 g007aMathematics 10 01266 g007b
Table 1. Results of proposed algorithm RVFL-AHA.
Training SetTesting Set
AHASSASCAALOAHASSASCAALO
R210.99850.99860.99980.95540.91950.92940.9034
RMSE1.27 × 10188.92 × 1068.65 × 1062.79 × 1068.04 × 1050.0001080.0001010.000118
MAE1.14 × 10186.61 × 1066.19 × 1061.25 × 1066.1 × 1058.8 × 1058.84 × 1059.9 × 105
Publisher’s Note: MDPI stays neutral with regard to jurisdictional claims in published maps and institutional affiliations.

