1. Introduction
Global economic development is a desideratum for national economies because global economic flows are converging towards better meeting resource needs and optimising the supply–demand ratio. The globalisation of capital markets has been talked about since 1980, but the complete elimination of capital controls was not implemented until after 1991, with the exception of China. The globalisation of capital markets has driven global funds towards a risk-adjusted dividend. Within this context, we proposed a regional analysis (America, Europe and Asia) of market convergence and the extent to which information asymmetries have been eliminated through the harmonisation of accounting frameworks. In our analysis, we started from the premise that the need for common accounting treatments across jurisdictions is obvious. The size and complexity of this scientific endeavour was strongly influenced by the accessibility and volume of official information that is available within the field.
The main instruments that help to achieve global development goals are international commodity and stock exchanges. Within the context of various economic, health or war crises, the work of these institutions is affected and the interests of investors change, which calls into question the assurance of economic and financial evolution to cover the interests of investors and to ensure the transparency that is necessary for global economic activity.
The globalisation of financial capital is a phenomenon that has taken on increasingly consistent characteristics with advances in digitisation and technological progress. Within this context, access to quality financial information is the basis for sustainable investment decisions.
The quality of accounting information is a significant element for investor confidence in a financial market. Under the influence of an economic crisis, the retrospective components that materialise in the accounting information that is transmitted in the form of financial reports are adjusted in relation to the prospective components of the quotations. Thus, during times of crisis, investment decisions take into account the ability of the market to remunerate investors more than confidence in the future return of investments in assets. This fair value dilemma prompted the introduction of the option for firms to switch from fair value to historical acquisition costs for the valuation of their investment portfolios in 2008.
The uncertainty of transactions and the volatility of economic capital have led international financial reporting bodies and IASC/IASB committees to adopt the principle of the convergence of information in order to standardise the risk of the misrepresentation of accounting information. With the introduction of international accounting standards and the adherence to these standards by a significant number of countries, the financial reporting process has been greatly improved, which has partially reduced the reporting errors that were found previously.
In practice, financial risk is still observable, which motivated the elaboration of this study to crystallise security risks and improve the quality of accounting and financial information, based on price volatility and financial risk.
Financial markets represent a barometer of financial flows at national and supranational levels and include the system for the quotation and valuation of securities under general and special clauses as a specific element, which guarantees the transparency of the transactions that are taking place within these markets. The main instruments that are made available to stakeholders are stock market indices, whose rules for selecting securities in the portfolios are specific to each financial market and cause on the basis of the perpetual changes in prices, stakeholder behaviours within the investment segment and the behaviour of listed entities in relation to financial risk. By adding clearing and settlement for stock exchange transactions, we obtain a complex picture that is difficult to integrate into a single study, especially as this study aimed to address the issue of accounting convergence and uniform accounting treatments across global markets.
Within this context, we defined the development of a volatility matrix model that was based on the gravity model of economic development as the main objective of this study, with the aim of providing a prediction of the vulnerabilities of economic capital accumulation according to the regional economic peculiarities of trading markets.
The specific objectives are: (O1) the development and substantiation of the study hypotheses based on a literature review; (O2) the identification of the variables to be modelled using dedicated statistical software; (O3) the model development, testing and validation; and (O4) the dissemination of the research results.
This paper is structured in the following sections: a literature review, which covers the representative works within the field; the methodology, which presents the methodological approach and the conceptualisation of the proposed model; the results and discussion, which contains a demonstration of the research hypotheses and the dissemination of the results. The last section contains proposals for further developments and solutions to the problems that were observed in this study.
2. Literature Review
Given the state of the financial markets that have been affected by economic crises, we assessed the modal shift in vulnerability that has been attributed as being volatile and quantifiable to accounting information, based on the gravity model of economic development (see
Figure 1). This model is based on the perpetual economic flows and takes into account the limitations of market access that are in line with investor confidence in the accounting information that is reported by listed companies. The gravity model has evolved from the initial model [
1] into more advanced forms [
2].
In order to achieve the objectives of this research, we proposed to follow up the opinions in the literature that validate or do no validate the following scheme:
A composite financial risk approach was carried out by [
3], who combined the pricing of risk, leverage, the mismatch of maturity and liquidity and interconnectedness to achieve systemic risk reduction through preventive measures that could reduce vulnerabilities that have increase the cost of financial intermediation.
Another seminal paper by [
4] linked leverage, market size and financial stability. The authors proposed a quantitative financial stability analysis model that was based on the correlation between the variables of leverage, margin requirements, interest rates and the net worth of leveraged versus unleveraged investors. According to the authors, over-indebtedness is an element that destabilises long-term capital management, which generates financial vulnerability effects in capital markets. In today’s terms, the global debt crisis means that the transfer of capital through trade flows generates knock-on effects both downstream, on the vulnerability transfer segment, and upstream, based on the need for dynamic overdraft coverage. This aspect is likely to make the views of stakeholders vulnerable, which ultimately represent the actors of investment decisions at the financial market level.
The financial testing of the financial positions of listed companies that applied two of the three types of accounting systems that were analysed by the authors (US GAAP and IFRS) revealed that the implementation of an additional set of convergence accounting rules had a statistically significant impact on the value of accounting information during the period of 2002–2006 (when the convergence process was in full swing) [
5].
On the other hand, another author [
6] highlighted the inequality of income distribution within the global economy, which affects the process. That paper discussed the decline in the global Gini coefficient that is used by the World Bank, which has brought Chinese trade into a position of competitive advantage over other economies. Soon, this competitive advantage could turn into additional liquidity for developed markets and signal the end of the crisis for the countries that benefit from economic growth [
7].
In 2008, the economic crisis triggered changes in the poles of power, which moved the economic balance from the USA to China. Within this context, the main features of the financial systems were weighed and it was found that foreign investment was an addition to the certification of stability and a success card for economic efficiency. As a result, the role of accounting systems was to measure the distance between the reported financial images and the real images that were perceived by the investors during the economic crisis. In this picture, China reduced the economic distance from the US economy by 0.98%, while European countries (France and Germany) reduced the economic distance from the US by more than 50% [
8].
Other authors [
9] have analysed the dependence of economic returns on capital markets in relation to the accounting conservatism of investment firms, which strengthens resistance to the depreciation of accounting assets as opposed to firms being open to investments that face external or asymmetric informational financing needs.
Some authors [
10] have analysed the effects of the financial crisis on the US using a global vector model of error correction. The results of that study reflected that trade with emerging economies during the economic boom stage could be a viable economic measure for overcoming crises, could have an effect on economic recovery and could counterbalance monetary and fiscal easing measures with long-term effects on budget deficits.
The modelling of systemic risks using marginal outcome forecasting was addressed by [
11], who proposed an autoregressive forecasting model with dynamic scoring to be applied to the US financial market. The proposed model started from the definition of systemic risk that was triggered by the economic crisis of 2008–2009 and quantified the market response as a result of factors such as innovation, market asymmetry and log likelihood. Thus, the author noted that each element that is present in the market creates a dependency within the market structure that is assimilated to an internal risk that can lead to the addition of factors and create dysfunctions that are assimilated to risk, based on the variation in the degree of freedom of the system. This interesting approach presented vulnerability as an internal component of the market, but one that must be acquired by the phenomenon of globalisation in order to increase the ability to predict price variations and generate sustainability.
A pragmatic fair value approach to risk was performed by [
12] in a seasonal system using an econometric model that highlighted vulnerability in relation to certain elements, such as capital recognition, increased leverage and the excess physical capitalisation of the entity. In the author’s opinion, the USGAAP system needs to be made more flexible in terms of fair value, which only contributes to risk identification through its regulatory role and omits both the informational component and the possibility of linking fair value volatility (capital recognition) to investment security. From this perspective, we aimed to identify the evolution of the US financial market in terms of USGAAP regulations relative to other financial markets, thus determining the vulnerabilities of economic capital recognition according to the gravity model of economic development.
A complex approach that was based on the study of 600 government entities in Germany, Italy and the UK was carried out by [
13], who aimed to predict external shocks in the management of economic strategies during times of crisis. The authors showed that the organisational response to times of crisis is to restrain the economic activity of entities and that their ability to reposition and refocus based on forecasts is more successful when the ability to anticipate pre-crisis shocks is greater.
The recognition of economic capital on an objective and relevant basis (degree of consensus and free of collective bias) was carried out by [
14] in a novel approach to a concept that was launched in the field of informational accounting at the end of the 20th century. The authors demonstrated that maintaining the principle of information accuracy (permanence of method) exceeds the principle of objectivity and creates an advantage under conditions of uncertainty. Thus, according to the authors, the objectification of financial reports increases security against malpractice within accounting.
Additionally, other authors [
15] analysed investor behaviour in 41 global markets and showed that country-level demands are significantly influenced by the prevalence of country herding. Upon detailed research, this element was shown to be influenced by local and international market elements, vulnerabilities and asymmetric information. By focusing on the Brexit phenomenon, the author showed that financial markets are influenced by stressors and transmit this volatility to investors.
A multidimensional approach to financial management systems was carried out by [
16], which was based on a meta-analysis and a questionnaire that was administered to 284 finance department leaders in Portuguese SMEs. The study showed that the competitiveness of management is, on the one hand, based on the capacity for innovation and the role that is being played within the global market. On the other hand, it is also based on the strengthening of managerial tools according to the collected information that can suggest adjustments for managerial decisions in relation to the system synergy that results from the development of the managerial and IT components. This can contribute to a strengthening of the organisational culture during times of uncertainty and generate a better market stability through the contribution of technology.
The theory of global shocks was analysed through the prism of recent events (global crisis, energy crisis, pandemic crisis, etc.) by [
17], who showed that the elements of crisis must be understood in terms of their impact on the global economy and that those impacts that have repercussions on more than one element of the crisis must be resolved quickly through the development of public policies in order to limit their effect (lockdowns, for example).
An approach that was based on the classical principles of global economy growth was carried out by [
18], which presented a model of differentiated welfare classification that was based on the socio-institutional responses of public entities to globalisation and global fiscal challenges (financialisation). As a general pattern for post-crisis, the mercantilist tendency to export weakness that are associated with partial welfare growth has been noted in some global systems (Scandinavian and continental European). In contrast, there is a partial decline in post-crisis welfare in other systems (Anglo-Saxon liberal), which leads to rapid reactions that change the balance of demand between the public and private sectors and requires the assessment of the distribution trends of fiscal policies.
The quality of reporting was an element of interest for ensuring successful managerial decision making and the materialisation of financial transactions in the meaning of [
19]. To achieve meaningful results, the authors recommended training for all security elements (public enforcement, auditors and disclosure issues).
Within the context of big data technology, [
20] considered that combating emerging financial risk in financial markets can be approached from the perspective of improved algorithms and forecasting systems. In this sense, risk identification using data technology is linked, in terms of volatility, to the chain fluctuations of portfolio prices within the context of known risk factors. It is also our opinion that the difference between our approach and that of the other authors is that we considered global interpretability and causality compared to the point nodes and events approach that was adopted by the other authors, which could provide tools for prevention within the strategies for combatting volatility risks.
In an investigative approach, a financial risk oversight and underwriting was conducted by [
21] using an attitudinal risk model in association with a risk underwriting bias. The authors determined a positive connection between financial risk monitoring and insurance practices, which reinforces certain behaviour in insurance claiming and isolates risk aversion. Although this is a special case, we believe that in terms of recognition of economic capital, the practices of insurers represent a formal element of the protection of shareholder interests, which does not always lead to a correlation between economic disclosure and share price volatility, as is evident in some markets, such as Europe, and has the effect of more optimistic share price curves compared to the cautious approach of Asian markets.
The global vulnerabilities of financial markets during the pandemic period were assessed by [
22] in an attempt to evaluate the propagation of informational risk during the crisis period (COVID-19 outbreak). Using a conditional global risk estimation model, the authors concluded that informational risk propagates in globally interconnected economies at a faster rate in times of crisis than in times of calm, which provides a strong case for the appropriateness of applying the gravity model of economic development as we proposed in this scientific approach.
An interesting and topical approach to the response of financial markets to the pandemic crisis was taken by [
23] and was aimed at capturing investor interests in markets that were affected by the crisis. The author pointed out that investor attention was negatively influenced by the global financial shock during the crisis. This correlated with increased volatility and financial information flows within the affected markets. In the author’s view, the bond market was less affected by the financial shock and information flows are converging towards resolving some of the uncertainty in the financial markets. According to the data that were presented by the author, there are differentiated reactions to crisis events at G7 level. However, with the exception of Canada, a polarisation of the trend towards increased vulnerability in price volatility could be observed.
A spatial analysis of the polarisation of newly established economic capitals before and during economic crises was carried out by [
24], who showed that successive crises tend to change the relative importance of location factors within newly formed entities, based on innovation and industrial creativity. An impactful observation was that organisational culture has the capacity to significantly influence the new economic capital that has been created through start-ups during the crisis in a positive way, which changes in meaning as the crisis generates economic austerity. Under these conditions, the authors noted that sustainable development can be achieved on the basis of the public stimulation of diversification and integration into the neural networks of start-ups and that it is of interest to use their own synergy to connect with the rest of the regional economy.
An approach to the reduction in economic growth during times of global economic crises was developed by [
25], who showed that development leads to an increase in the capacity of the system in terms of both material resources and labour factors. The author focused in particular on the economic crisis of 2008–2009. The results that were presented demonstrate that the convergence of accounting standards at the G7 level flattened the economic deceleration curve by about 40%. A similar approach was taken by [
26,
27].
Some authors [
28] presented an approach to financial risk management through Corporate Social Responsibility (CSR) behaviours and an openness to sustainable development. The authors applied a mathematical model to a sample of 185 countries for the pre-crisis period of 2015–2019 and demonstrated the vulnerabilities that were induced by the onset of the pandemic throughout the period of 2020–2021. Thus, there were increased financial risks and impacts on private investments that eroded sustainable development during 2020–2021. The authors’ proposal, in terms of financial risk management, was to make financing volumes more flexible by increasing private investment and monitoring the need for financing within a crisis context. In practice, the prudential theory of dealing with crises shows that private investments take on a pessimistic character and tend to reduce in volume in relation to the size of the crisis phenomenon, which is triggered by opportunity gaps in the areas of vulnerability within economic capital recognition.
In the view of [
29], the measurement of systemic risk was possible through the use of a model in which the undercapitalisation of the financial sector was presumed to constitute risk externalities that affect the short-term distribution and equilibrium of the system. The authors showed throughout the study that financial regulations seek to limit institutional risk and marginalise the costs of risk externalities, which affects the performance of entities in the system, especially during times of uncertainty.
There are other interesting approaches, such as that used in [
30], which logically demonstrate that there is a disconnect between the real and financial economies and that the measure of this disconnect is the misallocation of capital into assets and intangible assets. We agree with this vulnerability factor, which leads to price instability, especially during times of crisis.
Typically, market failures are triggered by situations of asymmetric information in which some companies have information that is inaccessible and unknown to others. From an accounting perspective, asymmetric information is felt when the quality of information that is provided by financial reporting serves a particular stakeholder group while ignoring the requirements of others. Obviously, the interests of a reporting company are influenced by management policies and organisational strategies. In these situations, alternative accounting treatments are used, which are permitted by IFRS and usually affect the financial position and results for the year, i.e., performance.
According to ISO 9000:2005 (point 3.3.7), the notion of stakeholders has been established for the first time, i.e., those persons or groups that have an interest in the performance or success of an organisation, such as, for example, customers, shareholders, employees, banks, trade unions, business partners, etc. An interesting approach to asymmetric information that is treated only from the perspective of the manager and the investor was taken by [
31], who found that when incentive misalignment and asymmetric information are both sufficiently small (large), both the manager and the investor prefer the correct disclosure regime (selective development). Even though the IFRS accounting framework is geared towards the interests of all stakeholders, the implementation of these standards has not succeeded in reducing asymmetric information in such a way as to completely eliminate the manipulation of stakeholders.
The obsolescence of accounting policies, especially that of the old IAS that weakened the financial accounting system, was due to the fact that some standards failed to keep pace with the rapid and radical development of the global economy [
32]. This was also the reason that the old IAS were replaced by IFRS, precisely in order to pre-empt stakeholder complaints and to correct the vulnerabilities of the IAS/IFRS accounting framework [
33].
The most common cosmetic accounting occurs when determining the accounting treatment of depreciation (IAS 16) [
34], revenue recognition (IFRS 15), the disposal of intangible assets (IAS 38) or fair value measurement (IFRS 13). The influence of applying IAS 16 on an entity’s financial reporting was proven both theoretically and practically by [
35], as the results of the revaluation of non-current assets to fair value may lead to a certain level of subjectivity in the determination of this value, but the impacts on the company’s financial position, as well as its performance, are direct [
36]. Additionally within the context of IAS 16, there is the alternative of changing depreciation regimes for fixed assets, a method that is decided by company management but that can significantly influence stakeholder decisions [
37]. While the accounting policies that were described above have created and continue to create vulnerabilities within the IFRS reporting system, the most problematic situation is the determination of fair value for certain types of assets or liabilities, such as intangible assets [
38,
39] and financial instruments [
40]. However, when the effects of the fourth industrial revolution on the global economy are taken into account, the lack of an assessment of current accounting standards within the current context of the globalisation of the world economy is dangerous [
35]. This was also the reason that two old IAS, three IFRICs and one SIC [
41] were recently replaced by the new IFRS 15 (Revenue from Contracts with Customers), precisely in order to create a complete and uniform framework for the revenue recognition that is applicable to all commercial contracts, except leases, insurance contracts and financial instruments [
41]. Revenue recognition that occurs directly in profit and loss accounts obviously has a direct impact on performance and the manner in which the accounting policies in this standard are applied and interpreted play a decisive role in influencing stakeholder decisions. Insufficient disclosure, in particular regarding the uncertainty of revenue recognition, could compromise the decisional usefulness of the revenue information [
42]. On the other hand, the implementation of IFRS 15 has created tax issues, which may arise due to changes in revenue recognition. In other words, any inconsistencies that arise between accounting and taxation should lead companies to explain these differences by documenting them in advance [
43].
3. Materials and Methods
In order to achieve the main objective of the research and define the volatility matrix model, we studied the main developments of globally representative stock exchanges throughout the period of May 2015–March 2022. This period was characterised by significant differences in the formation and accumulation of the recognition of economic capital through the adoption of different USGAAP and IFRS standards, which allow for the measurement of the level of investor confidence in the implementation of investment decisions within the market.
The present analysis was performed using dedicated software: IBM-SPSS 25 and Gretl version 2021. With the support of the dedicated software, a formal data analysis was carried out and the working hypotheses were validated using the one-sided critical probability method and the prospective approach.
The present research paper selected three stock exchange systems: Paris Financial Exchange, Composite Stock Index (Cotation Asisttée en Continu (CAC 40)); New York Stock Exchange, NYA Composite Indicator; and Shanghai Stock Exchange, SSE Composite Index.
The analysis was based on a database that was constructed according to the monthly quotes of the three stock exchanges, which were chosen using [
44,
45,
46]. The absolute data were processed to ensure comparability and monthly trends were determined according to the following formulae:
where
Open CAC, Adjusted CAC and Close CAC are the trend series of the opening values, adjusted values and closing values of the CAC stock index for the Paris Stock Exchange;
Open NYA, Adjusted NYA and Close NYA are the trend series of the opening values, adjusted values and closing values of the NYA stock index for the New York Stock Exchange;
Open SSE, Adjusted SSE and Close SSE are the trend series of the opening values, adjusted values and closing values of the SSE stock index for the Shanghai Stock Exchange;
i is the moment in time for which the comparability index I was calculated.
The values that were collected from the reports of the profile markets for the beginning and the end of the calendar years for the abovementioned composite indices were analysed in dynamics, based on the moving averages and were taken into account when building the model. These values are shown in
Table 1.
The graphical transposition of the volatility matrix of the gravity development model onto the identified vulnerability limits is presented below [
50], as follows:
where
Open CAC, Adjusted CAC and Close CAC are the trend series of the opening values, adjusted values and closing values of the CAC stock index for the Paris Stock Exchange;
Open NYA, Adjusted NYA and Close NYA are the trend series of the opening values, adjusted values and closing values of the NYA stock index for the New York Stock Exchange;
Open SSE, Adjusted SSE and Close SSE are the trend series of the opening values, adjusted values and closing values of the SSE stock index for the Shanghai Stock Exchange;
Vi is the volatility factor;
α is the gravity constant of applicability of the financial norms that were related to the three international systems (Chinese GAAP, US GAAP and IFRS).
In order to test the proposed model, the hypotheses were defined as follows:
Hypothesis 1 (H1): The correlation between the opening test values of the stock series and the final closing values of the same series, as defined by the stock indices, reflects the vulnerabilities of the analysed accounting systems for the minimum statistical levels of the models. This hypothesis was defined based on the approaches of [
5,
19,
23,
44].
Hypothesis 2 (H2): The vulnerability levels are closely linked to the exogenous characteristics of the International Accounting Standards that are applied to the entities that are listed on the analysed stock market. This hypothesis was supported by the work of [
9,
12,
13,
15,
19,
25,
44].
Hypothesis 3 (H3): There is a direct dependency relationship between the level of vulnerability and exposure to the economic recession. This hypothesis was defined in accordance with the approaches of [
8,
17,
20,
21,
23,
24,
25,
50].
Hypothesis 4 (H4): There is a direct relationship between the level of quotations and the global macroeconomic context under conditions of uncertainty, which manifests itself in the same way in all financial markets, regardless of regional specificities. This hypothesis was defined by taking into account the research of [
11,
14,
16,
18,
22,
29,
44].
For the demonstration of the working hypotheses, a full monthly series modelling methodology (briefly presented in
Table 1) was used and the trend fluctuations that confirmed the assumptions that were established by the working hypotheses were observed, thereby making econometric modelling possible with the help of multiple linear regression and the least squares method.
The regression equation of the matrix model of volatility, in terms of the gravity model of economic development, could be statistically represented as follows:
where Open
SE is the trend series of the opening values for the Stock Exchange market in regional terms (Paris, New York, Shanghai);
α, β, γ are the regression coefficients of the independent variables;
AdjCloseSE is the trend series of the adjusted closed values for the Stock Exchange market in regional terms (Paris, New York and Shanghai).
The results of the model allowed for regional dissemination to improve and validate the results of the overall model, which is discussed in
Section 4.
4. Results
For the Paris financial market, which is regulated under IFRS, the regression equation became:
For the Paris financial market, 83 monthly records were analysed and a coefficient of determination of 0.996 was obtained, which showed that the proposed model was more than 99% representative of the studied phenomenon.
The statistical tests showed that the ordinary least square (OLS) model that was determined by Equation (2) was homogeneous for the studied phenomenon and that the values of the data series for the three major financial markets were correlated in terms of price evolution, with standard errors of 15% to 30%, which confirmed the trend correlations in relation to the incidence of global events (H4).
The data are summarised in
Table 2 and show that the European financial market directly influenced the decision to invest in the Asian market by more than 50% and modified the decision to invest in the European market by 40%.
Against the backdrop of the disparities in economic capital recognition (IFRS vs. USGAAP), there was a significant distance between the investment decisions in the US market and the influence of the European market. In this case, only 7% of the investment decision was modified.
We also appreciate that there was a significant paradigm shift after the start of the war in Ukraine [
50].
The validation of the model was tested by the one-sided critical likelihood test and the rejection of the null hypothesis was evaluated by a reference to the optimal value of the representation level of the correlation coefficient Sig < 0.05. It was observed that the model allowed for the rejection of the null hypothesis (HO) and kept the alternative hypothesis, thus validating the model and demonstrating the correlation between investment decisions in relation to economic capital recognition through a reference to international standards in a differentiated way, which was based on regional gravity models of economic development. This aspect (model validation) was confirmed by the test for normality of residuals and the test for heteroskedasticity, which confirmed that the model could be applied for sizing the average market volatility based on global market connectivity (see
Table 3).
According to the normal distribution of the dependent variable, in relation to the Gauss curve, there was a slight flattening to the left of the graph, which indicated the clustering of errors in the negative area relative to the median. This reflected the fact that volatility increases as stock prices decrease and vice versa. At high prices, there is inertia in the system towards volatility, which is induced by the internal or external risk of economic capital recognition (through IFRS support) (see
Figure 2).
The Chinese volatility matrix model reflected a higher volatility impact in comparison to the French model, which was due to American influences and an increased independence from the European stock market. The model equation was defined as follows:
Risk resistance is specific to consolidated markets (socialist–mixed regimes). Thus, the state is willing to take over the economic capital of entities that affected by volatility and minimise the stock market during times of crisis. Under these conditions, the matrix model of volatility that is determined by the OLS method is valid, with a representativeness of 0.995, according to the coefficient of determination, which means that the model covered 99.5% of the cases regarding the behaviour of centralised markets with respect to the volatility of economic capital recognition.
The statistical data on the same analysis horizon of 2015–2022 are shown in
Table 4.
The data that are summarised in
Table 4 show that in the Asian market, the investment decisions were influenced by price developments in other markets (the coefficients of variation of the regression variables) to a complementary extent in regard to the decisions of public authorities to ensure the sustainability of transactions. We noted that, unlike the European stock exchange in Paris, the Shanghai stock exchange was more sensitive to changes in the US market, thus concluding that the volatility that was induced by the recognition of economic capital influenced the market in the upstream segment (cash inflows) and represented an element of vulnerability in the downstream segment (cash outflows). In the case of this market, the global imbalance that was seen as an external factor was also an element of vulnerability (e.g., the war in Ukraine).
The validation of the model using the one-sided critical likelihood test was possible with the null hypothesis being rejected and the alternative hypothesis being maintained, according to the statistical tests of normality of residuals and heteroskedasticity that are presented in
Table 5.
The distribution diagram for the case of the Asian market was better represented with reduced volatility residuals on both the lower and upper limits of the quotes, which showed a homogeneous distribution under the Gaussian curve (see
Figure 3).
The American model was the most volatile in terms of global market influence and showed the maximum volatility against both the European and Asian markets. This meant that the recognition of economic capital on the basis of USGAAP included elements of goodwill that were assessed at the global level, which induced a global systemic risk that went right down to the level of the individual economic entity. The results of the volatility matrix model for the case of the US stock market are shown in the equation below:
From the point of view of the statistical tests,
Table 6 shows that the American model was the most homogeneous of the three that were tested, with a maximum coefficient of determination of 0.996. This meant that 99.6% of the time, the volatility matrix model allowed for the prediction of the trend curve of the US stock prices with respect to the proposed regression variables.
As proof of the general validity of the proposed model, it was observed that in all three cases without exception, the one-sided critical probability test rejected the null hypothesis and maintained the alternative hypothesis, with the
p values being lower than the representativeness level of 0.05 (see
Table 7).
According to the normal distribution of the dependent variable in relation to the Gauss curve, there was a slight flattening to the left of the graph, which indicated the clustering of errors in the negative area relative to the median. This reflected the fact that volatility increases as stock prices decrease and vice versa. At high prices, there is inertia in the system towards volatility, which is induced by the internal or external risk of economic capital recognition (through USGAAP support) (see
Figure 4).
The three analyses of the vulnerabilities that were induced by the recognition of economic capital in the free markets under the influence of regulatory measures or government decisions led to the validation of H4, i.e., there is a direct relationship between the level of quotations and the global macroeconomic context under conditions of uncertainty, which manifests itself in the same way in all financial markets, regardless of regional specificities.
For H1, i.e., the correlation between the stock market opening test values and the final closing values of the same series being defined by the stock market indices reflects the vulnerabilities of the analysed accounting systems for the minimum statistical levels of the models, it was shown that there was a percentage of representativeness of the mean of the volatility matrix in terms of the gravity model of economic development of over 99%, which allowed for the quantification of dependencies in the form of a quantifiable regression ratio and the development of stability indices that were based on improved economic capital recognition practices.
For H2, i.e., the vulnerability levels are closely related to the exogenous characteristics of the International Accounting Standards that are applied to the listed entities on the analysed stock market, the matrix size of the model was tested for exogenous characteristics that were connected to the regional economic reality of the stock market, for which the following main characteristics were identified: China’s economy needed the increased rigor due to the global size of Chinese trade; the US economy operated on the principle of a connection between taxation and accounting; and the European economy was, by definition, a competitive economy in a common market.
For H3, i.e., there is a directly dependent relationship between the vulnerability level and exposure to the economic recession, this hypothesis was demonstrated by the influence of the stock indices on volatility in the presence of economic crisis phenomena.
5. Discussion
The European post-Brexit market was represented by the Paris Stock Exchange, as the composite stock market index for the blue chips of the 40 largest companies that are trading is the Cotation Asisttée en Continu (CAC 40). The price of the index is expressed daily in EUR and it has suffered a significant decrease as a result of the pandemic and the outbreak of war in Ukraine (see
Figure 5). It was noted that the post-crisis stock prices have an average rebalancing capacity, which is sensitive to the global macroeconomic context and generates the reflexivity of the position of investors in relation to the economic capital recognition actions of listed entities. On the graph, the major inflection points (destabilisation of prices) are observed at the time of the outbreak of the political pandemic crisis (i.e., 4 March 2020), after which the price trend turned upwards, with the Paris stock exchange showing medium-term asset accumulation until the second inflection point (24 February 2022).
The US market, which was represented by the New York Stock Exchange, was analysed using the NYA composite indicator, which covers the main listed companies, including real estate investment trusts, non-bank financial companies and industrial companies. In
Figure 5, it can be seen that the recognition of economic capital in USGAAP terms led to the most optimistic growth scenario in the absence of uncertainty phenomena. At the onset of crises, it is easy to see that the market aligns with the general trend, which minimises the dispersion of quotes relative to the terms of influence in other global markets and achieves position alignment, according to the general volatility model that was proposed in this study. Thus, it was confirmed that under the conditions of uncertainty, the gravity model of economic development tends to globally equalise the overall volatility risk under the terms and conditions of the proposed volatility matrix model.
The above index (NYA) was also affected by the massive acquisition of shares that was initiated by the Chinese state and registered a significant decrease at the beginning of March 2020. The index was calculated in USD and had a monthly fluctuation of 0.29%, which represented one third of the negative variation that was recorded at the beginning of March 2020, at least.
For the Shanghai Stock Exchange, the authors of this paper selected the SSE composite index, which contains quotations of A and B level shares and is calculated in CNY. In
Figure 5, it can be seen that government monitoring transformed the Asian model into a volatility matrix limiter and entropy conserver, which minimises (through a prudent approach in recognising economic capital) the shock that is generated by the impacts of global crises on the market.
The volatility indicator was quantified by the accounting convergence between USGAAP and IFRS. The transfer coefficient between the modal points was defined based on the moving series of the composite indices.
The three analysed stock exchanges are currently at a time of relative convergence between the three Chinese GAAP, US GAAP and IFRS standards. The timing of the final convergence seems close, with the exception of some aspects of fixed asset valuation methods, consolidated rules, shareholder interests in affiliated entities and, last but not least, employee benefit plans, which are often used by multinationals.
These convergence principles did not prevent the situation of volatile price imbalance and contributed to the creation of convergence limitations, which were logically deduced from the chronology of volatility transfers from the emerging markets, as shown in
Figure 6.
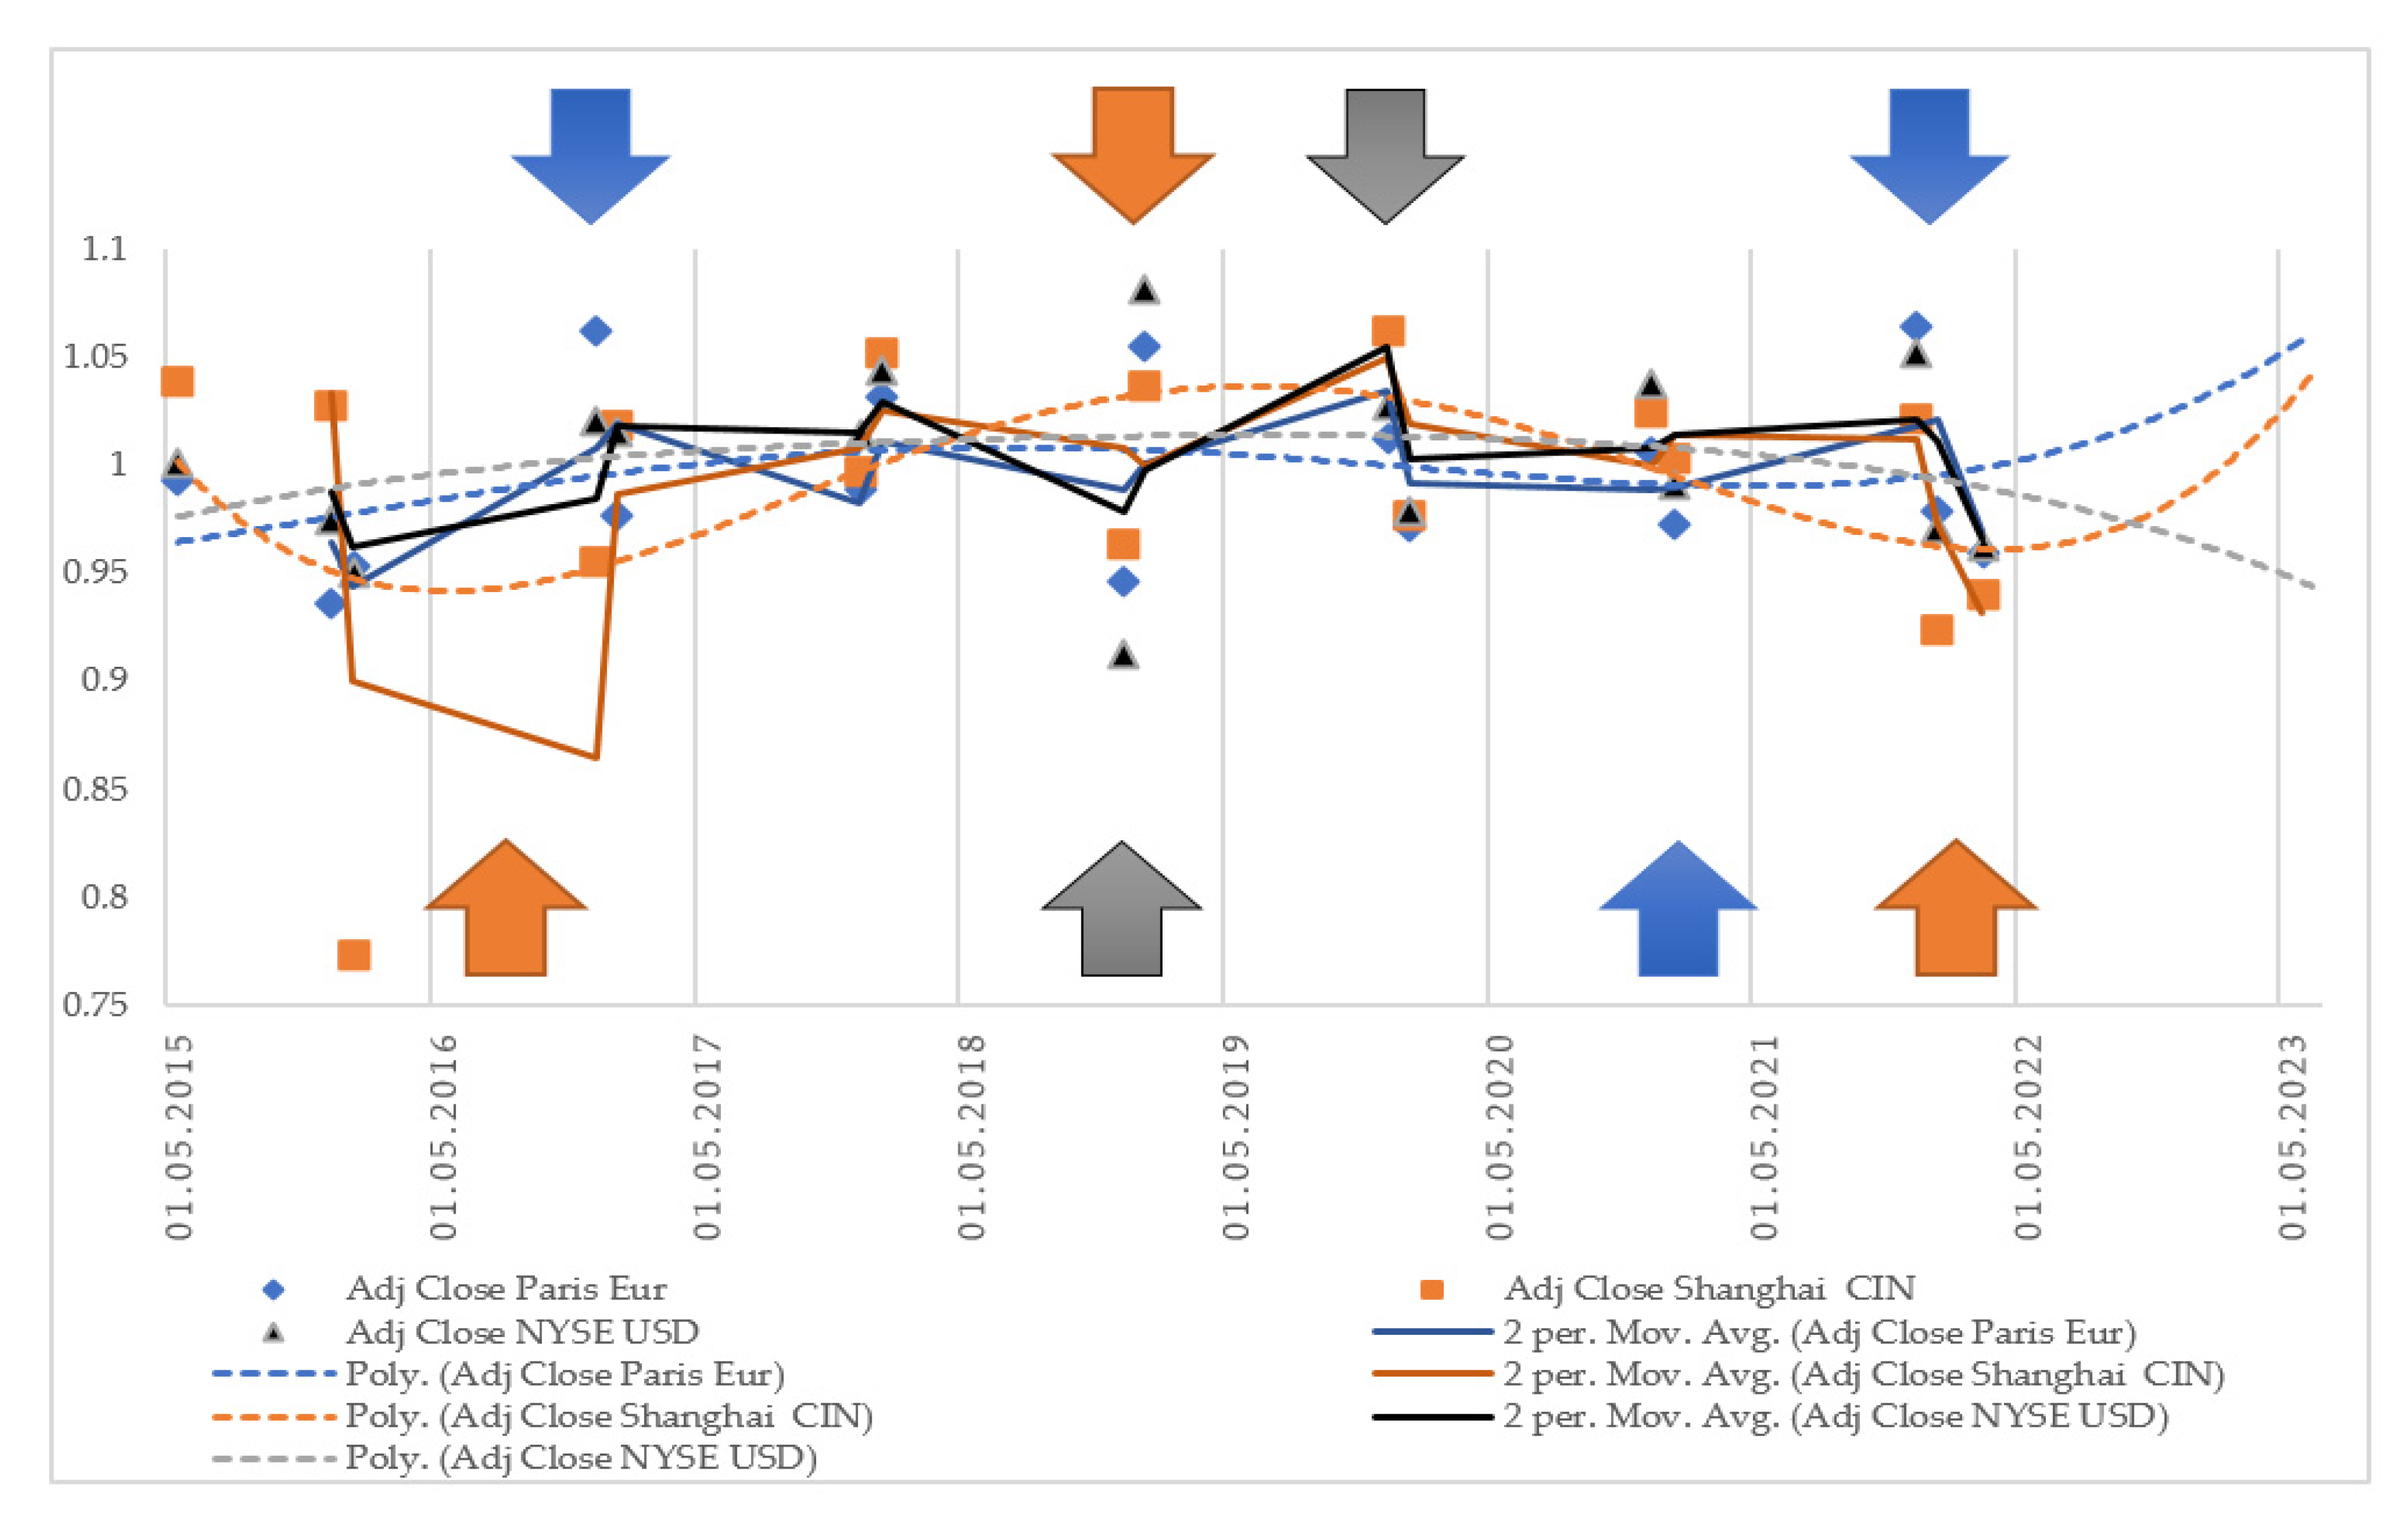
Based on
Figure 6, the analysis could be extended by quantifying the fluctuations of the stock market indices in relation to the stock market moving averages. Through a forecasting process over 15 time units (months), we obtained the trend extension for each market, which can be seen together with the trend deviation diagram in
Figure 7.
As a result of the onset of an economic crisis and the changes in the trend curves of stock indices due to the impacts of the economic recession, the following identified volatilities are critical (see
Figure 8).
The presented table, which correlated with the model results, reveals that the vulnerabilities of accounting systems and their particularisation in the economic regions that are anchored to global trade can be a lever to block the spread of economic crises through interconnected financial markets.
6. Conclusions
In this study, the authors addressed the complex phenomenon of the convergence of accounting systems within the current conditions of the global economic and financial crisis. The authors developed a gravity model of development for identified vulnerability limits. The model assessed the vulnerability of the convergence of accounting systems and quantified the extent of the spread of regional vulnerabilities through financial transactions in the global markets and multinational economic activity.
The study allowed us to achieve the research objectives (O1–O4), i.e., sizing global market volatility within the context of economic capital recognition processes with a focus on global inflections under uncertainty.
The proposed model is novel and brings a means of forecasting the effects of implementing capital recognition standards to the attention of decision makers, thereby allowing them to identify concrete solutions for the quantification of imbalances and a re-recognition that is based on more efficient recognition tools.
In this paper, the authors achieved an ambitious but tangible goal by applying extrapolation methods to the current conditions of data, which were collected through the dynamics of the evolution of stock market indices within global financial poles.
This paper presented the particular vulnerabilities of accounting systems and their convergence ruptures that can contribute towards stopping the increase in the volatilities of the quotations of the entities that are listed on the financial exchanges in the long term.
The implications of this study consist of creating a pragmatic tool for the measurement of accounting convergence and limiting the propagation of vulnerabilities that are induced by uncertain conditions, which are specific to the current situation.
The limitations of the study were the relatively small number of financial markets that were selected for analysis and the limited period (83 months) for which the effects of the proposed model were quantified. Of particular importance were the analyses of IPOs, new issues and debt, but the information on these was not complete or easily accessible, so the authors intend to return to these issues in a future extended study as soon as complete official statistics have been identified.
The authors propose to continue this scientific approach and detail the causal relationships of vulnerability at a higher level by introducing more variables (trading volume, exchange rate dependent, etc.) into the model, as well as extending the research over a longer period of time to capture more critical volatility points in trading history.


