Abstract
Achieving sustainable economic development is always considered one of the main economic goals of countries. Therefore, researchers are interested in presenting new econometric models for more accurate identification of factors affecting economic growth. The current study evaluates the impact of various aspects of freedom (economic freedom, press freedom, civil freedom, and political rights) and an aggregated freedom index on economic growth in European countries from 2000 to 2019 using spatial panel econometric techniques. In addition, the effects of variables such as FDI, financial development (FD), human capital (HC), and capital stock on economic growth are examined. The findings of this research confirm the existence of spatial autocorrelation in economic growth. The results reveal that civil liberties, economic and press freedom, and aggregated freedom boost economic growth, whereas political rights have no significant effect on economic growth. Furthermore, the econometric model results indicate that FDI, FD, HC, and capital stock are positively and significantly associated with economic growth. This research is expected to provide policymakers with a thorough understanding of how to implement the best policies in European countries to achieve sustainable economic development.
MSC:
91B62; 91B72; 91B84; 62P25; 62M10
1. Introduction
Understanding the nature and causes of economic growth and development has been one of the fundamental challenges for economists. The classic Ricardian theory measures economic growth using the quantity of output produced. It considers the economy as a machine of production that transfers natural resources, capital, and labor into output [1]. If output rises more quickly, it is either as a result of greater inputs or improved technology. Despite the wealth of literature on this subject, empirical research has only occasionally succeeded in explaining the mechanisms underlying growth processes and observed inequalities [2]. This led to numerous attempts to better understand the drivers of economic growth by incorporating newer independent variables into growth models, until institutional factors were included in neoclassical and endogenous growth models at the end of the twentieth century, alongside traditional variables like labor, capital, and technology [3]. Kuznets empirically demonstrated that the political environment and type of governance play a significant role in the development and growth of countries. Kuznets revealed that, while technological progress is considered a necessary condition for countries’ economic growth, it is not sufficient. Sufficiency is ascertained only when technological progress is combined with stable and flexible socio-political institutions that provide its citizens with freedom [4]. In recent years, many researchers have become interested in incorporating different aspects of freedom into growth models [5,6,7,8,9,10,11,12,13]. A review of the research literature shows that in the majority of studies economic freedom boosts economic growth. However, the relationship between political freedom (political rights and civil liberties) and economic growth has become a controversial issue among scholars. Two competing hypotheses have been developed regarding the relationship between these two variables. The first group of economists believes that political freedom is a key factor in enhancing economic performance and consequently economic growth. On the other hand, another group argues that economic growth necessitates control and restriction of freedom. The lack of agreement on various aspects of the relationship between freedom indicators and economic growth, particularly with regard to economic, political, and press freedom, has led us—and this is the first contribution of this research—to calculate and incorporate an aggregated freedom index into the economic growth model. Thus, this provides planners and policymakers with accurate insight into designing efficient policies to achieve sustainable economic growth.
Tobler’s first law of geography states that “everything is related to everything else, but near things are more related than distant things”. Spatial spillover is related to the existence of spatial autocorrelation, which is related to this law. In regarding economic growth, continuous exchanges of science, technology, goods, and services, etc. among nations may have an impact on both the economic development of the host country and that of its neighbors. Therefore, disregarding spatial connections in econometric modeling leads to bias in research findings [14,15]. Hence, some studies have employed spatial econometric models to assess the determinants of economic growth in surrounding nations [15,16,17,18]. For example, Amidi and Fagheh Majidi [16] evaluated the factors influencing economic growth in 25 EU nations over the period 1992–2016 using a panel spatial econometric model. The findings of this study demonstrated that spatial models are more appropriate for data analysis than traditional models. Therefore, the second contribution of this research is to examine the relationship between freedom and economic growth in European countries using spatial models.
The main objective of this study is to empirically investigate the impact of freedom on economic growth in European countries for the period 2000–2019 using spatial panel econometric techniques.
2. Literature Review
Recent studies show that economic growth is closely related to economic, political, and press freedom. Hence, in recent years, one of the most intriguing research topics has been the study of the relationship between freedom and economic growth. The available literature on this issue contains three study branches.
In the first research branch, many studies have focused on investigating the effects of economic freedom on economic growth. For example, Brkić et al. [19] analyzed the impact of economic freedom on economic growth in European countries using a least-squares dummy variable (LSDV). The results of this study confirmed that there is a positive relationship between these two variables. Ciftci and Durusu-Ciftci [20] examined the effect of economic freedom on economic development for top FDI-attracting countries during 1995–2019 using Granger causality analysis. Their results revealed that there is unidirectional causality from economic freedom to economic growth. Azman-Saini, et al. [21] evaluated the relationship between foreign direct investment, economic freedom, and economic growth in a panel of 85 countries from 1975 to 2004. They discovered that foreign direct investment by itself has no direct (positive) impact on economic growth. Instead, the impact of foreign direct investment is determined by the level of economic freedom in the host countries. This implies that countries that support greater economic freedom greatly benefit from the presence of multinational corporations. Gurgul and Lach [22] studied the structure of the relationship between economic growth and economic freedom in 10 European Union countries over the period 2000–2009. Their findings showed that economic growth has little effect on economic freedom although economic freedom is one of the factors affecting growth. Hall, et al. [23] investigated the effect of economic freedom on income levels using spatial panel data analysis in U.S. states. They claimed that a 10% increase in economic freedom is linked to a 5% increase in real per capita gross state product. Doucouliagos and Ulubasoglu [6], employing meta-analytic techniques for 82 countries’ data during 1970–1999, found a direct and positive relationship between economic freedom and economic development. In addition, economic freedom has an indirect positive effect on economic growth by affecting the formation of physical capital. Using the data for 80 countries from the period between 1975 and 1990, De Haan and Sturm [24] created a regression model and found that greater economic freedom fosters economic growth. Vega-Gordillo and Alvarez-Arce [25] examined the causal links among economic freedom, democracy, and economic growth of new EU members in transition in the period 2000–2009. The panel Granger causality test outcomes showed that economic freedom induces economic growth. Using 104 countries’ data for the period 1970–2003, Xu and Li [26] created a panel data model and revealed that economic freedom has a positive effect on promoting income convergence.
The second strand of research evaluates the effect of political freedom on economic growth. For instance, Fabro and Aixalá [3] explored the relationship between political freedom and economic growth using simultaneous equation models in 79 countries. Their results indicated that political rights and civil liberties have a positive and significant impact on GDP. Xu and Li [3] employed a panel data model using data from 104 countries for the period 1970–2003 and indicated that political freedom has a negative effect on promoting income convergence for non-OECD countries. While political freedom is positively and significantly related to the promotion of income convergence in OECD countries. Zulkarnaen [27] assessed the effect of political openness on GDP in 11 Asian countries over the 1984–2011 period using a panel data model. The results indicated that high levels of political openness promote economic growth. Using the data for East Europe and the Soviet Union from the period between 1994 and 2007, Peev and Mueller [28] created a three-stage least squares model and discovered a positive relationship between democracy (political freedom) and the quality of economic institutions. Fatah et al. [29] investigated the main factors affecting economic growth in developing countries in Eastern Asia from 1980 to 2005, and their findings indicate that civil and political freedoms have a positive and significant effect on economic growth in these countries. Ayub, et al. [30] employed generalized method of moments (GMM) estimations to evaluate the role of FDI and political freedom on output growth in 67 developing countries over the period 1984–2016. Their findings showed that political freedom plays an important role in moderating the positive impact of foreign direct investment on economic growth. Using Granger causality tests, Piątek, et al. [31] examined the relationship between political and economic freedom and economic growth for 25 post-socialist countries between 1990 and 2008. They observed that economic freedom was positively related to economic growth, whereas political freedom had no effect on economic growth.
The last branch of research is related to the relationship between press freedom and economic growth. For example, Alam and Ali Shah [32] explored the impact of press freedom on economic development using a panel dataset of 115 countries during 2002–2010. The authors discovered that press freedom was positively and significantly related to economic growth. Nguyen et al. [33] investigated the relationship between press freedom and economic growth in 97 countries between 1972 and 2014. They argued that when press freedom is violated, economies do not fully recover. Pal et al. [34] studied press freedom, social-political stability, and economic growth in 138 countries. Their results demonstrated that press freedom, when combined with government oversight, can support social-political stability, allowing the government to act in the best interests of the people while also fostering political-social stability in the business environment, resulting in increased investment.
Overall, our review of the literature indicates that freedom indices can influence economic growth. In econometric models, the relationship between economic, political, and press freedom indicators and economic growth has been investigated but not simultaneously. As a result, aggregating these indices could provide a comprehensive understanding of the impact of freedom on economic growth. To address this scientific gap, we calculate and incorporate an aggregated freedom index (which includes political, economic, and press freedom indices) into the research model. No research has considered spatial effects in examining the relationship between freedom and economic growth in European countries, despite the fact that spatial data inherently has spatial autocorrelation. As a result, traditional econometric models will be less efficient than spatial techniques [15]. To overcome this modeling error, we use spatial panel data models to incorporate the spatial effects into the research model. The contribution of the current study is two-fold. First, to the best of our knowledge, this is the first study to calculate and evaluate the impact of the aggregated freedom index on economic growth. The second contribution of the study lies in the use of the spatial econometric technique in examining the relationship between freedom and economic growth in neighboring countries.
3. Methodology and Data
3.1. Methodology
The main purpose of this study was to assess the impact of freedom on economic growth in European countries using spatial panel data models. The estimation procedures used in the study are depicted in Figure 1. At each stage of the estimation process, the activities were carried out in chronological order. According to the literature review and research objectives, the following hypotheses were proposed for this study.
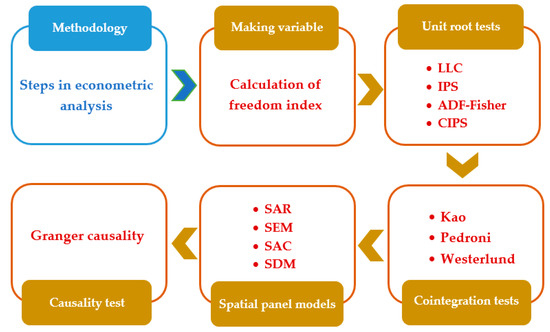
Figure 1.
Steps of the methodology.
H1.
Aggregated freedom has a positive impact on economic growth in European countries.
H2.
Economic freedom has a positive impact on economic growth in European countries.
H3.
Press freedom has a positive impact on economic growth in European countries.
H4.
Civil liberties has a positive impact on economic growth in European countries.
H5.
Political rights has a positive impact on economic growth in European countries.
3.1.1. Model Specifications
The structural form of the model is used as follows:
where i and t indicate country and year, respectively, GDP is per capita gross domestic product, FDI is foreign direct investment, HC is human capital, AFI is the aggregated freedom index, FD is financial development, and GFCF is the capital stock.
3.1.2. Calculation of the Aggregated Freedom Index
This study calculated an aggregated freedom index including four factors: economic freedom, civil freedom, political rights, and press freedom. Data on economic freedom were obtained from the Fraser Institute. The institute determined countries’ economic freedom index based on five sub-indices: (1) government size; (2) legal structure and security of property rights; (3) access to sound money; (4) freedom to trade internationally; (5) regulation of credit, labor, and business [35]. The range of this index is between 0 and 10. Zero shows the lowest economic freedom and ten indicates the highest. Data on political rights and civil liberties were collected from Freedom House. In the current study, these ratings were used to measure political freedom in each of the studied countries [36]. Both political rights and civil liberties are in the range of one to seven in which lower scores indicate more freedom. However, in this analysis, those two ratings were reverse-coded by assigning a rating of seven to countries with the most freedom and one to countries with the least freedom in order to make their relationship and impact on other variables more intuitive for the readers. Press freedom is arranged by Freedom House and is rated between 0 and 100 in which 0 shows the highest degree of freedom and 100 indicates the lowest. The reverse coding method was used for this rating as well as the previous two.
The aggregated freedom index (AFI) is a single index that captures three key components of freedom: economic freedom, political freedom (political rights and civil liberties), and press freedom. The AFI is calculated in two steps:
First, each value is normalized to 0 to 1 as follows:
where indicates economic freedom in the target country, is the least economic freedom among countries, is the most economic freedom among countries, is normalized economic freedom, is press freedom in the target country, is the least press freedom among countries, is the most press freedom among countries, is normalized press freedom, is civil liberties in the target country, is the least civil liberties among countries, is the most civil liberties among countries, is normalized civil liberties, is political rights in the target country, is the least political rights among countries, is the most political rights among countries, is normalized political rights, and is normalized political freedom.
The aggregated freedom index is then calculated as the geometric mean of economic, political, and press freedom as follows:
3.1.3. Test of the Unit Root and Panel Cointegration
In this study before estimating the models, the stationarity of all the variables used was investigated using LLC [37], IPS [38], and ADF-Fisher unit root tests of the first generation. For more accurate conclusions, it is more reliable to use the second-generation panel stationarity tests such as the CIPS [39] test. The CIPS test equation is as follows:
The value of CIPS is derived by averaging the CADF test statistics in the following manner.
The first-generation Koa [40] and Pedroni [41] cointegration techniques were used in conjunction with the second-generation Westerlund [42] cointegration technique to capture the long-run relationship between economic growth and the other coefficients. This method, unlike first-generation cointegration tests, takes slope heterogeneity and cross-sectional dependence into account.
3.1.4. Determining Spatial Weights Matrix
The first stage in implementing the spatial models is to create a spatial weights matrix. There are two approaches to make this matrix: (1) a contiguity-based weight matrix and (2) a distance-based weight matrix. There are various methods for determining a spatial weights matrix based on contiguity including linear contiguity, rook contiguity, bishop contiguity, and queen contiguity. In this study, we created the spatial weights matrix using queen contiguity. Matrix W is shown as follows:
As can be seen, Matrix W is a symmetric matrix in which elements of the main diagonal are zero and the others are one if two countries are neighbors; otherwise, they are zero. Then, the contiguity matrix should be standardized [43].
3.1.5. Spatial Autocorrelation Test
Moran’s I is employed to evaluate the spatial autocorrelation coefficient and its significance [44]. The global Moran’s I (GMI) is calculated as follows [45]:
In the above equations, xi and xj are GDP per capita of countries i and j; s2 is the sample variance; wij is an element that is obtained by the weight matrix [46].
3.1.6. Model Estimation
Because the data in this study have a spatial component, traditional econometric methods are ineffective because Gauss–Markov assumptions are violated in spatial data due to the presence of spatial autocorrelation and heteroscedasticity among observations; thus, spatial econometrics is required. The Gauss–Markov assumption holds that independent variables are constant in repeated samplings. This assumption is violated by spatial autocorrelation between samples. Moreover, the Gauss–Markov assumption, which states that there is a specific linear relationship between sample observations, is violated by spatial heteroscedasticity. When there is a spatial dependency assumption, the linear function’s coefficients will not be in accordance with the dependent variable because the relationship changes as the spatial sample’s data are moved [47].
The general spatial regression model (SAC), which incorporates other models, is the most complete spatial autoregressive model. Equation (13) depicts the general form of SAC.
In this model, y is a dependent variable vector, x shows independent variables, and w and w′ are spatial weights matrices. This model incorporates both spatial lag and error term correlation. In Equation (13), β displays a vector of parameters for variables, shows the spatial autocorrelation coefficient, and, finally, λ is the spatial autocorrelation coefficient of error terms. If in Equation (13) λ = 0, then there is no spatial autocorrelation in error terms, so Equation (14) is obtained:
If in Equation (13) = 0, then the spatial autoregressive error model (SEM), i.e., Equation (15), is obtained:
The spatial lag of the dependent variable and the explanatory variable is included in the spatial Durbin model (SDM). The general form of this model is presented in Equation (16). In this model, the spatial lag of explanatory variables as well as explanatory variables are incorporated in the model, and parameter β2 show this relation [48]:
3.2. Data Sources and Descriptive Statistics
In this study, we used annual time series data, over a twenty-year period between 2000 and 2019. We used the spatial panel models as the main framework for our data analysis. The data on the GDP per capita (constant 2015 USD), foreign direct investment (% of GDP), gross fixed capital formation (constant 2015 USD), and domestic credit to the private sector (% of GDP) were obtained from the World Bank database. Data on political rights, civil liberties, and press freedom were obtained from Freedom House. Economic freedom data were gathered from the Fraser Institute. Additionally, the data on the human capital index were collected from Penn World Table. The database collected included 25 European countries (Austria, Belgium, Bulgaria, Croatia, Czech Republic, Denmark, Finland, France, Germany, Greece, Hungary, Ireland, Italy, Luxembourg, the Netherlands, Norway, Poland, Portugal, Romania, Slovakia, Slovenia, Spain, Sweden, Switzerland, and the United Kingdom). Countries and times were selected based on the availability of the data.
Figure 2 depicts the GDP per capita in the European countries for the years 2000, 2010, and 2019. It shows how GDP per capita is unevenly distributed across European countries over time and space. Regionally, Northern Europe has comparatively larger GDP per capita. This consists of countries like Norway, Sweden, Denmark, Ireland, Finland, and the United Kingdom. In addition, we discovered that GDP per capita had significantly increased over the research period in most countries.
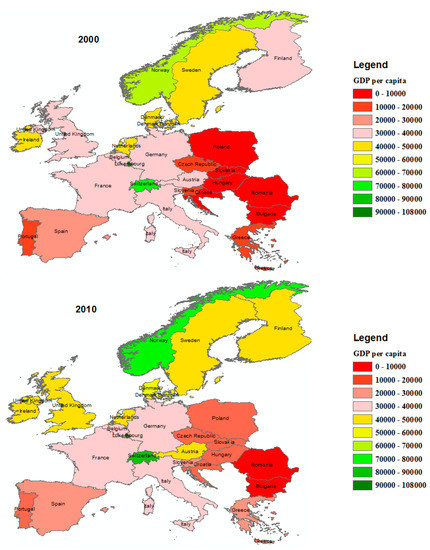
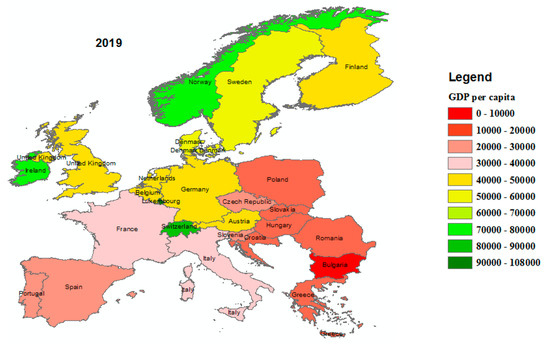
Figure 2.
The GDP per capita across European’s countries.
Before estimating the model, the data specifications were evaluated. Table 1 provides a statistical summary of all the variables used in this research between 2000 and 2019. As shown in the table. The highest value of per capita GDP in European countries is USD 112,417.878, the lowest value is USD 3717.677, and the average is USD 35,748.076. The average foreign direct investment, financial development, and human capital are 6.078, 87.788, and 3.236, respectively. The highest value of GFCF in European countries is USD 75 × 1010, the lowest value is USD 45 × 108, and the average is USD 13 × 1010. Furthermore, among these countries, the highest aggregated freedom index is 0.985, the lowest is 0.544, and the average is 0.879.

Table 1.
Statistical summary of variables (before taking the logarithm) during 2000–2019.
4. Results and Discussion
4.1. Calculation of the Aggregated Freedom Index
Based on Equations (2)–(7), this study calculated an aggregated freedom index for each country that included four factors: economic freedom, civil freedom, political rights, and press freedom. Table 2 shows the ranking of 25 European countries in the aggregate freedom index in 2019. As shown in the table, among these countries, Switzerland, Denmark, and Finland rank first, second, and third in this index with scores of 0.961, 0.954, and 0.949, respectively, while Hungary is in the last place (twenty-fifth) with a score of 0.733.
Table 2.
Ranking of countries according to aggregated freedom index in 2019.
4.2. Unit Roots Results
Stationarity of variables was examined using first generation (LLC, IPS, ADF-Fisher) and second generation (CIPS) unit root tests. The results of two group tests are reported in Table 3. The variable of FDI is stationary at levels I(0) for the first and second generation unit root tests, while the rest of the variables are stationary at levels I(1). These findings indicate the possibility of long-term cointegration between the variables. Therefore, the cointegration test is performed in the following step to investigate the presence of a long-run connection between the variables.
Table 3.
Unit Root Tests Results.
4.3. Cointegration Test Results
To determine whether there were any long-term relationships between the variables, we conducted the cointegration test using the Kao, Pedroni, and Westerlund tests. It is worth noting that the Westerlund test is resistant to cross-sectional dependence and slope heterogeneity. The results of cointegration tests are shown in Table 4. The findings support the rejection of the null hypothesis of no cointegration using any statistics for all variables. Therefore, in the following subsection, we examine the long-term relationship.
Table 4.
Results of the panel co-integration test.
4.4. Spatial Autocorrelation Test
To determine if geographical dependency exists, we calculated the global Moran’s I to identify spatial agglomeration. Global Moran’s I is a measure of a distribution’s geographical density [49,50,51]. Moran’s I statistics were employed to investigate the spatial autocorrelation of economic growth in Europe. Table 5 displayed Moran’s I statistics for GDP from 2000 to 2019. The findings show spatial aggregation. Because the results indicate that there are positive geographical autocorrelations for GDP, it follows that regions with high GDP tend to cluster together. It is worth noting that the Moran’s index is statistically significant at the 1% level in all years.
Table 5.
Global Moran’s I for GDP.
4.5. The Results of Spatial Models
In this study, to investigate the effect of freedom, FDI, HC, FD, and capital stock on economic growth, panel data model and spatial panel models (SAR, SEM, SDM, and SAC) were used. The results of these models are presented in Table 6.
Table 6.
The results of panel data model and spatial panel models.
The results of panel data estimation are reported in the second column of Table 6. According to the findings, aggregated freedom has a positive and significant effect on economic growth. Similarly, human capital boosts economic growth in European nations. The results imply that financial development and capital stock are positively and significantly associated with GDP. In addition, the results also confirm that foreign direct investment has no effect on economic growth. According to the findings of Moran’s I described in the preceding section, there is spatial autocorrelation in the economic growth of European nations. As a result, this model is unable to accurately determine the relationship between variables. In the continuation of the study, panel spatial models were used as the main model.
Based on the approach proposed by Elhorst [52], the SDM model is estimated as a general specification. In the next step, using Wald spatial lag and Wald spatial error tests, the superiority of the SDM model was compared to the SAR and SEM models. The results of Table 6 show that the null hypothesis of the tests of Wald spatial lag and Wald spatial error were rejected, so the SDM model was chosen as a better model compared to the SAR and SEM models. Finally, the results of the SDM model were compared with the results of the SAC to determine the most appropriate model. Following Belotti, et al. [53], we compared the information criteria of these two models. Since the Akaike information criterion (AIC) and Schwarz criterion (SC) in the SAC model were smaller than the SDM model, the SAC model was selected as the best model to estimate Equation (1). In the continuation of this section, the results of the SAC model are presented.
The results for the SAC model are reported in the sixth column of Table 6. The spatial autocorrelation parameter was statistically significant at the one percent level, indicating that the data contain spatial dependence. The findings imply that an increase in neighboring countries’ economies would result in an increase in the GDP of the nation. Results show that the coefficient of FDI is positive and significant. This indicates that a higher value of FDI contributes to higher economic growth. This result is in line with the studies of Alfaro, et al. [54], Akisik, et al. [55], Radmehr, et al. [56], and El Menyari [57]. A similar result was reported for human capital. The coefficient of human capital is significantly positive at the 1% level as reported by Radmehr, et al. [58], Amna Intisar, et al. [59], Zhang, et al. [60], Affandi, et al. [61], and Luqman and Soytas [62]. The findings show that there is a positive and significant relationship between the aggregated index of freedom and economic growth, which confirms hypothesis H1. Economic growth increased by approximately 0.249% if freedom had a one percent improvement. We found a positive and statistically significant coefficient of financial development of about 0.031. These findings suggest that higher FD would result in higher economic growth. As shown in the table, capital stock was positively and significantly related to GDP per capita; this follows because an increase in capital stock can lead to a reduction in imports, an increase in foreign exchange reserves, and a rapid movement toward economic progress. The positive relation between capital formation and economic growth is also approved by Radmehr et al. [15], Wacziarg [63], and Shahbaz et al. [64].
4.6. Direct and Indirect Effects
Direct effects (the “own” effect) show the effect of changing the explanatory variable of the local country on the dependent variable of that country. In addition, the total effect shows the impact of a change in the dependent variable of the local country if the independent variables changed in all countries. The indirect effect is calculated by subtracting the direct effect from the total effect, which shows the effect of changing the explanatory variable in other countries on the dependent variable of the local country (these effects indicate average changes in all countries) [65]. The outcomes of the direct and indirect effects of the selected model in the previous section (SAC) are presented in Table 7.
Table 7.
Direct, indirect, and total effects.
The coefficients of the direct effects are consistent with the findings reported in Table 6. The direct effects of the independent variables differ from their estimated coefficients. The reason is due to the feedback effects caused by impacts spreading to nearby nations and then returning to those nations [65]. The indirect effects produced some intriguing results. The spillover effect of FDI was 0.0004 (positive and significant). According to one interpretation of this coefficient, a 1% increase in foreign direct investment in all of the neighboring nations enhances GDP per capita in the local nation by 0.0004%. The total effect of this variable indicates that the GDP per capita in the local country increases by 0.002% due to a 1% increase in foreign direct investment in all countries. A similar result was found for human capital, with a spillover effect of 0.090 (positive and significant). Regarding the freedom variable, the indirect effect shows that a 1% increase in freedom of other countries leads to a 0.049% increase in the economic growth of the local country. The total effect of freedom indicates that if the freedom of all countries increases by one percent, the economic growth of a local country increases by 0.300%. For financial development, the indirect effect amounts to 0.006. This means that a 1% increase in FD in all neighboring countries boosts economic growth in the local country by 0.006%, while a 1% increase in the financial development of all countries leads to a 0.038% increase in the GDP of the local country. For every percent increase in the capital stock of neighboring countries, GDP per capita of the local country increases by 0.078%. The total effect of GFCF implies that if the capital stock of all countries increases by 1%, the economic growth of the local country increases by 0.474%.
4.7. Freedom Indicators and Economic Growth
To test the robustness of the main model’s results and investigate the effects of different freedom indicators on economic growth, we included economic freedom, press freedom, civil freedom, and political rights. Equation (1) is modified in the framework of the SAC model by considering the freedom variables as follows:
Model A
Model B
Model C
Model D
where EF is economic freedom, PF is press freedom, CF is civil liberties, and PR is political rights. In Model A, the effects of economic freedom along with other explanatory variables on economic growth were examined. As the results show, economic freedom has a positive and significant effect on economic growth, which confirms hypothesis H2. These findings are consistent with the findings of De Haan and Sturm [24] and Islam [7], who demonstrated that economic freedom is regarded as a driver for economic growth. In Model B, the relationship between press freedom and economic growth was examined. According to Table 8, the results indicate that there is a positive and significant relationship between press freedom and economic growth, which supports hypothesis H3. In Model C, the link between civil liberties and economic growth was evaluated. The findings show that civil liberties is positively and significantly related to economic development, which confirms hypothesis H4. These results are in line with the findings of Friedman [66] and Anwar and Cooray [67]. In Model D, the impact of political rights on economic growth was investigated. The findings indicate that political rights have no significant effect on economic growth, which rejects hypothesis H5. Overall, the results suggest that economic freedom has a greater effect on GDP than press freedom, political rights, and civil liberties. The results regarding other variables in all models also confirm the results of the main model.
Table 8.
The results of SAC model for Equations (17)–(20).
Figure 3 summarizes the findings of the SAC model for the dependent variable GDP and all explanatory variables. Figure 3 shows that there is a positive relationship between aggregated freedom and economic growth. Similarly, there is a positive connection from economic freedom, civil liberties, and press freedom to GDP. Moreover, our results confirm a negative association between political rights and economic growth. Regarding other variables, the results show that foreign direct investment, human capital, financial development, and capital stock are all positively related to economic growth.
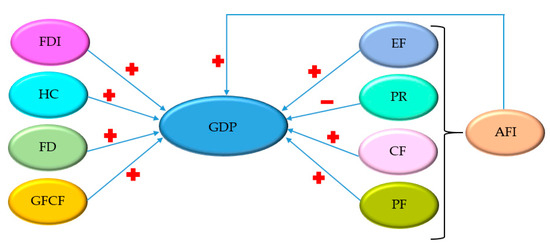
Figure 3.
Relationship between the variables analyzed and economic growth in European countries. Note: GDP, FDI, HC, FD, GFCF, EF, PR, CF, PF, and AFI denote economic growth, foreign direct investment, human capital, financial development, capital stock, economic freedom, political rights, civil liberties, press freedom, and aggregated freedom, respectively.
4.8. Panel Causality Results
The DH Granger causality test was applied to gain a better understanding of the relationship between the studied variables. The results of this test are presented in Table 9. The findings show that economic growth and freedom have a two-way causal effect in European countries. The results also confirm the existence of a bidirectional relationship between GDP and HC and between GDP and FD, as well as a unidirectional relationship between GDP and FDI and between GDP and GFCF.
Table 9.
The results of Granger causality test.
5. Conclusions
Economic growth and factors affecting it are noteworthy for most economists and policymakers. Therefore, factors affecting economic growth in European countries during 2000–2019 were investigated in this study using panel data and spatial panel models. The article uniquely contributes to the current literature as this is the first study to examine the effects of various aspects of freedom (economic freedom, press freedom, civil liberties, and political rights) and an aggregated index of freedom on economic growth in European countries. In addition, this work also contributes to the use of spatial panel models in investigating the relationship between the variables of concern. This research is expected to provide policymakers with a thorough understanding of how to implement the best policies in European countries to achieve sustainable economic development.
According to the research findings, there is spatial autocorrelation in economic growth in European countries. Hence, policymakers should consider the economic capacities of neighboring countries when making decisions about sustainable economic growth. According to the results, the variables of economic freedom, civil liberties, and press freedom have a positive effect on economic growth, whereas the variables of political rights have no effect on economic growth. In other words, the key to economic growth for a European country is to establish and maintain economic freedom, civil liberties, and press freedom.
The findings demonstrated that human capital would be beneficial to economic growth of European nations. The evidence also indicates that FDI is positively and significantly associated with economic growth. Given that the economic growth of European countries is dependent on foreign direct investment, governments should encourage foreign direct investment, particularly in technology and knowledge-based industries. Furthermore, the findings of this study suggest that enhancing European countries’ access to the financial resources required for economic growth would play a significant role in their economic development.
Comparing the results of the spatial models to the results of traditional panel models demonstrates the superiority of these models in investigating the determinants of economic growth. Despite their capabilities, these models have only been used in a few studies in the research literature to study economic growth. As a result, it is recommended that future studies on economic growth incorporate spatial models. Furthermore, the aggregated index of freedom introduced in this study can provide a more comprehensive view of the state of freedom of countries. As a result, this index can be used in future studies to assess the effects of freedom on economic, social, and environmental variables.
Author Contributions
Conceptualization, H.M. and S.S.; methodology, H.M. and S.S.; software, S.S.; validation, H.M., S.S. and J.D.B.; formal analysis, S.S.; investigation, H.M., S.S. and J.D.B.; data curation, H.M. and S.S.; writing—original draft preparation, H.M. and S.S.; writing—review and editing, H.M.; S.S. and J.D.B. All authors have read and agreed to the published version of the manuscript.
Funding
This research received no external funding.
Data Availability Statement
Not applicable.
Conflicts of Interest
The authors declare no conflict of interest.
References
- Wu, C. Economic freedom, economic growth, and China. Chin. Econ. 2011, 44, 104–119. [Google Scholar] [CrossRef]
- Olson, M. Distinguished lecture on economics in government: Big bills left on the sidewalk: Why some nations are rich, and others poor. J. Econ. Perspect. 1996, 10, 3–24. [Google Scholar] [CrossRef]
- Fabro, G.; Aixalá, J. Direct and indirect effects of economic and political freedom on economic growth. J. Econ. Issues 2012, 46, 1059–1080. [Google Scholar] [CrossRef]
- Nelson, M.A.; Singh, R.D. Democracy, economic freedom, fiscal policy, and growth in LDCs: A fresh look. Econ. Dev. Cult. Change 1998, 46, 677–696. [Google Scholar] [CrossRef]
- De Haan, J.; Sturm, J.-E. Does more democracy lead to greater economic freedom? New evidence for developing countries. Eur. J. Political Econ. 2003, 19, 547–563. [Google Scholar] [CrossRef]
- Doucouliagos, C.; Ulubasoglu, M.A. Economic freedom and economic growth: Does specification make a difference? Eur. J. Political Econ. 2006, 22, 60–81. [Google Scholar] [CrossRef]
- Islam, S. Economic freedom, per capita income and economic growth. Appl. Econ. Lett. 1996, 3, 595–597. [Google Scholar] [CrossRef]
- Scully, G.W. Economic freedom, government policy and the trade-off between equity and economic growth. Public Choice 2002, 113, 77–96. [Google Scholar] [CrossRef]
- De Haan, J.; Siermann, C.L. New evidence on the relationship between democracy and economic growth. Public Choice 1996, 86, 175–198. [Google Scholar] [CrossRef]
- De Haan, J.; Siermann, C.L. A sensitivity analysis of the impact of democracy on economic growth. Empir. Econ. 1995, 20, 197–215. [Google Scholar] [CrossRef]
- Doucouliagos, C. Publication bias in the economic freedom and economic growth literature. J. Econ. Surv. 2005, 19, 367–387. [Google Scholar] [CrossRef]
- Heckelman, J.C. Economic freedom and economic growth: A short-run causal investigation. J. Appl. Econ. 2000, 3, 71–91. [Google Scholar] [CrossRef]
- De Haan, J.; Siermann, C.L. Political instability, freedom, and economic growth: Some further evidence. Econ. Dev. Cult. Change 1996, 44, 339–350. [Google Scholar] [CrossRef]
- Anselin, L. Spatial Econometrics: Methods and Models; Springer Science & Business Media: Dordrecht, The Netherlands, 1988; Volume 4. [Google Scholar]
- Radmehr, R.; Henneberry, S.R.; Shayanmehr, S. Renewable energy consumption, CO2 emissions, and economic growth nexus: A simultaneity spatial modeling analysis of EU countries. Struct. Change Econ. Dyn. 2021, 57, 13–27. [Google Scholar] [CrossRef]
- Amidi, S.; Fagheh Majidi, A. Geographic proximity, trade and economic growth: A spatial econometrics approach. Ann. GIS 2020, 26, 49–63. [Google Scholar] [CrossRef]
- Cuaresma, J.C.; Doppelhofer, G.; Feldkircher, M. The determinants of economic growth in European regions. Reg. Stud. 2014, 48, 44–67. [Google Scholar] [CrossRef]
- Hu, A.; Liu, S. Transportation, economic growth and spillover effects: The conclusion based on the spatial econometric model. Front. Econ. China 2010, 5, 169–186. [Google Scholar] [CrossRef]
- Brkić, I.; Gradojević, N.; Ignjatijević, S. The impact of economic freedom on economic growth? New European dynamic panel evidence. J. Risk Financ. Manag. 2020, 13, 26. [Google Scholar] [CrossRef]
- Ciftci, C.; Durusu-Ciftci, D. Economic freedom, foreign direct investment, and economic growth: The role of sub-components of freedom. J. Int. Trade Econ. Dev. 2022, 31, 233–254. [Google Scholar] [CrossRef]
- Azman-Saini, W.; Baharumshah, A.Z.; Law, S.H. Foreign direct investment, economic freedom and economic growth: International evidence. Econ. Model. 2010, 27, 1079–1089. [Google Scholar] [CrossRef]
- Gurgul, H.; Lach, Ł. The Nexus Between Economic Freedom and Growth: Evidence from Cee Countries in Transition; University of Science and Technology in Cracow: Kraków, Poland, 2011. [Google Scholar]
- Hall, J.C.; Lacombe, D.J.; Shaughnessy, T.M. Economic freedom and income levels across US states: A spatial panel data analysis. Contemp. Econ. Policy 2019, 37, 40–49. [Google Scholar] [CrossRef]
- De Haan, J.; Sturm, J.-E. On the relationship between economic freedom and economic growth. Eur. J. Political Econ. 2000, 16, 215–241. [Google Scholar] [CrossRef]
- Vega-Gordillo, M.; Alvarez-Arce, J.L. Economic growth and freedom: A causality study. Cato J. 2003, 23, 199. [Google Scholar]
- Xu, Z.; Li, H. Political freedom, economic freedom, and income convergence: Do stages of economic development matter? Public Choice 2008, 135, 183–205. [Google Scholar] [CrossRef]
- Zulkarnaen, I. Assessing the Impacts of Political and Economic Openness on GDP Growth: Case of Asian Countries. J. Perenc. Pembang. Indones. J. Dev. Plan. 2017, 1, 109–124. [Google Scholar] [CrossRef]
- Peev, E.; Mueller, D.C. Democracy, economic freedom and growth in transition economies. Kyklos 2012, 65, 371–407. [Google Scholar] [CrossRef]
- Fatah, F.A.; Othman, N.; Abdullah, S. Economic growth, political freedom and human development: China, Indonesia and Malaysia. Int. J. Bus. Soc. Sci. 2012, 1, 291–299. [Google Scholar]
- Ayub, M.; Azman-Saini, W.; Laila, N.; Mongid, A.; Ismail, W.Z.W. Foreign Direct Investment and Economic Growth: The Role of Democracy. Int. J. Econ. Manag. 2019, 13, 481–493. [Google Scholar]
- Piątek, D.; Szarzec, K.; Pilc, M. Economic freedom, democracy and economic growth: A causal investigation in transition countries. Post-Communist Econ. 2013, 25, 267–288. [Google Scholar] [CrossRef]
- Alam, A.; Ali Shah, S.Z. The role of press freedom in economic development: A global perspective. J. Media Econ. 2013, 26, 4–20. [Google Scholar] [CrossRef]
- Nguyen, J.; Valadkhani, A.; Nguyen, A.; Wake, A. Press Freedom and the Global Economy: The Cost of Slipping Backwards. J. Stud. 2021, 22, 399–417. [Google Scholar] [CrossRef]
- Pal, S.; Dutta, N.; Roy, S. Media freedom, socio-political stability and economic growth. Retrieved Sept. 2011, 26, 2011. [Google Scholar]
- Nyström, K. The institutions of economic freedom and entrepreneurship: Evidence from panel data. Public Choice 2008, 136, 269–282. [Google Scholar] [CrossRef]
- Kandogan, Y.; Johnson, S.D. Role of economic and political freedom in the emergence of global middle class. Int. Bus. Rev. 2016, 25, 711–725. [Google Scholar] [CrossRef]
- Levin, A.; Lin, C.-F.; Chu, C.-S.J. Unit root tests in panel data: Asymptotic and finite-sample properties. J. Econom. 2002, 108, 1–24. [Google Scholar] [CrossRef]
- Im, K.S.; Pesaran, M.H.; Shin, Y. Testing for unit roots in heterogeneous panels. J. Econom. 2003, 115, 53–74. [Google Scholar] [CrossRef]
- Pesaran, M.H. A simple panel unit root test in the presence of cross-section dependence. J. Appl. Econom. 2007, 22, 265–312. [Google Scholar] [CrossRef]
- Kao, C. Spurious regression and residual-based tests for cointegration in panel data. J. Econom. 1999, 90, 1–44. [Google Scholar] [CrossRef]
- Pedroni, P. Panel cointegration: Asymptotic and finite sample properties of pooled time series tests with an application to the PPP hypothesis. Econom. Theory 2004, 20, 597–625. [Google Scholar] [CrossRef]
- Westerlund, J. Testing for error correction in panel data. Oxf. Bull. Econ. Stat. 2007, 69, 709–748. [Google Scholar] [CrossRef]
- Kelejian, H.H.; Prucha, I.R. Specification and estimation of spatial autoregressive models with autoregressive and heteroskedastic disturbances. J. Econom. 2010, 157, 53–67. [Google Scholar] [CrossRef] [PubMed]
- Bivand, R. Applying measures of spatial autocorrelation: Computation and simulation. Geogr. Anal. 2009, 41, 375–384. [Google Scholar] [CrossRef]
- Lee, J.; Wong, D.W. Statistical Analysis with ArcView GIS.; John Wiley & Sons: Hoboken, NJ, USA, 2001. [Google Scholar]
- Anselin, L. Spatial econometrics. In A Companion to Theoretical Econometrics; John and Wiley and Sons: Hoboken, NJ, USA, 2001; p. 310330. [Google Scholar]
- LeSage, J.; Pace, R.K. Introduction to Spatial Econometrics; Chapman and Hall/CRC: Boca Raton, FL, USA, 2009. [Google Scholar]
- Elhorst, J.P. Spatial Econometrics from Cross-Sectional Data to Spatial Panels; Springer: Berlin/Heidelberg, Germany, 2014. [Google Scholar]
- Kohansal, M.R.; Shayanmehr, S. The interplay between energy consumption, economic growth and environmental pollution: Application of spatial panel simultaneous-equations model. Iran. Energy Econ. 2016, 19, 179–216. [Google Scholar]
- Wang, S.; Fang, C.; Li, G. Spatiotemporal characteristics, determinants and scenario analysis of CO2 emissions in China using provincial panel data. PLoS ONE 2015, 10, e0138666. [Google Scholar] [CrossRef] [PubMed]
- Ghorbani, M.; Shayanmehr, S. Identify factors affecting on the economic growth of developed countries: Application of panel Tobit and spatial panel Tobit models. Agric. Econ. Res. 2022, 14, 43–58. [Google Scholar]
- Elhorst, J.P. Spatial panel data models. In Spatial Econometrics; Springer: Berlin/Heidelberg, Germany, 2014; pp. 37–93. [Google Scholar]
- Belotti, F.; Hughes, G.; Mortari, A.P. Spatial panel-data models using Stata. Stata J. 2017, 17, 139–180. [Google Scholar] [CrossRef]
- Alfaro, L.; Chanda, A.; Kalemli-Ozcan, S.; Sayek, S. FDI and economic growth: The role of local financial markets. J. Int. Econ. 2004, 64, 89–112. [Google Scholar] [CrossRef]
- Akisik, O.; Gal, G.; Mangaliso, M.P. IFRS, FDI, economic growth and human development: The experience of Anglophone and Francophone African countries. Emerg. Mark. Rev. 2020, 45, 100725. [Google Scholar] [CrossRef]
- Radmehr, R.; Ali, E.B.; Shayanmehr, S.; Saghaian, S.; Darbandi, E.; Agbozo, E.; Sarkodie, S.A. Assessing the Global Drivers of Sustained Economic Development: The Role of Trade Openness, Financial Development, and FDI. Sustainability 2022, 14, 14023. [Google Scholar] [CrossRef]
- El Menyari, Y. Effect of tourism FDI and international tourism to the economic growth in Morocco: Evidence from ARDL bound testing approach. J. Policy Res. Tour. Leis. Events 2021, 13, 222–242. [Google Scholar] [CrossRef]
- Radmehr, R.; Shayanmehr, S.; Ali, E.B.; Ofori, E.K.; Jasińska, E.; Jasiński, M. Exploring the nexus of renewable energy, ecological footprint, and economic growth through globalization and human capital in g7 economics. Sustainability 2022, 14, 12227. [Google Scholar] [CrossRef]
- Amna Intisar, R.; Yaseen, M.R.; Kousar, R.; Usman, M.; Makhdum, M.S.A. Impact of trade openness and human capital on economic growth: A comparative investigation of Asian countries. Sustainability 2020, 12, 2930. [Google Scholar] [CrossRef]
- Zhang, L.; Godil, D.I.; Bibi, M.; Khan, M.K.; Sarwat, S.; Anser, M.K. Caring for the environment: How human capital, natural resources, and economic growth interact with environmental degradation in Pakistan? A dynamic ARDL approach. Sci. Total Environ. 2021, 774, 145553. [Google Scholar] [CrossRef] [PubMed]
- Affandi, Y.; Anugrah, D.F.; Bary, P. Human capital and economic growth across regions: A case study in Indonesia. Eurasian Econ. Rev. 2019, 9, 331–347. [Google Scholar] [CrossRef]
- Luqman, M.; Soytas, U. Asymmetric role of human capital and trade liberalization in the economic growth of Pakistan: Fresh evidence from the nonlinear analysis. J. Int. Trade Econ. Dev. 2022, 1–19. [Google Scholar] [CrossRef]
- Wacziarg, R. Measuring the dynamic gains from trade. World Bank Econ. Rev. 2001, 15, 393–429. [Google Scholar] [CrossRef]
- Shahbaz, M.; Zeshan, M.; Afza, T. Is energy consumption effective to spur economic growth in Pakistan? New evidence from bounds test to level relationships and Granger causality tests. Econ. Model. 2012, 29, 2310–2319. [Google Scholar] [CrossRef]
- You, W.; Lv, Z. Spillover effects of economic globalization on CO2 emissions: A spatial panel approach. Energy Econ. 2018, 73, 248–257. [Google Scholar] [CrossRef]
- Friedman, M. 61. Capitalism and Freedom. In Democracy; Columbia University Press: New York, NY, USA, 2016; pp. 344–349. [Google Scholar]
- Anwar, S.; Cooray, A. Financial development, political rights, civil liberties and economic growth: Evidence from South Asia. Econ. Model. 2012, 29, 974–981. [Google Scholar] [CrossRef]


Disclaimer/Publisher’s Note: The statements, opinions and data contained in all publications are solely those of the individual author(s) and contributor(s) and not of MDPI and/or the editor(s). MDPI and/or the editor(s) disclaim responsibility for any injury to people or property resulting from any ideas, methods, instructions or products referred to in the content. |
© 2022 by the authors. Licensee MDPI, Basel, Switzerland. This article is an open access article distributed under the terms and conditions of the Creative Commons Attribution (CC BY) license (https://creativecommons.org/licenses/by/4.0/).