Abstract
Approaches presented today in the scientific literature suggest that there are no methodological solutions based on the training of artificial neural networks to predict the direction of industrial development, taking into account a set of factors—innovation, environmental friendliness, modernization and production growth. The aim of the study is to develop a predictive model of performance management of innovative industrial systems by building neural networks. The research methods were correlation analysis, training of neural networks (species—regression), extrapolation, and exponential smoothing. As a result of the research, the estimation efficiency technique of an innovative industrial system in a complex considering the criteria of technical modernization, development, innovative activity, and ecologization is developed; the prognostic neural network models allow to optimize the contribution of signs to the formation of target (set) values of indicators of efficiency for macro and micro-industrial systems that will allow to level a growth trajectory of industrial systems; the priority directions of their development are offered. The following conclusions: the efficiency of industrial systems is determined by the volume of sales of goods, innovative products and waste recycling, which allows to save resources; the results of forecasting depend significantly on the DataSet formulated. Although multilayer neural networks independently select important features, it is advisable to conduct a correlation analysis beforehand, which will provide a higher probability of building a high-quality predictive model. The novelty of the research lies in the development and testing of a unique methodology to assess the effectiveness of industrial systems: it is based on a multidimensional system approach (takes into account factors of innovation, environmental friendliness, modernization and production growth); it combines a number of methodological tools (correlation, ranking and weighting); it expands the method of effectiveness assessment in terms of the composition of variables (previously presented approaches are limited to the aspects considered).
Keywords:
innovative industrial system; extractive industry; manufacturing industry; efficiency; forecasting; neural networks; radial basis functions (RBF); multilayer perceptron (MLP) MSC:
90C35
1. Introduction
The growing demands on industry and the conditions of modernity are caused by a number of objective reasons: the problem of the exhaustion of natural resources, intensive environmental pollution, and concern for future generations. Industrial systems that do not meet the requirements of the external (interaction with the environment and excessive emissions of pollutants, external effects in relation to society, etc.) and internal environment (working conditions, the state of fixed assets, etc.), need significant modernization. This affects the efficiency of the functioning of industrial systems, due to the level of rationality of capital investment, operating costs, organization and automation of production, digitalization of industrial systems, and innovation activities. The importance of managing the efficiency of innovative industrial systems in Russia is due to the high indices of industrial production: over a ten-year period (2010–2020) the index in Russia was 124%, Turkey—167%, Poland—143%, Australia—126%, the Republic of Korea—115%, USA—104%, Japan—88%, etc. [1]. However, Russian industry operates under conditions of high depreciation of fixed assets (at the end of 2021 in the extractive industry the index was 60.8%, and in the manufacturing sector—52.5%), which increases production risks and, presumably, affects the performance. Thus, under the conditions of tightening economic conditions, the management of efficiency and its factors becomes especially important, which makes the problems studied in this article urgent.
The aim of the study is to develop a predictive model of performance management of innovative industrial systems by building neural networks. The theoretical significance of the formulated provisions consists of the development of the methodology of performance management. The practical significance of the research lies in the possibility of predicting the performance of enterprises based on data management of the assets of industrial systems, and the identification of the degree of influence of production factors on the results of the functioning of industrial systems.
The object of the study is innovative industrial systems. The key features of such systems are, firstly, notable innovation activity, supported by human capital, scientific potential, availability of resources, investments, and secondly, production of products. Consequently, the considered category is based on a combination of the designated key features with an orientation on technological development. Let us highlight the provisions characterizing the functioning of innovative industrial systems in modern economic conditions.
First, industrial innovations determine the competitiveness of companies on the market and make a significant contribution to improving the quality of products [2,3,4].
Second, the ongoing structural transformation of industrial systems is accompanied by modernization, the quality of which is determined by innovation [5,6].
Third, the level of change management determines the category of the system, in connection with which modern scientists distinguish such types of innovation systems as national, regional, technological, and sectoral [7,8,9,10,11,12,13,14,15]. Our research is focused on innovative branch systems, i.e., systems which unite organizations (links of production system), processing raw materials into finished products, and interacting with each other and with infrastructural organizations of a national innovation system.
Fourthly, the interaction of agents in the innovative development of industry takes place under various forms of cooperation, which include clusters [16,17,18], technological platforms [19,20], consortia [21,22] and other types of cooperation.
Generalizing the above provisions, as well as relying on [23], let us clarify the definition of «innovation industrial system». Under it, we understand a set of interconnected subsystems, processes, elements, and participants, united by commodity-raw, energy, information, financial and service flows, contributing to the production of industrial products and the formation of GDP. By subsystems, we mean a subsystem of R&D, supply, production, distribution, transport, storage subsystems, and related infrastructure. Industrial systems can be considered at the scale of micro, meso- and macro levels. In the first case we should understand a production system and its functioning subsystems, in the second case—an industrial complex (a set of interacting enterprises located in a particular territory and united by industry, in particular, industrial clusters, holdings), in the third case—national industry as an independent branch of the national economy, uniting extractive, manufacturing, and energy production.
The behavior of complex systems, in particular industrial systems, is influenced by many external and internal factors, predictable and random. In this regard, the processes occurring in innovative industrial systems are stochastic in nature. Simulation tools allow us to assess and predict the behavior of such a system, as well as the nature and degree of influence of factors. In the conditions of the necessity of processing large arrays of data (on equipment operation, technological and business processes, stocks, etc.) methods of predictive analytics: Data mining, statistical and econometric methods, and methods of artificial intelligence are recognized as valuable tools. The latter is based on the training of neural networks, which has gained popularity in practice today: the search for minerals, solving logistics problems, the prediction of equipment failures, etc. Against the background of the advantages of neural networks, statistical methods of data processing (correlation and regression, cluster analysis, factor analysis and the principal component method, classification, and regression trees, etc.) have a certain weakness—the prediction of results based only on available data; neural networks can generate a prediction based on data not encountered in the training.
The practical application of neural network tools is popular and covered in the studies of many scientists. Conceptually, the neural network training methodology is widely covered in the scientific literature [24,25,26,27,28,29,30,31]. According to scientists, the quality and adequacy of models, and their predictive properties for extrapolation purposes are conditioned by the data set and their volume. Learning neural networks contribute to the structuring of information about complex dynamic systems, which include industrial systems. In this regard, neural networks are widely used in industry, due to the need for high-quality processing of large amounts of data on resource consumption, energy consumption, and business processes. In the context of oil pipeline monitoring and petroleum product volume prediction, this tool is highlighted in Mayet et al. where pipeline performance characteristics (amplitudes) are defined as inputs of the neural network, with percentages of four petroleum products as outputs [32]. To ensure continuous pharmaceutical production, the neural network model was tested by Wong et al. [33].
One of the purposes of the neural network technique is forecasting. A one-dimensional GDP prediction model was proposed by Longo et al. [34]. The problems of forecasting the regional industrial systems, where the authors proposed a neural network model with two blocks of input data (block 1—regional system and regional GDP level; block 2—panel data network and indicators of regional GDP growth index, mining, manufacturing and service sector growth values), and output parameters—forecasted values of industrial growth are disclosed in the works of Tuo et al. [35]. A predictive neural network model was proposed by Zhao and Niu [36]. The authors investigated the dependence of CO2 emissions on four factors—population, GDP per capita, standard coal consumption and the share of thermal power generation. Adesanya et al. use neural networks to predict process parameters in the thermoplastic extrusion process in the cable industry, whereby the authors set nine neurons (parameters describing physical material properties) as the input and 11 neurons (temperature parameters) as the output layer [37].
Under the conditions of implementation of resource and energy-saving policies, energy consumption management is of particular importance, and in this regard, neural network models have become very popular in the context of rationalization of energy consumption. The study by Leite Coelho da Silva et al. presents the results of building a one-dimensional model for predicting energy consumption and reveals that a better prediction is obtained by building an MLP mode [38]. Shinkevich et al. propose energy resource optimization methods based on neural network training: the input parameters of the model are optimal, minimal and average energy consumption values, deviation and variance, and the output parameter is the optimal energy consumption in the chemical industry [39]. Ramos et al. propose a model to predict the electricity consumption of industrial facilities by analyzing online data (consolidated every 5 min) and applying an artificial neural network (ANN) [40]. Seawram et al. propose a predictive model of specific heat capacity (one neuron per output) based on the latent dependence of the target variable on the input parameters (nine neurons per input—different parameters of base fluid, nanoparticles and temperature) consistent with sustainable development and direction to reduce carbon dioxide emissions [41]. The team of scientists, Dli et al., built a process state prediction model using recurrent neural networks [42]. Thus, the key effect of modeling industrial systems based on a neural network is to improve the quality of manufactured products and the level of safety of production systems.
The methodology for training neural networks to assess the performance of enterprises (microindustrial systems) is covered in a number of papers [43,44,45], which demonstrates the high practical value and widespread application of deep learning tools as part of the evaluation and prediction of enterprise performance. However, studies limited to economic and innovation indicators, ignoring the environmental aspects of the functioning of enterprises prevail. Thus, Du combines such a wide range of indicators, including innovation activities, but does not focus on the analysis of a series of dynamics and prospection, but on a set of enterprises with an identical set of indicators, and does not consider environmental issues [43]. A similar approach is outlined in a study by Luo and Ren [45], but it also omits the environmental issue.
At the same time, the literature review of scientific positions allows us to judge the presence of a certain unrealized potential in the methodology of industrial systems efficiency management: there are no methodological solutions based on the training of artificial neural networks, allowing us to evaluate and predict the direction of industrial development, considering a complex of factors—innovation, environmental friendliness, modernization and production growth. An interesting approach to regional industry management based on neural networks was found in [35], but the authors limited the study to the inclusion of GDP and production index indicators. The above determines the relevance and importance of the development of predictive models and directions of development of both macro- and micro-industrial systems with the use of intelligent data processing tools.
2. Materials and Methods
The algorithm of this study is built on the principle of decomposition at the macro- and micro levels of management of industrial systems. In the first case, we are talking about the industrial sector of the Russian economy, represented mainly by extractive and manufacturing industries. The array of data for diagnostics and forecasting of the development of industrial systems (in retrospect) covers the period from 2005 to 2021—the period of structural transformation of industry in Russia [1,46]. In addition, speaking of innovative industrial systems, we refer not only to the output of innovative products but also to the investment of resources in improving the environmental friendliness of production. In the second case—at the micro level—the object of the research was a Russian industrial petrochemical enterprise PJSC «Nizhnekamskneftekhim»; the initial data set represented by the time series for 2009–2021 (quarterly data). The choice in favor of this enterprise is due to its strategic importance since it is one of the largest petrochemical enterprises in Russia and in Europe, one of the largest producers of synthetic polyisoprene in the world and the third largest supplier of butyl rubbers in the world.
- Consequently, it is strategically important to develop adequate predictive models that can not only consider the history of the development of the industrial system but also be able to predict the results of activity under the influence of certain factors. In this regard, the following stages of research are outlined:
- identification of patterns and trends in the development of macro- and micro-industrial systems;
- forecasting the efficiency of innovative macro-industrial systems;
- predicting the efficiency of the microindustrial system.
- The methodological basis of this study is a set of the following stages of modeling:
- information gathering;
- identification of significant relationships between indicators (correlation analysis);
- formation of a mathematical model;
- model verification;
- analysis of simulation results.
As an indicator of efficiency at the macro level, the use of the gross value added, combining the interests of all participants of the industrial system and the economy as a whole state proposed. It is a value equal to the difference between the volume of produced goods and services and their intermediate consumption [1]. The latter covers payroll, net profit, taxes, and depreciation, which is of interest not only to owners, but also to the state, investors, and employees.
We took the gross value added (Yi) as the dependent variable:
Ymining—is the gross value added created in the mining sector (billion rubles);
Ymanufacturing—is the gross value added created in the manufacturing sector (billion rubles).
Taking into consideration current trends in economic development, the following indicators are taken as independent variables:
DFA(i)—degree of depreciation of fixed assets on the full range of organizations of the i-th sector of industry (%)—criterion of technical modernization;
VSG(i)—volume of shipped goods of own production, work and services performed by own forces in the i-th sector of industry (million rubles)—development criterion;
VIG(i)—volume of innovative goods, works, and services in the Russian Federation (million rubles)—criterion of innovative activity;
RW(i)—use and neutralization of production and consumption waste in the i-th sector of industry (million tons)—greening criterion.
At the micro level, the evaluation efficiency of the classical indicators of profitability, taken as dependent (output) variables carried out, and taken as dependent (output) variables:
Rps—profitability of sold products;
Rs—return on sales.
As input variables (independent) investigated:
CA—current assets (thousand rubles);
FA—fixed assets (thousand rubles);
GP—gross profit (thousand rubles);
PS—profit from sales (thousand rubles).
Based on the identified relationships between the criteria variables and predictors the author’s methodology for assessing the effectiveness of innovative industrial systems (IIS) is proposed. Our approach is based on the method of rating assessments and benchmarks and focused on a comprehensive assessment of the development of an innovative industrial system. For this purpose, the index which takes into consideration the correlation of predictors with the gross added value created by a separate sector of the economy—the growth of the innovative industrial system coefficient (Kiisd) is developed. It takes into consideration the criteria of technical modernization, development, innovation activity, and ecologization and reflects the complex efficiency of industrial system functioning. The algorithm of the methodology (Figure 1) clearly reflects the stages and the arrays of necessary data formed at each stage.
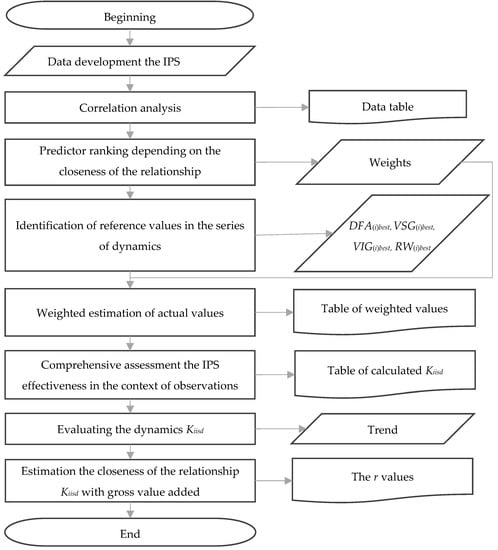
Figure 1.
The author’s methodology algorithm for assessing the effectiveness of innovative industrial systems.
The suggested methodology is distinguished by taking into account heterogeneous, but significant components of the functioning of industrial enterprises (technical modernization, development, innovation activity, and greening), which allows us to overcome the limitations in assessing the directions of development; correlates with the interests of all stakeholders in the economic system (noted above); is multifaceted, flexible and adaptive (the weighting factors are adjustable and respond to changes in the dynamics of indicators), which affects the correlation coefficients. The formulated methodology develops the previously proposed by us method for assessing the sustainable growth of innovative mesosystems (ISDI) [23] and overcomes the problems of dimensionality of the parameters under study.
The result of the presented methodology is the calculation of the coefficient of development of an innovative industrial system—Kiisd (1):
where j—is one of the four attributes (DFA, VSG, VIG, RW); Aij(min) or Aij(max))—is the reference value for the corresponding attribute in the dynamics series; Aij(year)—is the actual value of the indicator in a particular year; wj—is the weight coefficient j attribute; aj—the rank assigned to the j attribute in accordance with the value of the correlation coefficient (aj = 4 for the attribute with the strongest correlation; aj = 1 for the attribute with the weakest correlation); Yi—the gross value added created in the i-th industry sector.
At the next stages of the study, modeling and forecasting of the indicators are carried out. The forecasting tool was artificial neural networks (ANN), trained in the Statistica environment. Of the three available modeling strategies (automated neural networks search (ANS), custom neural networks (CNS) and subsampling (random, bootstrap)) the ANS option is used in all modeling cases. The basic problem solved by neural networks is regression. The neural network parameters are weights and shifts of neurons, and the hyperparameters are the number of layers, the number of neurons in each layer, activation functions and the error function. Let us consider these parameters in more detail.
The neural network construction is based on the summation function of a neuron, which consists of the summation of products of input values by their weight coefficients (2):
where Y—is the output value; X = (x1, x2 …, xn)—is a vector of input signals, a feature; W = (ω1, ω2 …, ωn)—is a vector of weights reflecting the significance of the corresponding feature (strength of synaptic connection, synapse); b is the activation function bias neuron.
The inputs of the artificial neural network are a mathematical vector of numbers X (3):
- An activation function is a function that converts weighted inputs into an adequate output. We distinguish between activation functions for radial basis functions (RBF) and multilayer perceptron (MLP). In the former, we rely on the following functions:
- Gauss function (4):
- the identity function (linear) (5):
The following activation functions in MLP training applied:
- an identical function;
- logistic function (sigmoid) (6):
- function of the hyperbolic tangent (7):
- exponential function (8):
The error function (neural network error) in regression problems is determined by the formula for summing the squares of errors (9):
where Y—is the actual value of the output variable and Y*—Y* is the predicted value of the output variable.
We evaluated the quality of trained artificial neural networks using the test sample with the average absolute error MAPE (10):
where n—is the number of observations in the test sample (automatically); YAR—is the absolute residuals on Y in the test sample.
According to the architecture, all neural networks are divided into two types: single-layer and multilayer. A single-layer network is a neural network without hidden layers, the signals of the input layer, including synapses, are fed to the output layer, which provides a relatively high speed of learning; the architecture of such a network is stable and does not vary; pre-processing of predictors is required [47,48,49,50,51]. However, due to the simplicity of tuning and consequently, the low accuracy of the model, we do not use the method of training single-layer neural networks in the study.
We rely on the application of a multilayer neural network (deep), in which the input signals pass through hidden layers with one set of synapses, and only then to the output layer with other weights. While the single-layer network requires careful preparation of the input data, in the multilayer neural networks this problem is overcome by the transformation and selection of features during training. At the same time, the addition of hidden layers causes an increase in the training time of the network, and the ability to process a small amount of data and retraining can contribute to a low quality of prediction [52,53,54,55].
Thus, the key type of neural network used in the paper is a multilayer network (1 hidden layer with h neurons), where x—is a set of predictors, inputs, and Y—is a set of categorical variables, outputs (Figure 2).
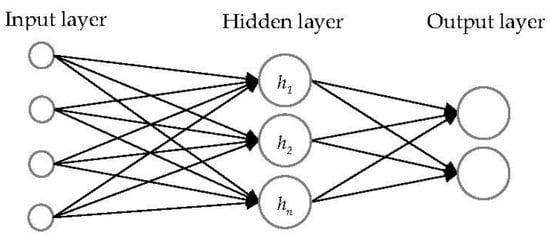
Figure 2.
The architecture of the multilayer neural network.
Homogeneous and heterogeneous neural networks are distinguished according to the type of neuronal structures. In the first case, homogeneous networks consist of neurons with one type of activation, while in the second case there is a combination of activation functions [56]. In our study, there are artificial neural networks of both types, but predominantly heterogeneous ones, because in this way the network automatically chooses the best option to calculate the output value.
The methodological basis was the use of such methods of data processing as correlation analysis, training of neural networks (species—regression), extrapolation, and exponential smoothing. An instrumental set of data processing includes such software products as Statistica (module—«Automated neural networks search», «Time series and forecasting») and Deductor Studio (module—Neural network). The calculation of efficiency indicators and the coefficient of development of the innovative industrial system Kiisd is implemented in Microsoft Excel.
3. Results
3.1. Trends in the Development of Stochastic Innovation Industrial Systems in Russia
Industrial systems in Russia are developing steadily to a certain extent, as evidenced by the dynamics of gross value added created in the mining and processing sector. The trend analysis makes it possible to judge the global growth trend in both types of industrial systems (Figure 3) (more data in Appendix A). A more predictable and sustainable dynamic is demonstrated by manufacturing, which, unlike extractive industries, maintained its production momentum in 2020 (the year of the global pandemic, when supply chains around the world were disrupted, negatively affecting technological processes, production costs, and sales volumes). While the index of gross value added in 2020 in the extractive industries decreased by 27% (relative to 2019), the index in the manufacturing industries increased by 1.4%. This trend is due to the specificity of industries, flexibility and ability to restructure and diversify production.
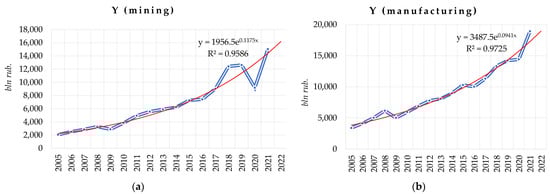
Figure 3.
Extrapolation of gross value added by industrial sector of the Russian economy by constructing an exponential trend line for the mining (a) and manufacturing (b) industries.
According to the author’s methodology algorithm (Figure 1), the data collection of the development of the industrial system in Russia allowed to carry out a correlation analysis, which revealed that the dependent variable (Yi) significantly depends on all four input variables (DFA, VSG, VIG, RW) in both cases—the extractive and manufacturing sectors of the economy in Russia (Table 1, Table 2). The correlation coefficients exceed 0.7, and the closeness of the relationship between all the indicators is high.

Table 1.
Correlation matrix and ranking indicators the mining sector of the economy.
Table 2.
Correlation matrix and ranking indicators the manufacturing sector of the economy.
Having all the necessary data, we identified the reference values in the series of dynamics (Table 3).
Table 3.
Benchmark values the innovative industrial systems indicators.
Then by Formula (1), we calculated the weighted values of the four indicators for the study period and the final coefficient of growth of the innovative industrial system Kiisd for two types of industrial systems (Table 4) and compared them to the dynamics of gross value added (Figure 4).
Table 4.
Comprehensive assessment of the development of innovative industrial systems (calculated according to the author’s methodology).
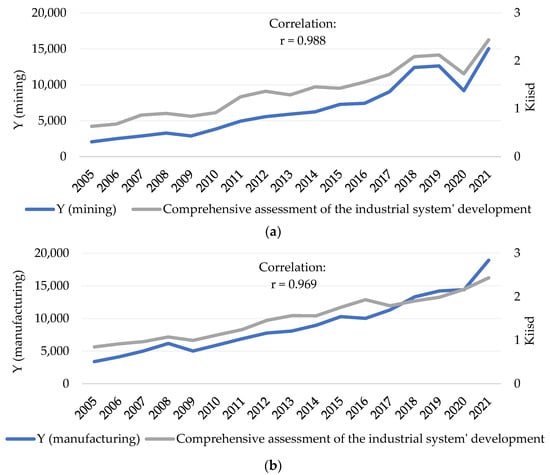
Figure 4.
The verification coefficient of development effectiveness the innovation industrial system for the mining (a) and manufacturing (b) industries (comparison of the actual values of gross value added and calculated by the author’s methodology values of the coefficient of development of innovative industrial system).
As in the case of gross value added, the coefficient of integrated development of industrial systems as a whole, increases (in both cases). The quality of the proposed indicator is confirmed by the comparison with the size of the gross value added. The higher quality of the indicator is demonstrated by the mining sector, as evidenced by low deviations and a correlation coefficient of 0.988 (Figure 4a). The deviations are more pronounced in the manufacturing industrial systems sector, as evidenced by the correlation coefficient of 0.969 (Figure 4b).
In general, the high quality of the proposed indicator should be noted; it succinctly and comprehensively describes the characteristics of industrial systems in a particular period of time and allows a comparative analysis of the development of various objects of research.
Thus, the patterns of development of innovative industrial systems should include the steady growth of gross value added, which satisfies the interests of owners, investors, government, and employees; there is direct and high dependence on this performance indicator for the four most important criteria of modern economic system functioning (the criteria of technical modernization, development, innovation activity, greening). The causal relationship (positive) between the depreciation of fixed assets x1 and the gross added value Y can be explained by the concentration of efforts and resources of production systems not on the renewal of technical infrastructure, but on product and technological innovation, as well as on measures for the recycling of production and consumption waste. Shifting the focus to the purchase of new equipment and the subsequent reduction in the degree of fixed assets will restrain the growth of production and gross value added as a result of the redistribution of income and investment.
3.2. Variative Forecasting of the Efficiency of Innovative Macro-Industrial Systems in Russia
3.2.1. Univariate Prediction
In order to predict the efficiency of industrial systems development the gross value added indicator taken as a basis (modeling for the dependent variable Kiisd showed similar architectures and characteristics of neural networks and corresponding predictions), alternative types of neural networks—Multilayer Perceptron (MLP) and Radial Basis Function (RBF)—evaluated. Univariate prediction assumes a single neuron input and output: the actual value (input value) and the predicted value (output value). The size of the subsamples is set in the following proportions: training—60%, test—20%, validation—20%. By applying the ANS option, five networks with the best quality scores were trained.
- In the extractive sector, the highest performance is shown by the radial basis function network with five hidden neurons RBF 1-5-1 and a learning performance of 97.55% (Table 5). The error function is defined by the sum of squares formula, the activation function of hidden neurons is Gaussian, and the output neurons are identical (linear). Thus, the obtained one-dimensional neural network is heterogeneous, combining neurons with two different activation functions, and multilayer.
Table 5.
Alternative univariate models for predicting Ymining gross value added.
Table 5.
Alternative univariate models for predicting Ymining gross value added.
| Net. Name | Training Perf. | Test Perf. | Validation Perf. | Training Error | Test Error | Validation Error |
|---|---|---|---|---|---|---|
| RBF 1-5-1 | 0.975502 | 0.991997 | 0.999828 | 74,038.1 | 2,517,832 | 10,540,650 |
| RBF 1-5-1 | 0.924554 | −0.713870 | 0.999946 | 290,964.0 | 13,077,520 | 29,005,897 |
| RBF 1-5-1 | 0.958372 | 0.973763 | 0.986317 | 148,272.0 | 6,215,827 | 17,400,202 |
| MLP 1-6-1 | 0.969824 | 0.931990 | 0.984887 | 98,788.5 | 834,197 | 4,930,694 |
| RBF 1-5-1 | 0.750521 | −0.862889 | 0.975379 | 944,232.3 | 1,353,0519 | 29,115,342 |
The time series graph is plotted in the projection over 25 periods (starting from period 1), which allows us to estimate the near-term performance of the extractive sector of the economy in Russia (in 7 years). According to the best network (RBF 1-5-1), the projected value of gross value added in the industry will remain at 9000 billion rubles (Figure 5a). Forecasting Kiisd shows a similar development trend (Figure 5b).
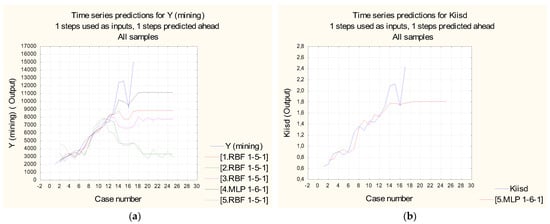
Figure 5.
Projection the performance of innovative industrial systems 7 years ahead: (a) forecasting neural networks Ymining; (b) Kiis forecasting neural networks.
Since the quality of the model was estimated by the test sample, we estimated the relative error of this model by absolute residuals. We calculated the average absolute error of MAPE and found that the quality of the test sample for Ymining was 31.3%, for Kiisd—22% (high error), indicating the low quality of the predicted scenario of changes in gross value added in the mining sector. The difficult-to-predict indicator is due to the previously noted sharp decline in gross value added in the industry.
The application of the exponential smoothing tool (α = 0,1; without trend and seasonality) reduces the average absolute error of MAPE to 12%. However, the results of smoothing significantly distort the original data set, which affects the results of forecasting by neural networks. If the actual data provide the forecast of the indicator for future periods at the level of 9000 billion rubles (Figure 5a), then taking into account the exponential smoothing, the forecasted value falls below 6000 billion rubles.
The intermediate conclusion is that the neural network RBF 1-5-1 (MAPE = 31.3%) predicts the value of gross value added in the extractive industry at 9000 billion rubles.
- 2.
- In the processing sector, we obtained the best multilayer perceptron type network described by the MLP 1-2-1 architecture—with two hidden neurons, whose activation function is hyperbolic; the activation function of neurons at the output is identical (Table 6). The model is again heterogeneous.
Table 6. Alternative univariate models for forecasting the gross value added of Ymanuf..
According to the projection, the gross value added will fluctuate between 15,000 and 16,000 billion rubles (Figure 6). The average value of the error calculated on absolute residuals in the test sample was 14.6%, which is twice better than in the case of the one-dimensional Ymanuf. projection model. The manufacturing industry is expected to grow further, but at a lower growth rate (with a probability of 14.6%).
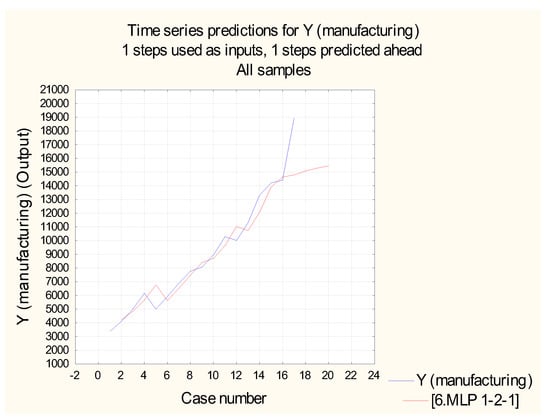
Figure 6.
Projection the Ymanuf. for 7 years ahead.
The intermediate conclusion is that the multilayer neural network of MLP 1-2-1 architecture (MAPE = 14.6%) predicts the value of Ymanuf. in the range of 15,000–16,000 billion rubles.
3.2.2. Multivariate Forecasting
As an alternative method of prediction, we trained a neural network taking into account several features—DFA, VSG, VIG, RW. The quality of the models has increased significantly.
We modeled the dynamics series, which characterize the efficiency of industrial systems functioning, according to a similar algorithm carried out. However, the architecture of networks has changed in terms of input neurons—their number has increased to 4 (according to a set of features). Both types of neural networks (MLP and RBF) are set for training the largest number of networks, nets for training—50, nets for conservation—5.
- In the field of mining, it was revealed that MLP models demonstrate a higher quality of prediction of the output variable (Table 7). The balance of the quality of the training and control samples allows the choice to be made in favor of networks with MLP 4-8-1 and MLP 4-9- 1 architecture. The choice of the best model was also made according to the MAPE criterion, so network #3 with MLP 4-9-1 architecture was chosen for scenario prediction. The activation function of hidden neurons is a hyperbolic tangent; the activation function of output neurons is identical. A quality check of the test sample confirms the lowest error value for the selected network, but at the same time—high (28%).
Table 7.
Alternative multivariate models for predicting Ymining gross value added.
Table 7.
Alternative multivariate models for predicting Ymining gross value added.
| Net. Name | Training Perf. | Test Perf. | Validation Perf. | Training Error | Test Error | Validation Error | MAPE |
|---|---|---|---|---|---|---|---|
| RBF 4-5-1 | 0.986852 | 0.975468 | 0.999344 | 24,126.39 | 3,109,395 | 12,947,184 | 42% |
| MLP 4-8-1 | 0.991204 | 0.927100 | 0.994118 | 4907.93 | 1,623,501 | 7,684,535 | 32% |
| MLP 4-9-1 | 0.992292 | 0.933468 | 0.999945 | 0.00 | 1,285,083 | 6,436,301 | 28% |
| MLP 4-8-1 | 0.992292 | 0.969944 | 0.998589 | 0.00 | 2,112,949 | 9,731,973 | 33% |
| MLP 4-9-1 | 0.992292 | 0.943643 | 0.999955 | 0.00 | 1,567,571 | 7,404,531 | 29% |
The evaluation of the weights in the network connections allows us to judge the high strength of the synaptic connection of the variable DFA(mining), which characterizes the degree of depreciation of fixed assets at the enterprises of the industry, with the hidden neuron #5 (w (DFA(mining); h5) = 4.20); the hidden neuron #3 has a high positive effect on the output variable, as evidenced by indicates w (h3; Ymining) = 1.21.
Based on the constructed neural network model, four different scenarios were calculated (Table 8):
Table 8.
Scenarios of changes in the efficiency of industrial systems in the mining sector of the economy.
- Scenario 1: continuation of the increase in all four variables (by 1%);
- scenario 2: reduction in the degree of depreciation of fixed assets in the industry (DFA(mining)) by 1% as a result of the modernization of industrial systems) and an increase in the other three indicators by 1%;
- scenario 3: reduction of DFA(mining) by 1% and growth of the other three indicators by 5%;
- scenario 4: reduction DFA(mining) by 5% (investing in the renovation of fixed assets) and an increase in the other three indicators by 1%.
According to these scenarios, the efficiency of macro-industrial systems in the field of mining is at the point of bifurcation, the way out of which will be a choice between further increasing economic efficiency to the detriment of the state of fixed assets (which are the core of the production system) and investing in modernization with an economic return only in the future. As noted above, this revealed a high relationship between Y and DFA. Our hypothesis that the redistribution of income and investment in favor of the modernization of fixed assets will restrain the increase in the efficiency of the industrial system is confirmed (the value of Ymining (predicted) will be only 10 320.2 billion rubles). If economic agents concentrate the financial flow on the purchase of new machinery, equipment, and transport, it will provide a decrease in the added value relative to the level of 2021.
- 2.
- In the field of manufacturing industries, the lowest value of absolute error MAPE by the network of architecture MLP 4-3-1 is shown (Table 9). The error of 6.9% can be considered satisfactory, and this neural network is applicable in the quality of scenario forecasting of the industrial system. The highest strength of the synaptic connection is also demonstrated by the predictor DFA(manuf.) in connection with the hidden neuron #3 (connection weight is 0.46); in the output—hidden neuron #1 (connection weight is 0.77).
Table 9. Alternative multivariate models for forecasting the gross value added of Ymanufacturing.
- 3.
- The development of the four scenarios outlined above regarding manufacturing allows us to judge in all cases, a significant increase in the gross value added in the industry compared to 2021 (Table 10).
Table 10. Scenarios of changes in the efficiency of industrial systems in manufacturing industries.
A summary of the results of forecasting the efficiency of macro-industrial systems, as well as the priority areas of development that require special attention, is presented in the form of a scheme (Figure 7). The univariate (1 attribute on the input) and multivariate (4 attributes on the input) variant models are reflected.
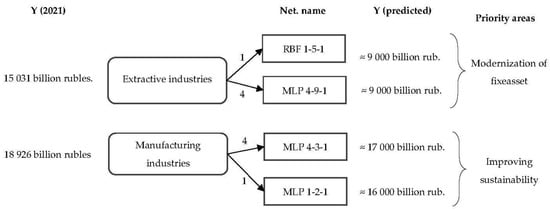
Figure 7.
A predictive model for improving the efficiency of macro-industrial systems and priority areas for their development.
Thus, a more predictable trend of changes in the efficiency of industrial systems is observed in the sphere of manufacturing industries. This is due to a more uniform rate of change Yi (Figure 3). Prediction of the efficiency of extractive innovative industrial systems is complicated by the deterioration of the indicator of gross value added in 2020. This «outlier» in the dynamic series affected the quality of neural networks. Further monitoring of the dynamics of the criteria variables and predictors will allow for adjusting the neural network and improving the quality of the predictive model.
3.3. Predicting the Efficiency of the Microindustrial System
Prediction of the efficiency of microindustrial systems is implemented on the example of a large Russian petrochemical enterprise «Nizhnekamskneftekhim». In this case, the input is four neurons (CA, FA, GP, PS), and the output is—2 (Rps и Rs). The learning quality of the neural network on average has increased, due to the increase in the series of dynamics to 52 periods (quarterly data on the activities of the company for 13 years, Figure 8).
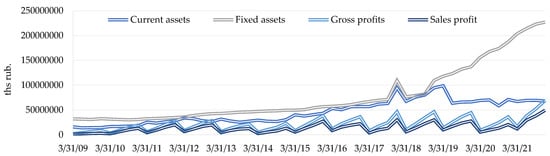
Figure 8.
Dynamics of change in input variables over 13 years (quarterly data presented).
The size of the subsamples is set in the following proportions: training—70%, test—15%, validation—15%. ANS option is also applied, 50 networks for training. We obtained five trained MLP networks (Table 11), the best quality of the test sample is observed for network #4 MLP 4-8-2, which is the most adequate and considered by us acceptable for prediction (the average absolute error of MAPE does not exceed 8%).
Table 11.
Alternative multivariate models for predicting the profitability of an enterprise.
The high quality of the trained neural networks is confirmed by the low scatter between the target and output values of the performance indicators, clearly demonstrated by the scatter diagrams (Figure 9).
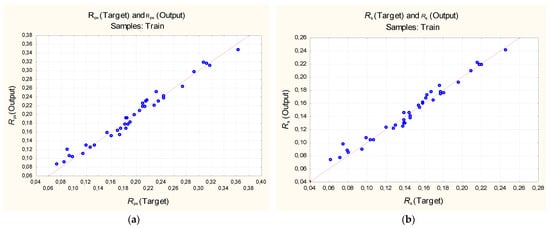
Figure 9.
Scatter plot of the training sample (exponential activation function): (a) Return on sales Rps; (b) Return on sales Rs.
Evaluation of the sensitivity of the neural network to the predictors allows us to conclude that the variables GP and PS are noisy because their sensitivity is many times lower than the predictors CA and FA (Table 12). However, their importance for the formation of performance indicators is unconditional, in connection with which we leave these signs in the DataSet.
Table 12.
Evaluation the sensitivity of neural networks to input variables.
We considered four scenarios of enterprise development based on the results of neural network modeling (Table 13), according to which different rates of one-time growth of indicators are provided:
Table 13.
Scenarios of changes in enterprise efficiency (exponential activation function).
- Scenario 1: 1% increase in input variables;
- Scenario 2: 5% increase in input variables;
- Scenario 3: 10% increase in input variables;
- Scenario 4: Reduce the value of input variables by 1%.
Of course, the trajectory of enterprise development is not limited to the considered scenarios. However, the calculations allow us to form a general idea about the patterns of change in the indicators of the effectiveness of the industrial system.
A distinctive feature of the enterprise is the inverse dependence of performance indicators on the size of fixed assets, current assets and profits. As we can see, fixed assets have a high value, which bears a significant contribution to the formation of the criterion variables. However, according to the identified patterns, the variable has little effect on efficiency indicators. The explanation may be idle production facilities or a high degree of depreciation of fixed assets at the enterprise.
Deductor Studio is used as an alternative neural network-training tool. In a similar neural network with eight neurons on a hidden layer, the activation function is sigmoid (Figure 10).
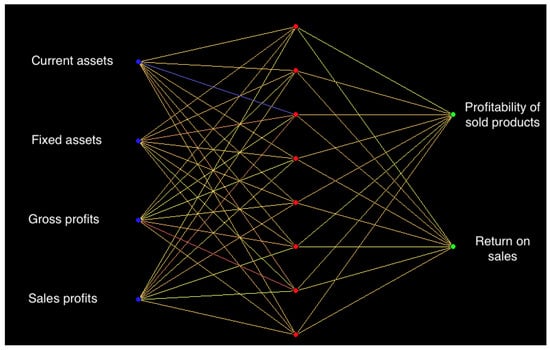
Figure 10.
Graph of a neural network with architecture 4-8-2, constructed in Deductor Studio (dependence of the performance indicators of the microindustrial system on the input variables DFA, VSG, VIG, RW).
The quality of the models was assessed by the scatter diagram (Figure 11) and the root mean square error, which was 0.86%.
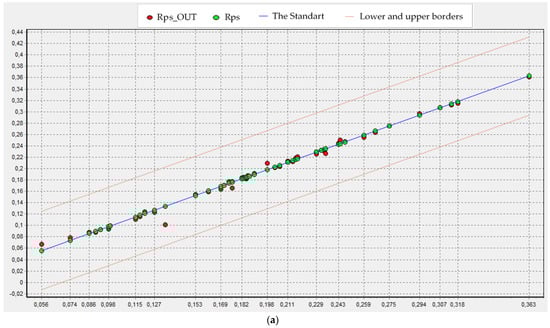
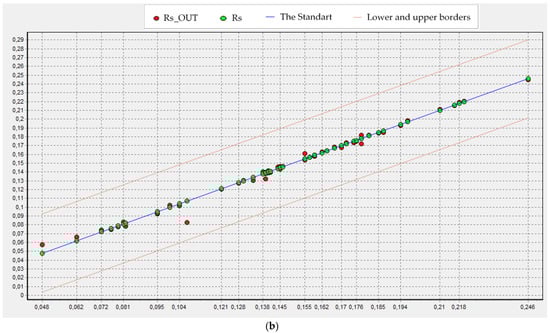
Figure 11.
Scatter plot the training sample (logistic activation function), Built in Deductor Studio: (a) Return on sales Rps; (b) Return on sales Rs.
Evaluation of the scenario forecasting of the enterprise activity confirms the previously identified vectors of change in the performance indicators of the industrial system. The trained neural network made it possible to identify the following values of the output variables:
- scenario 1 (1% increase in input variables): Rps = 26%, Rs = 18.9%;
- scenario 2 (5% increase in input variables): Rps = 25.7%, Rs = 18.7%;
- scenario 3 (10% increase in input variables): Rps = 25.5%, Rs = 18.7%;
- scenario 4 (1% reduction in the value of input variables): Rps = 28.5%, Rs = 20.3%.
Once again, the increase in performance indicators may be noticeable in the case of a decrease in the values of predictors.
Thus, the prediction results are significantly dependent on the DataSet. Despite the fact that multilayer neural networks self-select important features, it is advisable to perform correlation analysis beforehand, which will provide a higher probability of obtaining a high-quality predictive model.
4. Discussion
An analytical review of scientific approaches to performance management allows us to state the widespread use of artificial neural network tools to predict the behavior of complex systems. This work highlights numerous studies aimed at the study and development of neural network modeling methodology, where the object is mathematical tools, industries, enterprises, oil product volumes, GDP, CO2 emissions, technological parameters, etc. However, in the conditions of Russian industry’s transition to sustainable development, circular economy, as well as innovative development, a comprehensive assessment of the efficiency of industrial systems becomes important. Such an attempt in a study by Tuo et al. has been made [35] but is limited to the growth of production and GDP. Other studies are limited to either technological processes [41,42], the environmental performance of industrial systems [36], or electricity consumption forecasting [38], etc.
We have come to the conclusion that there is no one-size-fits-all, true methodology for the performance management of industrial systems, which expands the scope for incremental methodology. We continue to emphasize complex solutions, which allow for a comprehensive assessment of a particular system. The tasks set for production enterprises and complexes at the federal level affect the issues of innovative development, modernization, and recycling. This formed the basis of our research and contributed to the identification of patterns of development of industrial systems of different levels and obtaining a number of new scientific results. Thus, we develop the methodology of performance management the industrial systems based on modern data processing tools.
Neural networks of different types and architectures served as a key tool for the processing of a series of dynamics. The advantage of this tool in relation to others (e.g., regression analysis) is that the mechanism of multilayer artificial neural networks automatically selects the best architecture based on the predefined conditions—the given sample structure (training, control, test), choice of neural network type (MLP or RBF), number of neurons on the hidden layer and activation function. This tool allows to train different variants of networks based on the same set of input data and to select the best model in terms of quality.
Thus, this article formulates the following conclusions and results.
- The methodological solution for calculating the coefficient of development of an innovative industrial system (Kiisd), which develops the scientific groundwork in the field of efficiency management, is distinguished by its comprehensiveness and takes into account the most important components for today (the criteria of technical modernization, development, innovation activity, greening is taken into account). The basic principle of calculation of the indicator is universal and based on the results of correlation analysis. The combination of correlation, ranking and the determination of weighting coefficients makes our approach unique. The verification of the methodology confirms the correctness and adequacy of the real dynamics of the effectiveness of industrial systems.
- The patterns of development of industrial systems in Russia (extractive and manufacturing) are based on the implementation of two methods—trend extrapolation and neural network modeling (univariate and multivariate). The results of comparing the results of the two methods identify different trajectories of development of industrial systems: in the first case—unconditional growth of the efficiency indicator (gross value added), and in the second case—decline. These trends allow us to summarize the difficult predictability of the development of innovative industrial systems, as well as the finding of the Russian industry at the point of bifurcation. The way out of the bifurcation point can be a structural transformation of state support of industrial enterprises of development institutions.
- Prognostic neural network models, which allow for optimizing the contribution of attributes in the formation of target (set) values of performance indicators have been developed. The models are complemented by the definition of those priority directions of development of macro-industrial systems, which today are not given enough attention (according to the results of economic-mathematical modeling). Our conclusions and proposals will make it possible to align the growth trajectory of production systems.
- Based on the results of neural network training, scenarios for the development of the micro-industrial system were proposed, allowing the forming of an idea and the potential vector of development of the enterprise—the growth or decline in efficiency. The choice of the direction of development is conditioned by the necessity of rationalization of production capacities and further modernization of technical infrastructure.
- It is determined that the efficiency of industrial systems is determined by the volume of sales of goods, which is logical and natural. At the same time, innovative products and recycling of waste, which allow for saving resources, also make a significant contribution to the formation of gross value added.
The limitation of the proposed methodological complex is in the data set: a trained neural network will give better results with a larger data set. The wider the data set, the more cases the predictive model will consider.
Summarizing the study, we note that the constructed predictive models are non-linear in nature (the construction of the linear regression equation did not give a qualitative adequate model with significant regression coefficients). Neural networks allow us to overcome the complexity of such dependence, which is comparable to the opinion of other scientists [37,51]: multilayer networks with linear activation functions can be transformed into single-layer ones, which negatively affects network performance and prediction results.
Our findings and recommendations can be useful as a methodological basis for monitoring the effectiveness of industrial systems of different levels (for statistical services and public authorities) and can be included in strategies and programs for the development of industry in the country, and can be applied to the forecasting of activities based on the training of artificial neural networks.
5. Conclusions
This article presents the results of the study of innovative industrial systems, evaluated by their effectiveness at different levels of management (at micro- and macro levels), and using artificial neural networks developed predictive models that allow to identify the priority areas of development of the Russian economy, and align the growth trajectory of industrial systems. The significance of innovations and the ecologization of industrial systems was substantiated by a macroeconomic system. For the micro-economic system, the levers of efficiency have been identified, the management of which serves as the basis for the strategic development of the industrial system.
In future studies, the authors will test the performance of trained neural networks on new data sets for forecasting other industrial systems (macro- and micro-level). An interesting area of research could be the application of the Recurrent neural network (RNN) and Beetle antennae search in diagnosing the efficiency of economic systems.
Author Contributions
Conceptualization—A.I.S., methodology—F.F.G., formal analysis I.G.E., investigation A.I.S., I.G.E., data curation F.F.G., writing—original draft preparation A.I.S., F.F.G., writing—review and editing—A.I.S., I.G.E. All authors have read and agreed to the published version of the manuscript.
Funding
The research was carried out within the framework of the grant of the President of the Russian Federation for state support of leading scientific schools of the Russian Federation, project number NSh–1886.2022.2.
Data Availability Statement
Not applicable.
Conflicts of Interest
The authors declare no conflict of interest.
Appendix A. Symbol Table
| Unit Designation | Contents |
|---|---|
| Macroindustrial systems | |
| Ymining | the gross value added created in the mining sector |
| Ymanuf. | the gross value added created in the manufacturing sector |
| i | sector of industry (mining sector, manufacturing sector) |
| DFA(i) | degree of depreciation of fixed assets on the full range of organizations of the i-th sector of industry |
| VSG(i) | volume of shipped goods of own production, work and services performed by own forces in the i-th sector of industry |
| VIG(i) | volume of innovative goods, works, services in Russia |
| RW(i) | use and neutralization of production and consumption waste in the i-th sector of industry |
| Kiisd(mining) | the growth of innovation industrial system coefficient (mining sector) |
| Kiisd(manufacturing) | the growth of innovation industrial system coefficient (manufacturing sector) |
| Microindustrial system | |
| Rps | profitability of sold products |
| Rs | return on sales |
| CA | current assets |
| FA | fixed assets |
| GP | gross profit |
| PS | profit from sales |
References
- Federal State Statistics Service. Available online: http://www.gks.ru (accessed on 2 November 2022).
- Barsegyan, N.V.; Salimyanova, I.G.; Kushaeva, E.R. Typology of innovation strategies for petrochemical enterprises. J. Phys. Conf. Ser. 2020, 1515, 042090. [Google Scholar] [CrossRef]
- Garina, E.P.; Kuznetsov, V.P.; Romanovskaya, E.V.; Kuznetsova, S.N.; Kornilov, D.A. Formation of the Production System Elements in the Enterprise of the Industry Through the Integration of Production Systems and Product Creation Systems. Lect. Notes Netw. Syst. 2020, 73, 441–451. [Google Scholar] [CrossRef]
- Malysheva, T.V.; Shinkevich, A.I.; Kharisova, G.M.; Nuretdinova, Y.V.; Khasyanov, O.R.; Nuretdinov, I.G.; Zaitseva, N.A.; Kudryavtseva, S.S. The Sustainable Development of Competitive Enterprises through the Implementation of Innovative Development Strategy. Int. J. Econ. Financ. Issues 2016, 6, 185–191. [Google Scholar]
- Kirillova, E.; Kakatunova, T.; Khalin, V. Methodology of Diagnostics and Selection of Industrial Enterprises Development Strategy in the Framework of Innovative Processes Joint Implementation. Lect. Notes Netw. Syst. 2022, 474, 53–64. [Google Scholar] [CrossRef]
- Monetti, F.M.; de Giorgio, A.; Maffei, A. Industrial transformation and assembly technology: Context and research trends. Procedia CIRP 2022, 107, 1427–1432. [Google Scholar] [CrossRef]
- Asheim, B.T.; Isaksen, A. Regional innovation systems: The integration of local ‘sticky’and global ‘ubiquitous’ knowledge. J. Technol. Tran. 2002, 27, 77–86. [Google Scholar] [CrossRef]
- Bergek, A.; Jacobsson, S.; Carlsson, B.; Lindmark, S.; Rickne, A. Analyzing the functional dynamics of technological innovation systems: A scheme of analysis. Res. Policy 2008, 37, 407–429. [Google Scholar] [CrossRef]
- Cooke, P.; Mikel, G.U.; Etxebarria, G. Regional innovation systems: Institutional and organisational dimensions. Res. Pol. 1997, 26, 475–491. [Google Scholar] [CrossRef]
- Li, D.; Liang, Z.; Tell, F.; Xue, L. Sectoral systems of innovation in the era of the fourth industrial revolution: An introduction to the special section. Ind. Corp. Chang. 2021, 30, 123–135. [Google Scholar] [CrossRef]
- Kashani, E.S.; Naeini, A.B.; Gholizadeh, H. Innovation systems and global value chains: A Co-citation analysis of established linkages and possible future trends. Int. J. Innov. Stud. 2023, 7, 68–86. [Google Scholar] [CrossRef]
- Khan, M.S. Absorptive capacities approaches for investigating national innovation systems in low and middle income countries. Int. J. Innov. Stud. 2022, 6, 183–195. [Google Scholar] [CrossRef]
- Palm, A. Innovation systems for technology diffusion: An analytical framework and two case studies. Technol. Forecast. Soc. Chang. 2022, 182, 121821. [Google Scholar] [CrossRef]
- Ortt, J.R.; Kamp, L.M. A technological innovation system framework to formulate niche introduction strategies for companies prior to large-scale diffusion. Technol. Forecast. Soc. Chang. 2022, 180, 121671. [Google Scholar] [CrossRef]
- Shinkevich, A.I.; Kudryavtseva, S.S.; Rajskaya, M.V.; Zimina, I.V.; Dyrdonova, A.N.; Misbakhova, C.A. Integral technique for analyzing of national innovation systems development. Espacios 2018, 39, 6. [Google Scholar]
- Cai, S.; Jiao, J.; Xiang, Q. Research on formation and development of circular industrial clusters and innovative networks. Energy Procedia 2011, 5, 1519–1524. [Google Scholar] [CrossRef][Green Version]
- Dli, M.; Zaenchkovski, A.; Tukaev, D.; Kakatunova, T. Optimization algorithms of the industrial clusters’ innovative development programs. Int. J. Appl. Eng. Res. 2017, 12, 3455–3460. [Google Scholar]
- Yashin, S.N.; Trifonov, Y.V.; Koshelev, E.V.; Garina, E.P.; Andryashina, N.S. Formation of a Linear Functional of Cluster Value for the Innovative Development of a Region. Adv. Sci. Technol. Innov. 2022, 341–346. [Google Scholar] [CrossRef]
- Blazquez, D.; Domenech, J.; Garcia-Alvarez-Coque, J.-M. Assessing Technology Platforms for Sustainability with Web Data Mining Techniques. Sustainability 2018, 10, 4497. [Google Scholar] [CrossRef]
- Dezhina, I.G. Technology platforms in Russia: A catalyst for connecting government, science, and business? Triple Helix 2014, 1, 6. [Google Scholar] [CrossRef]
- Lin, F.-J.; Lin, Y.-H. The determinants of successful R&D consortia: Government strategy for the servitization of manufacturing. Serv. Bus. 2012, 6, 489–502. [Google Scholar] [CrossRef]
- Oliver, A.L. Holistic ecosystems for enhancing innovative collaborations in university–industry consortia. J. Technol. Transf. 2022, 47, 1612–1628. [Google Scholar] [CrossRef]
- Shinkevich, A.I.; Ershova, I.G.; Galimulina, F.F.; Yarlychenko, A.A. Innovative Mesosystems Algorithm for Sustainable Development Priority Areas Identification in Industry Based on Decision Trees Construction. Mathematics 2021, 9, 3055. [Google Scholar] [CrossRef]
- Hansen, L.K.; Salamon, P. Neural Network Ensembles. IEEE Trans. Pattern Anal. Mach. Intell. 1990, 12, 993–1001. [Google Scholar] [CrossRef]
- Cheng, B.; Titterington, D.M. Neural networks: A review from a statistical perspective. Stat. Sci. 1994, 9, 2–30. [Google Scholar] [CrossRef]
- Yao, X. Evolving artificial neural networks. Proc. IEEE 1999, 87, 1423–1447. [Google Scholar]
- Dhillon, A.; Verma, G.K. Convolutional neural network: A review of models, methodologies and applications to object detection. Prog. Artif. Intell. 2020, 9, 85–112. [Google Scholar] [CrossRef]
- Zhou, J.; Cui, G.; Hu, S.; Zhang, Z.; Yang, C.; Liu, Z.; Wang, L.; Li, C.; Sun, M. Graph neural networks: A review of methods and applications. AI Open 2020, 1, 57–81. [Google Scholar] [CrossRef]
- Ge, K.; Zhao, J.-Q.; Zhao, Y.-Y. GR-GNN: Gated Recursion-Based Graph Neural Network Algorithm. Mathematics 2022, 10, 1171. [Google Scholar] [CrossRef]
- Guo, M.; Manzoni, A.; Amendt, M.; Conti, P.; Hesthaven, J.S. Multi-fidelity regression using artificial neural networks: Efficient approximation of parameter-dependent output quantities. Comput. Methods Appl. Mech. Eng. 2022, 389, 114378. [Google Scholar] [CrossRef]
- Linka, K.; Schäfer, A.; Meng, X.; Zou, Z.; Karniadakis, G.E.; Kuhl, E. Bayesian Physics Informed Neural Networks for real-world nonlinear dynamical systems. Comput. Methods Appl. Mech. Eng. 2022, 115346. [Google Scholar] [CrossRef]
- Mayet, A.M.; Nurgalieva, K.S.; Al-Qahtani, A.A.; Narozhnyy, I.M.; Alhashim, H.H.; Nazemi, E.; Indrupskiy, I.M. Proposing a High-Precision Petroleum Pipeline Monitoring System for Identifying the Type and Amount of Oil Products Using Extraction of Frequency Characteristics and a MLP Neural Network. Mathematics 2022, 10, 2916. [Google Scholar] [CrossRef]
- Wong, W.C.; Chee, E.; Li, J.; Wang, X. Recurrent Neural Network-Based Model Predictive Control for Continuous Pharmaceutical Manufacturing. Mathematics 2018, 6, 242. [Google Scholar] [CrossRef]
- Longo, L.; Riccaboni, M.; Rungi, A. A neural network ensemble approach for GDP forecasting. J. Econ. Dyn. Control 2022, 134, 104278. [Google Scholar] [CrossRef]
- Tuo, S.; Chen, T.; He, H.; Feng, Z.; Zhu, Y.; Liu, F.; Li, C. A Regional Industrial Economic Forecasting Model Based on a Deep Convolutional Neural Network and Big Data. Sustainability 2021, 13, 12789. [Google Scholar] [CrossRef]
- Zhao, W.; Niu, D. Prediction of CO2 Emission in China’s Power Generation Industry with Gauss Optimized Cuckoo Search Algorithm and Wavelet Neural Network Based on STIRPAT model with Ridge Regression. Sustainability 2017, 9, 2377. [Google Scholar] [CrossRef]
- Adesanya, A.; Abdulkareem, A.; Adesina, L.M. Predicting extrusion process parameters in Nigeria cable manufacturing industry using artificial neural network. Heliyon 2020, 6, e04289. [Google Scholar] [CrossRef]
- Leite Coelho da Silva, F.; da Costa, K.; Canas Rodrigues, P.; Salas, R.; López-Gonzales, J.L. Statistical and Artificial Neural Networks Models for Electricity Consumption Forecasting in the Brazilian Industrial Sector. Energies 2022, 15, 588. [Google Scholar] [CrossRef]
- Shinkevich, A.I.; Malysheva, T.V.; Vertakova, Y.V.; Plotnikov, V.A. Optimization of Energy Consumption in Chemical Production Based on Descriptive Analytics and Neural Network Modeling. Mathematics 2021, 9, 322. [Google Scholar] [CrossRef]
- Ramos, D.; Faria, P.; Vale, Z.; Mourinho, J.; Correia, R. Industrial Facility Electricity Consumption Forecast Using Artificial Neural Networks and Incremental Learning. Energies 2020, 13, 4774. [Google Scholar] [CrossRef]
- Seawram, S.; Nimmanterdwong, P.; Sema, T.; Piemjaiswang, R.; Chalermsinsuwan, B. Specific heat capacity prediction of hybrid nanofluid using artificial neural network and its heat transfer application. Energy Rep. 2022, 8, 8–15. [Google Scholar] [CrossRef]
- Dli, M.; Puchkov, A.; Kakatunova, T. Assessment of the technological process condition based on the assembly of deep recurrent neural networks. Lect. Notes Comput. Sci. 2020, 12412, 393–402. [Google Scholar] [CrossRef]
- Du, W. Research on Evaluation of Enterprise Performance Based on BP Neural Network Improved by Levenberg-Marquardt Algorithm. In Proceedings of the 2015 International Conference on Automation, Mechanical Control and Computational Engineering (AMCCE 2015), Changsha, China, 24–25 October 2015; pp. 167–171. [Google Scholar] [CrossRef]
- Wenjing, C. BP Neural Network-Based Evaluation Method for Enterprise Comprehensive Performance. Math. Probl. Eng. 2022, 2022, 7308235. [Google Scholar] [CrossRef]
- Luo, Y.; Ren, D. Influence of the enterprise’s intelligent performance evaluation model using neural network and genetic algorithm on the performance compensation of the merger and acquisition parties in the commitment period. PLoS ONE 2021, 16, e0248727. [Google Scholar] [CrossRef] [PubMed]
- HSE University. Available online: https://www.hse.ru (accessed on 2 November 2022).
- Arunapriya, B.; Kavitha Devi, D. Image compression using single layer linear neural networks. Procedia Comput. Sci. 2010, 2, 345–352. [Google Scholar] [CrossRef]
- Dudnikov, E.E.; Rubashov, M.V. Single-layer neural networks with various feedbacks. Neural Parallel Sci. Comput. 2001, 9, 29–48. [Google Scholar]
- Rosenblatt, F. The perceptron: A probabilistic model for information storage and organization in the brain. Psychol. Rev. 1958, 65, 386–408. [Google Scholar] [CrossRef]
- Sazli, M.H. A brief review of feed-forward neural networks. Commun. Fac. Sci. Univ. Ank. Series A2-A3 Phys. Sci. Eng. 2006, 50, 11–17. [Google Scholar] [CrossRef]
- Shokraneh, F.; Geoffroy-Gagnon, S.; Nezami, M.S.; Liboiron-Ladouceur, O. A Single Layer Neural Network Implemented by a 4×4 MZI-Based Optical Processor. IEEE Photonics J. 2019, 11, 8894848. [Google Scholar] [CrossRef]
- Abbas, O.M. Neural Networks in Business Forecasting. Int. J. Comput. (IJC) 2015, 19, 114–128. [Google Scholar]
- Chaudhary, A.; Sharma, M. Multilayer Neural Network Design for the Calculation of Risk Factor Associated with COVID-19. Augment. Hum. Res. 2021, 6, 6. [Google Scholar] [CrossRef]
- Covantes-Osuna, C.; López, J.B.; Paredes, O.; Vélez-Pérez, H.; Romo-Vázquez, R. Multilayer Network Approach in EEG Motor Imagery with an Adaptive Threshold. Sensors 2021, 21, 8305. [Google Scholar] [CrossRef] [PubMed]
- Smetanin, Y.G. Neural networks as systems for recognizing patterns. J. Math. Sci. 1998, 89, 1406–1457. [Google Scholar] [CrossRef]
- Hagg, A.; Mensing, M.; Asteroth, A. Evolving parsimonious networks by mixing activation functions. In Proceedings of the GECCO’17: Genetic and Evolutionary Computation Conference, Berlin, Germany, 15–19 July 2017; pp. 425–432. [Google Scholar] [CrossRef]


Disclaimer/Publisher’s Note: The statements, opinions and data contained in all publications are solely those of the individual author(s) and contributor(s) and not of MDPI and/or the editor(s). MDPI and/or the editor(s) disclaim responsibility for any injury to people or property resulting from any ideas, methods, instructions or products referred to in the content. |
© 2022 by the authors. Licensee MDPI, Basel, Switzerland. This article is an open access article distributed under the terms and conditions of the Creative Commons Attribution (CC BY) license (https://creativecommons.org/licenses/by/4.0/).