Article

Determinants of Tax Ethics in Society: Statistical and Logistic Regression Approach

Department of Macro and Microeconomics, Faculty of Management Science and Informatics, University of Zilina, 010 26 Zilina, Slovakia
*
Author to whom correspondence should be addressed.
Mathematics 2023, 11(10), 2341; https://doi.org/10.3390/math11102341
Submission received: 15 March 2023 / Revised: 5 May 2023 / Accepted: 8 May 2023 / Published: 17 May 2023

Abstract

:
The paper focuses on analysing the current tax behaviour of Slovak citizens and their inclination to tax evasion. Inclination to tax evasion is defined in this research based on respondents’ answers to questions focused on their tax morale. The data processed in this research was obtained from a questionnaire survey on a sample of 1067 respondents. Intentional sampling was used to ensure the same structure of respondents. In terms of tax evasion acceptance, we identified three groups of people: honest, dishonest, and unconscious. The research confirmed that 78% of the population is prone to tax evasion, and only 22% have never evaded paying taxes and would not do so knowingly or unconsciously. By applying the statistical hypothesis testing, we also found out that except for sex (women are less prone to tax evasion), inclination to tax evasion also depends on education, age, main source of income and experience. Finally, three types of logistic regression models to predict the inclination of a specific tax behaviour were constructed and evaluated based on the total accuracy metric and validated on the ex-post set.
MSC:
M62-04; M62-11; M62D05; M62-P25; M62-J12

1. Introduction

One of the ongoing goals of governments in many countries is to achieve the highest possible tax collection efficiency (achieving potential tax revenue), i.e., reducing the size of the tax gap. According to the European Commission [1], the tax gap represents the difference between the potential tax collection received when all economic entities behave by the law. In case tax entities act illegally and intend to minimise or eliminate tax liability [2,3], which means they participate in tax evasion, then they contribute to the widening of the tax gap [4]. In addition to reducing tax revenues, i.e., government revenues and subsequent problems related to underfunding key services in a country, tax avoidance also brings several other problems. Tax evasion creates differences in treating people with the same contribution capacity, reducing social capital and cohesion [5]. It also raises questions related to public trust and unfair competition. Tax efficiency and related tax avoidance are complex problems affecting several stakeholders, and the elimination of tax evasion can contribute to the well-being of individuals and the whole society.
As in other countries, the efficiency of tax collection in Slovakia and the level of tax evasion is closely related to the structure and functionality of its tax system. In 2017, the Slovak Republic ranked 24th among EU member states in VAT collection [6]. Since the collection of VAT is an essential component of the overall collection of taxes, it can be stated that collecting taxes in Slovakia is inefficient. The basic premise is that the improvement of the tax system could be obtained by influencing tax ethics. Therefore, the main research question of our research was as follows: RQ: What are the tax ethics in Slovakia?
For that reason, this paper provides an answer to this research question by focusing on identifying the inclination of the Slovak population to tax evasion. In addition, inferential statistics is used to find whether factors such as sex, age, education, the main income source, and experiences with taxes influence this inclination. There are quite a lot of studies focused on tax evasion, but they mostly focus on whether respondents consider tax evasion to be justifiable [7,8,9,10] or whether they would cheat on taxes if they had such an opportunity [11].
In our research, the inclination to tax evasion is defined based on questions related to committing tax fraud, and an explicit and implicit inclination to tax evasion. We consider the level of tax knowledge and the associated possible lack of awareness of one’s behaviour as an important element in the differentiation of types of inclination to tax evasion and change of tax morale.
The paper is structured as follows: Section 1.1 presents literature on tax ethics and tax evasion with emphasis on current ways of identifying tax evasion in research and factors influencing inclination to tax evasion. Section 2 describes the data collection, sample description, and applied data modelling methods. Section 3 provides descriptive analysis, outcomes of statistical hypotheses testing and logistic regression models for the inclination of the Slovak citizens to tax evasion. In Section 4, the main results are presented. In addition, our results are discussed with other research. Finally, Section 5 summarises the study’s outcomes and provides its limitations and recommendations for future research.

1.1. Literature Review

Tax morale represents an internal motivation of people to pay state fees [12] and a sense of guilt or shame resulting from non-compliance [13,14]. Tax morale and tax evasion are associated, which means that low tax morale results in higher tax evasion or its acceptance and vice versa [15].
Several studies are devoted to the topic of tax morality and tax evasion. However, most of them focus on tax evasion acceptance or its justifiability. For example, Blesse’s [16] research focused on identifying the impact of problems related to taxes (uncertainty when filing tax returns) on the acceptance of tax evasion, while the acceptance of tax evasion was evaluated based on the question: “How justifiable do you think it is to evade taxes?”. In 2022, McGee et al. [10] studied attitudes toward tax evasion in Brazil, Russia, India and China based on answers to the World Value Survey (WVS) questions. They also used questions related to the justifiability of tax evasion.
There are also several more studies using this approach, e.g., Ciziceno and Pizzuto [8], Belmonte et al. [7], Cyan et al. [9] and McGee [11]. Even the use of questions we consider important from the WVS and their reliability was already discussed by Alm and Torgler [17], except for acceptance or justifiability of tax evasion, determining tax evasion based on taxpayers’ past and future behaviour, and also unconscious behaviour, which is determined by their tax knowledge as they could unknowingly participate in tax evasion.

1.2. Main Hypotheses

Based on the above, we defined following four main hypotheses of our research:
Hypothesis 1 (H1): 
A statistically significant percentage of people in the Slovak Republic has a tendency to commit a tax evasion.
Hypothesis 2 (H2): 
A statistically significant percentage of people in the Slovak Republic committed or attempted to commit tax evasion at least once in their life.
Hypothesis 3 (H3): 
A statistically significant percentage of people in the Slovak Republic, if they had the opportunity, would try to reduce the tax liability by violating laws.
Hypothesis 4 (H4): 
There is a statistically significant percentage of people in the Slovak Republic who conduct tax evasion unknowingly or subconsciously.
In addition to knowing tax morals, it is also important to know what determinants influence it. Tax morale is created by personal values, social norms, and attitudes towards public institutions [18] (Rodriguez-Justicia & Theilen, 2018). It is precisely the personal and social norms (personal values, religious beliefs, and acceptance of inequality) that create people’s approach to paying taxes. They are related to the individual’s satisfaction with life, which affects the individual’s internal motivation to pay taxes [19]. Within personal norms, attitudes to paying taxes can also be influenced by religion, positively affecting people’s tax ethics [20,21,22]. An important factor influencing tax morale is also the attitude toward public institutions. Research shows that citizens who have confidence in the government and legal system have better tax morale [23]. Conversely, distrust in these systems negatively affects the taxpaying behaviour and causes tax evasion acceptance [24,25]. In some countries, tax morale can also depend on the historical context. These are countries that experienced a transition from the planned to the market economy. This change was very slow in political institutions, which caused people’s dissatisfaction and a decline in tax morale [26]. In connection with political institutions, corruption needs to be mentioned as one of the most important factors influencing people’s behaviour concerning the payment of taxes. Tax evasion and corruption are closely linked [27]. High levels of corruption lead to higher tax evasion caused by corrupt officials, and also higher levels of tax evasion can lead to increased corruption [5]. The mistreatment of the collected tax is considered by people to be the strongest argument justifying tax evasion [24]. Increased confidence in the legal system, improving the fair tax system’s perception and changing the entrenched bad behavioural stereotypes via morally praiseworthy and economically justified actions, can result from the orientation on sustainability. The all-around challenge to produce, trade, consume, and deal with the economic [28,29], social [30,31] and environmentally responsible approach [32] has a significant impact on the choice of deviating and applying more appropriate models of behaviour by taxpayers. In the universal model for sustainability, many researchers investigated mutual connections of selected components [33,34,35].
There are several factors influencing tax morale and inclination to tax evasion but one of the essential factors are socio-demographic factors, such as gender, age, education, source of income, and country [11,17,21,36,37,38], which is also related to culture [7,39]. As we use a different approach for identifying tax morale and inclination to tax evasion, we also decided to analyse the influence of socio-demographic characteristics on the inclination to tax evasion.

2. Materials and Methods

We used several research methods in our research. The survey method was chosen because the population was very large. We chose a representative sample because it better reflected the structure of the population, and we assumed that the results would also better reflect the state of tax ethics in Slovakia. We applied statistical hypothesis testing in order to generalise the conclusions for the entire population that we defined.
Sorting methodology, which categorised respondents according to tax behaviour, was the cornerstone of our research. We decided to divide the population according to tax ethics into three groups instead of the standard two. We realised that when we better understand why individual people do not act in accordance with tax ethics, it will be possible to make corrections more effectively and reduce the tendency to tax fraud. It makes a big difference whether a person participates in tax evasion unconsciously or consciously. The advantages of the mentioned methodology are a more accurate analysis of the current state of tax ethics, which enables to propose better options for an effective solution to this problem. The disadvantages of the mentioned methodology are of a smaller degree in comparison with other research, i.e., the need to define the right questions for evaluating the implicit inclination to tax evasion and a higher level of complexity in order to perform such distribution of respondents.
We used the logistic regression method for predictive modelling. The mentioned method appeared to be a suitable choice, since it was a binary classification problem of predicting the dependent variable based on the independent variables. The advantages of the mentioned method is simple implementation, it is also less prone to overfitting and a certain degree of interpretability. On the contrary, the disadvantage is that the coefficients are more difficult to interpret in the context of the so-called odds. To sum up, stages of implementation of our study were as follows: (1) definition of the research question; (2) creation of a questionnaire; (3) calculation of sample size; (4) definition of quotas for representative sample; (5) data collection; (6) sorting respondents into three groups according to inclination to tax evasion; (7) descriptive analysis; (8) definition of hypotheses and statistical hypotheses testing; and (9) logistic regression modelling.
The implementation of respondents sorting, statistical hypothesis testing, and statistical modelling with logistic regression was implemented in the R programming language. The advantages of implementation in R are a high degree of flexibility, automation, and user support. On the other hand, the disadvantage is the steeper learning curve of this environment for beginners.

2.1. Sample

Sociological (empirical) research was performed using quantitative research methods to find out what the tax ethics in Slovakia are. The target research group consisted of the citizens of Slovakia, specifically the individuals with permanent residence in Slovakia with the lower age limit of minimum 18 years. We decided to conduct research only on residents over 18 years of age due to the reason that people aged less than 18 are not adults with their own law entity. In addition, younger people often have minimal experience with paying taxes and are not always responsible for their own actions. Due to the distortion of the results, we excluded this group from the defined population.
Our defined population, which was the subject of our research, had the size of 4,432,721 persons. However, it was subsequently corrected to a final number of 4,222,130 persons. This was done because of residents whose source of income was not in the state records.
The survey was conducted on a representative sample which represented the structure of the defined population. The statistics about the structure of the citizens in Slovakia were obtained from statistical sources from 2016 [40]. The sample size was then determined based on a calculation for the margin of error at a given confidence level. The parameters in the calculation were the size of the population, the confidence level, and the defined margin of error. Equation (1) was used, showing the confidence interval calculation for a given sample size, a given population proportion, a given confidence level, and a given margin of error:
C I = p ^ ± z × p ^ 1 p ^ n × N n N 1 ,
where
  • z is z-statistics,
  • p is the proportion in the population,
  • n is the sample size,
  • N is the size of the population, in this case: 4,222,130.
Equation (2) defines the relationship for calculating the sample size at the required confidence interval and the defined standard error. This sample calculation formula was based on Equation (1), i.e., from the basic formula for calculating the confidence interval for the final population:
n = p N p 2 N s . e . 2 × N 1 p 2 + p ,
where
  • p is the proportion in the population,
  • N is the size of the population,
  • s.e. is the standard error of the estimate, which was calculated as:
s . e . = m . e . z
where
  • m.e. is the margin of error, which was set to 3%, and z is the z-statistic, which is equal to 1.96 at the 95% confidence level.
A 95% confidence level and a 3% margin of error were set as parameters for calculating the sample size. With these parameters, a sample of at least 1067 respondents was needed for the results’ plausibility.

2.2. Structure of Respondents

An intentional sampling was chosen to create the structure of the respondents. In this type of sampling, the probability of individual elements becoming part of the sample depends on the calculated quotas. The sample was created based on the ratio of the frequency of occurrence of a specific group in the population. For calculations, the adjusted population size of 4,222,130 persons was used. The following socio-demographic characteristics were chosen to breakdown the sample:
  • sex: men, women,
  • completed education: elementary, secondary, university,
  • source of income: employee, self-employed person/entrepreneur, unemployed, pensioner, full-time student.
As the age distribution of the citizens of Slovakia according to other features in the statistics was not found, other sample structure was not included.
For entrepreneurs, both physical and legal entities were included. As there was no breakdown of legal entities by sex, the statistics of the distribution of physical persons, such as entrepreneurs, was used, which was obtained from the Slovak Business Agency portal [41]. The educational structure of the population was used to structure entrepreneurs according to education, while the stated numbers of entrepreneurs with elementary education were subsequently adjusted by expert estimation (it was assumed that the number of entrepreneurs with primary education would be lower than the number of people with primary education in the whole population). For the structure of the education of pensioners, statistics on the educational structure of employed pensioners in 2011 were used, as there were no official statistics on the educational structure of pensioners. Subsequently, these statistics were adjusted for the numbers of university and secondary school pensioners by expert estimation (it was assumed that the occupied pensioners have a higher percentage of pensioners with a university degree than in the entire population). The resulting relative quotas for the sample N = 1067 based on the structure of the population of the Slovak Republic are shown in Table 1.

2.3. Questionnaire

The data collection was conducted using a questionnaire survey. The questions focused on tax ethics and the attitudes of tax entities to the fulfilment of legal tax obligations, from which it was possible to deduce the degree of tolerance of the society to a conscious violation of tax legislation. These questions were structured into four areas:
  • information on the respondents, in relation to the characteristics of the quota sample.
  • questions focused on the respondents’ personal experience with tax situations and their tax knowledge.
  • respondents’ tax morale and their sense of the tax burden.
  • respondents’ willingness to improve their tax behaviour.

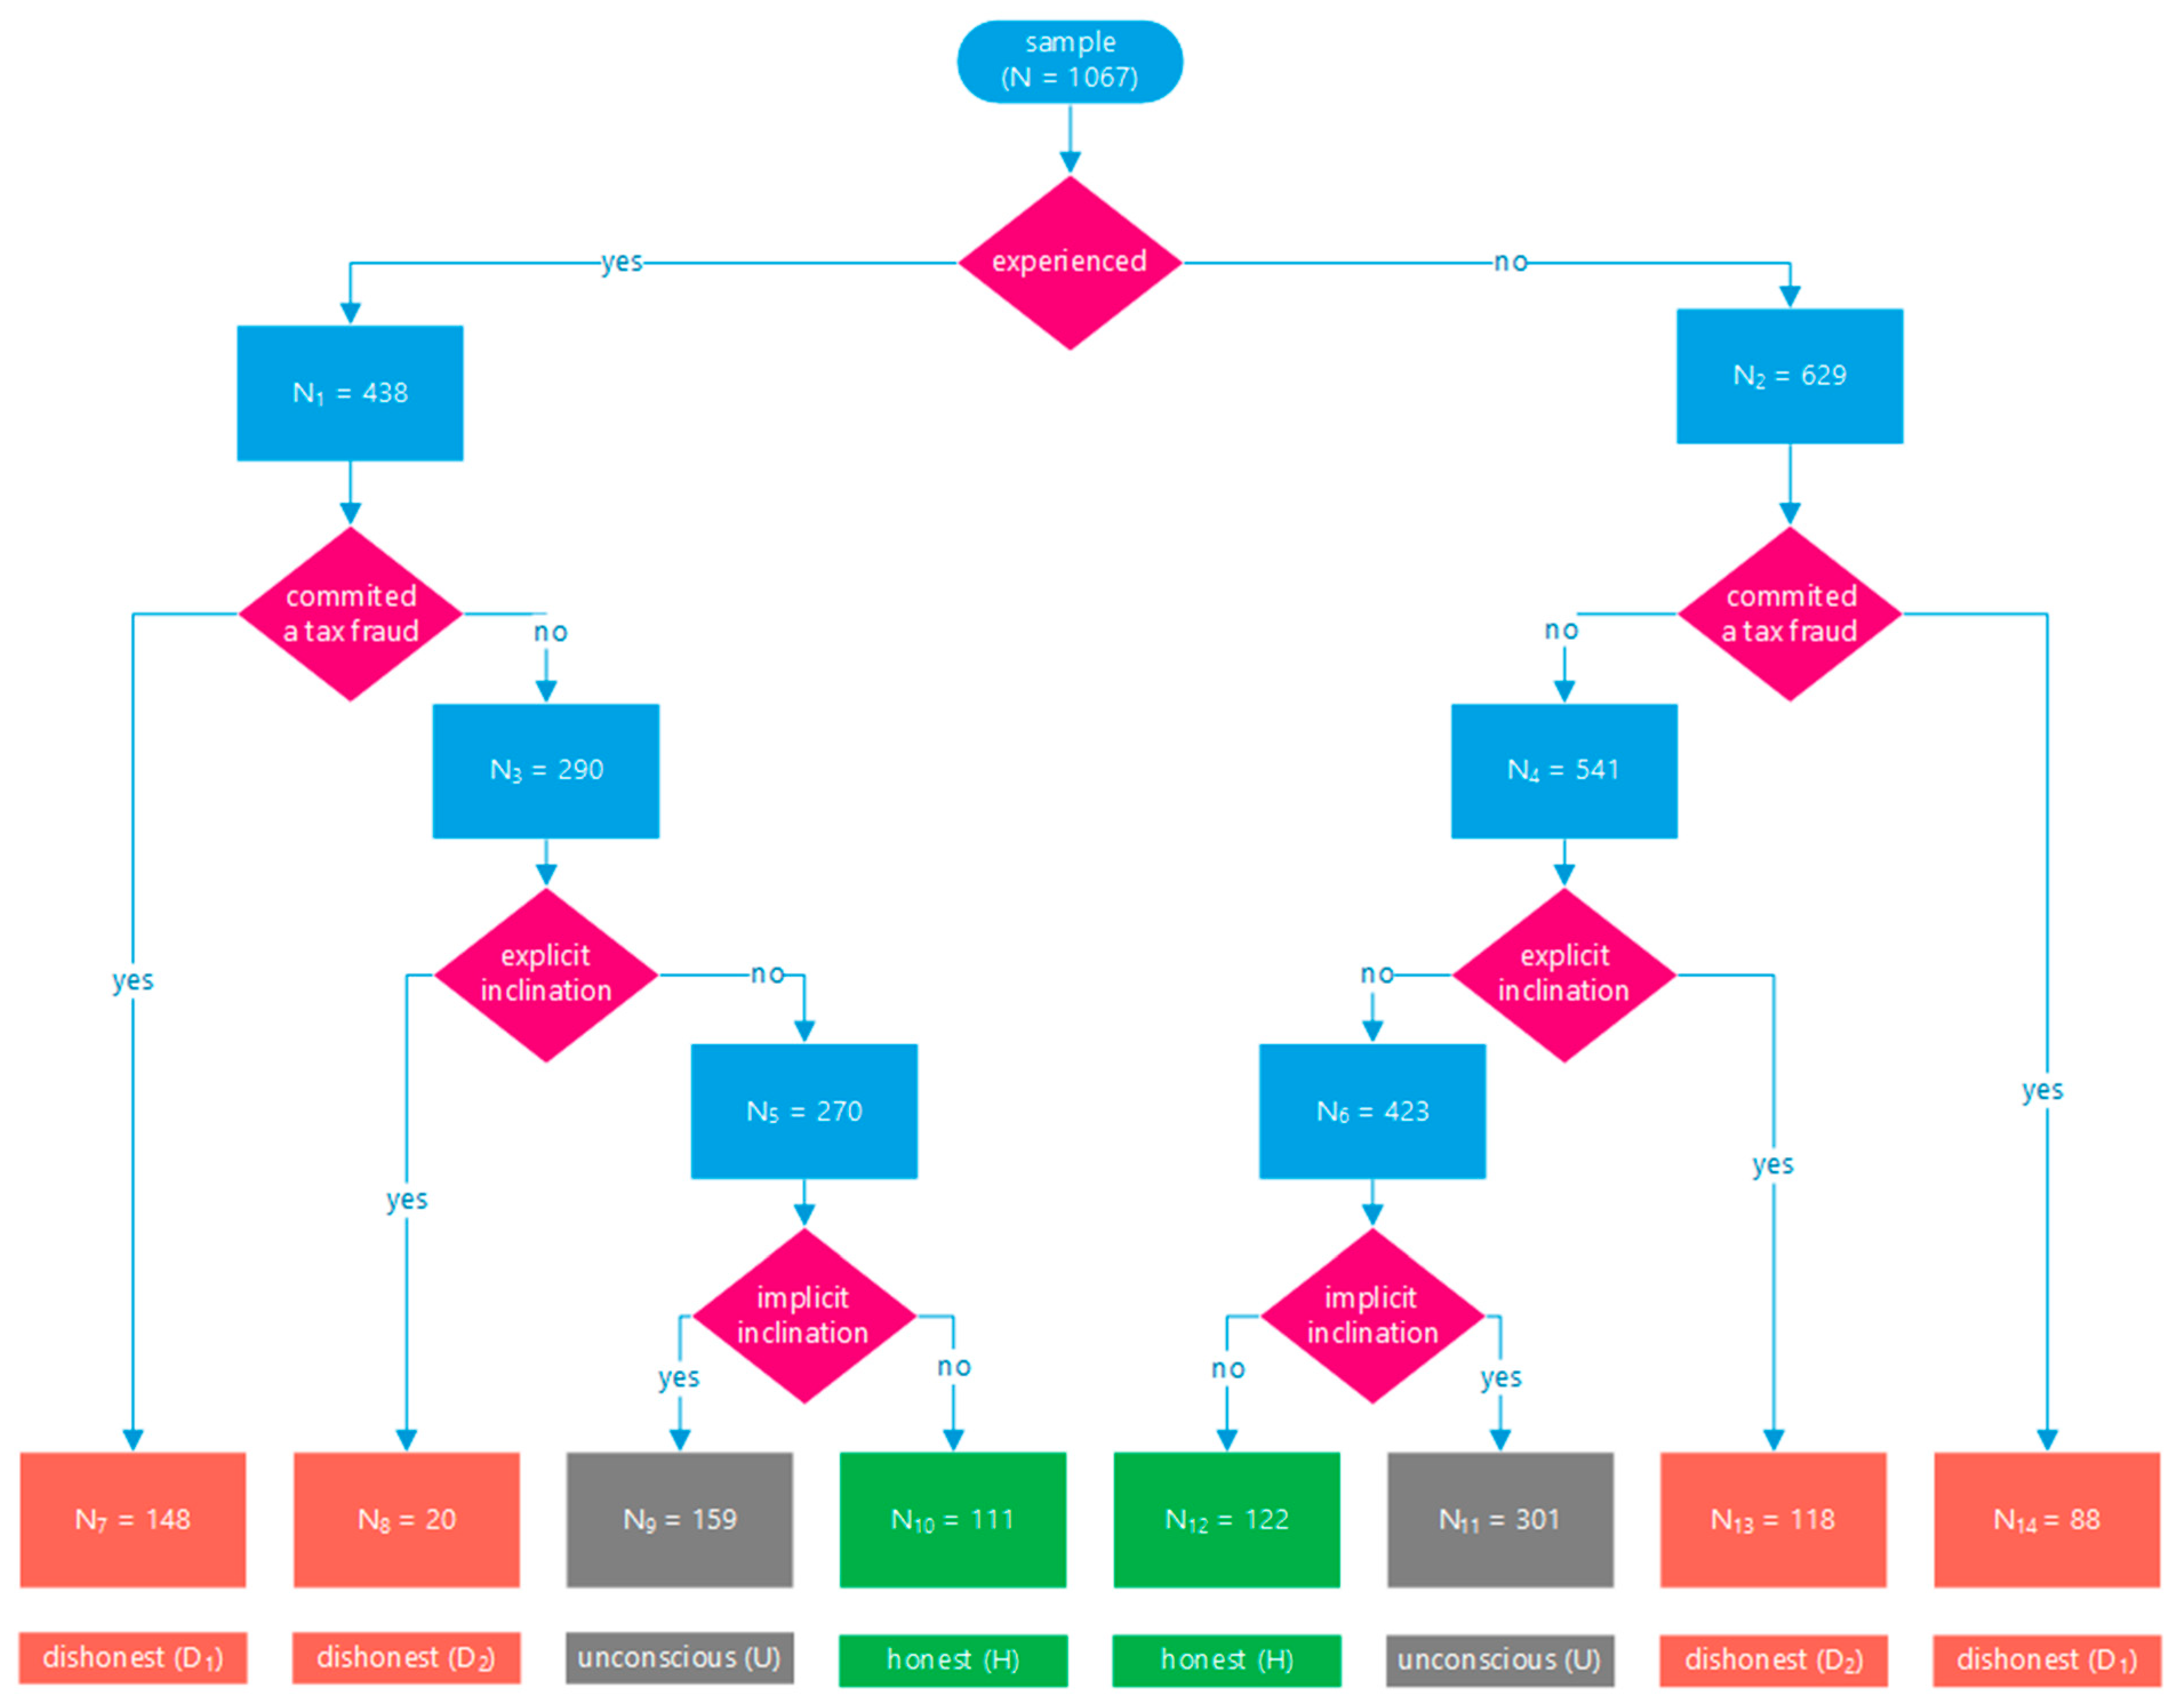
2.4. Sorting Methodology

The tendency of people in Slovakia to tax evasion was evaluated based on the questions that revealed the following information:
  • whether they had committed deliberate tax evasion or tax fraud at least once in their lives.
  • for respondents who did a tax liability calculation or tax return for themselves or another person, whether these persons tried to reduce the tax liability against the law.
  • for respondents who did not do any calculation of tax liability or tax return for themselves or any other person, if they had the opportunity, would they try to reduce the tax liability by violating the law?
  • unconscious behaviour of respondents in dealing with common situations that involve potential tax evasion.
For processing and evaluation of results, respondents were divided into groups according to four criteria: tax experience (Level 1 criterion), past tax evasion (Level 2 criterion), explicit inclination to future tax evasion (Level 3 criterion), and implicit inclination to future tax evasion (Level 4 criterion).
The first level divided the respondents according to the experience criterion (level 1) into two groups of people:
  • experienced, i.e., they have experience in resolving tax issues (they have done tax returns, participated in tax proceedings, tax audits, or do business).
  • inexperienced, i.e., they have no experience in dealing with tax issues.
The second level divided the respondents according to the level 2 criterion, i.e., execution of the tax fraud (tax evasion) in the past into two groups:
  • committed tax fraud, i.e., people who have done deliberate tax evasion.
  • did not commit tax fraud, i.e., people who have never done conscious tax evasion.
Afterwards, we applied a third level filter into our respondents. We divided respondents who did not commit any tax evasion consciously according to the explicit inclination to tax evasion in the future into the categories:
  • explicitly inclined—people who would do tax evasion if they had the opportunity,
  • explicitly not inclined—people who would not commit any tax evasion, even if they had the opportunity.
Finally, the fourth level criterion divided respondents who explicitly rejected any tax evasion according to their answers to implicit questions. We divided these respondents into two categories:
  • implicitly inclined—people with an implicit tendency to commit tax evasion. Respondents chose an answer in which there was any tax evasion.
  • implicitly not inclined—people with an implicit denial to commit any tax evasion. Respondents chose an answer to the question in which there was no tax evasion.
The graphic form of this sorting methodology is shown in Figure 1. As presented in the fourth criterion, this breakdown also captures respondents who did not want to commit tax evasion, thought they did not do so, but subconsciously acted against the tax law (i.e., implicit inclination to tax evasion).
Based on the structural analysis above, we finally categorised the respondents into three groups—dishonest (D) respondents, unconscious (U) respondents, and honest (H) respondents. In addition to those who have already committed deliberate tax evasion, those who answered positively to the explicit question (that they would do it if they had an opportunity) were also included in the group of dishonest people (D).
The respondents who have never committed conscious tax evasion and also answered the explicit question in a way that they would not commit it but chose the answer in which the tax evasion occurred implicitly, were included in the group of the unconscious (U). These were the people who did not want to commit tax evasion, but they would do it unconsciously.
Finally, the “honest” group (H) included respondents who have never consciously committed any tax evasion. In addition, they answered “no” to the explicit question (if they had the opportunity, they would not do it). Moreover, they also chose an answer with no tax evasion in the implicit question.
The results of the questionnaire were processed in the programming language R 4.2.1 (R Foundation for Statistical Computing, Vienna, Austria). To generalise the findings, inferential statistics was performed using chi-square tests [42], Fisher test [43] and binomial tests.

3. Results

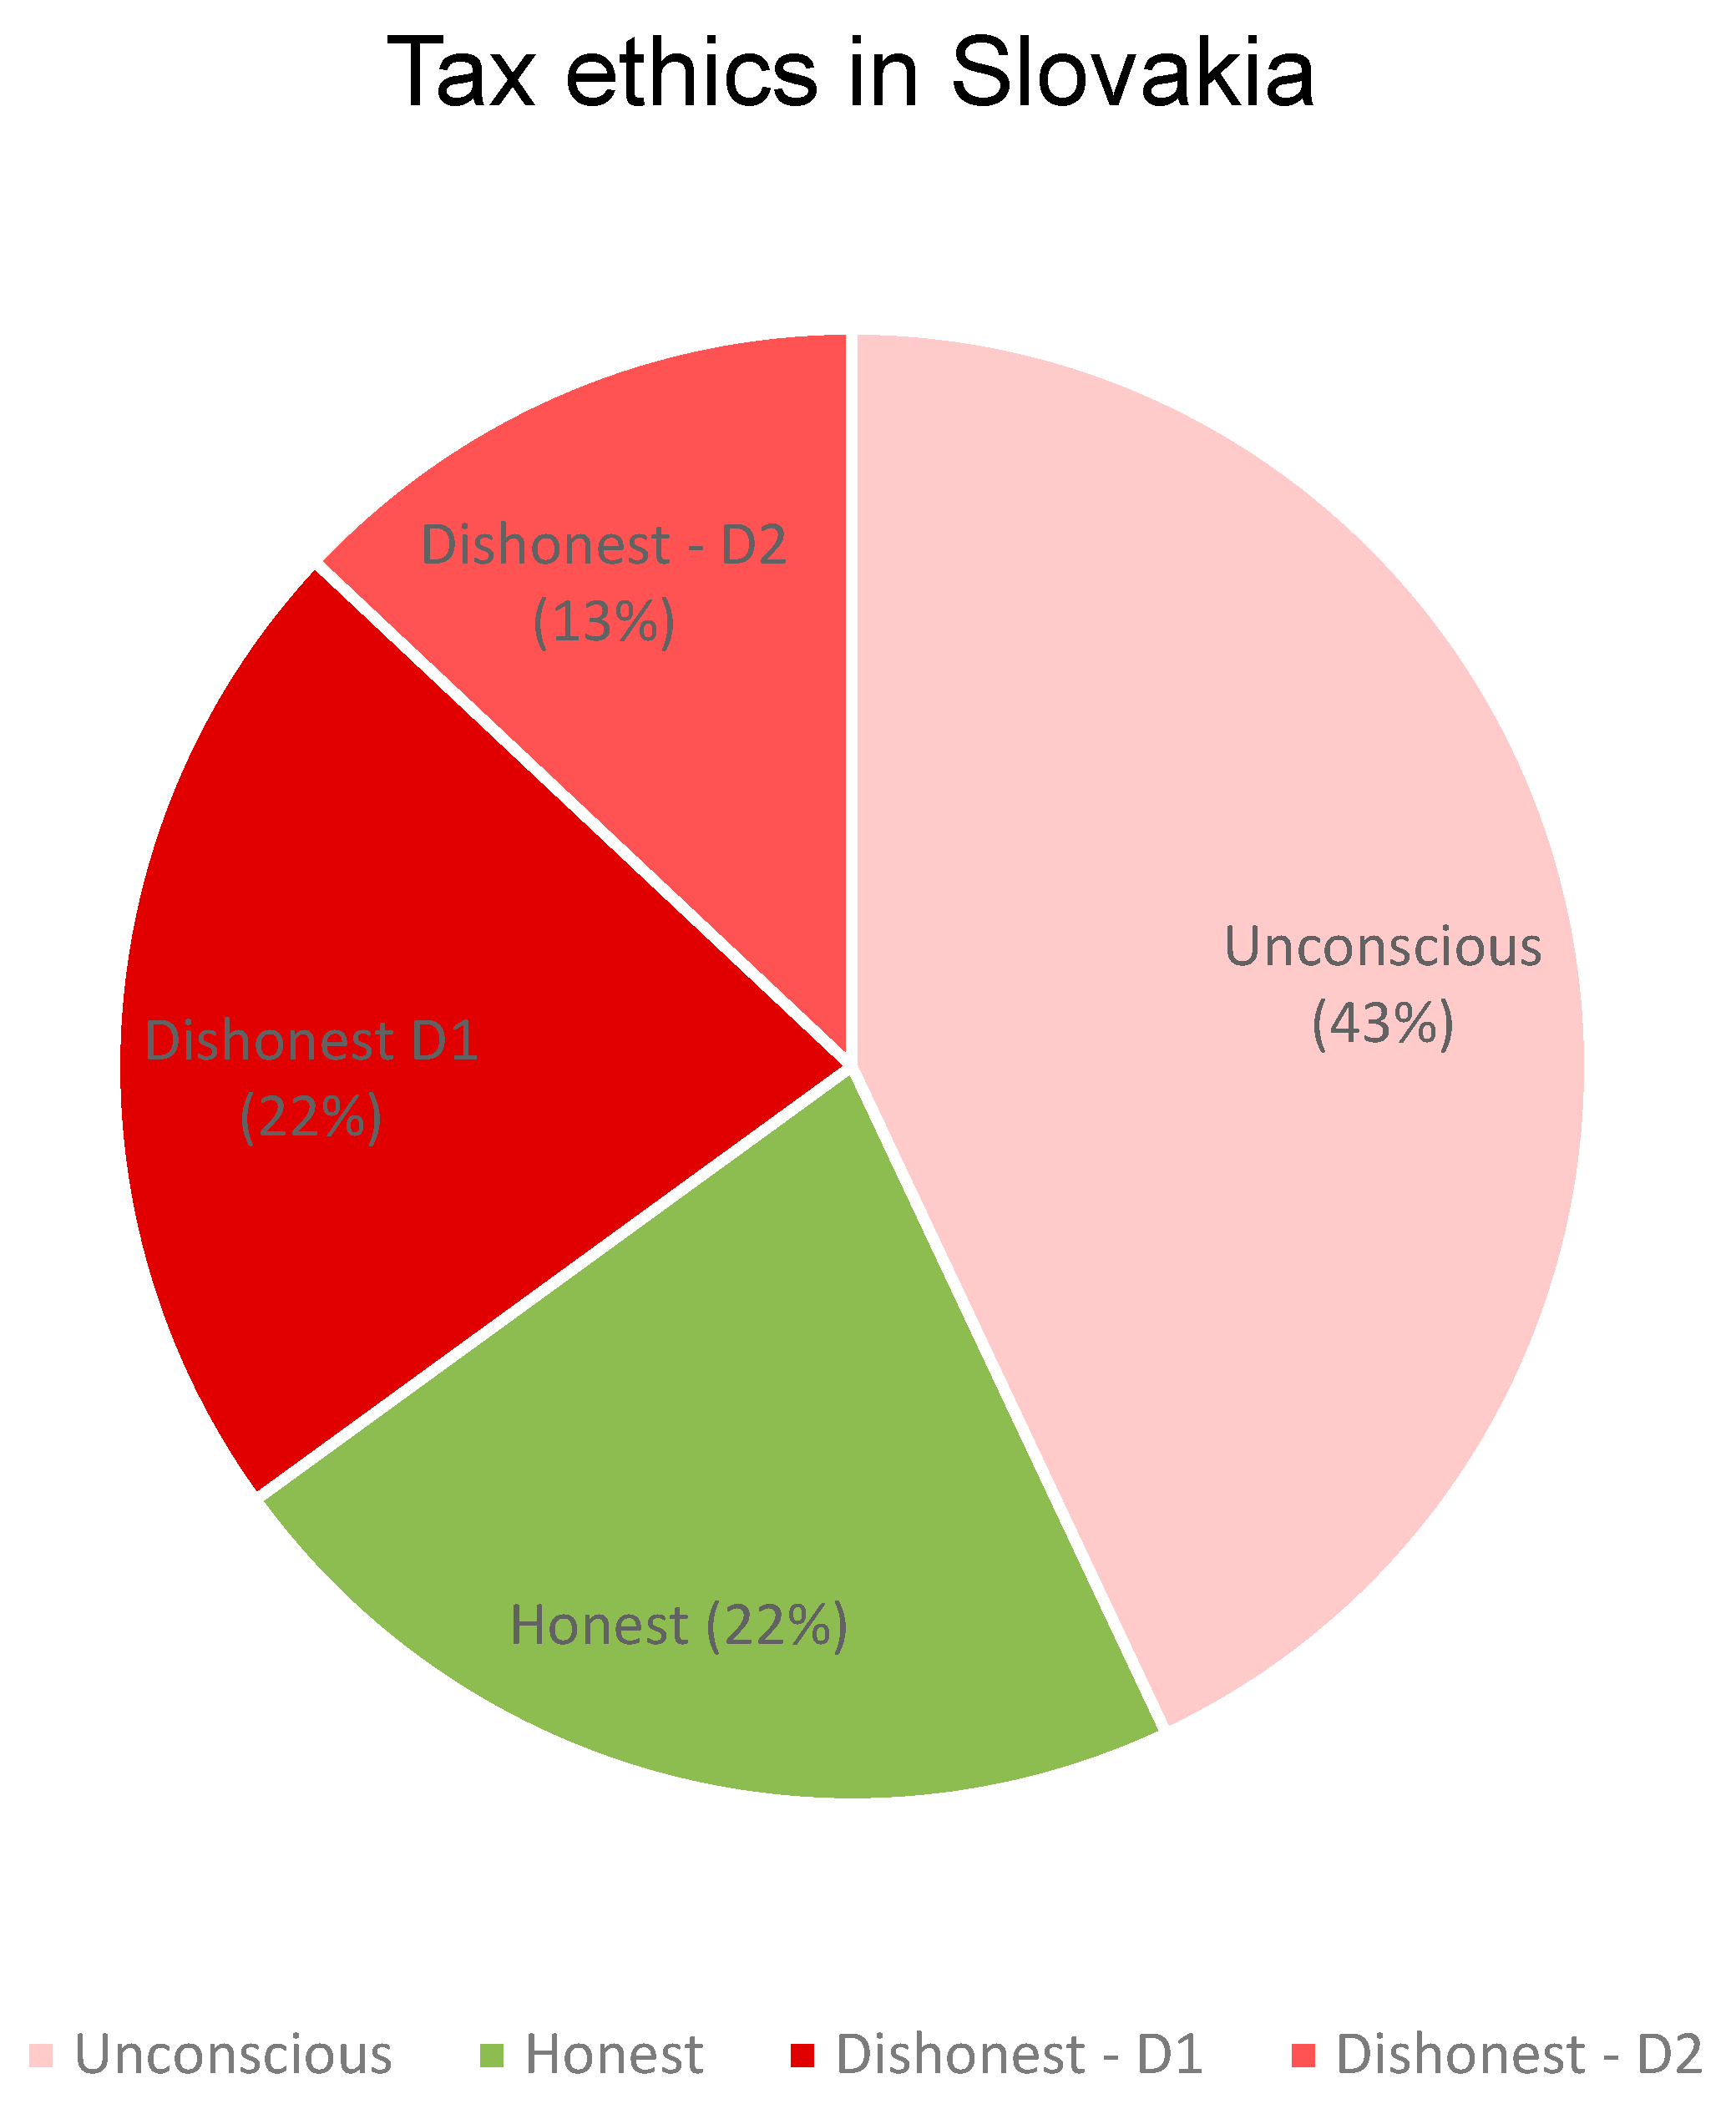
3.1. Descriptive Analysis

According to the established categorization defined Section 2, respondents were divided into three groups considering the level of tax evasion acceptance. Figure 2 shows the percentage of these groups in the sample. As can be seen, 22% of respondents (D1) have committed a conscious tax evasion at least once in their lives and they admitted to it in the survey. Because not everyone solves the tax dilemma or does not realise it, we were also interested in the opinion of those who have not yet solved it. We asked how they would behave if they had the opportunity to make a tax evasion, and we found that 13% of respondents would make a tax evasion if they had the opportunity to do so (D2). Altogether, 35% of respondents have done or are keen to do it in case they have opportunity. We named this group of the respondents as dishonest (D).
The remaining 65% of the sample, based on explicit questions, declared that they did not want to commit tax evasion. It consisted of those who had solved the tax problem in the past, had tax experience and had not made tax evasion, and those who had not solved the tax problem and claimed that if they had solved it, they would not have made tax evasion. However, society consists of individuals who have different levels of experience and knowledge of tax issues, and therefore their self-assessment may not correspond to reality. This assumption was confirmed by the answers to the questionnaire’s implicit questions, which divided respondents declaring they did not commit/want to commit tax evasion into two groups:
  • 43% of respondents chose an answer that would lead to tax evasion. If these respondents found themselves in a situation in which they had a chance to commit tax evasion, they would do it or participate in it. However, we assume that it would be unconscious tax evasion, primarily due to ignorance of tax law, without the intention of violating tax laws. These respondents also showed a tendency to tax evasion, although not aware. We labelled this part of the sample as unconscious (U).
  • 22% of respondents chose an answer, the implementation of which would not violate tax law. This part of the respondents did not have a conscious or unconscious tendency to tax evasion. We named this group as honest (H).
If we evaluate these partial results of the survey in terms of the question of the tax ethics of this sample, we conclude that up to 78% of respondents tend to commit tax evasion consciously or unconsciously.

3.2. Hypotheses Testing

3.2.1. Main Hypotheses

We performed statistical testing of four main hypotheses with a chi-square test [42] and Fisher test [43] and binomial test. Please note that the dishonest and unconscious groups were included in the H1 hypothesis. In the H2 hypothesis only the dishonest group was included
The results are provided in Table 2 and show that all four main hypotheses (H1–H4) were statistically confirmed (p-value < 0.001). Based on these results, we confirmed that a statistically significant percentage of people in the Slovak Republic have a tendency to commit tax evasion (H1). Results also showed that a statistically significant percentage of people in the Slovak Republic committed or attempted to commit tax evasion at least once in their life (H2). Results also showed that a statistically significant percentage of people would try to commit tax evasion if they had an opportunity (H3). In addition, we also confirmed the hypothesis H4 that a statistically significant percentage of people in the Slovak Republic conducted tax evasion unknowingly or subconsciously in the past.

3.2.2. Tax Ethics and Socio-Demographic Factors

In addition to the four main hypotheses, we also tested other hypotheses that emerged from our findings. We tested whether tax ethics depend on sex, education, age, main source of income and experience in addressing tax issues. The hypotheses were defined as follows:
  • E1: Tax ethics vary depending on sex.
  • E2: Tax ethics vary depending on education.
  • E3: Tax ethics vary with age.
  • E4: Tax ethics vary depending on the main source of income.
  • E5: The tax ethics of people experienced in tax issues differs from tax ethics of people who are considered inexperienced in this area.
The results are shown in Table 3. As can be seen, all hypotheses have been confirmed, i.e., the tax ethics depend on gender, education, age, source of income and tax experience.
Based on the above results, we also tested the following one-tailed hypotheses:
  • EC1: Women are generally less prone to explicit tax evasion than men.
  • EC2: Women are generally more likely to commit unconscious (implicit) tax evasion than men.
  • EC3: People with only an elementary education are significantly more prone to tax evasion (explicit + implicit) than people with a secondary education.
  • EC4: People with elementary education are significantly more prone to tax evasion (explicit + implicit) than people with a university degree.
  • EC5: The tax ethics of the younger generation are worse than the tax ethics of the older generation (tested by: more young people state they would do tax evasion if they had the opportunity than the middle-aged generation).
  • EC6: The 60+ age group is less prone to tax evasion (explicit + implicit) than the 31–60 age group.
  • EC7: The 60+ age group is less prone to tax evasion (explicit + implicit) than the 18–30 age group.
  • EC8: The tax ethics of entrepreneurs are worse than the tax ethics of non-entrepreneurs.
  • EC9: Students’ tax ethics are worse than employees’ tax ethics.
  • EC10: Students’ tax ethics are worse than the tax ethics of entrepreneurs.
  • EC11: Tax ethics of pensioners are better than students’ tax ethics.
  • EC12: Tax ethics of pensioners are better than other people’s tax ethics.
  • EC13: The tax ethics of the experienced are better than the tax ethics of the inexperienced.
  • EC14: Explicit inclination to tax evasion is higher in experienced people compared to inexperienced people.
Table 4 shows the results of the hypotheses EC1–EC14. Based on the results, we can conclude that all hypotheses except for hypothesis EC5 were confirmed.

3.2.3. Fulfilment of Tax Obligations

In addition to the tax ethics themselves, we also investigated the fulfilment of tax obligations across the population and tested the following hypothesis: “A statistically significant percentage of respondents fulfil their tax obligations voluntarily. (T1)” Based on the results in Table 5, this hypothesis has been confirmed, i.e., taxpayers in Slovakia fulfil their tax obligations voluntarily (and not because they have to).
In addition, we tested the influence of socio-demographic factors on the fulfilment of tax obligations and defined the following hypotheses:
  • O1: There is a statistical difference of fulfilment of tax obligations with regard to sex.
  • O2: There is a statistical difference of fulfilment of tax obligations with regard to age.
  • O3: There is a statistical difference of fulfilment of tax obligations with regard to education.
  • O4: There is a statistical difference of fulfilment of tax obligations with regard to the main source of income.
The results in Table 6 show that all the hypotheses O1–O4 were confirmed, i.e., the attitude towards tax obligations depends on sex, age, education and source of income. Due to small sample sizes of some categories in our tables, we used Fisher exact test [43] instead of Chi-square test. As in O2–O4, the p-value was very small, and due to calculation problems we used simulated p-values limited by a value of 10−6.
Finally, based on the results of hypotheses O1–O4, we tested the following one-tailed hypotheses:
  • OC1: Women are more likely to be taxed voluntarily than men.
  • OC2: The seniors are more likely to be taxed voluntarily than the middle generation group.
  • OC3: The seniors are more likely to be taxed voluntarily than the young generation.
  • OC4: Secondary-educated people are more likely to be taxed voluntarily than people with elementary education.
As can be seen from Table 7, results confirmed that women are more likely to pay taxes voluntarily than men. Additionally, seniors are more likely to be taxed voluntarily than the middle and young generations. We also found out that the attitude to willingly pay taxes is not lower for people with higher education compared to people with elementary education.

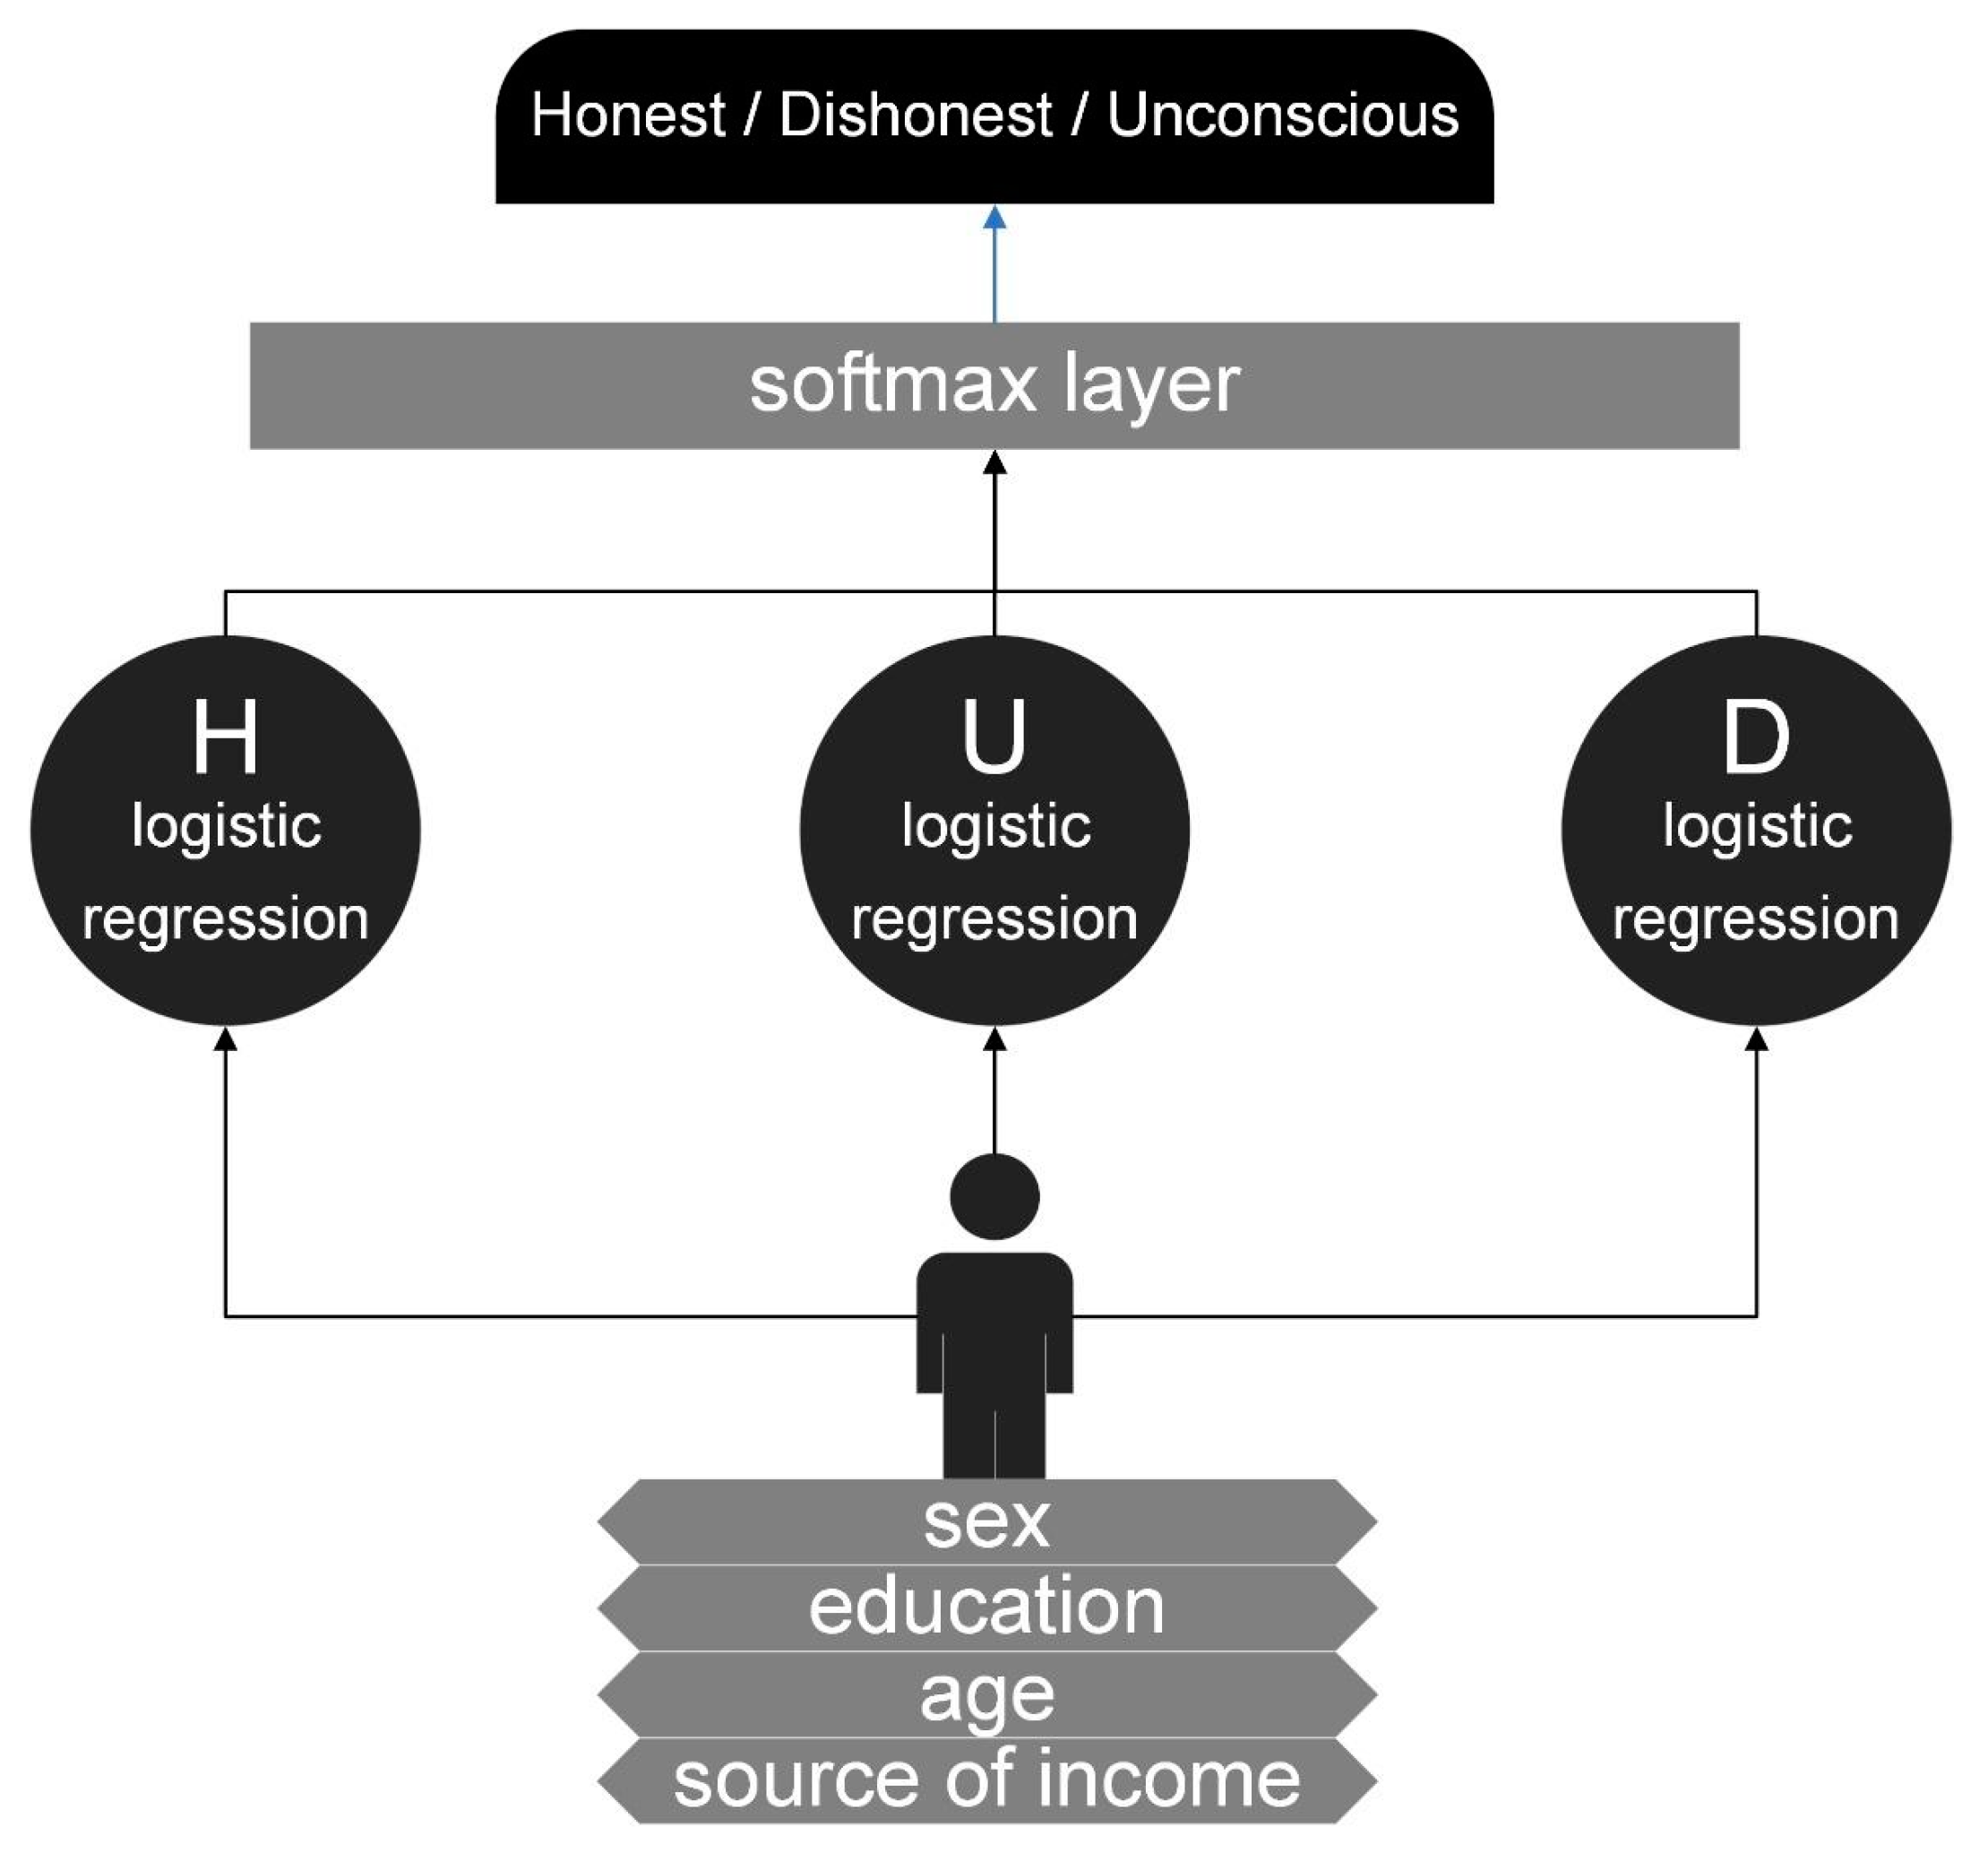
3.3. Logistic Regression Models

Hypotheses testing confirmed that tax ethics depend on sex, education, age and source of income. For this reason, we decided to construct statistical models for predicting the behaviour related to tax ethics. Only the socio-demographic characteristics (sex, education, age and main source of income) of the individual were chosen as relevant determinants for the estimation of behaviour of tax ethics.
A method known as logistic regression was chosen to estimate an individual’s behaviour. We constructed three types of logistic regression models: H-model, U-model and D-model. The H-model predicted whether the individual is honest, the U-model predicted whether the individual is implicitly (unconsciously) dishonest, and the D-model predicted whether the individual is explicitly dishonest. The dependent variables were the adequate type of category of tax inclination. Only the four socio-demographic characteristics were chosen as potential determinants (i.e., independent variables).
The models were quantified on a training set that was a subset of the total sample. The training set was created as a random selection of 80% of the observations from the total sample. Random selection was performed in R with the caTools library. Before the random selection procedure, the seed was set to 1.

3.3.1. Statistical Significance

At first, we estimated four simple logistic regression models with a single regressor for each type of behaviour (Honest, Unconscious, Dishonest). We started with the sex variable, the second model included the independent variable of age group, the third model included the regressor of the education group and the fourth model contained the main source of income group. All of these independent variables were factor variables with age group and education group categorised as ordered factors.
The reason for conducting this modelling procedure was to analyse the statistical significance of the influence of these socio-demographic determinants on the dependent variable (type of behaviour regarding inclination to tax evasion). Please note, that the aim of these simple logistic regression models was not to achieve the highest possible accuracy. We wanted to find out if the determinant was statistically significant in predicting the type of tax behaviour. The results of the statistical significance of parameters of the three simple models is stated in Table 8.
As can be seen in Table 8, the gender variable proved to be statistically significant in all three types of logistic regression. The age group variable proved to be strongly statistically significant (p-value < 0.001) in the H-model and D-model. In the U-model, this variable was only weakly statistically significant (p-value < 0.10). The education variable was strongly statistically significant both in the case of the H-model (p-value < 0.01). In the D-model, this variable was significant only at the alpha = 0.05 level, and in the U-model, this variable was not significant at all. Finally, the categorical nominal variable source of income was strongly statistically significant in all three models. For the H-model and D-model, this variable was significant at the alpha = 0.001 level, and for the U-model it was significant at the alpha = 0.01 level. In the case of the H-model, it turned out that it is crucial whether it is a pensioner. In the case of the U-model, it was shown that it is essential whether it is an entrepreneur, and in the case of the D-model, it was shown to be essential whether it is a case of both mentioned groups.

3.3.2. Backward Regression

Except for simple logistic models with only one independent variable, we also constructed multivariable logistic regression models. The input set of independent variables for these models was the set of all four independent variables (sex, age group, education group, source of income group). We used a backward stepwise regression method with minimising the AIC criterion to get the final models.
As stated above, the models were quantified on a training set. The training set was created as a random selection of 80% of the observations from the total sample. To evaluate the accuracy for all three models, the threshold value was set to a value of the mean probability distribution on a train set. For higher plausibility, the results were validated on a test set (ex-post predictions), which accounted for 20% of the original data set (214 observations). Table 9 lists the output of three multivariable logistic regression models from the backward regression. The train and test accuracies of these models are given in Table 9 as well.
Based on the results from Table 9, we can evaluate if the particular determinant was statistically significant in predicting the type of tax behaviour, and if so, how large the influence was.
The multivariable mH-model, which predicted honest behaviour in tax matters, included the variables age and education based on optimization according to backward regression and Akaike’s Information Criterion. Both variables (age and education) were strongly statistically significant (p-value < 0.001). This means that age and education are key factors in predicting whether someone will behave honestly. Since in both cases it was a categorical ordinal variable with three levels, R fitted two polynomial functions (linear and quadratic) to the levels of the variables. Since AgeGroup.L was strongly statistically significant (p-value < 0.001), this indicates a linear increase in logit between age levels. In the case of education, linear growth (p-value < 0.001) and quadratic growth (p-value < 0.01) were strongly statistically significant. These variables, associated with categorical ordinal variables, are new variables. They were created by R software because of their linear independence. For that reason, we decided not to interpret these ordinal categorical variables.
The multivariate mU-model, which was used to predict implicitly dishonest behaviour based on optimization according to backward regression and Akaike’s Information Criterion, included the variables: male, age group and source of income group. The male variable was statistically significant at the alpha = 0.001 level. Based on male coefficient of the U-model from Table 9, we can state that if it is a man, it will result in a 0.4890 decrease in logit(p). If logit(p) decreases by 0.4890, it means that p/(1-p) decreases by exp(−0.4890) = 0.6132. That is a 39% reduction in the odds of being categorised as unconscious in tax behaviour. The age variable was statistically significant at the alpha = 0.01 level. AgeGroup.Q was highly statistically significant (p-value < 0.01). The given variable indicates the quadratic decrease in logit between age levels. The categorical nominal variable source of income was statistically significant (p-value < 0.05) for two classes: student and entrepreneur. The stated output can be interpreted as follows: if it is an entrepreneur, it will result in a 0.5398 decrease in logit(p); if logit(p) decreases by 0.5398, it means that p/(1-p) decreases by exp(−0.5398) = 0.5827. That is a 42% reduction in the odds of being categorised as unconscious in tax behaviour. This is consistent with the fact that entrepreneurs have relatively high experience with tax issues, and therefore the probability that this group will be categorised as unconscious is lower. As for the variable SOI_student, this can be interpreted in the mU-model as follows: if it is a student, there is a 124% increase in the odds of being categorised as unconscious in tax behaviour. Again, this is consistent with the fact that students do not yet have much information with tax issues, and therefore it is more likely that this group will be categorised as unconscious in tax behaviour.
In the multivariate mD-model, the male variable was statistically significant (p-value < 0.001). Based on the calculated coefficient, we can claim that if it is a man, there is a 91% increase in the odds of being categorised as dishonest in tax behaviour. The age variable was not statistically significant in either the linear function or the quadratic function. EducationGroup.L was statistically significant (p-value < 0.05), indicating a linear downward trend in logit between education levels. As for the categorical variable source of income, two income groups were statistically significant. If it is an entrepreneur, there is a 120% increase in the odds of being categorised as dishonest in tax behaviour. In the case of a pensioner, there is a 52% reduction in the odds of being categorised as dishonest in tax behaviour.
Looking at the value of AIC (Akaike’s Information Criterion), which represents the value of the penalty function, we see that the value of AIC is the lowest in the case of the H-model. On the contrary, the highest value is for the U-model. From this point of view, it can be concluded that the H-model was the best model.
As we can see in Table 9, the models do not achieve very high accuracy. This is especially true for the U-model and D-model, where the accuracy on the training set was below 63%. On the contrary, the H-model achieved a relatively solid accuracy (74%) on the training set. Moreover, in the case of the H-model, the accuracy was relatively good even on the test set. The above indicates that age and education are key and decisive determinants in predicting whether a person will be honest in tax matters.
The lower accuracy of the U-model and the D-model can be caused by not including other, essential determinants in the model for predicting behaviour in tax matters. Obviously, the inclination to tax evasion and the tax morale of an individual does not depend only on sex, education, age and source of income. There are other relevant factors as well. For example, it is possible that experience with tax matters also has an effect on whether a person will behave implicitly dishonestly in tax matters. Explicit dishonesty can be influenced by the environment, level of income or other determinants. However, as we included only four independent variables in our input variables set, the lower accuracy is not surprising. Nevertheless, the main contribution of the statistical modelling procedure is the fact that the four examined independent variables proved to be statistically significant. They are, therefore, relevant for predicting the inclination to tax evasion. For higher accuracy of the prediction of the inclination to tax evasion, the model should be supplemented with other relevant determinants.
Finally, these three models could be combined into one comprehensive model for categorising citizens’ tax behaviour as shown in Figure 3. This model would use three sub-models (mH-model, mU-model, mD-model), while sub-models would produce probabilities as an output. Based on the highest probability from the aforementioned classes, the resulting prediction would be categorised, i.e., we would predict the tax behaviour into three categories (honest, implicitly dishonest, explicitly dishonest).

4. Discussion

We found out that the tax ethics in Slovakia are low, and are not in accordance with applicable law. Inglehart [44] and McGee [11] found that in Slovakia, the acceptance of tax evasion in 2004 was one of the lowest in transitional economies, which means that the acceptance of tax evasion in society increased significantly over the course of 15 years. Such a situation certainly negatively affects the efficiency of tax collection, and thus the efficiency of the entire tax system. There is a space for the government to start addressing the tax ethics of the population. Harju et al. [45] found out that enforcement improvements and information about them can influence taxpayers’ behaviour. A positive finding is that a large part of them is unaware that their behaviour violates, or would violate, tax laws. Goksu and Sahpaz [21] focused on the relationship between tax education and tax morale and found that such education has a positive effect on students’ level of tax morale. Perhaps it is education and enlightenment aimed at a group of inhabitants who make tax evasions subconsciously that could change their tax behaviour and thus the tax ethics of the society.
Results also show that inclination to tax evasion depends on socio-demographic characteristics. In terms of sex, we found that men are more prone to tax evasion than women. The result correlates with the often-presented view that men are more prone to take risks than women [46]. However, from the point of view of the acceptance of tax evasion, there are studies that confirm this [8,9,11,47,48,49,50], but also refute our findings [49,51,52]. However, we have also found that women are more likely to do unintentional tax evasion than men, which means that women have a greater potential to improve tax behaviour and improve tax ethics than men.
Another important factor influencing the tax morale of the population is education. It has been assumed that educated people have higher tax morale than those with lower education [9,53]. In our research, we found that the population with elementary education is significantly more prone to tax evasion than the population with secondary or higher education. This finding can be linked with Blesse study [16], which confirmed that information about tax uncertainty makes evasion more justifiable.
We also found that age affects people’s tax morale. Although it has not been confirmed that the tax ethics of the younger generation are worse than the tax ethics of the older generation, we found that the oldest age group (people over 60 years of age) has a significantly lower tendency to tax evasion than younger age groups. This finding corresponds with the research of Ciziceno and Pizzuto [8], McGee [11], Torgler [14], Hug & Sporri [54], Lago-Peñas & Lago-Peñas [37], Cyan et al. [9] who also found that older people do less tax evasion or accept less tax evasion, and thus have better tax morale. There are several reasons for this significantly more honest tax behaviour in our research. At first, this group is part of a population that has spent the most active years of its life in another socio-economic establishment, where it has not had the opportunity to conduct tax evasion. On the other hand, the older people are, the more opportunity and temptation they have to do tax evasion. Nevertheless, this age group shows the lowest inclination for conscious tax evasion. This may be because its attitudes were formed in the more modest conditions of post-war society, so its priorities and values are different from the current middle or young generation growing up under the influence of consumption.
The tax ethics of entrepreneurs is worse than the tax ethics of non-entrepreneurs. Entrepreneurs can, to a much greater extent than other income groups, directly influence their own tax obligations, or the tax obligations of the companies they manage or own, even in violation of the applicable law. While other income groups usually do not have the opportunity to influence their tax burden on excise duties, value-added tax, or even income tax, entrepreneurs do. Easy access to the possibility of conducting tax evasion is probably in conjunction with their tax ethics, the most important factor influencing their tax behaviour. At the same time, we assume that this income group understands the issue of taxes the most, as the implicit question in the analysis of data was that their knowledge of taxes is significantly higher than that of non-entrepreneurs. Therefore, they know how to better respond to the tax situation and decide in accordance with their personal attitudes. Education will not be enough to improve their tax ethics, but if the tax ethics of other income groups of the company were significantly improved, it could also put pressure on a change in the tax behaviour of entrepreneurs. Students were confirmed to have a worse tax ethic than employees or retirees. The poor tax ethics of students were also confirmed in their research by Batrancea et al. [55] and Eicher et al. [56]. Considering that students are a group that has no life or tax experience and is still only looking for patterns for future behaviour, education and training can improve their current tax ethics. For this reason, it is necessary to pay attention to this group and to influence its tax behaviour in a targeted way because its behaviour will shape and significantly affect the tax ethics of society. The best tax ethics were confirmed for pensioners, which also corresponds to our finding that residents older than 60 years of age are significantly less prone to tax evasion than younger age groups. The findings are also in line with the research of Torgler [14] and Hug and Sporri [54], who found that retirees show higher tax morale compared to employees and that entrepreneurs have low tax morale.
Finally, we dealt with the comparison of tax morale of people who have never come into direct contact with tax issues or tax control or did not perform professional activities for themselves or other entities related to the calculation of tax liability (inexperienced) and those who have such experience. We have found that the tax ethics of the experienced are better than the tax ethics of the inexperienced, which is also in line with the Batrancea et al. [55] study, who compared students (who could be considered as inexperienced) and entrepreneurs (experienced). We also found that among the experienced, there is a higher percentage of those who consciously choose tax evasion and a smaller percentage of those who subconsciously choose tax evasion than the inexperienced. These findings prove that unconscious tax evasion is chosen mainly because of ignorance, and it is education and improving knowledge in the field of taxation that can improve the tax ethics of society.
There are several subjects that can benefit from our research. First, it is the government and the state. From our research, it was found that apart from people who commit tax evasion knowingly, there is a large group of people who commit tax evasion unknowingly. This group of people is the first way to increase tax collection in Slovakia. A key element of tax collection is the lack of information for this group. It is education that could have a positive effect on the amount of information regarding taxes and reduce wrong behaviour. Moreover, since the tax ethics of the experienced are better than those of the inexperienced, the government could also positively influence this factor through education to improve the tax ethics of society. In terms of the future, it is best to reach the younger generation. For this reason, it would be appropriate if the government implemented tax literacy courses for children in primary and secondary schools. We believe that based on our findings, these suggestions could have a positive impact on tax ethics in Slovakia. From the point of view of the adult population, greater awareness of these issues could be gained, for example, by advertising spots in the media or a direct letter campaign. The mentioned proposals should be financed by the government. Even a small percentage of people who would improve their tax ethics thanks to this campaign could have a very positive effect on tax collection and obtain more money for the state budget. In the second step, the state should focus on people who knowingly commit fraud.
The use of our conclusions for managers of commercial companies is also related to the stated findings. If the state decides to reduce tax evasion through education and a directly targeted campaign, we recommend that managers of marketing agencies implement this through specialised campaigns. It was confirmed that tax ethics depends on gender, age, education, experience and source of income. All these factors are decisive when dealing with tax issues and influence whether a person commits tax evasion. It therefore follows from the above that all these factors should play a role in increasing the efficiency of tax collection in Slovakia. We therefore consider it important that awareness campaigns regarding tax ethics are focused to a specific group of the population for the highest possible level of effectiveness (e.g., men, less educated people, entrepreneurs, younger people). The task of the marketing agency will thus be to influence people to change their behaviour in tax ethics. It is important to remember that it is significantly difficult to change people’s habits after a very long time. Moreover, manipulation is not morally right. In case of the implementation of this campaign, we recommend managers focus on a positive approach, i.e., rewarding and not a negative one (punishment). In addition, we recommend using the nudge theory from behavioural economics, which positively motivates people to the desired result without penalty or the necessity of a certain choice.
The findings of our research may also be beneficial for academics. The results we achieved could be used for further research, which could be directed only at a specific group of people who have a negative relationship to tax ethics. For example, research could be carried out on how to increase the tax ethics of men, less educated people, entrepreneurs, or the younger generation. The discovery that there is a group of people who commit tax evasion unconsciously also brought interesting knowledge for academics. It is this group that could be of interest for further research.
Last but not least, it is society that can benefit from the findings of our research. It is the social acceptance of tax evasion that makes this phenomenon a societal problem. If the company does not accept such an action, we could increase the collection of taxes to the state budget. Each individual can positively influence their surroundings by their actions, and thus increase tax ethics in the country.

5. Conclusions

The aim of the research was to find out what the tax ethics in the Slovak Republic are. We defined tax ethics as the taxpayer’s inclination to tax evasion. Based on the questions from the survey related to experience with taxes, past tax evasion, explicit tendency and implicit tendency to tax evasion, respondents were categorised into three groups: honest, dishonest, and unconscious.
Results show that tax ethics in the Slovak Republic are low. A significant percentage of the Slovak population tends to participate in tax evasion. This means that they either committed a tax evasion, would do it knowingly if they had the opportunity or would choose it unknowingly in resolving a tax situation. The results correlate with the international comparison of Slovakia and the size of its tax gap on value-added tax, in recent years. In addition, hypotheses about the influence of sex, education, age and the main source of income on tax evasion were confirmed as relevant factors influencing the tax ethics of the population. The negative findings can be mitigated by the positive information that a statistically significant percentage of the Slovak population is not aware that their behaviour would violate tax law.
The main contribution, but at the same time, limitation of the research, is a new approach to defining taxpayers’ level of tax ethics. Due to this, we are not able to compare these results with other studies based on WVS. Moreover, we only analysed the influence of socio-demographic characteristics. It is therefore no surprise that our prediction models based on logistic regression did not achieve high accuracy. We realise that tax ethics can be affected by many other factors such as culture, habits, trust in the state institutions, experiences, level of income, etc. We believe that if we added other relevant factors to our prediction models, the accuracy would be higher. However, the focus of this research was the analysis of the defined four socio-demographics determinants. In the future, other relevant factors could be subjected to investigation. In addition, another limitation is the evaluation of our prediction models. As for the multivariable logistic regression models, some variables were not significant. It could be a problem; however, we optimised our models using a backward regression approach based on Akaike’s information criteria and not on statistical significance. In addition, the statistical significance is secondary in the case of accuracy assessment. Finally, a limitation also applies to the generalisation of our results to other countries. Since each country is different, both in terms culture and history, it is not possible to guarantee that similar results would be achieved in other countries of the world. It can be assumed that countries similar to Slovakia in culture and history, such as the Czech Republic or Poland, could have comparable results in tax ethics. However, this is a question for further research.
We believe there is the potential to change tax ethics, and thus the entire society towards compliance with applicable law. Therefore, further research could be focused on the research question: What kind of tools should be used to improve tax ethics? We assume that by implementing proposals to improve tax ethics, we will be able to implicitly test the hypothesis that there is an impact of tax ethics on the tax gap and on the efficiency of the tax system, i.e., that the targeted formation of tax ethics can lower the existing tax gap and make the tax system more effective.

Author Contributions

Conceptualization, B.H., L.F., E.M. and L.P.; methodology, L.F. and L.P.; software, L.F.; validation, L.F. and B.H.; formal analysis, B.H.; investigation, B.H., E.M. and L.F.; resources, E.M. and B.H.; data curation, L.F.; writing, B.H., E.M. and L.F.; writing—review and editing, B.H., L.F. and E.M.; visualization, E.M. and L.F.; supervision, B.H.; funding acquisition, E.M. All authors have read and agreed to the published version of the manuscript.

Funding

This research was funded by VEGA: VEGA 1/0273/22 Resource efficiency and value creation for economic entities in the sharing economy and Grant System of University of Zilina No. 13860/2021.

Data Availability Statement

The data presented in this study are available on request from the corresponding author.

Conflicts of Interest

The authors declare no conflict of interest. The authors have no relevant financial or non-financial interests to disclose.

References

  1. European Commission. The Concept of Tax Gaps Report on VAT Gap Estimations by FISCALIS Tax Gap Project Group (FPG/041). 2016. Available online: https://taxation-customs.ec.europa.eu/system/files/2016-09/tgpg_report_en.pdf (accessed on 1 January 2021).
  2. Bánociová, A.; Vravec, J. Analysis of efficiency of VAT collection in Slovakia. Ved. Časopis Finanč. Trhy 2015, 4, 1–10. [Google Scholar]
  3. Bhuiyan, M.Z. Tax evasion and avoidance practices in some selected corporate firms of Bangladesh. World J. Soc. Sci. 2012, 2, 150–156. [Google Scholar]
  4. Durán-Cabré, J.M.; Moré, A.E.; Mas-Montserrat, M.; Salvadori, L. The tax gap as a public management instrument: Application to wealth taxes. Appl. Econ. Anal. 2019, 27, 207–225. [Google Scholar] [CrossRef]
  5. Alm, J.; Martinez-Vazquez, J.; McClellan, C. Corruption and firm tax evasion. J. Econ. Behav. Organ. 2016, 124, 146–163. [Google Scholar] [CrossRef]
  6. Center for Social and Economic Research Study and Reports on the VAT Gap in the EU-28 Member States. Final Report 2019. 2019. Available online: https://ec.europa.eu/taxation_customs/sites/taxation/files/vat-gap-full-report-2019_en.pdf (accessed on 1 January 2021).
  7. Belmonte, A.; Dell’Anno, R.; Teobaldell, D. Tax morale, aversion to ethnic diversity, and decentralization. Eur. J. Polit. Econ. 2018, 55, 204–223. [Google Scholar] [CrossRef]
  8. Ciziceno, M.; Pizzuto, P. Life satisfaction and tax morale: The role of trust in government and cultural orientation. J. Behav. Exp. Econ. 2022, 97, 101824. [Google Scholar] [CrossRef]
  9. Cyan, M.R.; Koumpias, A.M.; Martinez-Vazquez, J. The determinants of tax morale in Pakistan. J. Asian Econ. 2016, 47, 23–34. [Google Scholar] [CrossRef]
  10. McGee, R.W.; Petrides, Y.; Zhou, J. Attitude toward tax evasion in Brazil, Russia, India and China (BRIC). Philos. Econ. Law Rev. 2022, 2, 70–84. [Google Scholar]
  11. McGee, W.R. Cheating on taxes: A comparative study of tax evasion ethics of 15 transition economies and 2 developed economies. In Proceedings of the IABPAD Conference Proceedings, Dallas, TX, USA, 24–27 April 2008; pp. 84–98. [Google Scholar]
  12. Nemore, F.; Morone, A. Public spirit on immigration issues and tax morale in Italy: An empirical investigation. J. Behav. Exp. Econ. 2019, 81, 11–18. [Google Scholar] [CrossRef]
  13. Luttmer, E.F.P.; Singhal, M. Tax morale. J. Econ. Perspect. 2014, 28, 149–168. [Google Scholar] [CrossRef]
  14. Torgler, B. Tax morale in Asian countries. J. Asian Econ. 2004, 15, 237–266. [Google Scholar] [CrossRef]
  15. Dell’Anno, R. Tax evasion, tax morale and policy maker’s effectiveness. J. Socio-Econ. 2009, 38, 988–997. [Google Scholar] [CrossRef]
  16. Blesse, S. Do your tax problems make tax evasion seem more justifiable? Evidence from a survey experiment. Eur. J. Political Econ. 2023, in press. [Google Scholar] [CrossRef]
  17. Alm, J.; Torgler, B. Culture differences and tax morale in the United States and in Europe. J. Econ. Psych. 2006, 27, 224–246. [Google Scholar] [CrossRef]
  18. Rodriguez-Justicia, D.; Theilen, B. Education and tax morale. J. Econ. Psychol. 2018, 64, 18–48. [Google Scholar] [CrossRef]
  19. Ferrer-i-Carbonell, A.; Gërxhani, K. Tax evasion and well-being: A study of the social and institutional context in Central and Eastern Europe. Eur. J. Political Econ. 2016, 45, 149–159. [Google Scholar] [CrossRef]
  20. Bilgin, C. Determinants of Tax Morale in Spain and Turkey: An Empirical Analysis. Eur. J. Gov. Econ. 2014, 3, 60–74. [Google Scholar] [CrossRef]
  21. Goksu, G.G.; Sahpaz, K.I. Comparison of Tax Morale of Turkish and Spanish Higher Education Students: The Samples of Sakarya University and the University of Zaragoza. Procedia Soc. Behav. Sci. 2015, 186, 222–230. [Google Scholar] [CrossRef]
  22. Torgler, B. The importance of faith: Tax morale and religiosity. J. Econ. Behav. Organ. 2006, 61, 81–109. [Google Scholar] [CrossRef]
  23. Daude, C.; Melguizo, Á. Taxation and More Representation?: On Fiscal Policy, Social Mobility and Democracy in Latin America. In OECD Development Centre Working Papers; No. 294; OECD Publishing: Paris, France, 2010. [Google Scholar] [CrossRef]
  24. Sezgin, S.; Yildiz, S.; Ayyildiz, Y. The Ethics of Tax Evasion: A Comparative Study of Turkey and Kyrgyzystan. J. Appl. Bus. Econ. 2011, 12, 75–90. [Google Scholar]
  25. Torgler, B.; Schneider, F. The Impact of Tax Morale and Institutional Quality on the Shadow Economy. J. Econ. Psychol. 2009, 30, 228–245. [Google Scholar] [CrossRef]
  26. Bruno, R.L. Tax enforcement, tax compliance and tax morale in transition economies: A theoretical model. Eur. J. Polit. Econ. 2019, 56, 193–211. [Google Scholar] [CrossRef]
  27. Pappa, E.; Sajedi, R.; Vella, E. Fiscal consolidation with tax evasion and corruption. J. Int. Econ. 2015, 96, 56–75. [Google Scholar] [CrossRef]
  28. Durisova, M.; Tokarcikova, E.; Virlanuta, F.O.; Chodasova, Z. The Corporate Performance Measurement and Its Importance for the Pricing in a Transport Enterprise. Sustainability 2020, 11, 6164. [Google Scholar] [CrossRef]
  29. Potkany, M.; Hlatka, M.; Debnar, M.; Hanzl, J. Comparasion of the Lifecycle Cost Structure of Electric and Diesel Buses. Nase More 2018, 65, 270–275. [Google Scholar] [CrossRef]
  30. Hitka, M.; Lorincova, S.; Vetrakova, M.; Hajduchova, I.; Antalik, I. Factors related to gender and education affecting the employee motivation. Entrep. Sustain. 2020, 7, 3229–3241. [Google Scholar] [CrossRef]
  31. Makovicky, N.; Smith, R. Tax Beyond Social Contract. Soc. Anal. 2020, 64, 1–17. [Google Scholar] [CrossRef]
  32. Dou, G.; Cao, K. A joint analysis of environmental and economic performance of closed-loop chains under carbon tax regulation. Comput. Ind. Eng. 2020, 146, 106624. [Google Scholar] [CrossRef]
  33. Bejakovic, P.; Bezeredi, S. Determination of Tax Morle in Croatia: An Ordered Logit Model. Bus. Syst. Res. J. 2019, 10, 37–48. [Google Scholar] [CrossRef]
  34. Socoliuc, M.; Grosu, V.; Hlaciuc, E.; Stansiu, S. Analysis of Social Responsibility and Reporting Methods of Romanian Companies in the Countries of the European Union. Sustainability 2018, 10, 4662. [Google Scholar] [CrossRef]
  35. Van de Vijver, A.; Cassimon, D.; Engelen, P.J. A real Option Approach to Sustainable Corporate Tax Behaviour. Sustainability 2020, 12, 5406. [Google Scholar] [CrossRef]
  36. Grundmann, S.; Lambsdorff, J.G. How income and tax rates provoke cheating—An experimental investigation of tax morale. J. Econ. Psychol. 2017, 63, 27–42. [Google Scholar] [CrossRef]
  37. Lago-Peñas, I.; Lago-Peñas, S. The determinants of tax morale in comparative perspective: Evidence from European countries. Eur. J. Political Econ. 2010, 26, 441–453. [Google Scholar] [CrossRef]
  38. Torgler, B.; Demir, I.C.; Macintyre, A.; Schaffner, M. Causes and Consequences of Tax Morale: An Empirical Investigation. Econ. Anal. Policy 2008, 38, 313–339. [Google Scholar] [CrossRef]
  39. Kountouris, Y.; Remoundou, K. Is there a cultural component in tax morale? Evidence from immigrants in Europe. J. Econ. Behav. Organ. 2013, 96, 104–119. [Google Scholar] [CrossRef]
  40. Statistical Office of the Slovak Republic. Official Website of the Statistical Office of the Slovak Republic. 2017. Available online: https://statistics.sk (accessed on 1 January 2021).
  41. Slovak Business Agency. Analýzy a Prieskumy Podnikateľského Prostredia [Analysis and Surveys of the Enterprise Environment in Slovakia]. 2017. Available online: http://www.sbagency.sk/analyzy-a-prieskumy-podnikatelskeho-prostredia (accessed on 1 January 2021).
  42. Pearson, K. On the criterion that a given system of deviations from the probable in the case of a correlated system of variables is such that it can be reasonably supposed to have arisen from random sampling. Philos. Mag. 1900, 50, 157–175. [Google Scholar] [CrossRef]
  43. Fisher, R.A. On the interpretation of χ2 from contingency tables, and the calculation of P. J. R. Stat. Soc. 1922, 85, 87–94. [Google Scholar] [CrossRef]
  44. Inglehart, R.; Basanez, M.; Diez-Medrano, J.; Halman, L.; Luijkx, R. Human Beliefs and Values: A Cross-Cultural Sourcebook Based on the 1999–2002 Values Surveys; Siglo XXI Editores: Mexico City, Mexico, 2004. [Google Scholar]
  45. Harju, J.; Kosonen, T.; Slemrod, J. Missing miles: Evasion responses to car taxes. J. Public Econ. 2020, 181, 104108. [Google Scholar] [CrossRef]
  46. Harris, C.H.; Jenkins, M. Gender Differences in Risk Assessment: Why do Women Take Fewer Risks than Men? Judgm. Decis. Mak. 2006, 1, 48–63. [Google Scholar] [CrossRef]
  47. Alm, J.; Torgler, B. Estimating the Determinants of Tax Morale. National Tax Association—Tax Institute of America. Proc. Annu. Meet. 2004, 97, 269–274. [Google Scholar]
  48. McGee, W.R.; Smith, S.R. The Ethics of Tax Evasion: An Empirical Study of Utah Opinion; Andreas School of Business Working Paper; Barry University: Miami Shores, FL, USA, 2006. [Google Scholar]
  49. McGee, W.R.; Tusan, R. The Ethics of Tax Evasion: A survey of Slovak Opinion; Andreas School of Business Working Paper; Barry University: Miami Shores, FL, USA, 2006. [Google Scholar]
  50. Torgler, B.; Valev, N.T. Gender and Public Attitudes toward Corruption and Tax Evasion. Contemp. Econ. Policy 2010, 28, 554–568. [Google Scholar] [CrossRef]
  51. McGee, R.W. The Ethics of Tax Evasion: A Survey of International Business Academics. In Proceedings of the 60th International Atlantic Economic Conference, New York, NY, USA, 6–9 October 2005. [Google Scholar]
  52. Nasadyuk, I.; McGee, R.W. The ethics of tax evasion: An empirical study of business and economics student opinion in Ukraine. In Taxation and Public Finance in Transition and Developing Economies; Andreas School of Business Working Paper; Barry University: Miami Shores, FL, USA, 2006. [Google Scholar]
  53. McGee, W.R.; Tyler, M. Tax Evasion and Ethics: A Comparative Study of 33 Countries. Proc. Int. Acad. Bus. Public Adm. Discip. 2007, 4, 709–729. [Google Scholar]
  54. Hug, S.; Spörri, F. Referendums, trust, and tax evasion. Eur. J. Political Econ. 2011, 27, 120–131. [Google Scholar] [CrossRef]
  55. Batrancea, L.M.; Kudla, J.; Blaszczak, B.; Kopyt, M. Differences in tax evasion attitudes between students and entrepreneurs under the slippery slope framework. J. Econ. Behav. Organ. 2022, 200, 464–482. [Google Scholar] [CrossRef]
  56. Eicher, J.D.; Stuhldreher, T.J.; Stuhldreher, W.L. Taxes and Ethics: Taxpayer Attitudes over Time. J. Tax Pract. Proced. 2007, 9, 29–37. [Google Scholar]
Figure 1. Categorization of respondents into groups according to their inclination to tax evasion.
Mathematics 11 02341 g001
Figure 2. The inclination of the Slovak’s population to tax evasion.
Mathematics 11 02341 g002
Figure 3. Designed combined logistic regression model.
Mathematics 11 02341 g003
Table 1. Final relative quotas for the sample N = 1067 for the structure of the population of the Slovak Republic.
SexEducationEmployeeEntrepreneurUnemployedRetiredStudent
MaleBasic1.12%0.47%0.66%0.94%0.56%
Secondary21.09%7.31%2.25%6.75%0.66%
High5.44%1.50%0.28%3.00%0.47%
FemaleBasic1.03%0.09%0.56%1.50%0.56%
Secondary15.00%3.00%2.06%10.22%0.94%
High6.28%0.66%0.47%4.50%0.66%
Table 2. Performed statistical tests of main hypotheses.
Chi-Square TestBinomial Test
HypothesisStatistics (p-Value)Effect Size (Cramer V)Statistics (p-Value)
H11365.8 (<0.001)0.80000.7816 (<0.001)
H2263.1 (<0.001)0.35110.2212 (<0.001)
H3240.52 (<0.001)0.43450.3202 (<0.001)
H4583.86 (<0.001)0.52310.4311 (<0.001)
Table 3. The influence of socio-demographic characteristics on tax ethics.
Hypothesis
E1E2E3E4E5
Chi-square statistics38.02599.17724.143177.8998.158
p-value(<0.001)(<0.001)(<0.001)(<0.001)(<0.001)
Effect size (Cramer V)0.13350.15240.07520.16670.2145
Table 4. Statistical testing of hypotheses EC1–EC15.
HypothesisBinomial Test
EC1probability0.2643
p-value(<0.001)
EC2probability0.4813
p-value(<0.001)
EC3probability0.925
p-value(<0.001)
EC4probability0.925
p-value(<0.001)
EC5probability0.0576
p-value(0.7787)
EC6probability0.6198
p-value(<0.001)
EC7probability0.6198
p-value(<0.001)
EC8probability0.8849
p-value(<0.001)
EC9probability0.9756
p-value(0.0029)
EC10probability0.9756
p-value(0.0029)
EC11probability0.9756
p-value(<0.001)
EC12probability0.6063
p-value(<0.001)
EC13probability0.7466
p-value(0.0014)
EC14probability0.3836
p-value(0.0077)
Table 5. Statistical evaluation of hypothesis T1.
Chi-Square StatisticChi-Square p-ValueEffect Size (Cramer V)Binomial Test
251.93(<0.001)0.34440.2137 (<0.001)
Table 6. Chi-square tests for hypotheses O1–O4.
O1 (Sex)O2 (Age)O3 (Education)O4 (Income Source)
p-value(<0.001)(<0.001)(0.0134)(<0.001)
Table 7. One-tailed binomial tests for hypotheses OC1–OC4.
OC1probability0.2465
p-value(<0.001)
OC2probability0.3451
p-value(<0.001)
OC3probability0.3451
p-value(<0.001)
OC4probability0.1519
p-value(0.0883)
Table 8. Coefficients with statistical significance and their standard errors of estimated simple logistic regression models regressed on sex, age group, education group or source of income (SOI) group.
H-Logistic RegressionU-Logistic RegressionD-Logistic Regression
Variables(1)(2)(3)(4)(5)(6)(7)(8)(9)(10)(11)(12)
Constant−1.0986 ***
(0.1155)
−1.3856 ***
(0.0964)
−1.6006 ***
(0.1672)
−1.5157 ***
(0.1267)
−0.04001
(0.10002)
−0.3297 ***
(0.0717)
−0.2580 **
(0.0986)
−0.1710
(0.0977)
−1.0460 ***
(0.1140)
−0.6111 ***
(0.0759)
−0.5098 ***
(0.1004)
−0.5643 ***
(0.1013)
Male−0.3524 *
(0.1664)
−0.49799 ***
(0.13960)
0.8109 ***
(0.1481)
AgeGroup.L 1.2138 ***
(0.1811)
−0.1405
(0.1337)
−0.7617 ***
(0.1424)
AgeGroup.Q 0.1987
(0.1516)
−0.2110
(0.1139)
−0.0643
(0.1196)
Education.L 1.0721 **
(0.3475)
−0.1141
(0.2005)
−0.4651 *
(0.2042)
Education.Q −0.3894
(0.2167)
0.0681
(0.1344)
0.0767
(0.1372)
SOI_entrepreneur −0.5345
(0.3207)
−0.6431 **
(0.2253)
0.8827 ***
(0.2150)
SOI_unemployed −0.4504
(0.4230)
−0.2933
(0.2891)
0.5292
(0.2836)
SOI_pensioner 1.0771 ***
(0.1858)
−0.2125
(0.1669)
0.8056 **
(0.1937)
SOI_student −1.9500
(1.0221)
0.7307
(0.3748)
−0.1289
(0.3829)
AIC894.18837.87887.65844.341154.71162.11169.11158.31084.21084.21111.81067.7
p-value denoted as follows: *** p-value < 0.001, ** p-value < 0.01, * p-value < 0.05, p-value < 0.10.
Table 9. Coefficients with statistical significance and their standard errors of multivariable logistic regression models together with accuracies on the train and test set.
VariablesmH-ModelmU-ModelmD-Model
Constant−1.8165 ***
(0.1785)
−1.1304
(0.1517)
−0.7159 ***
(0.1784)
Male −0.4890 ***
(0.1456)
0.6449 ***
(0.1562)
AgeGroup.L1.2620 ***
(0.1833)
−0.4152
(0.2387)
−0.2389
(0.2438)
AgeGroup.Q0.2353
(0.1528)
−0.4060 **
(0.1547)
0.2217
(0.1612)
Education.L1.2147 ***
(0.3554)
−0.5092 *
(0.2185)
Education.Q−0.5925 **
(0.2238)
0.2572
(0.1493)
SOI_entrepreneur −0.5398 *
(0.2290)
0.7882 ***
(0.2208)
SOI_unemployed −0.3349
(0.2936)
0.4696
(0.2951)
SOI_pensioner 0.3393
(0.3132)
−0.7245 *
(0.3359)
SOI_student 0.8073 *
(0.3992)
−0.5394
(0.4193)
AIC (train) 824.981142.51043.5
Accuracy (train)0.74030.56520.6240
Accuracy (test)0.69160.53270.6075
p-value denoted as follows: *** p-value < 0.001, ** p-value < 0.01, * p-value < 0.05, p-value < 0.10.
Disclaimer/Publisher’s Note: The statements, opinions and data contained in all publications are solely those of the individual author(s) and contributor(s) and not of MDPI and/or the editor(s). MDPI and/or the editor(s) disclaim responsibility for any injury to people or property resulting from any ideas, methods, instructions or products referred to in the content.

